Embed Size (px)
Citation preview

Monetary Policy ReportApril 2019

Canada’s Inflation-Control Strategy1
Inflation targeting and the economy � The Bank’s mandate is to conduct monetary policy to promote
the economic and financial well-being of Canadians.
� Canada’s experience with inflation targeting since 1991 has shown that the best way to foster confidence in the value of money and to contribute to sustained economic growth, employment gains and improved living standards is by keeping inflation low, stable and predictable.
� In 2016, the Government and the Bank of Canada renewed Canada’s inflation-control target for a further five-year period, ending December 31, 2021. The target, as measured by the consumer price index (CPI), remains at the 2 per cent midpoint of the control range of 1 to 3 per cent.
The monetary policy instrument � The Bank carries out monetary policy through changes in the
target for the overnight rate of interest.2 These changes are transmitted to the economy through their influence on market interest rates, domestic asset prices and the exchange rate, which affect total demand for Canadian goods and services. The balance between this demand and the economy’s production capacity is, over time, the primary determinant of inflation pressures in the economy.
� Monetary policy actions take time—usually from six to eight quarters—to work their way through the economy and have their full effect on inflation. For this reason, monetary policy must be forward-looking.
� Consistent with its commitment to clear, transparent com-munications, the Bank regularly reports its perspective on the forces at work on the economy and their implications for inflation. The Monetary Policy Report is a key element of this approach. Policy decisions are typically announced on eight
pre-set days during the year, and full updates of the Bank’s outlook, including risks to the projection, are published four times per year in the Monetary Policy Report.
Inflation targeting is symmetric and flexible � Canada’s inflation-targeting approach is symmetric, which
means that the Bank is equally concerned about inflation rising above or falling below the 2 per cent target.
� Canada’s inflation-targeting framework is flexible. Typically, the Bank seeks to return inflation to target over a horizon of six to eight quarters. However, the most appropriate horizon for returning inflation to target will vary depending on the nature and persistence of the shocks buffeting the economy.
Monitoring inflation � In the short run, the prices of certain CPI components can be
particularly volatile. These components, as well as changes in indirect taxes such as GST, can cause sizable fluctuations in CPI.
� In setting monetary policy, the Bank seeks to look through such transitory movements in CPI inflation and focuses on a set of “core” inflation measures that better reflect the under-lying trend of inflation. In this sense, these measures act as an operational guide to help the Bank achieve the CPI inflation target. They are not a replacement for CPI inflation.
� The Bank’s three preferred measures of core inflation are CPI-trim, which excludes CPI components whose rates of change in a given month are the most extreme; CPI-median, which corresponds to the price change located at the 50th percentile (in terms of basket weight) of the distribution of price changes; and CPI-common, which uses a statistical procedure to track common price changes across categories in the CPI basket.
1 See Joint Statement of the Government of Canada and the Bank of Canada on the Renewal of the Inflation-Control Target (October 24, 2016) and Renewal of the Inflation-Control Target: Background Information—October 2016, which are both available on the Bank’s website.
2 When interest rates are at very low levels, the Bank has at its disposal a suite of extraordinary policy measures that could be used to provide additional monetary stimulus and/or improve credit market conditions. The Framework for Conducting Monetary Policy at Low Interest Rates, available on the Bank’s website, describes these measures and the principles guiding their use.
The Monetary Policy Report is available on the Bank of Canada’s website at bankofcanada.ca.
For further information, contact:
Public Information Communications Department Bank of Canada 234 Wellington Street Ottawa, Ontario K1A 0G9
Telephone: 613-782-8111; 1-800-303-1282 (toll-free in North America) Email: [email protected]; Website: bankofcanada.ca
ISSN 1201-8783 (Print) ISSN 1490-1234 (Online) © Bank of Canada 2019

Monetary Policy ReportApril 2019
This is a report of the Governing Council of the Bank of Canada:
Stephen S. Poloz, Carolyn A. Wilkins, Timothy Lane, Lawrence Schembri, Lynn Patterson and Paul Beaudry.

ContentsGlobal Economy . . . . . . . . . . . . . . . . . . . . . . . . . . . . . . . . . . . . . . . . . . . . . . . . . . . . . . . . . . . . 1
Box 1: Annual assessment of global potential output . . . . . . . . . . . . . . . . . . . . . 2
Global trade . . . . . . . . . . . . . . . . . . . . . . . . . . . . . . . . . . . . . . . . . . . . . . . . . . . . . . . . . . . . . . 2
United States . . . . . . . . . . . . . . . . . . . . . . . . . . . . . . . . . . . . . . . . . . . . . . . . . . . . . . . . . . . . 4
Euro area . . . . . . . . . . . . . . . . . . . . . . . . . . . . . . . . . . . . . . . . . . . . . . . . . . . . . . . . . . . . . . . . . 4
Emerging-market economies . . . . . . . . . . . . . . . . . . . . . . . . . . . . . . . . . . . . . . . . . . . . 5
Financial conditions . . . . . . . . . . . . . . . . . . . . . . . . . . . . . . . . . . . . . . . . . . . . . . . . . . . . . . 5
Commodity prices . . . . . . . . . . . . . . . . . . . . . . . . . . . . . . . . . . . . . . . . . . . . . . . . . . . . . . . 6
Canadian Economy . . . . . . . . . . . . . . . . . . . . . . . . . . . . . . . . . . . . . . . . . . . . . . . . . . . . . . . . . 9
Box 2: Key inputs to the base-case projection . . . . . . . . . . . . . . . . . . . . . . . . . . . 10
Box 3: Neutral rate . . . . . . . . . . . . . . . . . . . . . . . . . . . . . . . . . . . . . . . . . . . . . . . . . . . . . . 11
Recent developments . . . . . . . . . . . . . . . . . . . . . . . . . . . . . . . . . . . . . . . . . . . . . . . . . . . 12
Capacity pressures and inflation . . . . . . . . . . . . . . . . . . . . . . . . . . . . . . . . . . . . . . . . 14
Potential output growth . . . . . . . . . . . . . . . . . . . . . . . . . . . . . . . . . . . . . . . . . . . . . . . . . 15
Economic outlook . . . . . . . . . . . . . . . . . . . . . . . . . . . . . . . . . . . . . . . . . . . . . . . . . . . . . . . . . . . . . .15
Household spending . . . . . . . . . . . . . . . . . . . . . . . . . . . . . . . . . . . . . . . . . . . . . . . . . . . . 16
Business investment . . . . . . . . . . . . . . . . . . . . . . . . . . . . . . . . . . . . . . . . . . . . . . . . . . . . 18
Energy sector . . . . . . . . . . . . . . . . . . . . . . . . . . . . . . . . . . . . . . . . . . . . . . . . . . . . . . . . . . . 19
Non-energy exports . . . . . . . . . . . . . . . . . . . . . . . . . . . . . . . . . . . . . . . . . . . . . . . . . . . .20
Inflation outlook . . . . . . . . . . . . . . . . . . . . . . . . . . . . . . . . . . . . . . . . . . . . . . . . . . . . . . . . 21
Risks to the Inflation Outlook . . . . . . . . . . . . . . . . . . . . . . . . . . . . . . . . . . . . . . . . . . . 23
Appendix: Canadian Potential Output . . . . . . . . . . . . . . . . . . . . . . . . . . . . . . . . . . 27
Global EconomyGlobal economic growth slowed around the world in the latter part of 2018. A moderation from above-potential growth was anticipated due to cyclical factors and the impact of trade policies. However, the slowdown was greater than expected in the January Monetary Policy Report. Trade policy conflicts and the related uncertainty, as well as temporary country-specific factors, have had larger effects than previously anticipated.
With accumulating evidence of slowing activity, many central banks have signalled a slower pace of monetary policy normalization. China announced additional fiscal and monetary measures. As a result of these changes, along with perceived progress in US–China trade talks, global financial con-ditions have improved, and commodity prices have increased.
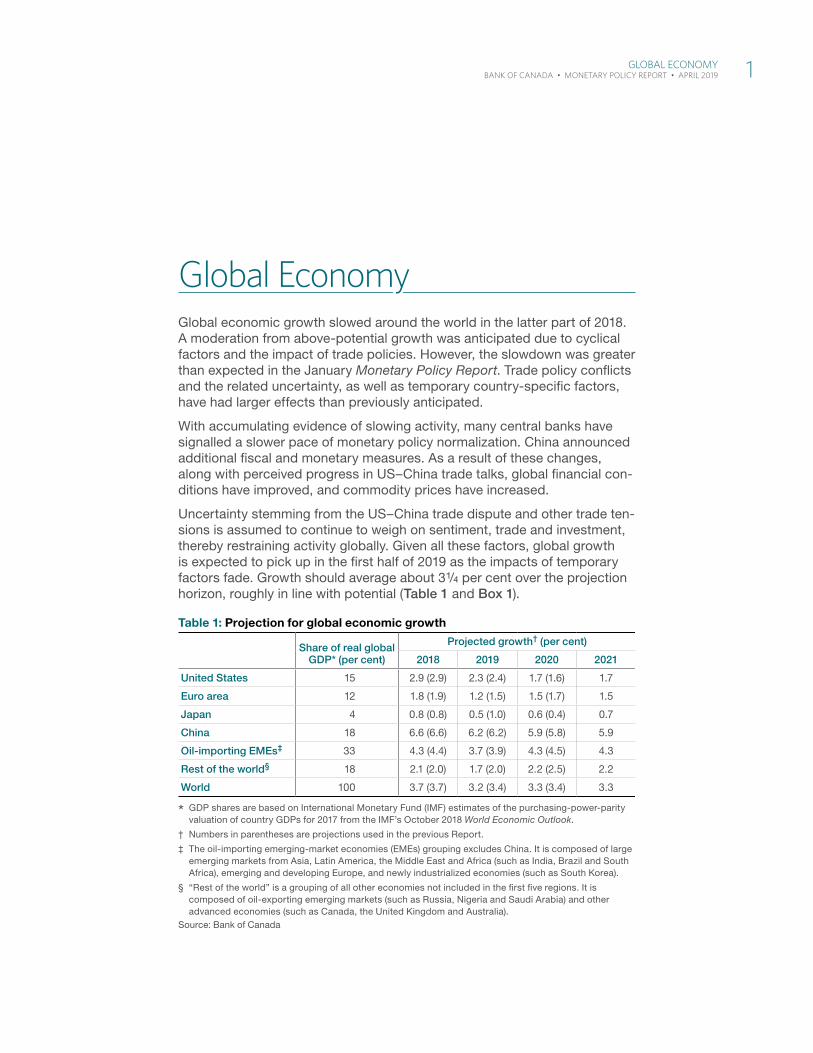
Uncertainty stemming from the US–China trade dispute and other trade ten-sions is assumed to continue to weigh on sentiment, trade and investment, thereby restraining activity globally. Given all these factors, global growth is expected to pick up in the first half of 2019 as the impacts of temporary factors fade. Growth should average about 3 1/4 per cent over the projection horizon, roughly in line with potential (Table 1 and Box 1).
Table 1: Projection for global economic growth
Share of real global GDP* (per cent)
Projected growth† (per cent)
2018 2019 2020 2021
United States 15 2.9 (2.9) 2.3 (2.4) 1.7 (1.6) 1.7
Euro area 12 1.8 (1.9) 1.2 (1.5) 1.5 (1.7) 1.5
Japan 4 0.8 (0.8) 0.5 (1.0) 0.6 (0.4) 0.7
China 18 6.6 (6.6) 6.2 (6.2) 5.9 (5.8) 5.9
Oil-importing EMEs‡ 33 4.3 (4.4) 3.7 (3.9) 4.3 (4.5) 4.3
Rest of the world§ 18 2.1 (2.0) 1.7 (2.0) 2.2 (2.5) 2.2
World 100 3.7 (3.7) 3.2 (3.4) 3.3 (3.4) 3.3
* GDP shares are based on International Monetary Fund (IMF) estimates of the purchasing-power-parity valuation of country GDPs for 2017 from the IMF’s October 2018 World Economic Outlook.
† Numbers in parentheses are projections used in the previous Report.
‡ The oil-importing emerging-market economies (EMEs) grouping excludes China. It is composed of large emerging markets from Asia, Latin America, the Middle East and Africa (such as India, Brazil and South Africa), emerging and developing Europe, and newly industrialized economies (such as South Korea).
§ “Rest of the world” is a grouping of all other economies not included in the fi rst fi ve regions. It is composed of oil-exporting emerging markets (such as Russia, Nigeria and Saudi Arabia) and other advanced economies (such as Canada, the United Kingdom and Australia).
Source: Bank of Canada
Global EConoMy 1 banK oF CanaDa • MonEtaRy PoliCy REPoRt • aPRil 2019

Global trade and investment growth have slowedThe recent slowdown of global activity has been broad-based across economies and particularly pronounced for global trade and business investment (Chart 1 and Chart 2). Trade policies and related uncertainty have played a central role in this synchronous slowdown. The total drag stemming from new tariffs implemented over the past two years by the United States and other countries and from trade policy uncertainty is now estimated to reduce global gross domestic product (GDP) by 0.4 per cent by the end of 2021, somewhat more than estimated in the January Report.1
US imports from China of products subject to tariff increases imposed in 2018 have declined. US exports to China of goods subject to new tariffs recovered somewhat in early 2019 alongside progress in bilateral talks, but they remain significantly lower than before the imposition of the tariffs.
Other regional factors have been weighing on trade. Slowing domestic demand in China has been a drag on imports, particularly since the fourth quarter of 2018. Changes to emissions testing standards for new vehicles introduced in September 2018 temporarily dampened exports in the euro area.
1 The Bank’s base-case scenario continues to assume an orderly Brexit, with modest negative effects from uncertainty. The US tariff increases on Chinese products scheduled for March have been post-poned while trade negotiations are underway. The Bank’s convention is to assume that announced policy will take effect. Without official announcements that tariff increases are cancelled, the Bank’s base-case projection assumes that they will take place in the second quarter of 2019.
Box 1
Annual assessment of global potential output growthGlobal potential output is expected to grow at a steady pace of about 3 1/4 per cent over the projection horizon (Chart 1-A) .1 Growth of global potential output should be driven primarily by strong total factor productivity growth and capital accumulation in Chi na and other emerging-market econo-mies . In the United States, potential output growth is antici-pated to average just below 2 per cent, mainly due to capital accumulation and total factor productivity growth . Potential output growth in the euro area is expected to decrease modestly throughout the projection horizon as the drag from population aging increases .
Global potential output growth has been revised down by about 0 .1 percentage point in both 2019 and 2020, relative to the forecast presented in the April 2018 Report . This mainly refl ects two factors . First, the outlook for potential output growth in China and in the United States has been marked down because of the impact on fi rm productivity of the trade dispute between the two countries .2 Second, potential output growth for the economies in the “rest of
1 For further details, see F . Bounajm, J .-P . Cayen, M . Francis, C . Hajzler, K . Hess, G . Poulin-Bellisle and P . Selcuk, “Assessing Global Potential Output Growth: April 2019,” Bank of Canada Staff Analytical Note (forthcoming) .
2 The eff ects of the US–China trade dispute on projected GDP growth were already incorporated in the January 2019 Report .
the world” group has been revised down over both recent history and the projection horizon . This accounts for a greater negative impact from past oil price declines on the capital stock and the productivity of oil-producing economies .
Global potential output is expected to grow at a steady paceYear-over-year percentage change, annual data
Source: Bank of Canada calculations
Chart 1-A:
%
2001 2003 2005 2007 2009 2011 2013 2015 2017 2019 20213.0
3.5
4.0
4.5
2 Global EConoMy banK oF CanaDa • MonEtaRy PoliCy REPoRt • aPRil 2019

In addition, the weakness in trade is likely exacerbated by lower demand for upgrades of electronic goods: global shipments of cell phones and personal computers both declined in 2018.
The recent dynamics of global trade are amplifying a slowdown that is occurring for structural reasons. For instance, one such reason for declining trade is associated with reshoring or nearshoring in conjunction with a shift toward more technology-intensive production.2, 3
2 See S. S. Poloz, “Turbulent Times for Trade” (speech to the Baffin Regional Chamber of Commerce and the Nunavut Mining Symposium, Iqaluit, Nunavut, April 1, 2019).
3 Reshoring consists of transferring back to the country business operations that had previously been moved overseas. Nearshoring consists of transferring to a nearby country operations that were done in a more distant one.
Chart 1: The slowdown in global growth has been broad-basedShare of countries with year-over-year growth exceeding the previous 3-year average,* quarterly data
* The share of countries is based on 56 advanced and emerging-market economies, accounting for 87 per cent of global GDP by purchasing-power-parity weight.
Sources: national sources via Haver Analytics and Bank of Canada calculations Last observation: 2018Q4
0
20
40
60
80
100
2006 2007 2008 2009 2010 2011 2012 2013 2014 2015 2016 2017 2018
%
Chart 2: Global trade and investment growth have slowedYear-over-year percentage change, quarterly data
a. 2007Q1–18Q4 b. 2014Q1–18Q4
Global trade volume Global gross fi xed capital formation
Note: Global gross fi xed capital formation is an aggregate of data from 48 advanced and emerging-market economies, accounting for around 84 per cent of global GDP by purchasing-power-parity weight. Global trade volume comes from Netherlands Bureau for Economic Policy Analysis.
Sources: Netherlands Bureau for Economic Policy Analysis, International Monetary Fund and national sources via Haver Analytics, and Bank of Canada calculations Last observation: 2018Q4
-20
-10
0
10
20%
2007 2009 2011 2013 2015 20170
2
4
6
8
%
2014 2015 2016 2017 2018
b. 2014Q1–18Q4
Global EConoMy 3 banK oF CanaDa • MonEtaRy PoliCy REPoRt • aPRil 2019

US growth to slow to a more sustainable paceThe US expansion moderated at the end of 2018, partly reflecting the impact on household spending of past increases in interest rates. Residential investment contracted for the fourth quarter in a row in response to declining affordability. In addition, tariffs and trade tensions have increas-ingly weighed on exports and imports. Meanwhile, business investment continued to grow at a strong pace, supported by the 2018 tax changes and deregulation (Chart 3).
Recent indicators continue to suggest healthy US growth in the first quarter of 2019 despite the disruptions caused by the US government shutdown. US activity is still supported by solid employment gains in recent months, rising wage growth and elevated consumer and business confidence.
After expanding at a robust pace last year, economic growth is forecast to slow to around 2¼ per cent in 2019 and further to about 1 3/4 per cent in 2020 and 2021. The slowdown in growth is largely in response to past increases in interest rates and the waning effects of fiscal stimulus. Core inflation is expected to remain close to 2 per cent.
Euro area growth has disappointedIn the euro area, the recent experience of weaker-than-expected growth continued into the fourth quarter of 2018. The manufacturing sector experi-enced a broad-based contraction, and the Purchasing Managers’ Index indicates ongoing weakness into the first quarter of 2019. Consumer confi-dence also deteriorated. This suggests that the headwinds associated with Brexit, global trade uncertainties and domestic factors, such as fiscal chal-lenges in Italy and protests in France, have been more important than previ-ously assessed.
Chart 3: US business inv estment continued to grow at a strong paceQuarterly data
Capital expenditure plans, balance of opinion (left scale)
Year-over-year growth in non-residential fi xed investment (right scale)
Note: Capital expenditure plans are measured using a weighted average of the balances of opinion on capital expenditure intentions six months ahead from surveys of manufacturing conducted by the Federal Reserve banks of New York, Philadelphia, Richmond, Dallas and Kansas City.
Sources: US Bureau of Economic Analysis; Federal Reserve banks of New York, Philadelphia, Richmond, Dallas and Kansas City; and Bank of Canada calculations
Last observations: capital expenditure plans, 2019Q1;
non-residential fi xed investment, 2018Q4
2007 2009 2011 2013 2015 2017 2019-20
-15
-10
-5
0
5
10
15
-30
-20
-10
0
10
20
30
40
%%
4 Global EConoMy banK oF CanaDa • MonEtaRy PoliCy REPoRt • aPRil 2019

Some of these headwinds are anticipated to continue to dampen eco-nomic activity over the projection horizon. Growth is nevertheless expected to improve in the first half of 2019 as the impacts of some temporary fac-tors recede, including the effects of last September’s changes to emissions testing standards for new vehicles.
Core inflation is still tepid and is anticipated to increase only gradually.
Policy is supporting growth in ChinaWith ongoing trade tensions and past deleveraging, the Chinese economy has continued its gradual slowing. In response to softer momentum, author-ities have enacted modest fiscal and monetary stimulus policies in recent months. These measures have helped to improve consumer confidence and industrial production since the beginning of the year. Nonetheless, growth is expected to moderate from about 6 1/2 per cent in 2018 to just below 6 per cent by the end of the projection period. Chinese authorities have signalled that they would provide additional policy support should it be needed. High corporate debt levels and trade tensions could continue to be challenges to growth.
Economic activity was weak in other oil-importing emerging-market economies (EMEs) in the second half of 2018. This weakness reflected slower growth in India, Brazil and Mexico, as well as recessions in Turkey and Argentina. While the recessions in these two countries should persist over the first half of this year, overall growth in oil-importing EMEs is expected to pick up, supported by rebounds in India and Brazil. Cuts to oil production by some members of the Organization of the Petroleum Exporting Countries (OPEC) are expected to be a drag on these economies over the first six months of 2019.
Global financial conditions have improvedIn response to slowing economic growth, many central banks have sig-nalled a slower pace of monetary policy normalization. Consistent with the moderation of the global economy and central bank communications, nom-inal yields on government bonds have decreased. At the same time, credit spreads have narrowed and equity prices have increased.
In Canada and the United States, yields on 10-year government bonds have been fluctuating around the yields on three-month treasury bills. The recent episode of a negative spread between these two yields (yield-curve inversion) was modest and short-lived and accompanied by improve-ments in other financial indicators. In the past, yield-curve inversions have often occurred before recessions, especially in the US economy (Chart 4).4 However, these inversions were typically the result of short-term interest rates rising persistently above long-term rates rather than because long-term rates were falling, as has been observed over the past couple of months. In recent years, structural factors, such as increased public and pri-vate sector demand for high-quality government securities, have contributed to lower long-term yields. In this context, inversions should be expected to occur more frequently and, unless large and persistent, should be regarded as less informative about future growth than they have been in the past.
4 Box 2 of the October 2018 Report discusses the predictive properties of the yield curve and other market-based measures.
Global EConoMy 5 banK oF CanaDa • MonEtaRy PoliCy REPoRt • aPRil 2019

Prices of most commodities have moved higherThe prices of Brent and West Texas Intermediate (WTI) oil have increased since January. Oil prices rose in response to improved market sentiment, a greater-than-expected output cut in Saudi Arabia and risks of falling pro-duction in Iran, Venezuela and Libya. In its projection, the Bank assumes that the prices of Brent and WTI oil will remain close to their recent average levels (Box 2, page 10, and Chart 5).
Uncertainty around the future path for global oil prices remains elevated. The most important considerations relate to OPEC policy and geopolitical risks to production. As well, US shale output could increase at a faster pace than expected.
Chart 4: The spreads between long-term and short-term government bond yields recently narrowedSpreads between 10-year and 3-month government bond yields, monthly data
a. Canada b. United States
Canadian recession dates from C.D. Howe Institute US recession dates from NBER
Sources: C.D. Howe Institute, National Bureau of Economic Research, Reuters and Bank of Canada calculations Last observation: March 2019
-5
-4
-3
-2
-1
0
1
2
3
4
5
1962 1972 1982 1992 2002 2012
%
-5
-4
-3
-2
-1
0
1
2
3
4
5
1962 1972 1982 1992 2002 2012
%
Chart 5: Oil prices have partially recovered from recent declinesDaily data
Brent West Texas Intermediate Western Canadian Select
Sources: exchange sources via Haver Analytics Last observation: April 19, 2019
2017 2018 201910
30
50
70
90US$ per barrel
January Report
6 Global EConoMy banK oF CanaDa • MonEtaRy PoliCy REPoRt • aPRil 2019

The spread between WTI and Western Canadian Select has narrowed to around US$10. The spread is being compressed in part by mandatory pro-duction curtailments in Alberta. In addition, US sanctions against Venezuela have increased the demand for Canadian heavy oil.
The Bank’s non-energy commodity price index is about 3 per cent higher than in January. Many prices have risen because of improved market senti-ment, with idiosyncratic supply factors providing additional support to the prices of base metals and hogs. However, Canadian canola prices have fallen following recent actions by the Chinese government.
Global EConoMy 7 banK oF CanaDa • MonEtaRy PoliCy REPoRt • aPRil 2019

Canadian EconomyTrade tensions and elevated uncertainty have been important drivers of the growth dynamic for both the global and Canadian economies, although some factors specific to Canada are playing a role. The Canadian economy was operating close to potential, then slowed in the fourth quarter of last year. After a soft patch at the beginning of 2019, economic growth is expected to pick up.
The dampening effects on growth of low oil prices, changes to housing poli-cies and the 2017–18 increases in borrowing rates should dissipate over 2019. Improvements in financial conditions since the beginning of 2019, con-tinuing strong immigration and sustained global expansion are expected to support growth over the projection horizon. The pace of economic activity is projected to increase from 1.2 per cent in 2019 to about 2 per cent in 2020 and 2021 (Table 2, Table 3 and Box 2).
Compared with the projection in the January Report, the outlook for growth in 2019 has been revised down and is largely unchanged for 2020. The markdown reflects mainly that the economy in the fourth quarter of 2018 and the first quarter of 2019 was weaker than anticipated.
Table 2: Contributions to average annual real GDP growthPercentage points*†
2018 2019 2020 2021
Consumption 1.2 (1.3 ) 0.9 (1.0) 1.1 (1.0) 1.0
Housing -0.2 (-0.1) -0.3 (-0.1) 0.2 (0.1) 0.2
Government 0.7 (0.7) 0.2 (0.2) 0.2 (0.4) 0.4
Business fi xed investment 0.2 (0.5) -0.2 (0.2) 0.4 (0.4) 0.4
Subtotal: � nal domestic demand 1.9 (2.4) 0.6 (1.3) 1.9 (1.9) 2.0
Exports 1.0 (1.0) 0.3 (1.0) 0.9 (0.8) 0.8
Imports -0.9 (-1.1) 0.1 (-0.5) -0.4 (-0.6) -0.8
Subtotal: net exports 0.1 (-0.1) 0.4 (0.5) 0.5 (0.2) 0.0
Inventories -0.2 (-0.3) 0.2 (-0.1) -0.3 (0.0) 0.0
GDP 1.8 (2.0) 1.2 (1.7) 2.1 (2.1) 2.0
Memo items (percentage change)
Range forpotential output
1.5–2.1(1.5–2.1)
1.5–2.1(1.4–2.2)
1.3–2.1(1.3–2.3)
1.2–2.4
Real gross domestic income (GDI) 1.9 (2.2) 1.2 (0.9) 2.1 (2.2) 2.0
CPI infl ation 2.3 (2.3) 1.9 (1.7) 2.0 (2.0) 2.0
* Numbers in parentheses are from the projection in the previous Report.
† Numbers may not add to total because of rounding.
CanaDian EConoMy 9 banK oF CanaDa • MonEtaRy PoliCy REPoRt • aPRil 2019

The Bank has reviewed its estimates of potential output growth and the neutral rate of interest (Appendix and Box 3). The midpoints of the ranges for both have been revised down slightly. Overall, the Bank judges that the economy was operating with modest excess capacity in the first quarter of 2019.
Core measures of inflation have continued to hover near 2 per cent. Consumer price index (CPI) inflation declined to 1.6 per cent in the first quarter of 2019, primarily reflecting past declines in gasoline prices. Through the projection horizon, inflation is expected to remain close to 2 per cent.
Table 3: Summary of the projection for CanadaYear-over-year percentage change*
2018 2019 2018 2019 2020 2021
Q3 Q4 Q1 Q2 Q4 Q4 Q4 Q4
CPI infl ation 2.7 (2.7)
2.1 (2.0)
1.6 (1.7)
2.0 2.1 (2.0)
2.1 (2.0)
2.0 (2.0)
2.0
Real GDP 1.9 (2.1)
1.6 (2.0)
1.3 (1.7)
1.0 1.6 (2.0)
1.4 (1.9)
2.2 (2.1)
1.9
Quarter-over-quarter percentage change at annual rates†
2.0 (2.0)
0.4 (1.3)
0.3 (0.8)
1.3
* Numbers in parentheses are from the projection in the previous Report. Details on the key inputs into the base-case projection are provided in Box 2.
† Over the projection horizon, 2019Q1 and 2019Q2 are the only quarters for which some information about real GDP growth was available at the time the projection was conducted. For longer horizons, fourth-quarter-over-fourth-quarter percentage changes are presented.
Box 2
Key inputs to the base-case projectionThe Bank’s projection is always conditional on several key assumptions, and changes to them will aff ect the base-case scenario . The Bank regularly reviews these assumptions and assesses the sensitivity of the economic projection to them . The Bank’s current assumptions are as follows:
• Global oil prices are assumed to remain near recent average levels . The per-barrel prices in US dollars for Brent and West Texas Intermediate have recently aver-aged close to $70 and $60, respectively . These prices are about $10 higher than assumed in the January Report . The Bank’s projections for production and exports of Canadian oil are anchored by transportation capacity rather than by an assumption about the price of Western Canadian Select .
• By convention, the Bank does not forecast the exchange rate in its base-case projection . The Canadian dollar is assumed to remain at 75 cents over the projection horizon, close to its recent average and broadly in line with the 74 cents assumed in the January Report .
• The Bank estimates that the output gap was in a range of -1 .25 to -0 .25 per cent in the fi rst quarter of 2019 . This compares with the January assumption that the output gap in the fourth quarter of 2018 was in a range of -1 .0 to 0 .0 per cent .1
• Growth in Canadian potential outp ut is assumed to average 1 .8 per cent over 2019 through 2021 and to reach 1 .9 per cent in 2022 . Details on the Bank’s assess-ment of potential output growth are provided in the Appendix .
• The Bank conducted its annual re-evaluation of its esti-mate of the neutral rate in conjunction with its annual reassessment of potential output . For Canada, the neu-tral rate is currently estimated to be between 2 .25 and 3 .25 per cent (Box 3) .
1 The annual reassessment of potential output suggests that productive capacity has been about 0 .2 per cent lower than previously assessed and that the output gap in the fourth quarter of 2018 was in a range of -0 .75 to 0 .25 per cent . The Bank estimates that the output gap widened in the fi rst quarter of 2019 with GDP growth weaker than potential .
10 CanaDian EConoMy banK oF CanaDa • MonEtaRy PoliCy REPoRt • aPRil 2019

Box 3
Neutral rateThe neutral nominal policy rate is the sum of two compon-ents: (i) the real rate that is consistent with output at its potential level and infl ation at target once the eff ects of any cyclical shocks have dissipated, and (ii) 2 per cent to account for the rate of infl ation at target .
The Bank estimates that the Canadian neutral rate likely lies in a range of 2 .25 to 3 .25 per cent in nominal terms .1 The assessment is based on staff analysis that uses a suite of four distinct but complementary approaches, each emphasizing the role of diff erent factors in determining the neutral rate:
• a pure interest rate parity condition under which capital is assumed to fl ow freely across international borders . This implies that the Canadian and global neutral rates coincide, thus placing full emphasis on foreign factors .
• a closed-economy neoclassical growth model that focuses on domestic factors . This model has been revised to capture the impact of macroeconomic risk on the level of the neutral rate .2
• a reduced-form model that combines domestic and foreign factors . It fi nds that foreign factors play a quan-titatively more important role in determining the level of the Canadian neutral rate .
• a small open economy model with overlapping genera-tions . This model captures demographic factors that are mostly absent in the other models .
1 The Bank’s range is similar to that indicated by the longer-run assessment of the federal funds rate in the Federal Reserve’s Summary of Economic Projections from March 2019 . The longer-run projections fell in a range of 2 .5 to 3 .5 per cent . Notably, the median of the projections was 2 .75 per cent, and 14 of 16 respondents provided a projection between 2 .5 and 3 .0 per cent .
2 T . J . Carter, X . S . Chen and J . Dorich, “The Neutral Rate in Canada: 2019 Update,” Bank of Canada Staff Analytical Note No . 2019-11 (April 2019) . As the note explains, households tend to respond to greater risk by increasing their demand for safe assets, which puts downward pressure on the neutral rate, all else being equal .
The neutral rate is not observable, and there is considerable uncertainty surrounding it . The overall assessment conveys a methodological range constructed by aggregating the most likely ranges derived from each of the four approaches (Table 3-A) . These ranges capture the sensitivity of the estimate of the neutral rate to diff erent values for key par-ameters and other inputs . A statistical range refl ecting all sources of uncertainty would be larger .
The Bank judges that the neutral range is 0 .25 percentage points lower than assessed in April 2018 as a result of addi-tional information and improved modelling . The most likely ranges of the three models other than the closed-economy model are lower, mainly due to additional information that the global neutral rate, an important input, has likely been 0 .25 percentage points lower tha n was previously assessed . With the changes to capture risk, the closed-economy neo-classical growth model provides a range that is consistent with the new lower range .
Table 3-A: Summary of neutral nominal policy rate estimates for Canada
Approach2019
estimates (%)2018
estimates (%)
Pure interest rate parity condition 2.25–3.25 2.5–3.5
Risk-augmented neoclassical growth model* 2.25–3.25 2.25–3.25
Reduced-form model 2.25–3.0 2.5–3.25
Overlapping generations model 2.5–3.25 2.75–3.25
Overall assessment 2.25–3.25 2.5–3.5
* The term “risk-augmented” refers to the current version of the neoclassical growth model (NCGM), which has been revised to account for macroeconomic risk. The range given for 2018 is what the risk-augmented NCGM would have implied had it been in place at the time.
CanaDian EConoMy 11 banK oF CanaDa • MonEtaRy PoliCy REPoRt • aPRil 2019

Growth to pick up in the second quarter of 2019The pace of economic activity in the fourth quarter of 2018 was weaker than expected, although the impact of lower oil prices on GDP has been roughly in line with the Bank’s estimates. Business investment and exports were lower than anticipated, largely reflecting slower global demand and a greater impact from trade policy issues. Also, firms may have delayed investment spending in anticipation of the new Accelerated Investment Incentive announced in the federal government’s Fall Economic Statement. Further, past changes in housing policies together with the 2017–18 increases in borrowing rates appear to be having larger and more prolonged effects on residential invest-ment and components of consumption that are sensitive to changes in interest rates.
Weak growth is estimated to have continued into the first quarter of 2019, with softness in several components of demand. Recent data indicate broad-based weakness in exports of goods. Ongoing adjustment in the oil and gas sector is estimated to have held back investment (Chart 6). Residential investment activity was also likely weak again in the first quarter, reflecting the ongoing transition in the composition of housing demand and construction to more affordable residences (Chart 7). At the same time, consumption is estimated to have strengthened, supported by strong income gains and elevated consumer confidence.
The slowing of growth has primarily occurred in goods-producing industries, such as construction as well as energy and its supporting activities. Since drivers of the recent weakness in trade are viewed as largely temporary, the Bank estimates that growth will pick up in the second quarter of 2019
Chart 6: Declining drilling activity points to weaker investment in the oil and gas sectorMonthly data
Support activities for mining and oil and gas extraction (Index: January 2013 = 100, left scale)
West Texas Intermediate (WTI) oil price* (Index: January 2013 = 100, left scale)
Total rig count† (right scale)
* The price for WTI in April is the average between April 1 and 18, 2019.
† The total rig count has been seasonally adjusted by the Bank of Canada. The April fi gure is based on data for the fi rst three weeks of April.
Sources: Baker Hughes, Statistics Canada and Bank of Canada calculations
Last observations: total rig count and WTI oil price, April 2019; support activities for mining
and oil and gas extraction, January 2019
0
100
200
300
400
500
20
40
60
80
100
120
2013 2014 2015 2016 2017 2018 2019
Number of rigsIndex
12 CanaDian EConoMy banK oF CanaDa • MonEtaRy PoliCy REPoRt • aPRil 2019

(Table 3 and Chart 8). The near-term outlook incorporates a large swing in inventories to reconcile mixed signals from production and expenditure indicators.
The Bank has revised its outlook for the first quarter of 2019 down relative to the January Report. Investment and export levels are lower, reflecting greater effects of uncertainty and weaker global demand. As well, activity in the housing market is expected to stabilize later than previously anticipated.
Chart 8: Growth is expected to pick upContribution to real GDP growth, quarterly data
GDP growth, quarterly, at annual rates (left scale)
GDP growth estimate in January Report, quarterly, at annual rates (left scale)
Business fi xed investment (right scale) Consumption (right scale) Exports (right scale) Housing (right scale) Inventories, imports, government spending and residual (right scale)
Sources: Statistics Canada and Bank of Canadaestimates and calculations Last data plotted: 2019Q2
-4
-2
0
2
4
6
-4
-2
0
2
4
6%
2018 2019Q1 Q2 Q3 Q4 Q1 Q2
Percentage points
Chart 7: Fewer single-detached homes are being builtSeasonally adjusted, annualized, monthly data
Urban single starts (left scale) Urban single starts (6-month moving average, left scale)
Urban multiple starts (right scale) Urban multiple starts (6-month moving average, right scale)
Sources: Canada Mortgage and Housing Corporation and Bank of Canada calculations Last observation: March 2019
2016 2017 2018 201960
80
100
120
140
160
180
30
40
50
60
70
80
90ThousandsThousands
CanaDian EConoMy 13 banK oF CanaDa • MonEtaRy PoliCy REPoRt • aPRil 2019

The economy has a modest degree of excess capacityThe Canadian economy was operating near capacity for most of 2017 and 2018. However, as a result of recent slow economic growth, the Bank estimates that the output gap was between -1.25 and -0.25 per cent in the first quarter of 2019 (Box 2). The degree of slack is not generalized across the entire economy since the slowing of activity is more concen-trated in some industries and regions than in others.
In the spring Business Outlook Survey fewer firms reported capacity pres-sures as more intense compared with a year ago, in some cases because they have recently expanded production capacity or hired additional workers (Chart 9). The view that labour shortages have intensified has also become less widespread.
Overall, the labour market continues to be healthy. The number of job vacan-cies was near its record high in the fourth quarter of 2018, and the pace of hiring has been strong, particularly in the services industry and outside oil-intensive regions.5 Regional differences are also evident in wage growth, which was about 1.3 per cent in the fourth quarter of 2018 in oil-intensive regions and 2.6 per cent in other provinces. Nationally, wages increased by 2.1 per cent.
Further evidence that the labour market is healthy shows up in wage increases for job changers. It is generally easier for workers to find jobs that better match their skill sets when demand for labour is strong and broad-based. When workers move to jobs that make better use of their skills, wage increases tend to reflect higher productivity and thus may not be inflationary. Empirical evidence indicates job changers have been receiving wage increases of about 12 per cent, considerably higher than the average increase.6
5 Job vacancies are based on the Statistics Canada’s Job Vacancy and Wage Survey.
6 See O. Kostyshyna and C. Luu, “The State of the Labour Market Churn in Canada,” Bank of Canada Staff Analytical Note No. 2019-04 (January 2019).
Chart 9: Fewer fi rms report that capacity pressures and labour shortages are intensifyingBalance of opinion,* quarterly data
Intensity of capacity pressures Intensity of labour shortages
* Percentage of fi rms respondin g to the Business Outlook Survey reporting more intense capacity pressures (or labour shortages) compared with 12 months ago minus the percentage of fi rms reporting less intense capacity pressures (or labour shortages)
Source: Bank of Canada Last observation: 2019Q1
-30
-15
0
15
30
45
60%
2015 2016 2017 2018 2019
14 CanaDian EConoMy banK oF CanaDa • MonEtaRy PoliCy REPoRt • aPRil 2019

Core inflation measures have been stable and close to 2 per cent for more than a year, consistent with an economy operating near capacity (Chart 10). CPI inflation has been considerably more volatile, reflecting the effects of temporary factors. In the first quarter of 2019, inflation eased to 1.6 per cent, largely because gasoline prices have continued to be lower than they were one year ago.
Potential output growth to average about 1.8 per centIn this Report, the Bank provides its annual reassessment of potential output growth. The midpoint of the range for potential output growth is esti-mated to be slightly lower than in the April 2018 Report, at 1.8 per cent on average between 2019 and 2021 and at 1.9 per cent in 2022 (Appendix). Softer business investment relative to the April 2018 Report reduces the projected growth rate of trend labour productivity. This effect is largely offset by strong immigration, which boosts growth of the working-age popu-lation and contributes to a forecast of higher trend labour input growth.
Over time, growth of trend labour productivity is expected to improve as the drag on investment growth from the oil sector and elevated trade policy uncertainty wanes. Meanwhile, trend labour input growth will continue to slow because of population aging. The Bank’s assessment of potential output is subject to considerable uncertainty. The estimates are presented as a range that captures some of the uncertainty (Table 2).
Excess capacity to be absorbed over the projection horizonGDP growth is expected to increase from 1.2 per cent in 2019 to about 2.0 per cent in 2020 and 2021 (Table 2 and Table 3). The Bank projects that the economy will gradually strengthen through 2019 and will grow slightly above potential in 2020 and 2021 (Chart 11).
The steady expansion of services industries is expected to continue and plays an integral role driving solid job gains and income growth. In this con-text, the rebound in GDP growth in the base-case projection mainly reflects
Chart 10: Core infl ation measures have remained close to 2 per centYear-over-year percentage change, monthly data
Total CPI Target Range of core infl ation measures*
* The measures are CPI-common, CPI-median and CPI-trim.
Sources: Statistics Canada, Bank of Canada and Bank of Canada calculations Last observation: March 2019
2012 2013 2014 2015 2016 2017 2018 2019
%
0.0
0.5
1.0
1.5
2.0
2.5
3.0
3.5
CanaDian EConoMy 15 banK oF CanaDa • MonEtaRy PoliCy REPoRt • aPRil 2019

an improvement in goods industries. In particular, by 2020, the adjustment to previous declines in oil prices or past changes to housing policies will no longer weigh on growth.
Compared with that in the January Report, the projection for economic growth in 2019 has been marked down by 0.5 percentage points. About one-third of this change reflects the weaker-than-expected growth at the end of 2018, and most of the rest is due to the downward revision to growth in the first half of 2019. For 2020, the projection for growth remains broadly unchanged.
Overall, trade tensions and related uncertainty, weaker foreign demand and past housing policies are having somewhat greater adverse effects on the forecasted profile for output than previously anticipated. In addition, the contribution of fiscal spending to growth has been marked down. The new federal budget and provincial budgets for Quebec and British Columbia are each somewhat positive for economic activity. However, the new Ontario budget has considerably less spending than was assumed in the projection in the January Report. The January assumption was largely based on the multi-year trajectory embedded in the 2018 Ontario budget. The effects of all of these developments are only partially offset by those associated with higher commodity prices and more favourable financing conditions.
Growth of household spending to rise as effects of past policy changes fadeThe outlook for consumption and housing is underpinned by strong employ-ment and solid wage gains. By 2020, provincial and municipal housing market policies and tighter mortgage finance guidelines are no longer expected to slow household spending growth.
Chart 11: Growth is projected to be above potential in 2020 and 2021Year-over-year percentage change, quarterly data
Potential output Real GDP Real fi nal sales
Note: Final sales are GDP excluding inventory investment.
Sources: Statistics Canada and Bank of Canada calculations, estimates and projections
%
-1
0
1
2
3
4
5
2010 2011 2012 2013 2014 2015 2016 2017 2018 2019 2020 2021
16 CanaDian EConoMy banK oF CanaDa • MonEtaRy PoliCy REPoRt • aPRil 2019

In addition, the improvement in financial conditions has a positive influence on spending. For instance, with the recent easing of household borrowing rates, mortgage payments of households renegotiating their five-year fixed-rate mortgages would be expected to rise by less than in the illustration in Box 3 of the July 2018 Report.
Consumption is expected to grow moderately (Chart 12). Elevated indebted-ness together with concerns about changing house prices are anticipated to contribute to households becoming more cautious in their consumption decisions. In oil-intensive regions, the ongoing adjustment of the energy sector is expected to continue to dampen household spending. The profile for consumption overall is consistent with a savings rate that is increasing from a low level over the projection horizon.
National housing metrics are anticipated to mask regional differences through 2019. For instance, the effects on growth of the revised B-20 guide-line are expected to dissipate in many markets, although they could per-sist longer in areas with elevated house prices and that have been subject to other changes to housing policies. The stabilization of expectations for house prices in British Columbia and Ontario may indicate a forthcoming stabilization and subsequent increase in resale activity (Chart 13).7 The changes to municipal and provincial policies to address speculation, com-bined with the B-20 revisions, are having more pronounced effects in the Greater Vancouver Area (GVA) than in the Greater Toronto Area. Thus, while stabilization of activity is expected this year in the base-case projection, there is a risk that it could be delayed in the GVA. Meanwhile, ongoing chal-lenges in the oil industry are expected to continue to weigh on the Alberta housing market. In contrast, a strong economy and investor interest is expected to boost the market in Montréal.
7 Bank staff relate fundamentals for provincial housing resales to employment, affordability and migra-tion. For more information, see T. Webley, “Fundamental Drivers of Existing Home Sales in Canada,” Bank of Canada Staff Discussion Paper No. 2018-16 (December 2018), and M. Khan and T. Webley, “Disentangling the Factors Driving Housing Resales,” Bank of Canada Staff Analytical Note No. 2019-12.
Chart 12: Consumption is expected to grow moderately as the savings rate increasesNominal annual data
Savings rate Consumption growth
Sources: Statistics Canada and Bank of Canada calculations and projections
0
1
2
3
4
5
6
2012 2013 2014 2015 2016 2017 2018 2019 2020 2021
%
CanaDian EConoMy 17 banK oF CanaDa • MonEtaRy PoliCy REPoRt • aPRil 2019

The First-Time Home Buyer Incentive introduced in the 2019 federal budget is expected to support housing demand and may also lead to improving sentiment in the housing market. However, delays in purchases by home-buyers who want to take advantage of the new measure could influence the timing of resale activity in 2019.8
After declining for two years, residential investment is expected to expand modestly in 2020 and 2021. Given the trend reduction in housing afford-ability, construction of multi-unit residences is expected to resume its trend increase to meet demand for less-expensive homes.
Business investment outside the oil and gas sector to reboundThe Bank expects a gradual expansion in investment outside the oil and gas sector starting in the first half of 2019, with solid growth in the second half of the year and continuing through the projection horizon (Chart 14). Business investment should be motivated by capacity constraints, elevated operating profits, favourable financing costs and the federal and Ontario governments’ investment incentives. This forecast continues to incorporate judgment that elevated uncertainty is holding back investment. In the projection, trade uncertainty is assumed to reduce the level of business investment by about 2.5 per cent by the end of 2021.9
8 Details on this measure are available in Budget 2019: An Affordable Place to Call Home.
9 Since April 2017, the Bank’s base-case scenarios have incorporated some negative judgment on investment and exports to account for the effects of uncertainty around trade policy. In the January 2019 Report, the judgment capturing the impact of uncertainty removed 1.8 per cent from the level of investment by the end of 2020. Judgment has increased in this Report because part of the unexplained weakness in investment has been attributed to uncertainty.
Chart 13: Housing resales in British Columbia and Ontario have moved with house price expectationsAnnualized, quarterly data
a. British Columbia
House price growth expectations in British Columbia† (left scale) Resales in British Columbia (right scale)
b. Ontario
House price growth expectations in Ontario† (left scale) Resales in Ontario (right scale)
* The labels for the provincial policy measures point to the quarter before they were implemented.
† The data are collected from the Bank of Canada’s Canadian Survey of Consumer Expectations. Expectations are measured by the interpolated median of expected growth in national house prices over the next 12 months for residents of British Columbia and Ontario.
Sources: Canadian Real Estate Association via Haver Analytics, Bank of Canada and Bank of Canada calculations Last observation: 2019Q1
60
80
100
120
140
2
4
6
8
10
2015 2016 2017 2018 2019
% Thousands of units
180
200
220
240
260
3
4
5
6
7
2015 2016 2017 2018 2019
% Thousands of units
15% non-resident tax*
Homes for BC plan*
15% non-resident tax*
18 CanaDian EConoMy banK oF CanaDa • MonEtaRy PoliCy REPoRt • aPRil 2019

In the spring Business Outlook Survey, firms not exposed to the energy sector reported intentions to increase capital spending to meet anticipated demand and improve productivity, though many cited regulatory hurdles or uncertainty. These spending intentions were particularly concentrated among services-oriented firms. The survey results are consistent with the view that ongoing digitalization of business activity is encouraging capital spending in areas such as research and development, software and com-puter equipment.
Transportation constraints to restrain the energy sectorThe oil and gas sector continues to undergo structural adjustment. The Bank expects that the level of investment in the oil and gas sector in 2019 will be about 20 per cent lower than its 2017 plateau. This contraction fol-lows the steep decline of roughly 50 per cent that occurred between 2014 and 2016.
Developments in the sector have dampened business sentiment. For instance, several firms in the Prairies responding to the spring Business Outlook Survey cited uncertainty around the outlook for the sector, as well as transportation constraints and other industry-specific regulations, as impediments to investment. Following the 2019 decline, energy investment is anticipated to remain relatively stable over the remainder of the projection horizon.
Energy exports are expected to decline in 2019 and then recover and grow moderately over the remainder of the projection horizon. The Bank assumes that oil production and exports will correspond roughly to the available transportation capacity. Production curtailments have been eased and are assumed to be phased out in the future. In this context, the Bank’s projections for production and exports of Canadian oil are anchored
Chart 14: Business investment growth outside the oil and gas sector is expected to reboundContribution to total business investment growth, semi-annual data
Total business investment growth, semi-annual, at annual rates (left scale)
Oil and gas sector (right scale) Other sectors (right scale)
Sources: Statistics Canada and Bank of Canada calculations and projections
-20
-16
-12
-8
-4
0
4
8
12
-20
-16
-12
-8
-4
0
4
8
12
2014 2015 2016 2017 2018 2019 2020 2021
% Percentage points
CanaDian EConoMy 19 banK oF CanaDa • MonEtaRy PoliCy REPoRt • aPRil 2019

by transportation capacity rather than by an assumption about the price of Western Canadian Select. The Enbridge Line 3 replacement program has been delayed until the end of 2020, and crude-by-rail shipments are expected to expand. Rail is anticipated to be the marginal mode of transpor-tation for Canadian oil exports.10
Non-energy exports to expand moderatelyGlobal trade policies and challenges related to competitiveness are antici-pated to continue to be impediments to exports. In addition, the Bank assumes that trade uncertainty reduces the level of exports by about 1.2 per cent by the end of 2021.11 Nevertheless, growth of non-commodity exports is projected to be broad-based outside the auto sector (Chart 15). The expansion of foreign demand and rising production capacity will sup-port moderate growth.
Exports of services are forecast to continue growing at a strong pace, fur-ther increasing services’ share of non-commodity exports. In particular, travel services, which includes tuition and other spending in Canada by foreign students, and foreign sales of commercial services should be important contributors to export growth. Exports of goods, excluding autos, are expected to pick up over the projection horizon, supported by growing US private demand.
10 Crude-by-rail shipments are expected to expand and reach about 550,000 barrels per day by the end of 2021.
11 In the January Report, the judgment capturing the impact of uncertainty removed 0.8 per cent from the level of exports by the end of 2020. Judgment has been increased in this Report because part of the recent unexplained weakness in exports has been attributed to uncertainty.
Chart 15: Export growth is projected to be broad-basedContribution to real total export growth, annual data
Real total export growth (left scale)
Motor vehicles and parts (right scale) Commodity exports (right scale) Machinery and equipment (right scale) Services (right scale) Consumer goods (right scale)
Sources: Statistics Canada and Bank of Canada calculations and projections
-2
-1
0
1
2
3
4
-2
-1
0
1
2
3
4
2017 2018 2019 2020 2021
%
2011–16
Percentage points
20 CanaDian EConoMy banK oF CanaDa • MonEtaRy PoliCy REPoRt • aPRil 2019

Non-energy commodity exports are expected to grow modestly, gener-ally benefiting from higher global prices. For example, some agricultural exports are projected to increase as global demand and prices for food rise. Nevertheless, trade conflicts are affecting some agricultural industries, particularly in 2019. For instance, a Chinese ban of canola imports from major Canadian producers led to a decline in Canadian canola prices and is expected to weigh on exports.
After expanding in 2018, imports are expected to decline slightly in 2019, mainly reflecting softer domestic demand and the contraction of the auto sector. Import growth should then increase gradually over the remainder of the projection horizon, consistent with the pickup in business investment growth.
CPI inflation to be close to 2 per centThe return of CPI inflation to close to 2 per cent is expected to occur earlier than in the January Report. With oil prices somewhat firmer than previously assumed, the drag from gasoline prices is now anticipated to be smaller.
However, gasoline prices are expected to contribute negatively to infla-tion through most of 2019. Meanwhile, a temporary surge in airfare and the implementation of the new federal carbon pollution charge on fossil fuels are anticipated to provide a modest boost to inflation. As a result, inflation is expected to be close to 2 per cent in the second quarter of 2019 (Chart 16).
Chart 16: CPI infl ation is expected to be close to 2 per centContribution to the deviation of infl ation from 2 per cent, quarterly data
CPI infl ation (year-over-year percentage change, left scale)
Output gap (right scale) Exchange rate pass-through (ERPT) (right scale) Commodity prices, excluding ERPT* (right scale) Other factors (right scale) Carbon pollution charge (right scale)
Note: Numbers may not add to total because of rounding.
* This also includes the effect on infl ation of the divergence from the typical relationship between gasoline and crude oil prices.
Sources: Statistics Canada and Bank of Canada estimates, calculations and projections
%
2018 2019 2020 2021-1.0
-0.5
0.0
0.5
1.0
1.0
1.5
2.0
2.5
3.0Percentage points
CanaDian EConoMy 21 banK oF CanaDa • MonEtaRy PoliCy REPoRt • aPRil 2019

Inflation is forecast to remain close to 2 per cent through 2020 and 2021. Modest excess capacity is expected to subtract about 0.1 percentage point from inflation in 2020, while the annual increase in the federal carbon pollu-tion charge adds less than 0.1 percentage point.
The base-case projection provides the Bank’s view of the most likely out-come for inflation, although any projection is subject to considerable uncertainty. Based on the past distribution of private sector forecasts, a rea-sonable range around the base-case projection for CPI inflation is ±0.3 per-centage points. A complementary perspective is provided using statistical analysis of the Bank’s forecast errors. This perspective suggests that a 50 per cent confidence band around the base-case projection widens from ±0.2 percentage points in the second quarter of 2019 to ±0.6 percentage points by the end of 2021. Over the same period, a 90 per cent confidence band widens from ±0.6 to ±1.4 percentage points.
The projection is consistent with medium- and long-term inflation expect-ations remaining well anchored. Almost all respondents to the spring Business Outlook Survey continue to anticipate inflation will remain within the Bank’s target range of 1 to 3 per cent over the next two years, although more now expect inflation to be in the lower half of the range. The March 2019 Consensus Economics forecast for CPI inflation is 1.7 per cent in 2019 and 2.0 per cent in 2020. Responses to a quarterly question on long-term inflation expectations show an average of 1.9 per cent through 2029.
22 CanaDian EConoMy banK oF CanaDa • MonEtaRy PoliCy REPoRt • aPRil 2019

Risks to the inflation outlookThe outlook for inflation is subject to several upside and downside risks. Overall, the Bank assesses that the risks to the projected path for inflation are roughly balanced. The evolution since January of some of the key risks is summarized in Table 4. As in past reports, the focus is on those risks identified as the most important to the projected path for inflation, drawing from a larger set of risks considered in the projection.
(i) Global trade tensions ( and )This risk relates to trade policy conflicts between the United States and its trading partners, the fact that the Canada-United States-Mexico Agreement (CUSMA) has yet to be ratified and the further extension of Brexit negotiations.
If tensions persist or escalate, Canadian exports and business invest-ment could suffer from additional weakening in foreign demand, a disruption in global value chains, falling business confidence and lower commodity prices. At the same time, inflationary pressures could result from a lower Canadian dollar or the increase in global input costs associated with higher tariffs and lower productivity.
If the United States and China were to reach a broad agreement on trade issues, global and Canadian economic activity would be stronger than in the base-case projection. As well, the near-term upward pressure on prices from tariffs would be removed.
(ii) Stronger real GDP growth in the United States ()US GDP growth could be stronger than in the base-case projection if recent US tax and regulatory changes boost US investment and potential output growth by more than anticipated. It is also possible that additional US fiscal stimulus measures could be enacted to avoid a material decline in growth in 2020. Canadian investment and exports would both benefit from stronger US activity.
(iii) Sharp tightening of global financial conditions ()Financial conditions could tighten suddenly through an increase in government bond yields or a repricing of corporate credit, possibly triggered by higher-than-expected inflation in a major advanced economy. Higher bond yields in advanced economies could lead to large capital outflows from EMEs, exacerbating country-specific vul-nerabilities in some cases. These developments could translate into a rise in debt-service burdens, a decline in activity in sectors sensitive to interest rates, lower commodity prices and weaker global and Canadian economic growth.
RisKs to thE inFlation outlooK 23 banK oF CanaDa • MonEtaRy PoliCy REPoRt • aPRil 2019

(iv) Stronger consumption and rising household debt in Canada ( and )While consumption growth has slowed markedly in recent quarters, persistently elevated consumer confidence and solid labour income growth could lead to stronger consumer spending over the projection horizon. This outcome would be accompanied by a flat savings rate or one that has a more moderate increase than in the base-case projec-tion. However, the vulnerabilities associated with household indebted-ness would be exacerbated if the additional spending were financed by more borrowing. This would increase the impact on consumption of an adverse shock in the longer term.
(v) Weaker underlying growth in some major economies ()High levels of public and private debt in some major economies could pose a greater-than-expected drag on the growth prospects of the global economy. Countries with a high public debt could face fiscal consolidation. In addition, structural adjustment in some economies could hold back growth. Weaker global demand could lead to a decrease in commodity prices and would restrain growth of Canadian investment and exports.
(vi) More pronounced housing weakness in Canada ()Although partially realized and incorporated into a weaker outlook for housing in the base-case projection, further downside risks remain. Pronounced weakness in residential investment points to the possibility that policy changes could have even greater and more prolonged effects than previously expected. If this were the case, housing demand would be weaker than in the base-case projec-tion. This weaker demand would put additional downward pressure on house prices, notably in markets where imbalances remain. The result could be mutually reinforcing declines in house prices, housing resales and construction.
24 RisKs to thE inFlation outlooK banK oF CanaDa • MonEtaRy PoliCy REPoRt • aPRil 2019

Table 4: Evolution of risks since the January 2019 Monetary Policy Report
Risk What has happened What is being monitored
Global trade tensions � The increase of US tariffs on products from China planned for March 1 has been postponed while trade negotiations are underway. Markets have reacted positively to perceived progress in the negotiations.
� The United States and the European Union are considering increased tariffs related to the a erospace dispute.
� The European Union and the United Kingdom have agreed to a further extension on Brexit until October 31.
� Global trade growth has weakened signifi cantly over the past year.
� Trade policy developments
� Global trade fl ows
� Manufacturing output and investment
� Consumer prices
Stronger real GDP growth in the United States
� US expansion has slowed, but recent economic data continue to indicate solid growth.
� Confi dence measures remain elevated despite trade policy uncertainty.
� Productivity growth remains modest despite a recent uptick.
� Business and consumer confi dence
� Firm creation, investment and industrial production
� Labour force participation rate and labour productivity
� Fiscal policy announcements
Sharp tightening of global fi nancial conditions
� Yields on global long-term government bonds have fallen.
� Corporate bond spreads have narrowed.
� Equity markets have returned to close to their mid-2018 highs.
� Financial stress has increased in the most vulnerable emerging-market economies (EMEs).
� Long-term interest rates
� Bond term and risk premiums
� Wage and price infl ation in advanced economies
� Capital fl ows
� Exchange rates, particularly in EMEs
� Equity markets
Stronger consumption and rising household debt in Canada
� Consumption growth remained soft at 0.8 per cent in 2018Q4.
� Real retail sales in recent months have been weaker than expected.
� Income growth picked up strongly in 2018Q4 after having been much weaker than expected.
� Employment gains have been strong, and total hours worked in 2019Q1 were above 2018Q1 levels.
� The debt-to-disposable income ratio (seasonally adjusted) ticked up slightly to 178.5 per cent in 2018Q4, while the savings rate stayed relatively low at 1.1 per cent.
� Motor vehicle sales bounced back in 2019Q1.
� Consumer confi dence returned to well above its historical average in 2019Q1 after having dipped around the end of 2018.
� Retail sales
� Motor vehicle sales
� Consumer sentiment
� Household indebtedness
� Labour income
� Employment
Weaker underlying growth in some major economies
� Growth of global trade and business investment slowed at the end of 2018.
� Growth of domestic demand in China weakened in 2018Q4.
� The manufacturing sector in the euro area experienced a broad-based contraction at the end of 2018.
� Business and consumer confi dence deteriorated further in the euro area in 2019Q1.
� GDP growth in major economies
� Business and consumer sentiment indicators
� Evolution of interest-sensitive sectors
� Evolution of temporary factors
More pronounced housing weakness in Canada
� Growth in national house prices has slowed in recent months, driven by developments in British Columbia and Alberta.
� Price growth remains robust in Montréal and moderate in Toronto.
� National resales dropped, with most of the decline in Ontario.
� Housing starts have trended downward, notably for single-detached dwellings, which reached record lows.
� Mortgage credit growth remained modest.
� Housing activity and prices
� Household spending
� Regulatory environment
� Mortgage credit growth
� Employment
� Population growth
� Impact of the First-Time Home Buyer Incentive
RisKs to thE inFlation outlooK 25 banK oF CanaDa • MonEtaRy PoliCy REPoRt • aPRil 2019

appendix: Canadian Potential outputPotential output is expected to grow on average by 1.8 per cent over 2019 through 2021 and at 1.9 per cent in 2022 (Table A-1).12 Potential output growth has two components: growth in trend labour productivity (output per hour worked) and growth in trend labour input (total hours worked).
Relative to the April 2018 assessment, both trend labour productivity and trend labour input have been revised substantially. Potential output growth is, however, only slightly lower because revisions to these two components mostly offset each other (Chart A-1). Relative to April 2018, the downward revisions to both historical data and the projection for business invest-ment lead to less accumulation of capital, which implies slower growth in trend labour productivity. The main driver for the weaker outlook for busi-ness investment growth is the more-intense challenges in the energy sector. Meanwhile, trend labour input growth is revised up, mostly due to stronger immigration and a higher number of non-permanent residents than in last year’s assessment.
Over time, trend labour productivity growth is expected to rise from 0.7 per cent in 2019 to 1.1 per cent in 2022, roughly its long-term average. Trend labour productivity growth has been below its long-term average in recent years, primarily due to the economy adjusting to lower commodity prices and suppressed investment related to uncertainty.
12 For more details, see D. Brouillette, J. Champagne, C. Khoury, N. Kyui, J. Mollins and Y. Park, “Potential Output in Canada: 2019 Reassessment,” Bank of Canada Staff Analytical Note No. 2019-10 (April 2019).
Table A-1: Projected growth rate of potential outputYear-over-year percentage change*†
Potential output Trend labour inputTrend labour productivity
Potential output range
2018 1.8(1.8)
1.1(0.7)
0.7(1.0)
1.5–2.1
2019 1.8(1.8)
1.1(0.6)
0.7(1.1)
1.5–2.1
2020 1.7(1.8)
0.8(0.6)
0.9(1.2)
1.3–2.1
2021 1.8(1.9)
0.8(0.5)
1.0(1.4)
1.2–2.4
2022 1.9 0.8 1.1 1.3–2.5
* Numbers in parentheses are from the April 2018 Monetary Policy Report.
† Numbers may not add to total due to rounding.
aPPEnDix: CanaDian PotEntial outPut 27 banK oF CanaDa • MonEtaRy PoliCy REPoRt • aPRil 2019

Trend labour input growth is estimated to slow from 1.1 per cent in 2019 to 0.8 per cent in 2022. The declining growth rate mainly reflects the aging of the population. For instance, the trend employment rate is expected to con-tinue declining because older workers (those 55 years old or older) are less likely to be employed than younger workers and, when employed, typically work fewer hours. Immigration will remain important because it will account for about three-quarters of the growth of Canada’s population and will pro-vide some offset to population aging.
Potential output is highly uncertain because its components are unobserved and difficult to forecast. To capture uncertainty, a range is constructed around midpoint estimates. The outlook for potential output is subject to upside and downside risks, including uncertainty related to business invest-ment, the pace of technological progress and structural changes to the labour market.
� The outlook for business investment depends on how the oil and gas sector adapts to sectoral developments and on the persistence of trade policy uncertainty. How these factors evolve could tilt the profiles of trend labour productivity and potential output above or below the estimates in the base case.
� Technological improvements generally boost potential output. Artificial intelligence and digitalization, for example, are expected to increase labour productivity in the long run. The magnitude and timing of the effects on potential output of these and other new technologies are, how-ever, uncertain.
� New disruptive technologies may result in resources being reallocated across sectors during a transition period. Depending on whether these new technologies lead to fewer or more jobs, the impact on trend labour input could be negative or positive.
Chart A-1: Potential output growth has been revised down slightlyRevisions to percentage change relative to April 2018, annual data
Trend labour input Trend labour productivity Potential output
Note: Revisions to trend labour input and trend labour productivity may not sum to the revisions to potential output due to rounding.
Sources: Statistics Canada and Bank of Canada estimates and projections
2014 2015 2016 2017 2018 2019 2020 2021-0.6
-0.4
-0.2
0.0
0.2
0.4
0.6Percentage points
28 aPPEnDix: CanaDian PotEntial outPut banK oF CanaDa • MonEtaRy PoliCy REPoRt • aPRil 2019


![Canada Gazette, Part I2019/11/09 · 2019-11-09 Canada Gazette Part I, Vol. 153, No. 45 Gazette du Canada Partie I, vol. 153, no 45 4168 Stephen S. Poloz Governor [45-1-o] Carmen](https://img.pdfslide.us/doc/110x75/5f0e70187e708231d43f3ea7/canada-gazette-part-i-20191109-2019-11-09-canada-gazette-part-i-vol-153.jpg)