Embed Size (px)
Citation preview
British Journal of Marketing Studies
Vol.4, No.1, pp.72-94, February 2016
___Published by European Centre for Research Training and Development UK (www.eajournals.org)
72
ISSN 2055-0219(Print), ISSN 2055-0227(online)
AN EMPIRICAL STUDY OF MARKETING MIX AS A SATISFACTION TOOL IN
MODERN SPORT ADMINISTRATION IN GHANA
Isaac Theophilus Ampah
Takoradi Polytechnic, School of Business, Department of Marketing
P.O.Box 256 Takoradi, Ghana, West Africa.
ABSTRACT: This paper aimed at (i) finding the extent of marketing mix adoption among
sport institutions (ii) investigating the factors which prevent successful implementation of
marketing mix by sport institutions (iii) identifying whether marketing mix adoption really
leads to sport customers’ satisfaction (iv) highlighting any other findings which are relevant
and can contribute towards effective marketing mix adoption by sport institutions in Ghana.
The research took place in Takoradi Polytechnic, School of Business Studies, Department of
Marketing. From October- 2015-Decemeber 2015. Structured self-completed questionnaires,
journal, internet, books and Sport ministry of Ghana manuals were methodology used to collect
data. 450 respondents from five main sport disciplines, sport stakeholders’ groups and
Ghanaian sport customers were purposively selected. Data was analyzed using frequencies,
mean, standard deviation, squared multiple correlation and cronbach alpah. 12 board
members, 25 Chief executive officers, 30 Operating managers, 40 Coaching managers and 93
Other sport officials (Sport administration) and 146 sport customers, 24 sport sponsors, 30
sport development members, 25 sport advocate and 25 other sport stakeholders (Sport
stakeholders) were sampled from 10 million Ghanaian sport customers (18 years and above
and of sound mind). Source-Ministry of Youth and Sport, Ghana. Summary of views of
respondents (Sport administrators) about marketing mix as a satisfaction tool on Likert scales
( 1=strongly disagree, 2 = disagree, 3= neutral, 4= agree and 5 strongly agree) is medium.
Also, from Sport stakeholders’ perspective effectiveness of marketing mix adoption among
sport institutions is medium. The study concluded that marketing mix adoption among sport
institutions in Ghana is medium and also its usage as a satisfaction tool is effective for Sport
administrators and ineffective for Sport stakeholders. Furthermore, it was discovered that the
7ps (product, price, promotion, place, people, process and physical evidence.) on their own
are not enough to satisfy sport customers’ needs/wants.
KEYWORD: Marketing Mix, Sport Customer Satisfaction and Sport Institutions
INTRODUCTION
For sport customers’ satisfaction to be realised marketing mix application is essential in modern
sport administration. Once sport customers’ needs/wants keep changing so must sport
administrators’ all over the world embrace marketing mix application seriously than ever
before. According Schwarz and Hunter (2008) sport institutions seek sport customer support
in exchange for good financial return. Marketing mix is a combination of four factors which
managers may leverage to satisfy customers’ needs/wants (McCarthy,1964). The marketing
mix is also known as 4ps summarily ie product, price, promotion and place. Boom and Bitner
(1981) extended the 4ps to 7ps to include people, process and physical evidence to cover
services provision.
British Journal of Marketing Studies
Vol.4, No.1, pp.72-94, February 2016
___Published by European Centre for Research Training and Development UK (www.eajournals.org)
73
ISSN 2055-0219(Print), ISSN 2055-0227(online)
Despite marketing mix global recognition and acceptance as a satisfaction tool, its effectiveness
in sport administration setting is under research. This demands that sport administrators should
do their possible best to satisfy different sport stakeholders particularly sport customers.
Fullerton and Merz (2008) added marketing mix application cannot be ignored if needs/wants
of sport customers are to be met. To achieve this objective, marketing mix application within
sport administration should be given the needed attention it deserves so as to satisfy various
varying needs/wants of sport stakeholders.
Full implementation of the 7ps including customer orientation and employment of qualified
marketing personnel would go a long way to enhance the effectiveness of marketing practice
within sport administration setting. Research has shown that even though marketing mix
application in sport administration has its genesis from Advertising Age where it is
characterised as usage of sport as a promotional vehicle for activities of consumers and
industrial product and services. Nevertheless, this feat can be realised if sport administrators
undertake a reasonable time frame of effective marketing practices. On many instances
application of marketing mix to sporting issues is seen as over simplification and media-hype
(Constantinescu, 2009).
This common feature of marketing practice of sport institutions can hardly aid sport customers’
needs/wants satisfaction. Thus to prepare sport institutions to fully maximise sport customers’
needs/wants it is relevant to fill the vacuum created by doubt about marketing mix applicability
in sport administration setting to have the same effect like the one practiced in commercial
marketing. As sport institutions enhance marketing practice they should also appreciate not
only how to give excellent sport product offering to sport fans and participants but also they
should also establish lasting win-win relationship with all sport stakeholders. Application of
sport marketing mix should involve all 7ps but not communication (Shilbury, 2009) as is being
done by some sport institutions. If sport institutions take marketing mix application seriously
and systematically enrol marketing infrastructure and engage the services of qualified
marketing personnel then sport customers’ satisfaction which is low among them can be
improved to deepened sport fans and participants participation in sporting programmes and
decision-making process in most developing countries for better sport advancement.
Considerable attention has been paid to sport institutions and sport customers’ satisfaction in
relation to improved entertainment, fitness and health for the populace. However, despite the
essential role sport customer satisfaction plays in very good entertainment, fitness and health
little attention has been given to this subject matter within the published research literature
especially in developing economies. The lack of adequate attention to effective marketing mix
application in terms of effective sport customer satisfaction at sport administration setting level
creates a gap in academic literature. Thus, this study aimed at capturing the essential knowledge
and experiences of both sport administrators and sport stakeholders to make an empirical
analysis of the effectiveness of marketing mix application at sport administration setting.
LITERATURE REVIEW
Marketing in General
According to Scammell ( 1999) among the various definitions of marketing, the marketing mix
concept (customer-oriented approach) and the notion of exchange is the centre of them.
British Journal of Marketing Studies
Vol.4, No.1, pp.72-94, February 2016
___Published by European Centre for Research Training and Development UK (www.eajournals.org)
74
ISSN 2055-0219(Print), ISSN 2055-0227(online)
Marketing is about finding and meeting social needs while being profitable at the same time
(Kotler and Keller, 2014). Also, American Marketing Association (2014) defined marketing as
the activity, set of institutions and processes for establishing, communicating, delivering and
exchanging offerings that have value for customers and larger societal needs in both short and
long terms. Kotler and Keller (2014) said marketing is an art and science of selecting segment,
getting, keeping and growing customers through creation, delivery and communication of
superior customers’ value.
Marketing Practices in Sport
Philip Kotler and Sidney Levy challenged marketing’s obsession with commercial activity
(Newman, 1999a). Kotler and Zaltman (1971) argued marketing practice benefit non-profitable
organization. This started the need to study and develop understandable meaning of marketing
in non-commercial sectors (Newman, 1999a; Wring 2002b) . With increasing desire in new
academic literature also commenced the area of sport in marketing (Teel, 1994). Even though
marketing practices in sport is at an early phase studies have revealed that service quality as a
predictor of customer satisfaction and game attendance have received some attention
(Greenwell et al and Wakefield and Blodgett 1996). Developing literature on marketing
practices in sport seems to be specific to communication and facilities’ atmosphere (Greenwell,
2001). Marketing practices in sport is not accepted universally by all sport practitioners and
academics alike. There are sections of sport scientists who agree that marketing in sport science
landscape gives it some level of uniqueness. In another breadth there other sport scientists who
argued that marketing in sporting activities is mere customer persuasion and profit making tool
(Smith, 2008).
Marketing mix Variables of Marketing Practices in Sport
According to Schwarz and Hunter (2008) sport administrators should integrate the 7ps to
achieve the desired impact on their sporting activities for better customer satisfaction.
Schlossberg (1996) even advocate the stretching of the 7ps to make much sense in marketing
practice in sport administration. The following are the mix variables in sport context;
Sporting product: A product is anything that satisfies a need or want and is acquired to so do.
According to Fullerton (2007) there are two perspective to sport product namely the core
product which is the actual game or sport activity which marketers has no control over and
secondly product extensions to the overall marketing efforts. It is here that the marketers can
ensure that acceptable levels of quality are achieved. Since there is no take away by customers
the sport organization can give some intangible benefits such as lifestyle, a social group or even
a belief system. Pitts and Stotlar (2007) also added sport product should include design,
packaging and merchandise. Packaging the sport product also involves presenting the product
in the best possible manner to motivate selected target customers to buy it.
Sporting price: The price of a product represents what a consumer relinquishes in exchange
for sporting goods/services (Schwarz & Hunter, 2008). A price should also reflect the value of
a product. Pricing which is seen from financial lenses may include other things that a customer
has to give up in order to obtain the product, such as time for waiting in a queue or social cost
like being a organ learning class with others instead of a one-on-one instruction. According to
Constantinescu (2009) price is the factor that is most visible and flexible especially as a result
of sales, discounts, rebates and coupons. Also, pricing is influenced by other external factors
British Journal of Marketing Studies
Vol.4, No.1, pp.72-94, February 2016
___Published by European Centre for Research Training and Development UK (www.eajournals.org)
75
ISSN 2055-0219(Print), ISSN 2055-0227(online)
such as economic situation, governmental regulations and political decisions. It is also complex
and essential for the success of marketing goals.
Sporting promotion: The word promotion in sport covers a range of interrelated activities.
All of these activities are designed to attract attention, encourage the interest and awareness of
consumers and motivate them to purchase a sport product. It is also about communicating and
educating consumers. It consists of all forms of communication with consumer not just
advertising. According to Shilbury et al (2009) promotion is best seen as the manner that
marketers communicate with consumers to inform, persuade and remind them about a product.
It can also be used to develop a favourable opinion about a sport product which is aligned to a
predetermined positioning strategy and then to stimulate consumers to try the sport product.
Sport promotion mixes include advertising, sponsorship, PR, licensing, incentives, personal
contact and atmospherics.
Sporting distribution (Place): This is the process of getting the sport product to sport
consumer. Also, sporting place refers to the location of the sport product, the point of origin
for distributing the product, the geographical location of the target markets as well as other
channels that are vital to consider regarding whether target audience may access the product.
It can refers to outlets consumers may use to receive the product experience. According to
Wakefield and Blodgett (1996) place includes layout, accessibility, facilities’ aesthetics,
seating comfort, electronic equipment and facility cleanliness. .
Sporting physical evidence: This is the visual and/or tangible clues of sport service product
such as the design and construction of the sporting facility and in general the aesthetics
(Mullins, Hardy and Sutton, 2000).
Sporting process: This refers to the manner in which sporting products are delivered to sport
customer. It should be customers’ need centred where their various needs and wants are made.
As sport customers need/wants change so should the various processes have to be varied in line
with these changes for the them to be relevant (Ferrand and McCarthy, 2009).
Sporting people: This refers to the employees and other contract staff who are responsible for
delivering the event and sporting programs. They are a major distinguishing quality factor in
the consumption process ( Constantinescu, 2009)..
Sport Customer Satisfaction
Kotler (2014) said satisfaction is the feeling of happiness because one has something or has
achieved something of value. Kolter and Armstrong (2014) also added that satisfaction is state
of happiness or disappointment that comes from the comparison of a perceived performance of
a product relative to its expectations. They continue by saying that satisfaction is action which
is meeting a genuine, desire, demand and expectation. It is undeniable fact that sport customers
compare their expectations concerning specific sporting promise with actual achievement of
particular sport institution to decide whether to participant or attend the next sporting events.
According Wakefield and Blodgetts (1996) there is a relationship between sport customers’
service quality perception, customer satisfaction and repurchase intentions. Greenwell (2001)
also suggested that there is relationship between of sport customer satisfaction and financial
profitability.
British Journal of Marketing Studies
Vol.4, No.1, pp.72-94, February 2016
___Published by European Centre for Research Training and Development UK (www.eajournals.org)
76
ISSN 2055-0219(Print), ISSN 2055-0227(online)
Marketing in Sport Conceptulization
The concept underpinning the research is based on Caro and Garcia (2007b) cognitive –
affective studies on consumer satisfaction and marketing sporting events. Caro and Garcia
(2007b) looked at consumer satisfaction in sporting events and concluded that there is direct
relationship between the arousal, pleasure, loyalty and disconfirmation. Oliver (1980) also
added through his expectancy model customer satisfaction depends on a comparison between
pre-purchase expectations (ie the expectation towards a product or service before purchase or
consumption) and consumption outcomes ( the experience towards a product or service after
purchase or consumption).
Most of the time, it has been argued that marketing practice adoption in sport administration is
nothing new. Over the last two decades marketing practices in sport have not been taken
seriously by only sport institutions but also sport development and sport advocacy groups
which are demanding better sport customer needs satisfaction (Schwarz & Hunter,
2008).Marketing practices in sport administration have changed from communication
techniques to more coordinated usage of the 7ps. However, most sport institutions are far away
from understanding and embracing marketing mix. It is undeniable fact those sport institutions
that do adopt marketing practices only engage in short term marketing techniques which has
resulted in sport customer apathy and less participation in sport programmes and decision
making process for advancement of sport development. Since sport customers ’do not only
participate in sporting events once in their lifetime sport institutions have to focus not only
satisfying their short-term needs but long term needs as well to further develop sport
programmes.
METHODOLOGY
Data was collected from two groups of respondents’ namely sport administrators and sport
stakeholders within the sport administration in Ghana. In total 450 respondents were selected
from both sport administrators and sport stakeholders. 12 board members, 25 chief executive
officers, 30 operation managers, 40 coaching and 93 other sport officials were selected from
sport administration side. On the other hand, 146 sport customers, 24 sport sponsors, 30 sport
development members, 25 sport advocate and 25 other stakeholders from sport stakeholder
side. Data was collected through two sets of self-completed questionnaires to both sport
administrators and sport stakeholders that permitted respondents to complete them at their own
free time in order to lessen interruptions to those participating sport institutions’ activities. Both
set of questionnaires dealt with effectiveness of marketing mix application and sport customer
satisfaction within sport administration setting. The questionnaire was developed in such a way
that the structure, focus and phrasing of questions was intelligible with respondents, reduced
bias and provided data that could be statistically analysed (Gill and Johnson,2006). A five point
Likert scale was utilised with responses ranging from ‘strongly disagree, disagree, neutral,
agree and strongly agree’. Closed ended questions were also used to permit for collection of
more depth data. Total of 465 questionnaires were sent out which saw sport administrators and
sport stakeholders groups having 90% and 95% respectively. Non probability purposive
sampling method which consists of selection of respondents with knowledge and experience
with sport marketing practices was utilised. Lastly, quantitative data was used to analyse using
Statistical Packages for Social Science (SPSS) version 21 and Microsoft Excel 2013.
British Journal of Marketing Studies
Vol.4, No.1, pp.72-94, February 2016
___Published by European Centre for Research Training and Development UK (www.eajournals.org)
77
ISSN 2055-0219(Print), ISSN 2055-0227(online)
DATA AND INFORMATION DESCRIPTION
Basically, two data and information sources were used to describe the study. These included a
survey method that issued self-completion structured questionnaire to gather data from
respondents. The researcher also used various sport marketing publications such as journals,
books, reports, and manual and internet sources to gather more information to help answer the
various objectives. The descriptive approach used by the researcher implied that data and
information were described with the help of Statistical Package for Social Science (SPSS)
version 21, Minitab version 16, and Microsoft Excel. Descriptive tools such as frequency table,
mean, standard deviation, squared multiple correlation and cronbach alpha were also used.
Analysis of the Questionnaire (Sport Administrators)
This section of the study reports on the results of the analysis and discussion of data collected.
Its flow assumes the sequence in which designated objectives of the study were ordered. The
chapter is presented under the following sub sections:
1. Reliability/Validity Test
2. Respondents Profile
3. The Extent of Marketing Mix Variables Adoption in Ghanaian Sport Administration
Setting
4. Factors That Hinder Smooth Adoption of Marketing Mix Variables in Sport
Administration
5. Whether Effective Adoption of Marketing Mix Variable Really Lead to Sport Customer
Satisfaction
6. Thing that can Contribute to Effective Marketing Practices at Sport Administration
Setting.
Reliability/Validity Test
A reliability/validity test using Cronbach Alpha; resulting in a reliability coefficient of 0.869
which was above the recommended minimum of 0.7 (Santos & Reynolds, 1999) was conducted
on all 51 items (variables) used in the study (see Table 1). It can however be inferred that
variables assigned for the study were 87% reliable and valid to be used for further analysis or
study. The study however achieved a response rate of 0.901 (approximately 90%).
Table 1: Reliability/Validity Statistics
N % Cronbach's Alpha No. of variables
200 100 0.869 51
Source: output from SPSS
Respondents Profile
This section of the study reports on type of stakeholder organization/person against gender, age
and educational level. It also reports on current position and number of years worked in the
current position, how long marketing practices has been adopted and to what extent has these
practices been used as shown in the below Table 2, 3 and 4.
British Journal of Marketing Studies
Vol.4, No.1, pp.72-94, February 2016
___Published by European Centre for Research Training and Development UK (www.eajournals.org)
78
ISSN 2055-0219(Print), ISSN 2055-0227(online)
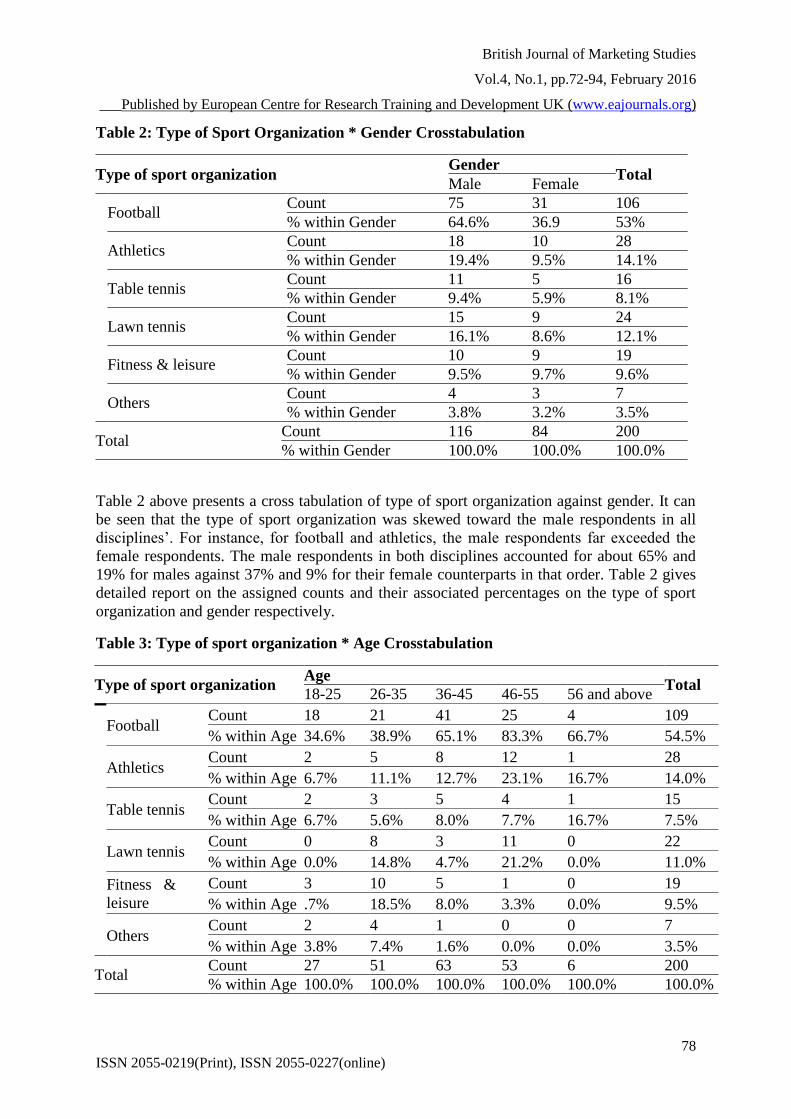
Table 2: Type of Sport Organization * Gender Crosstabulation
Type of sport organization Gender
Total Male Female
Football Count 75 31 106
% within Gender 64.6% 36.9 53%
Athletics Count 18 10 28
% within Gender 19.4% 9.5% 14.1%
Table tennis Count 11 5 16
% within Gender 9.4% 5.9% 8.1%
Lawn tennis Count 15 9 24
% within Gender 16.1% 8.6% 12.1%
Fitness & leisure Count 10 9 19
% within Gender 9.5% 9.7% 9.6%
Others Count 4 3 7
% within Gender 3.8% 3.2% 3.5%
Total Count 116 84 200
% within Gender 100.0% 100.0% 100.0%
Table 2 above presents a cross tabulation of type of sport organization against gender. It can
be seen that the type of sport organization was skewed toward the male respondents in all
disciplines’. For instance, for football and athletics, the male respondents far exceeded the
female respondents. The male respondents in both disciplines accounted for about 65% and
19% for males against 37% and 9% for their female counterparts in that order. Table 2 gives
detailed report on the assigned counts and their associated percentages on the type of sport
organization and gender respectively.
Table 3: Type of sport organization * Age Crosstabulation
Type of sport organization Age
Total 18-25 26-35 36-45 46-55 56 and above
Football Count 18 21 41 25 4 109
% within Age 34.6% 38.9% 65.1% 83.3% 66.7% 54.5%
Athletics Count 2 5 8 12 1 28
% within Age 6.7% 11.1% 12.7% 23.1% 16.7% 14.0%
Table tennis Count 2 3 5 4 1 15
% within Age 6.7% 5.6% 8.0% 7.7% 16.7% 7.5%
Lawn tennis Count 0 8 3 11 0 22
% within Age 0.0% 14.8% 4.7% 21.2% 0.0% 11.0%
Fitness &
leisure
Count 3 10 5 1 0 19
% within Age .7% 18.5% 8.0% 3.3% 0.0% 9.5%
Others Count 2 4 1 0 0 7
% within Age 3.8% 7.4% 1.6% 0.0% 0.0% 3.5%
Total Count 27 51 63 53 6 200
% within Age 100.0% 100.0% 100.0% 100.0% 100.0% 100.0%
British Journal of Marketing Studies
Vol.4, No.1, pp.72-94, February 2016
___Published by European Centre for Research Training and Development UK (www.eajournals.org)
79
ISSN 2055-0219(Print), ISSN 2055-0227(online)
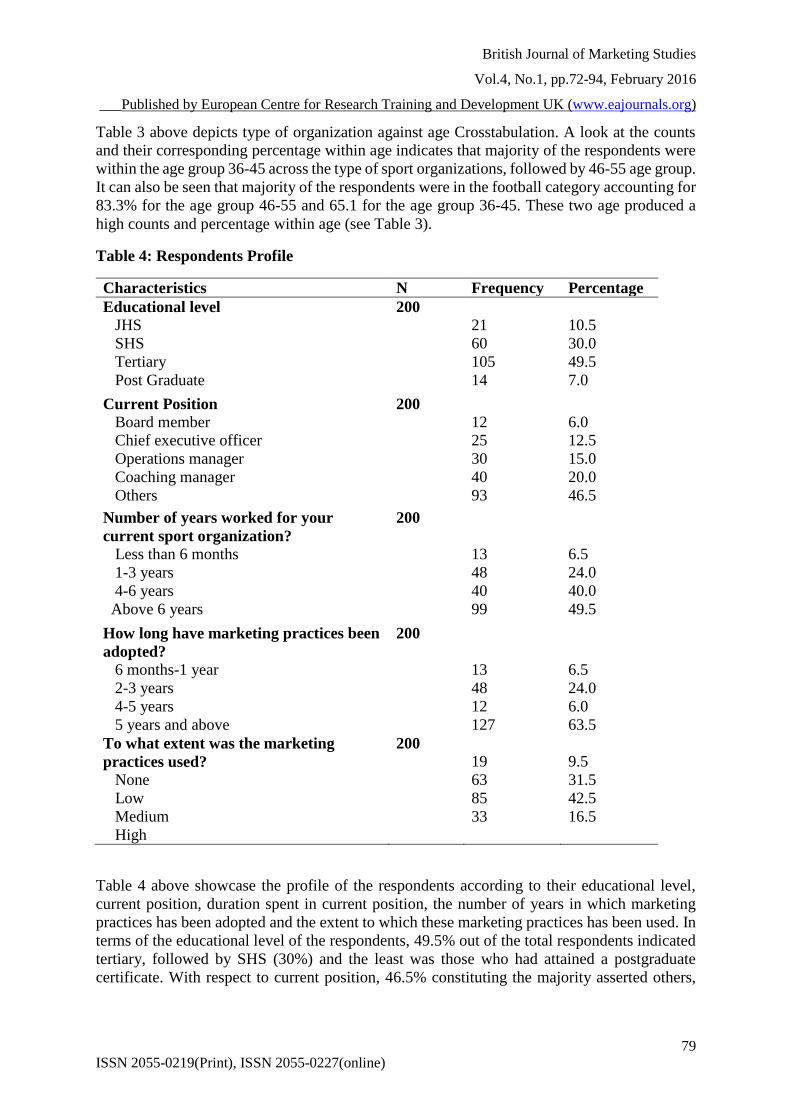
Table 3 above depicts type of organization against age Crosstabulation. A look at the counts
and their corresponding percentage within age indicates that majority of the respondents were
within the age group 36-45 across the type of sport organizations, followed by 46-55 age group.
It can also be seen that majority of the respondents were in the football category accounting for
83.3% for the age group 46-55 and 65.1 for the age group 36-45. These two age produced a
high counts and percentage within age (see Table 3).
Table 4: Respondents Profile
Characteristics N Frequency Percentage
Educational level
JHS
SHS
Tertiary
Post Graduate
200
21
60
105
14
10.5
30.0
49.5
7.0
Current Position
Board member
Chief executive officer
Operations manager
Coaching manager
Others
200
12
25
30
40
93
6.0
12.5
15.0
20.0
46.5
Number of years worked for your
current sport organization?
Less than 6 months
1-3 years
4-6 years
Above 6 years
200
13
48
40
99
6.5
24.0
40.0
49.5
How long have marketing practices been
adopted?
6 months-1 year
2-3 years
4-5 years
5 years and above
200
13
48
12
127
6.5
24.0
6.0
63.5
To what extent was the marketing
practices used?
None
Low
Medium
High
200
19
63
85
33
9.5
31.5
42.5
16.5
Table 4 above showcase the profile of the respondents according to their educational level,
current position, duration spent in current position, the number of years in which marketing
practices has been adopted and the extent to which these marketing practices has been used. In
terms of the educational level of the respondents, 49.5% out of the total respondents indicated
tertiary, followed by SHS (30%) and the least was those who had attained a postgraduate
certificate. With respect to current position, 46.5% constituting the majority asserted others,
British Journal of Marketing Studies
Vol.4, No.1, pp.72-94, February 2016
___Published by European Centre for Research Training and Development UK (www.eajournals.org)
80
ISSN 2055-0219(Print), ISSN 2055-0227(online)
followed by coaching manager (20%), operations manager (15%) chief executive officer and
board member accounted for 12.5% and 6.0% in turn.
Number of years worked for your current sport organization saw less than 6 months (6.5%), 1-
3 years (24%), 4-6 years (40%) and above 6 years (49%) indicating that majority of the
respondents’ have worked for more than 6 years in sport organization. Subsequently,
respondents were also skewed to 5 years and above inn relation to the variable “how long have
marketing practice bee adopted”, this accounted for about 64% out of the total respondents
whilst the least was 6 months to 1 year accounted for only 6% of the total respondents (see
Table 4). Also to what extent was the marketing practices used recorded medium (42.5%), low
(31.5%) and None (9.5%). This shows that among sport administrators, marketing practice is
used in a medium and low term compared to high term.
The Extent of Marketing Mix Variables Adoption in Ghanaian Sport Administration
Setting
This section of the study examines the extent of marketing mix variables adoption by Ghanaian
sport administration setting. The study required respondents to rate on a scale of 1-5 their level
of level of understanding to the extent of marketing mix variables adoption in Ghanaian sport
administration settings (see Table 5).
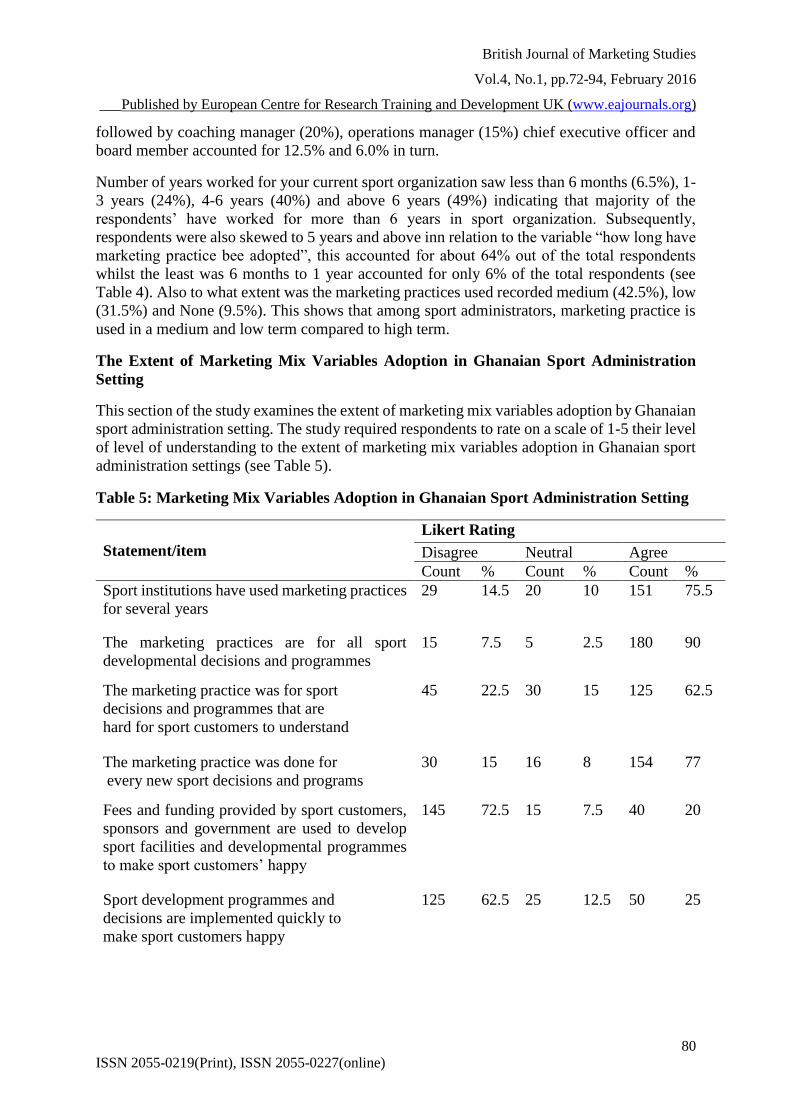
Table 5: Marketing Mix Variables Adoption in Ghanaian Sport Administration Setting
Statement/item
Likert Rating
Disagree Neutral Agree
Count % Count % Count %
Sport institutions have used marketing practices
for several years
29 14.5 20 10 151 75.5
The marketing practices are for all sport
developmental decisions and programmes
15 7.5 5 2.5 180 90
The marketing practice was for sport
decisions and programmes that are
hard for sport customers to understand
45 22.5 30 15 125 62.5
The marketing practice was done for
every new sport decisions and programs
30 15 16 8 154 77
Fees and funding provided by sport customers,
sponsors and government are used to develop
sport facilities and developmental programmes
to make sport customers’ happy
145 72.5 15 7.5 40 20
Sport development programmes and
decisions are implemented quickly to
make sport customers happy
125 62.5 25 12.5 50 25
British Journal of Marketing Studies
Vol.4, No.1, pp.72-94, February 2016
___Published by European Centre for Research Training and Development UK (www.eajournals.org)
81
ISSN 2055-0219(Print), ISSN 2055-0227(online)
Sport customers are made to be part of
decision making process to improve sport
facilities and development programmes
27 13.5 18 9 155 77.5
Sport customers are made aware of all
sporting decisions and developmental
programmes
160 80 15 7.5 25 12.5
Sport organizations’ employees and officials are
helpful, friendly and respectful
19 9.5 10 5 171 85.5
Marketing Practices forms part of long term
thinking of sport organizations
45 22.5 20 10 135 67.5
A general look at the responses by respondents to the various statement shows that respondents
(sport administrators) endorses (agree) to 8 out of the 11 statements on the extent of marketing
mix variables adoption in Ghanaian sport administration setting (see Table 5). The statements:
“Sport institutions have used marketing practices for several years”; “The marketing practices
are for all sport developmental decisions and programmes”; “The marketing practice was for
sport decisions and programmes that are hard for sport customers to understand”; “Sport
organizations’ employees and officials are helpful, friendly and respectful”; and “Marketing
Practices forms part of long term thinking of sport organizations” produced 62.5%; 85.5%,
67.5%; 75.5% and 90% in that order to show the extent to which they agree to the above
statements.
However, respondents (sport administrators) extensively disagrees with the statements: “Fees
and funding provided by sport customers, sponsors and government are used to develop sport
facilities and developmental programmes to make sport customers’ happy”; “Sport customers
are made aware of all sporting decisions and developmental programmes” and “Sport
customers are made aware of all sporting decisions and developmental programmes” these
accounted for 72.5%; 62.5% and 80% in turn (see Table 5).
Factors That Hinder Smooth Adoption of Marketing Mix Variables in Sport
Administration
This segment of the study reports on the factors that hinder smooth adoption of marketing mix
variables in sport administration as shown in Table 6 below.
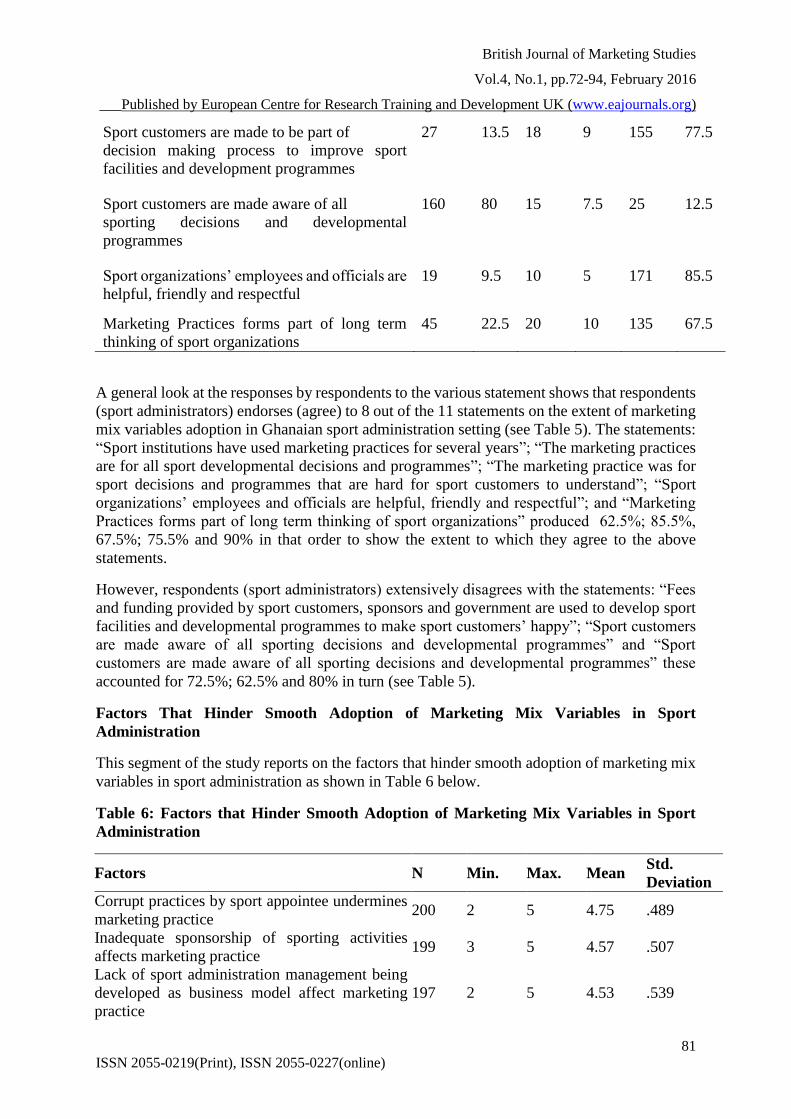
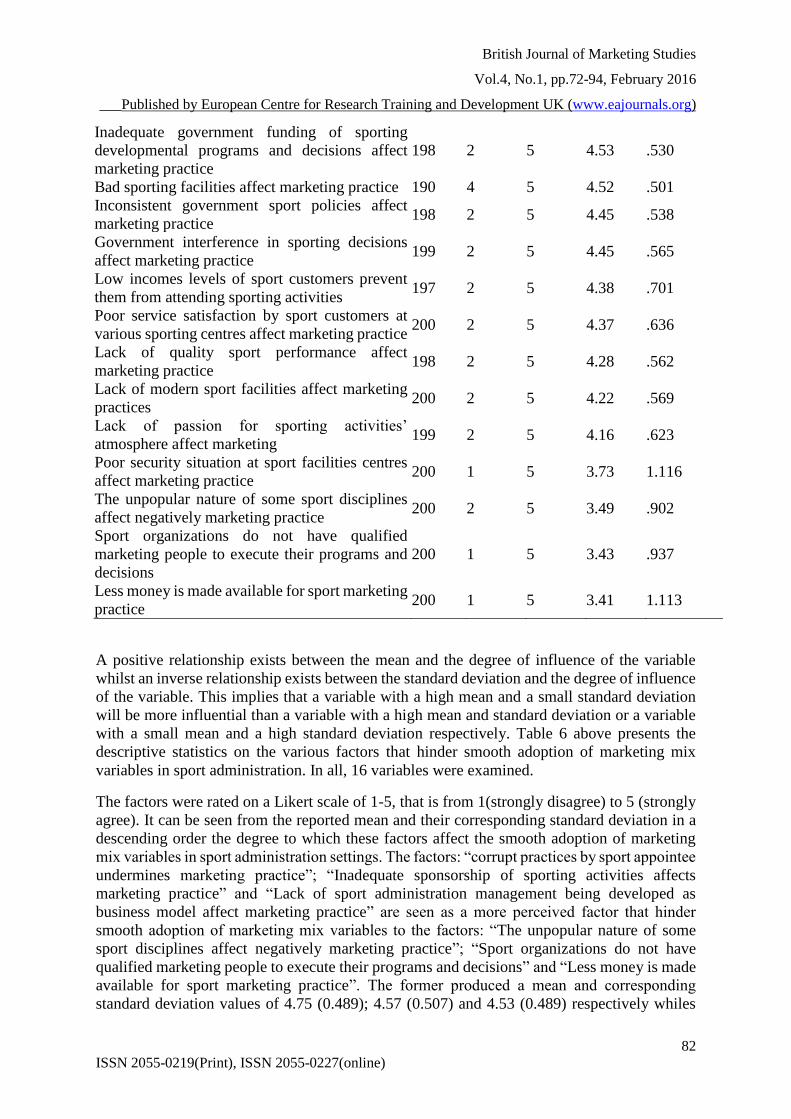
Table 6: Factors that Hinder Smooth Adoption of Marketing Mix Variables in Sport
Administration
Factors N Min. Max. Mean Std.
Deviation
Corrupt practices by sport appointee undermines
marketing practice 200 2 5 4.75 .489
Inadequate sponsorship of sporting activities
affects marketing practice 199 3 5 4.57 .507
Lack of sport administration management being
developed as business model affect marketing
practice
197 2 5 4.53 .539
British Journal of Marketing Studies
Vol.4, No.1, pp.72-94, February 2016
___Published by European Centre for Research Training and Development UK (www.eajournals.org)
82
ISSN 2055-0219(Print), ISSN 2055-0227(online)
Inadequate government funding of sporting
developmental programs and decisions affect
marketing practice
198 2 5 4.53 .530
Bad sporting facilities affect marketing practice 190 4 5 4.52 .501
Inconsistent government sport policies affect
marketing practice 198 2 5 4.45 .538
Government interference in sporting decisions
affect marketing practice 199 2 5 4.45 .565
Low incomes levels of sport customers prevent
them from attending sporting activities 197 2 5 4.38 .701
Poor service satisfaction by sport customers at
various sporting centres affect marketing practice 200 2 5 4.37 .636
Lack of quality sport performance affect
marketing practice 198 2 5 4.28 .562
Lack of modern sport facilities affect marketing
practices 200 2 5 4.22 .569
Lack of passion for sporting activities’
atmosphere affect marketing 199 2 5 4.16 .623
Poor security situation at sport facilities centres
affect marketing practice 200 1 5 3.73 1.116
The unpopular nature of some sport disciplines
affect negatively marketing practice 200 2 5 3.49 .902
Sport organizations do not have qualified
marketing people to execute their programs and
decisions
200 1 5 3.43 .937
Less money is made available for sport marketing
practice 200 1 5 3.41 1.113
A positive relationship exists between the mean and the degree of influence of the variable
whilst an inverse relationship exists between the standard deviation and the degree of influence
of the variable. This implies that a variable with a high mean and a small standard deviation
will be more influential than a variable with a high mean and standard deviation or a variable
with a small mean and a high standard deviation respectively. Table 6 above presents the
descriptive statistics on the various factors that hinder smooth adoption of marketing mix
variables in sport administration. In all, 16 variables were examined.
The factors were rated on a Likert scale of 1-5, that is from 1(strongly disagree) to 5 (strongly
agree). It can be seen from the reported mean and their corresponding standard deviation in a
descending order the degree to which these factors affect the smooth adoption of marketing
mix variables in sport administration settings. The factors: “corrupt practices by sport appointee
undermines marketing practice”; “Inadequate sponsorship of sporting activities affects
marketing practice” and “Lack of sport administration management being developed as
business model affect marketing practice” are seen as a more perceived factor that hinder
smooth adoption of marketing mix variables to the factors: “The unpopular nature of some
sport disciplines affect negatively marketing practice”; “Sport organizations do not have
qualified marketing people to execute their programs and decisions” and “Less money is made
available for sport marketing practice”. The former produced a mean and corresponding
standard deviation values of 4.75 (0.489); 4.57 (0.507) and 4.53 (0.489) respectively whiles
British Journal of Marketing Studies
Vol.4, No.1, pp.72-94, February 2016
___Published by European Centre for Research Training and Development UK (www.eajournals.org)
83
ISSN 2055-0219(Print), ISSN 2055-0227(online)
the latter in turn made a mean and matching standard deviation values of 3.49 (0.902); 3.43
(0.937) and 3.41 (1.113) respectively (see Table 6).
Whether Effective Adoption of Marketing Mix Variable Really Lead to Sport Customer
Satisfaction
This segment of the study gives a picture on the statements whether effective adoption of
marketing mix variables really lead to sport customer satisfaction (see Table 7). It can be
observed that that majority of the respondents (sport administrators) agreed strongly to the
statements that effective adoption of marketing mix variables really lead to sport customer
satisfaction.
To determine whether these statements are reliable and that whether effective adoption of
marketing mix variables really lead to sport customer, item analysis of each of these statements
were analyzed using the Cronbach’s alpha statistic. Here we can compute the variance of each
statements and the variance for the sum scale (all the statements). The variance of the sum scale
will be smaller than the sum of factor variances, if the all the statements (factors) measure the
same variability between subjects (that is if they measure some true score).
The proportion of the true score variance that is captured by the statements by comparing the
sum of factor variance with the variance of the sum scale (see Table 7). If there is no true score
but only error in the statements (factors), the variance of the sum score will be the same as the
sum of variance of the individual statements, as such the Cronbach’s alpha computed will be
equal to zero (α = 0.00). However, if all statements are perfectly reliable and measure the same
thing (true score) then α = 1.00. The closer the alpha value is to 1.00, the more perfect reliable
the statements are as shown in Table 7 below.
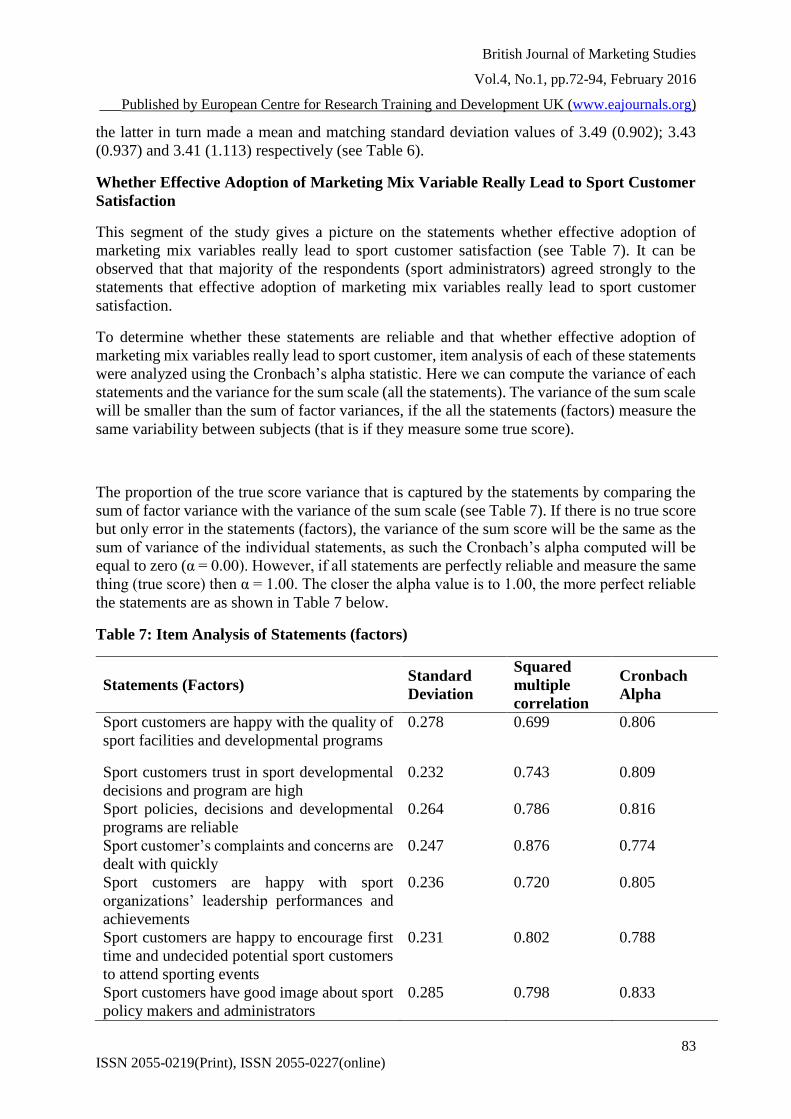
Table 7: Item Analysis of Statements (factors)
Statements (Factors) Standard
Deviation
Squared
multiple
correlation
Cronbach
Alpha
Sport customers are happy with the quality of
sport facilities and developmental programs
0.278 0.699 0.806
Sport customers trust in sport developmental
decisions and program are high
0.232 0.743 0.809
Sport policies, decisions and developmental
programs are reliable
0.264 0.786 0.816
Sport customer’s complaints and concerns are
dealt with quickly
0.247 0.876 0.774
Sport customers are happy with sport
organizations’ leadership performances and
achievements
0.236 0.720 0.805
Sport customers are happy to encourage first
time and undecided potential sport customers
to attend sporting events
0.231 0.802 0.788
Sport customers have good image about sport
policy makers and administrators
0.285 0.798 0.833
British Journal of Marketing Studies
Vol.4, No.1, pp.72-94, February 2016
___Published by European Centre for Research Training and Development UK (www.eajournals.org)
84
ISSN 2055-0219(Print), ISSN 2055-0227(online)
Sport organizations’ employees and officials
are happy to explain sporting developmental
decisions and programs to sport customers
0.208 0.744 0.787
Sport customers are given feedback about
their concerns and problems
0.293 0.829 0.780
Various sport organizations are happy with
the performance of sport policy maker’s
strategic direction
0.285 0.746 0.817
Cronbach’s alpha for all factors = 0.802
It could be observed from Table 4.4 that the overall Cronbach’s alpha for all the statements
(factors), α = 0.802 indicates that these factors put together are 82% reliable indicating that for
a fact effective adoption of marketing mix variables really lead to sport customer satisfaction
form the purview of sport administrators. It can also be seen that the alpha values for the
individual statements (factors) are very close to the alpha value for all the factors put together.
This indicates that these factor are virtually measuring the same thing (some true score).
The squared multiple correlation values obtained also suggest that there is a positive correlation
between these statements (factors). From the above analysis, we can conclude that these
statements have effect on the adoption of marketing mix variables from the perspective of sport
administrators.
Thing that can contribute to Effective Marketing Practices at Sport Administration
Setting.
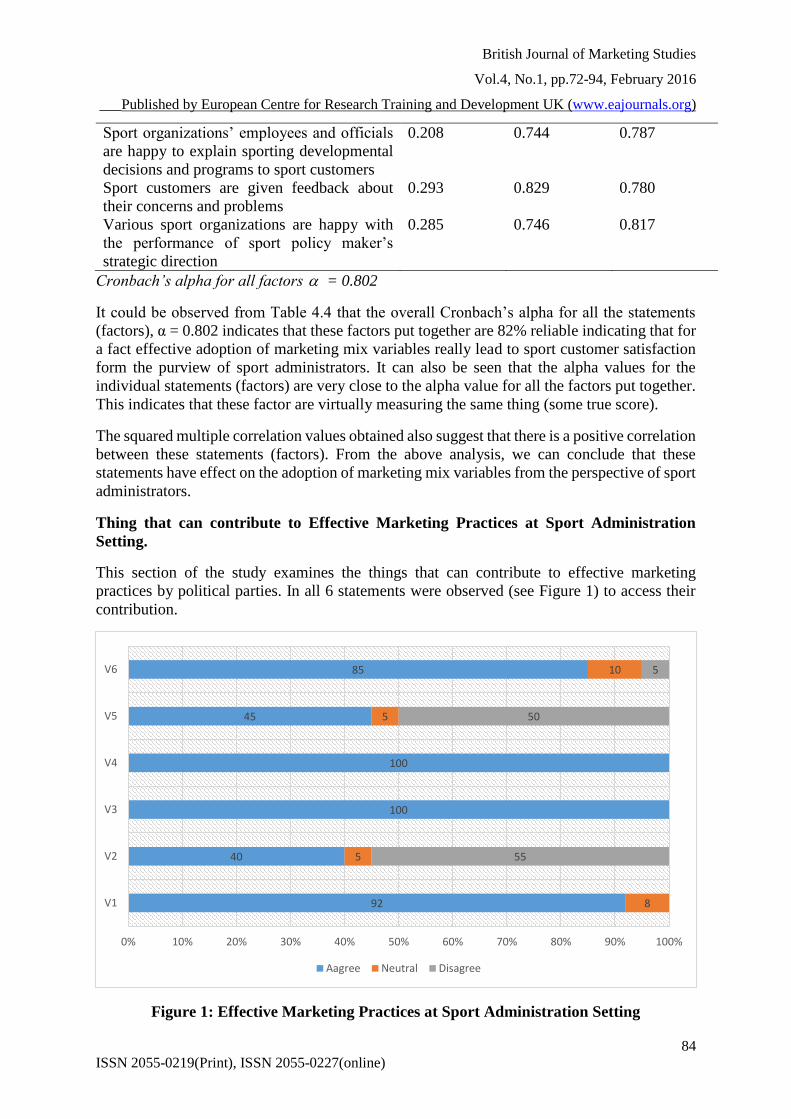
This section of the study examines the things that can contribute to effective marketing
practices by political parties. In all 6 statements were observed (see Figure 1) to access their
contribution.
Figure 1: Effective Marketing Practices at Sport Administration Setting
92
40
100
100
45
85
8
5
5
10
55
50
5
0% 10% 20% 30% 40% 50% 60% 70% 80% 90% 100%
V1
V2
V3
V4
V5
V6
Aagree Neutral Disagree
British Journal of Marketing Studies
Vol.4, No.1, pp.72-94, February 2016
___Published by European Centre for Research Training and Development UK (www.eajournals.org)
85
ISSN 2055-0219(Print), ISSN 2055-0227(online)
It can be seen from the Figure 1 above that respondents gave a 100% endorsements to the
statement: “Setting aside a percentage of national budget for sport marketing development”
(V4) and “Regular marketing training for sport officials and employees” (V3) Also “creation
of marketing section or department” (V1) and sport appointees whose performances are not
satisfactory should be changed (V6) realized 92% and 85% respectively out of the total
respondents asserting agree. However, sport administrators were at odds with the statements:
“Employment of qualified marketing personnel for sporting organizations (V5) and “Sport
administration appointees by government to head various sport state sport organizations should
have marketing background” (V2) as those who asserted disagree were marginally more than
those who asserted agree (see Figure 1).
ANALYSIS OF THE QUESTIONNAIRE (SPORT STAKEHOLDERS)
This section of the study reports on the results of the analysis and discussion of data collected.
Its flow assumes the sequence in which designated objectives of the study were ordered. The
chapter is presented under the following sub sections:
7. Reliability/Validity Test
8. Respondents Profile
9. The Extent of Marketing Mix Variables Adoption in Ghanaian Sport Administration
Setting
10. Factors That Hinder Smooth Adoption of Marketing Mix Variables in Sport
Administration
11. Whether Effective Adoption of Marketing Mix Variable Really Lead to Sport Customer
Satisfaction
12. Thing that can Contribute to Effective Marketing Practices at Sport Administration
Setting.
Reliability/Validity Test
A reliability/validity test using Cronbach Alpha; resulting in a reliability coefficient of 0.890
which was above the recommended minimum of 0.7 (Santos & Reynolds, 1999) was conducted
on all 51 items (variables) used in the study (see Table 1).
Table 8: Reliability/Validity Statistics
N % Cronbach's Alpha No. of variables
250 100 0.890 51
Source: output from SPSS
It can be inferred from Table 8 that variables assigned for the study were 89% reliable to be
used for the study. The study however achieved a response rate of 0.947 (approximately 95%).
British Journal of Marketing Studies
Vol.4, No.1, pp.72-94, February 2016
___Published by European Centre for Research Training and Development UK (www.eajournals.org)
86
ISSN 2055-0219(Print), ISSN 2055-0227(online)
Respondents Profile
This section of the study reports on type of stakeholder organization/person against gender, age
and educational level. It also reports on current position and number of years worked in the
current position as shown in the below Table 8, 9 and 10.
Table 9: Type of Stakeholder Organization/person * Gender Crosstabulation
Type of sport stakeholder organization/person Gender
Total Male Female
Sport supporters’ association Count 111 36 147
% within Gender 63.1% 48.6% 59.0%
Sport sponsoring organization Count 18 10 28
% within Gender 10.3% 13.5% 11.2%
Sport development institution Count 18 10 28
% within Gender 10.3% 13.5% 11.2%
Community sport advocacy
institution
Count 15 8 23
% within Gender 8.6% 10.8% 9.2%
Others Count 14 10 24
% within Gender 8.0% 13.5% 9.6%
Total Count 176 74 250
% within Gender 100.0% 100.0% 100.0%
Table 9 above presents a cross tabulation of type of stakeholder organization/person against
gender. From the table it can be observed that respondents were skewed toward sport
supporters’ association. This accounted for 147 (59%) of the total respondents constituting 111
(63.1%) male and 36 (48.6%) female, followed by sport sponsoring organization and sport
development institution which also accounted for by 28% of the total respondents respectively
with the least community sport advocacy institution accounting for by 9.2% out of the total
respondents. It can also be seen that the male respondents dominate in all the various types of
stakeholder’s organizations/persons.
Table 10: Type of sport stakeholder organization/person * Age Crosstabulation
Type of sport stakeholder
organization/person
Age Total
18-25 26-35 36-45 46-55 56+
Sport supporters’
association
Count 38 67 21 15 4 145
% within Age 65.5% 64.4% 42.0% 53.6% 50.0% 58.5%
Sport sponsoring
organization
Count 1 6 14 7 0 28
% within Age 1.7% 5.8% 28.0% 25.0% 0.0% 11.3%
Sport development
institution
Count 4 13 8 2 1 28
% within Age 6.9% 12.5% 16.0% 7.1% 12.5% 11.3%
Community sport
advocacy institutions
Count 7 10 4 1 1 23
% within Age 12.1% 9.6% 8.0% 3.6% 12.5% 9.3%
Others Count 8 8 3 3 2 24
% within Age 13.8% 7.7% 6.0% 10.7% 25.0% 9.7%
Total Count 58 104 50 28 8 248
% within Age 100.0% 100.0% 100.0% 100.0% 100.0% 100.0%
British Journal of Marketing Studies
Vol.4, No.1, pp.72-94, February 2016
___Published by European Centre for Research Training and Development UK (www.eajournals.org)
87
ISSN 2055-0219(Print), ISSN 2055-0227(online)
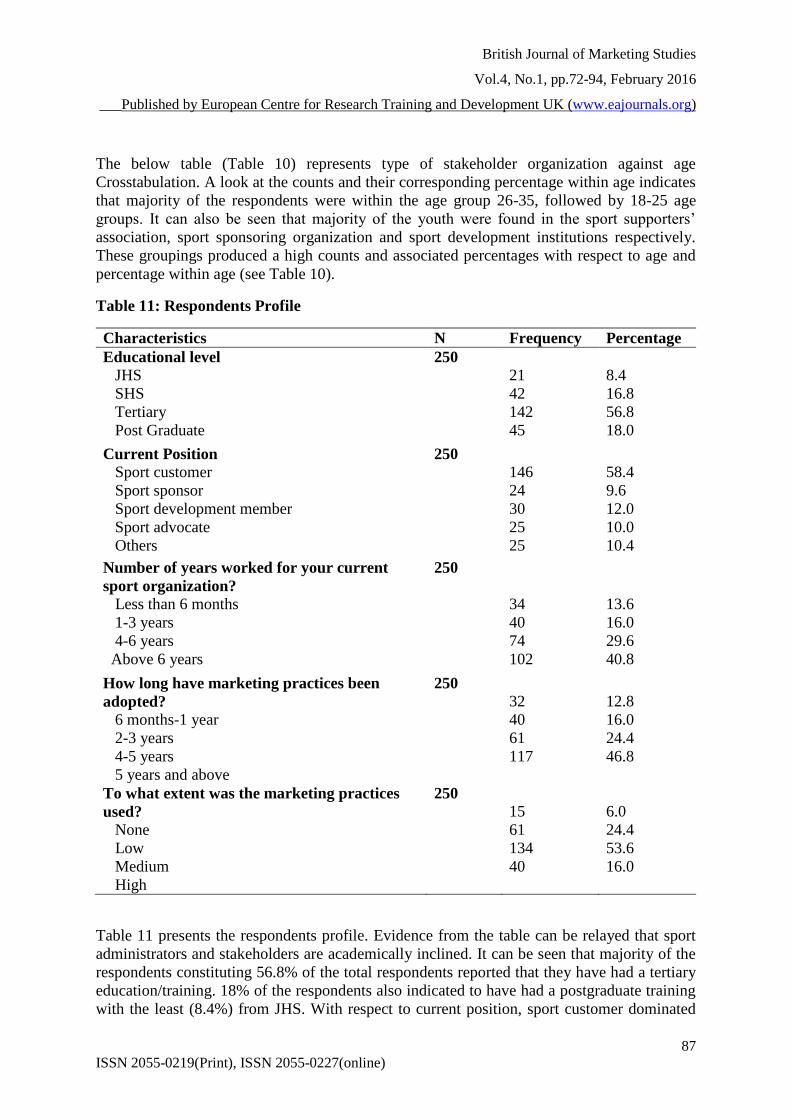
The below table (Table 10) represents type of stakeholder organization against age
Crosstabulation. A look at the counts and their corresponding percentage within age indicates
that majority of the respondents were within the age group 26-35, followed by 18-25 age
groups. It can also be seen that majority of the youth were found in the sport supporters’
association, sport sponsoring organization and sport development institutions respectively.
These groupings produced a high counts and associated percentages with respect to age and
percentage within age (see Table 10).
Table 11: Respondents Profile
Characteristics N Frequency Percentage
Educational level
JHS
SHS
Tertiary
Post Graduate
250
21
42
142
45
8.4
16.8
56.8
18.0
Current Position
Sport customer
Sport sponsor
Sport development member
Sport advocate
Others
250
146
24
30
25
25
58.4
9.6
12.0
10.0
10.4
Number of years worked for your current
sport organization?
Less than 6 months
1-3 years
4-6 years
Above 6 years
250
34
40
74
102
13.6
16.0
29.6
40.8
How long have marketing practices been
adopted?
6 months-1 year
2-3 years
4-5 years
5 years and above
250
32
40
61
117
12.8
16.0
24.4
46.8
To what extent was the marketing practices
used?
None
Low
Medium
High
250
15
61
134
40
6.0
24.4
53.6
16.0
Table 11 presents the respondents profile. Evidence from the table can be relayed that sport
administrators and stakeholders are academically inclined. It can be seen that majority of the
respondents constituting 56.8% of the total respondents reported that they have had a tertiary
education/training. 18% of the respondents also indicated to have had a postgraduate training
with the least (8.4%) from JHS. With respect to current position, sport customer dominated
British Journal of Marketing Studies
Vol.4, No.1, pp.72-94, February 2016
___Published by European Centre for Research Training and Development UK (www.eajournals.org)
88
ISSN 2055-0219(Print), ISSN 2055-0227(online)
with 58.4% followed by sport development member (12%) and the least, sport sponsor was
9.6%
In relation to the number of years worked for your current sport organization, 40.8% out of the
total respondents indicated above 6 years, followed by 4-6 years (29.6%). Subsequently, 46.8%
of the respondents also indicated 5 years and above followed by 4-5 years (24.4%) to the
variable “to what extent was the marketing practices used? However, to what extent was the
marketing practices used saw none (6.0%), low (24.4%), medium (53.6%) and high (16.0%).
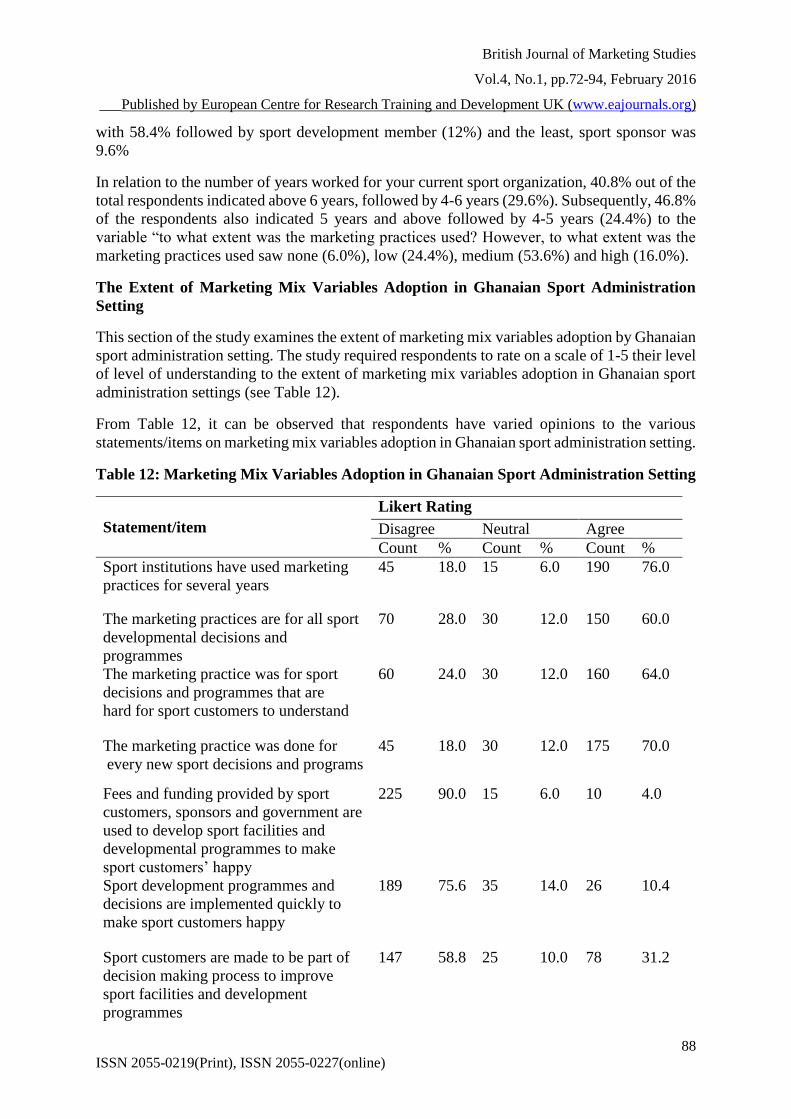
The Extent of Marketing Mix Variables Adoption in Ghanaian Sport Administration
Setting
This section of the study examines the extent of marketing mix variables adoption by Ghanaian
sport administration setting. The study required respondents to rate on a scale of 1-5 their level
of level of understanding to the extent of marketing mix variables adoption in Ghanaian sport
administration settings (see Table 12).
From Table 12, it can be observed that respondents have varied opinions to the various
statements/items on marketing mix variables adoption in Ghanaian sport administration setting.
Table 12: Marketing Mix Variables Adoption in Ghanaian Sport Administration Setting
Statement/item
Likert Rating
Disagree Neutral Agree
Count % Count % Count %
Sport institutions have used marketing
practices for several years
45 18.0 15 6.0 190 76.0
The marketing practices are for all sport
developmental decisions and
programmes
70 28.0 30 12.0 150 60.0
The marketing practice was for sport
decisions and programmes that are
hard for sport customers to understand
60 24.0 30 12.0 160 64.0
The marketing practice was done for
every new sport decisions and programs
45
18.0 30 12.0 175 70.0
Fees and funding provided by sport
customers, sponsors and government are
used to develop sport facilities and
developmental programmes to make
sport customers’ happy
225 90.0 15 6.0 10 4.0
Sport development programmes and
decisions are implemented quickly to
make sport customers happy
189 75.6 35 14.0 26 10.4
Sport customers are made to be part of
decision making process to improve
sport facilities and development
programmes
147 58.8 25 10.0 78 31.2
British Journal of Marketing Studies
Vol.4, No.1, pp.72-94, February 2016
___Published by European Centre for Research Training and Development UK (www.eajournals.org)
89
ISSN 2055-0219(Print), ISSN 2055-0227(online)
Sport customers are made aware of all
sporting decisions and developmental
programmes
155 62.0 35 14 60.0 24.0
Sport organizations’ employees and
officials are helpful, friendly and
respectful
45 18.0 15 6.0 190 76.0
Marketing Practices forms part of long
term thinking of sport organizations
25 10.0 10 4.0 215 86.0
For instance, respondents asserted to agree to the statement “sport institutions have used
marketing practices for several years”. This accounted for 76% out of the total respondents
indicating agree whilst disagree and neutral accounted for 18% and 6% respectively. Similarly,
majority of the respondents agreed to the statements: “The marketing practices are for all sport
developmental decisions and programmes”; “The marketing practice was for sport decisions
and programmes that are hard for sport customers to understand” and “Marketing Practices
forms part of long term thinking of sport organizations”. These accounted for 60%, 64% and
86% respectively. However, 90% of the respondents in turn also disagrees to the statement:
“fees and funding provided by sport customers, sponsors and government are used to develop
sport facilities and developmental programmes to make sport customers’ happy”. Also
respondents disagree to the statement; “sport development programmes and decisions are
implemented quickly to make sport customers happy” and “sport customers are made aware of
all sporting decisions and developmental programmes” they accounted for by 75.6% and 62%
in that order.
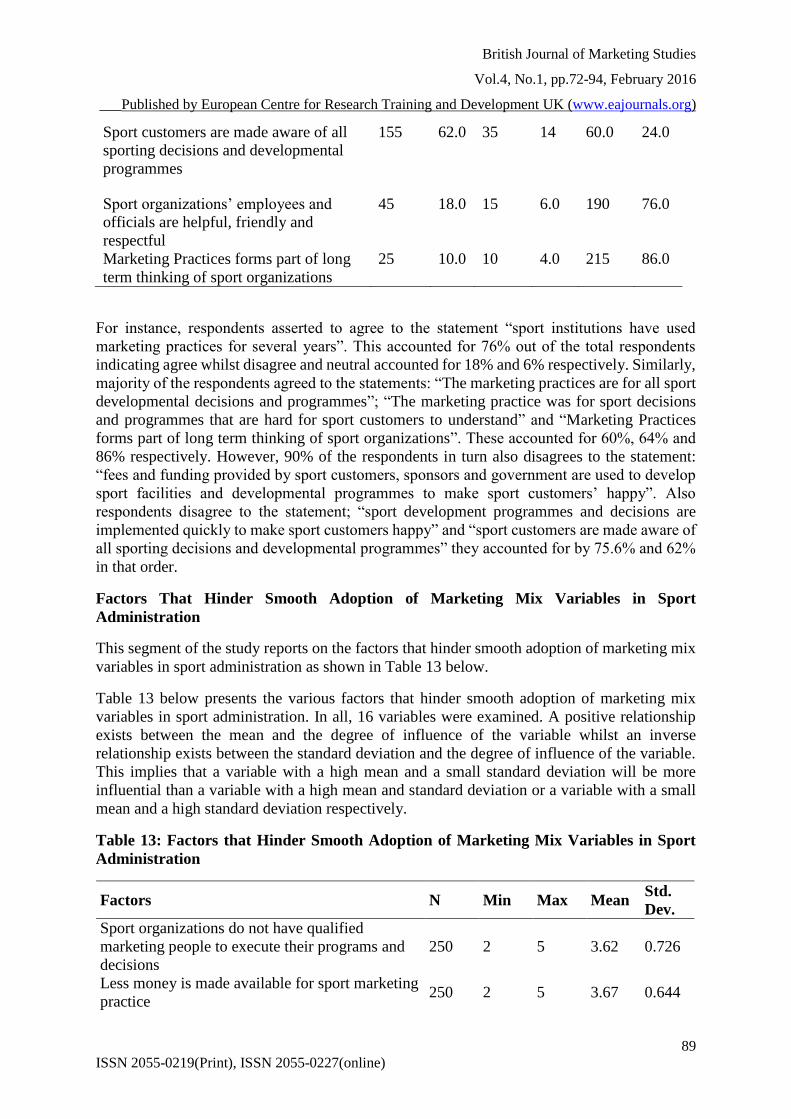
Factors That Hinder Smooth Adoption of Marketing Mix Variables in Sport
Administration
This segment of the study reports on the factors that hinder smooth adoption of marketing mix
variables in sport administration as shown in Table 13 below.
Table 13 below presents the various factors that hinder smooth adoption of marketing mix
variables in sport administration. In all, 16 variables were examined. A positive relationship
exists between the mean and the degree of influence of the variable whilst an inverse
relationship exists between the standard deviation and the degree of influence of the variable.
This implies that a variable with a high mean and a small standard deviation will be more
influential than a variable with a high mean and standard deviation or a variable with a small
mean and a high standard deviation respectively.
Table 13: Factors that Hinder Smooth Adoption of Marketing Mix Variables in Sport
Administration
Factors N Min Max Mean Std.
Dev.
Sport organizations do not have qualified
marketing people to execute their programs and
decisions
250 2 5 3.62 0.726
Less money is made available for sport marketing
practice 250 2 5 3.67 0.644
British Journal of Marketing Studies
Vol.4, No.1, pp.72-94, February 2016
___Published by European Centre for Research Training and Development UK (www.eajournals.org)
90
ISSN 2055-0219(Print), ISSN 2055-0227(online)
The unpopular nature of some sport disciplines
affect negatively marketing practice 250 2 5 3.69 0.662
Lack of modern sport facilities affect marketing
practices 250 3 5 4.31 0.472
Lack of quality sport performance affect
marketing practice 250 3 5 4.41 0.516
Lack of passion for sporting activities’
atmosphere affect marketing 250 3 5 3.98 0.482
Government interference in sporting decisions
affect marketing practice 250 3 5 4.68 0.476
Poor security situation at sport facilities affect
marketing practice 250 1 5 3.72 0.871
Inconsistent government sport policies affect
marketing practice 250 3 5 4.46 0.538
Inadequate government funding of sporting
developmental programs and decisions affect
marketing practice
250 4 5 4.57 0.496
Bad sporting facilities affect marketing practice 250 3 5 4.64 0.496
Poor service satisfaction by sport customers at
various sporting centers affect marketing
practices
250 3 5 4.16 0.399
Lack of sport administration management being
developed as business model affect marketing
practice
250 3 5 4.74 0.446
Low income levels of sport customers prevent
them from attending sporting activities 250 2 5 4.18 0.647
Inadequate sponsorship of sporting activities
affects marking practice 250 2 5 4.19 0.880
Corrupt practices by sport appointee undermines
marketing practice 250 2 5 4.80 0.433
it is worth nothing that the factors in Table 6 were rated on a Likert scale of 1-5, that is from
1(strongly disagree) to 5 (strongly agree). It can be seen from the reported mean and their
corresponding standard deviation that all the factors in one breath hinder the smooth adoption
of marketing mix variables in sport administration but some of the factors are more perceived
than the others. For instance, the factor: “corrupt practices by sport appointee undermines
marketing practice” produced a mean value of 4.80 and a corresponding standard deviation of
4.33 which shows a very strong perceived factor that hinder smooth adoption of marketing mix
variables in sport administration compared to the factor “lack of passion for sporting activities’
atmosphere affect marketing” which also produced a mean of 3.98 and standard deviation of
0.482. Table 6 however gives a vivid report on the various factors and their level of impact on
the smooth adoption of marketing mix variables in sport administration.
Whether Effective Adoption of Marketing Mix Variable Really Lead to Sport Customer
Satisfaction
This section of the study reports on the statements whether effective adoption of marketing mix
variables really lead to sport customer satisfaction (see Table 14).
British Journal of Marketing Studies
Vol.4, No.1, pp.72-94, February 2016
___Published by European Centre for Research Training and Development UK (www.eajournals.org)
91
ISSN 2055-0219(Print), ISSN 2055-0227(online)
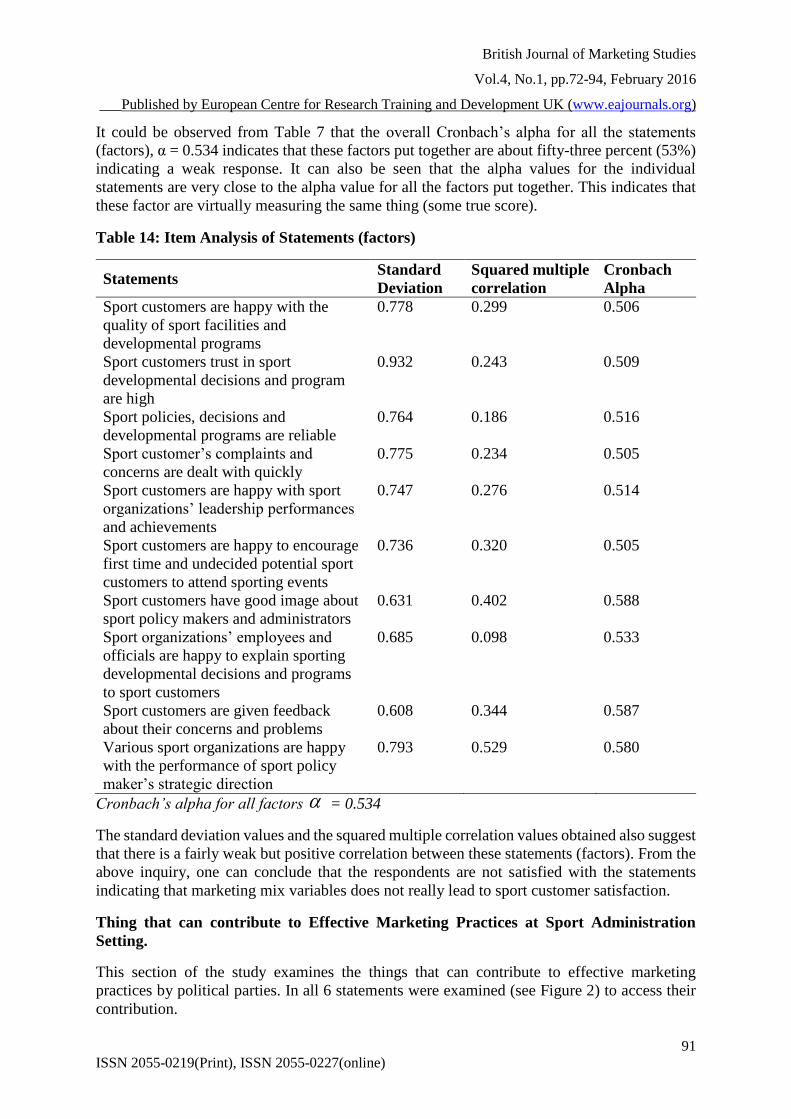
It could be observed from Table 7 that the overall Cronbach’s alpha for all the statements
(factors), α = 0.534 indicates that these factors put together are about fifty-three percent (53%)
indicating a weak response. It can also be seen that the alpha values for the individual
statements are very close to the alpha value for all the factors put together. This indicates that
these factor are virtually measuring the same thing (some true score).
Table 14: Item Analysis of Statements (factors)
Statements Standard
Deviation
Squared multiple
correlation
Cronbach
Alpha
Sport customers are happy with the
quality of sport facilities and
developmental programs
0.778 0.299 0.506
Sport customers trust in sport
developmental decisions and program
are high
0.932 0.243 0.509
Sport policies, decisions and
developmental programs are reliable
0.764 0.186 0.516
Sport customer’s complaints and
concerns are dealt with quickly
0.775 0.234 0.505
Sport customers are happy with sport
organizations’ leadership performances
and achievements
0.747 0.276 0.514
Sport customers are happy to encourage
first time and undecided potential sport
customers to attend sporting events
0.736 0.320 0.505
Sport customers have good image about
sport policy makers and administrators
0.631 0.402 0.588
Sport organizations’ employees and
officials are happy to explain sporting
developmental decisions and programs
to sport customers
0.685 0.098 0.533
Sport customers are given feedback
about their concerns and problems
0.608 0.344 0.587
Various sport organizations are happy
with the performance of sport policy
maker’s strategic direction
0.793 0.529 0.580
Cronbach’s alpha for all factors = 0.534
The standard deviation values and the squared multiple correlation values obtained also suggest
that there is a fairly weak but positive correlation between these statements (factors). From the
above inquiry, one can conclude that the respondents are not satisfied with the statements
indicating that marketing mix variables does not really lead to sport customer satisfaction.
Thing that can contribute to Effective Marketing Practices at Sport Administration
Setting.
This section of the study examines the things that can contribute to effective marketing
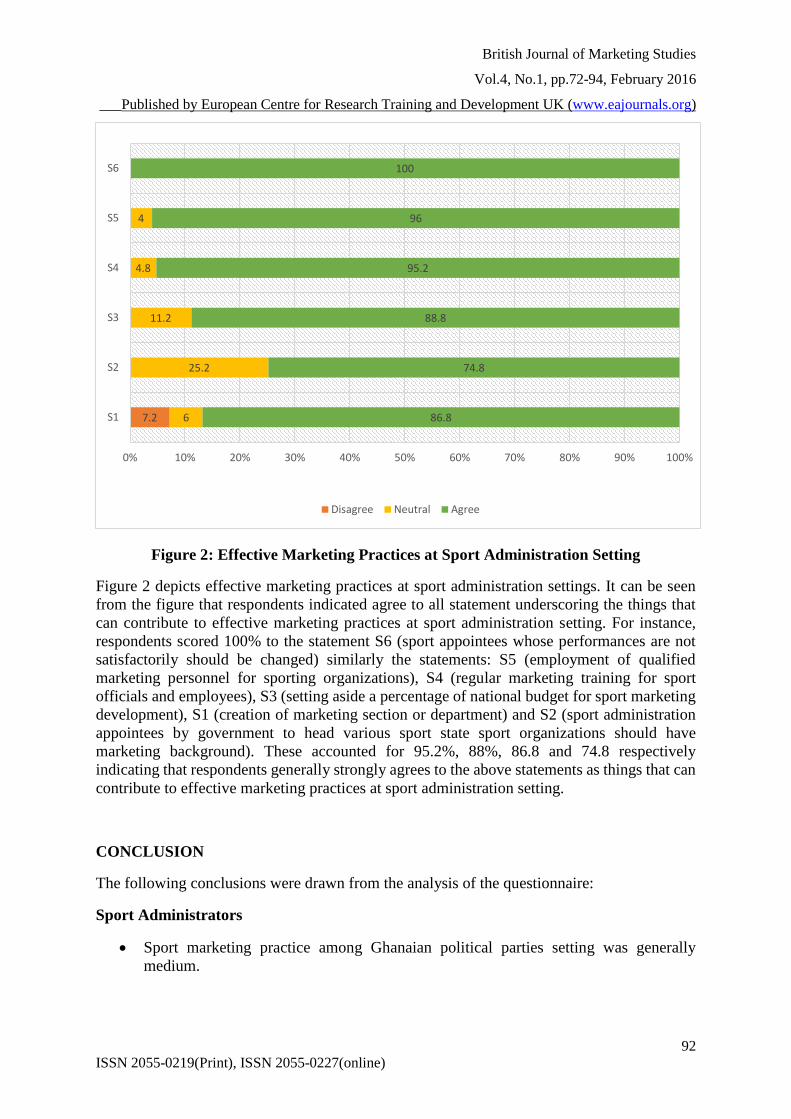
practices by political parties. In all 6 statements were examined (see Figure 2) to access their
contribution.
British Journal of Marketing Studies
Vol.4, No.1, pp.72-94, February 2016
___Published by European Centre for Research Training and Development UK (www.eajournals.org)
92
ISSN 2055-0219(Print), ISSN 2055-0227(online)
Figure 2: Effective Marketing Practices at Sport Administration Setting
Figure 2 depicts effective marketing practices at sport administration settings. It can be seen
from the figure that respondents indicated agree to all statement underscoring the things that
can contribute to effective marketing practices at sport administration setting. For instance,
respondents scored 100% to the statement S6 (sport appointees whose performances are not
satisfactorily should be changed) similarly the statements: S5 (employment of qualified
marketing personnel for sporting organizations), S4 (regular marketing training for sport
officials and employees), S3 (setting aside a percentage of national budget for sport marketing
development), S1 (creation of marketing section or department) and S2 (sport administration
appointees by government to head various sport state sport organizations should have
marketing background). These accounted for 95.2%, 88%, 86.8 and 74.8 respectively
indicating that respondents generally strongly agrees to the above statements as things that can
contribute to effective marketing practices at sport administration setting.
CONCLUSION
The following conclusions were drawn from the analysis of the questionnaire:
Sport Administrators
Sport marketing practice among Ghanaian political parties setting was generally
medium.
7.2 6
25.2
11.2
4.8
4
86.8
74.8
88.8
95.2
96
100
0% 10% 20% 30% 40% 50% 60% 70% 80% 90% 100%
S1
S2
S3
S4
S5
S6
Disagree Neutral Agree

British Journal of Marketing Studies
Vol.4, No.1, pp.72-94, February 2016
___Published by European Centre for Research Training and Development UK (www.eajournals.org)
93
ISSN 2055-0219(Print), ISSN 2055-0227(online)
Bad sporting facilities, inadequate government funding of sports, inconsistent
government policies, government interference and lack of quality sport performance
are obstacles to successful adoption of effective sport marketing practices.
Sport institutions believed marketing mix adoption leads to sport customers’
satisfaction.
Creation of marketing desk, appointment of people with marketing background, setting aside
of some money for sport marketing activities, regular marketing for sport executives,
employment of qualified marketing personnel as well as removal of underperforming sport
appointees could all contribute greatly to effective sport marketing practices.
Sport Stakeholders
Like their counterparts from sport stakeholder groups sport administrators also
indicated that sport marketing practice in Ghana is medium.
Furthermore, impediments preventing successful adoption of sport marketing practices
among sport institutions inadequate government funding of sport, inconsistent
government sporting policies, bad sporting facilities, government interference and lack
of quality sport performance
Unlike sport administrators majority of sport stakeholders’ respondents were generally
unhappy with sport customers’ satisfaction.
Also, contribution of marketing desk, appointment of people with marketing
background, setting sport marketing budget, regular marketing training of sport
officials, employment of qualified marketing personnel as well as removal of
underperforming sport marketing appointees would all enhance sport marketing
practice in Ghana.
The already mentioned analysis showed that both internal and external factors influence the
effectiveness of marketing mix adoption in terms of sport customer satisfaction in sport
administration. The implication of such revelation is that sport institutions and sport
stakeholders have to work together to arrest the increasing sport customers’ dissatisfaction
which if left unchecked can negatively affect good sport programmes and decisions. This study
also adds to existing literature on sport marketing mix by revealing that developing sport as
business model, employment of qualified personnel, quality sport performance and right
government policies and support would help sport customers’ satisfaction in developing
countries. The major drawback of the study is that only 5 out of 9 active sport disciplines in
Ghana were considered for the study. This means that knowledge and experiences of the entire
sport administration machinery might not be captured.
REFERENCES
American marketing Association (2014) Definition of Marketing, Chicago IL (PRWEB).
Boom, B. and Bitner, M. (1981) Marketing strategies and organizational structure for service
firms in Donnelly, J and George, W (eds) marketing of services, Chicago: American
Marketing Association, pp 47-51
British Journal of Marketing Studies
Vol.4, No.1, pp.72-94, February 2016
___Published by European Centre for Research Training and Development UK (www.eajournals.org)
94
ISSN 2055-0219(Print), ISSN 2055-0227(online)
Caro L.M & GarciaJ.A (2007b) Cognitive-affective model of consumersatisfaction. An
exploratory study within the framework of a sporting event. Journal of Business
Research, 60,108-114.
Constantinescu M (2009) Sporting Marketing. From a transactional approach to a relational
perspective. ASE Publishing Bucharest.
Ferrand A and McCarthy S (2009) Marketing the sport Organization, Building networks and
relationships, Routledge, London.
Fullerton S (2007) Sporting Marketing, Eastern Michigan University, Michigan
Fullerton S and Merz G.R (2008) Sporting Marketing, Quarterly, 17, 90-108, West Virginia
University.
Gill J and Johnson (2006). Research Methods for Managers, 3rd ed, Longman Sage.
Greenwell C (2001) The Influence of spectator sport facilities on customer satisfaction and
profitability. Unpublished doctoral dissertation. The Ohio State University , Columbus
Kotler P and Armstrong G. (2014). Principles of Marketing 15th ed, Pearson Prentice Hall.
Kotler P and Keller K.L (2014). Marketing Management Plus, 4th ed, New Jersey, Pearson
Prentice Hall.
Kotler, P. and Zaltman, G (1971) , ‘ Social marketing: An approach to planned social change’
Journal of Marketing, Vol. 35, pp 3-12.
Kotler P (2014). Marketing Management 14th edition Prentice Hall,
McCarthy, J (1964) Basic Marketing, IL Richard D. Irwin, Sage Publication.
Ministry of Youth and Sport, Ghana,( 2010) Manual for Sport In Ghana
Mullins B, Hardy S and Sutton W (2000) Sport Marketing Campaign, IL Human Kinetics
Oliver R.L (1980) A cognitive model of the antecedents and consequences of satisfaction
decisions. Journal of marketing, 17, 460=469
Pitts B.G and Stotlar D.K (2007) Fundamentals of Sport Marketing: Third edition, West
Virginia University, Morgantown.
Santo, R. and Reynolds, J. (1999) A Tool for Assessing the Reliability Scales: Journal of
Extension vol. 37, No 2 SAS Institute Inc.
Scammell, M. (1999) Political Marketing: Lessons from political scene. Political Studies,
vol,47, pp 718-739
Schlossberg H (1996) Sport Marketing. Cambridge, MA; Blackwell Publisher, Inc
Schwarz E.C and Hunter J.D (2008), Advanced Theory and Practice in Sport Marketing,
Elsevier’s Science and Technology Department, Oxford..
Shilbury D, Westerbeek H; Quick S and Funk D (2009) Strategic Sport Marketing 3rd edition,
Allen & unwin, Crows Nest Australia
Smith A .C. T (2008) Introduction to sport Marketing, Elsevier’s Science & Technology
Department, Oxford. Teel
Wakefield K.L and Blodgett J G (1996) The effects of servicescape on consumers’ behaviour
intentions in leisure settings. Journal of Service Marketing
Wring, D. (2002b) ‘’Conceptualizing Political Marketing: A Framework for Election-
Campaign Analysis’’. In N.J.O Shaughnessy and S.C Henneberg (Eds). The idea of
Political Marketing. Praeger, Westport pp. 175-185.
![I Overview of the System and the Basic Statistics [1] General … · 2018-06-02 · 6 2010 2030 2055 2060 2010 2030 2055 2060 2010 2030 2055 2060 2010 2030 2055 2060 127.18 million!](https://img.pdfslide.us/doc/110x75/5f7bc0b24d489855d56d059e/i-overview-of-the-system-and-the-basic-statistics-1-general-2018-06-02-6-2010.jpg)