Embed Size (px)
Citation preview
Modeling of mass flow behavior of hot rolled low alloy
steel based on combined Johnson-Cook and Zerilli-
Armstrong model
X. Wang1, K. Chandrashekhara1,*, S. A. Rummel2, S. Lekakh2, D. C. Van Aken2, and R. J. O’Malley2
1Department of Mechanical and Aerospace Engineering, Missouri University of Science and Technology, Rolla, MO 65409, USA2Department of Materials Science and Engineering, Missouri University of Science and Technology, Rolla, MO 65409, USA
Received: 8 August 2016
Accepted: 5 November 2016
Published online:
14 November 2016
� Springer Science+Business
Media New York 2016
ABSTRACT
Accuracy and reliability of numerical simulation of hot rolling processes are
dependent on a suitable material model, which describes metal flow behavior.
In the present study, Gleeble hot compression tests were carried out at high
temperatures up to 1300 �C and varying strain rates for a medium carbon micro-
alloyed steel. Based on experimental results, a Johnson-Cook model (JC) and a
Zerilli-Armstrong (ZA) model were developed and exhibited limitation in
characterizing complex viscoplastic behavior. A combined JC and ZA model
was introduced and calibrated through investigation of strain hardening, and
the coupled effect of temperature and strain rate. Results showed that the
combined JC and ZA model demonstrated better agreement with experimental
data. An explicit subroutine of the proposed material model was coded and
implemented into a finite element model simulating the industrial hot rolling.
The simulated rolling torque was in good agreement with experimental data.
Plastic strain and stress distributions were recorded to investigate nonlinear
mass flow behavior of the steel bar. Results showed that the maximum equiv-
alent plastic strain occurred at 45� and 135� areas of the cross section. Stress
increased with decreasing temperature, and the corresponding rolling torque
was also increased. Due to the extent of plastic deformation, rolling speed had
limited influence on the internal stress of the bar, but the relative rolling torque
was increased due to strain rate hardening.
Introduction
Hot rolling is one of the most important and complex
deformation processes in steel manufacturing. Metal
formingphenomena, suchasviscoplastic deformation,
recrystallization, and recovery, occur during the hot
rolling to endow metal with expected microstructure
and mechanical properties. Among these phenomena,
viscoplastic deformation foremost takes place to pro-
vide plastic strain and energy for microstructural
Address correspondence to E-mail: [email protected]
DOI 10.1007/s10853-016-0570-8
J Mater Sci (2017) 52:2800–2815
development. Viscoplastic flow stress is significantly
influenced by many factors, such as temperature and
strain rate. These factors are not independent, but
sufficiently interact and form complex relationships.
Thus, an effective constitutive material model consid-
ering these parameters is essential for investigation of
hot rolling processes. Meanwhile, unlike a strip hot
rolling, an as-casted steel bar has more complex stress
and strain distributions during hot rolling, and the
contact region is a cambered surface with nonuniform
compressive force. It is hard to employ traditional
analytical methods to investigate this highly nonlinear
process. Finite element analysis (FEA) shows advan-
tages to simulate and investigate steel bar hot rolling.
Based on accurate constitutive model, FEA provides
an effective and successful way to study mass flow
behavior, optimize rolling designs, and enhance steel
quality and productivity.
In order to describe viscoplastic behavior, a num-
ber of constitutive models for steel have been pro-
posed in the last few decades. Johnson-Cook (JC)
model [1] is one of most widely used phenomeno-
logical constitutive models, which considers inde-
pendently the effects of strain hardening, strain rate
hardening, and temperature softening on flow stress.
The simplified expression and easy implementation
contribute to the extensive use of Johnson-Cook
model. However, it does not consider the coupled
effect of strain rate and temperature on flow stress,
causing limited capability of predicting material
properties. A series of modified Johnson-Cook mod-
els were presented by researchers. Zhang et al. [2]
considered the coupled effect of temperature and
strain, and proposed a modified Johnson-Cook model
on Ni-based super alloy. Lin et al. [3] conducted high
temperature tensile tests on a high-strength alloy
steel and presented a modified Johnson-Cook model
considering combined effect of strain rate and tem-
perature. However, these modified Johnson-Cook
models can be applied only for specific steel grades.
Gambirasio and Rizzi [4] proposed a modified John-
son-Cook model using splitting strain rate and tem-
perature effect, and effectively modeled complex
material flow behavior. Another widely used phe-
nomenological constitutive model is based upon the
Arrhenius equation [5], in which Zener–Hollomon
parameter is employed. Large numbers of parameters
and polynomial fitting process of Arrhenius equation
provide well prediction of flow stress, but imple-
mentation is tedious causing the Arrhenius equation
not to be used as widely as the Johnson-Cook model.
Different from phenomenological constitutive mod-
els, physical constitutive models are developed based
on material microstructure behavior. Zerilli–Arm-
strong (ZA) model [6] is one of the widely used
physical models based upon dislocation mechanisms.
The ZA model does consider the coupled effect of
temperature and strain rate, and exhibits more flexi-
bility than the Johnson-Cook model on predicting
material properties. But the coupled effect of tem-
perature and strain rate in Zerilli-Armstrong model is
limited, and numerous modified versions have been
proposed. Samantaray et al. [7, 8] proposed a modi-
fied Zerilli-Armstrong model to predict mass flow
behavior of Ti-modified austenitic stainless steel. Lin
et al. [9] derived a modified material model by
combining Johnson-Cook model and Zerilli-Arm-
strong model to predict stress–strain curves for typ-
ical high-strength steel. However, these modified
Zerilli-Armstrong models are limited to specific steel
grades and were not suitable for the current study. In
addition to phenomenological and physical consti-
tutive models, empirical constitutive models, such as
Shida’s equation [10], are also widely used. The
inputs of Shida’s equation are just the metal compo-
sition and thus avoid expensive experimental testing.
However, the accuracy of Shida’s equation is limited
compared to other material models.
Hot rolling has been investigated for many years
by means of numerical simulation. Kim [11] pro-
posed a finite element model to simulate a shape
rolling, and nonuniform temperature distribution
during rolling was investigated. Duan and Sheppard
[12] studied aluminum strip rolling using finite ele-
ment method and inverse analysis by comparing
simulated torque with measured data. Yang et al. [13]
investigated hot rolling of titanium alloy ring using
finite element method, and the blank size effect on
strain and temperature distribution was investigated.
Rummel et al. [14] performed high strain rate com-
pression test using split Hopkinson pressure bar to
gain high strain rate material properties and incor-
porated into Johnson-Cook model. Nalawade et al.
[15] investigated mass flow behavior of micro-alloyed
38MnVS6 steel during multi-pass hot rolling.
Detailed strain distributions on regular cross section
showed that both tension and compression existed
during hot rolling of the 38MnVS6 steel. Benasciutti
et al. [16] developed a simplified finite element model
considering both heating and cooling thermal load to
J Mater Sci (2017) 52:2800–2815 2801
predict thermal stresses during hot rolling, and the
simulation results showed good agreement with
theoretical solution. Li et al. [17] studied nonlinear
deformation during H-beam hot rolling using finite
element method, and the proposed finite element
model was verified by comparing simulated tem-
perature with experimental data. Hosseini Kordkheili
et al. [18] derived an implicit finite element subrou-
tine for a rate-dependent constitutive model to
describe mass flow behavior of 5052 aluminum. Gao
et al. [19] proposed a procedure of developing
explicit subroutine of a user-defined generalized
material model. However, literatures of finite element
analysis on three-dimensional steel bar hot rolling are
limited, which involve highly nonlinear geometry
and material model.
In the current study, Gleeble hot compression tests
were conducted to generate experimental data for
material modeling. By comparing to original John-
son-Cook and Zerilli-Armstrong models, a combined
JC and ZA model was developed to predict flow
stress at varying temperatures and strain rates. A
three-dimensional nonlinear finite element model
incorporating proposed material model was devel-
oped to simulate hot rolling. Plastic strain, stress, and
rolling torque were recorded and investigated.
Experiments
A medium carbon low alloy steel grade with a
chemical composition given in percent mass of
0.38C–1.3Mn–0.57Si–0.13Cr–0.08 V–0.018Al was
investigated. Hot compression tests were performed
using the Gleeble thermo-simulation system at
varying temperatures and strain rates to study the
material flow behavior. Cylindrical specimens of
15-mm height and 10-mm diameter were machined
from as-cast steel bar. A layer of tantalum foil with
nickel paste was placed between the specimen and
platens to minimize friction during compression. The
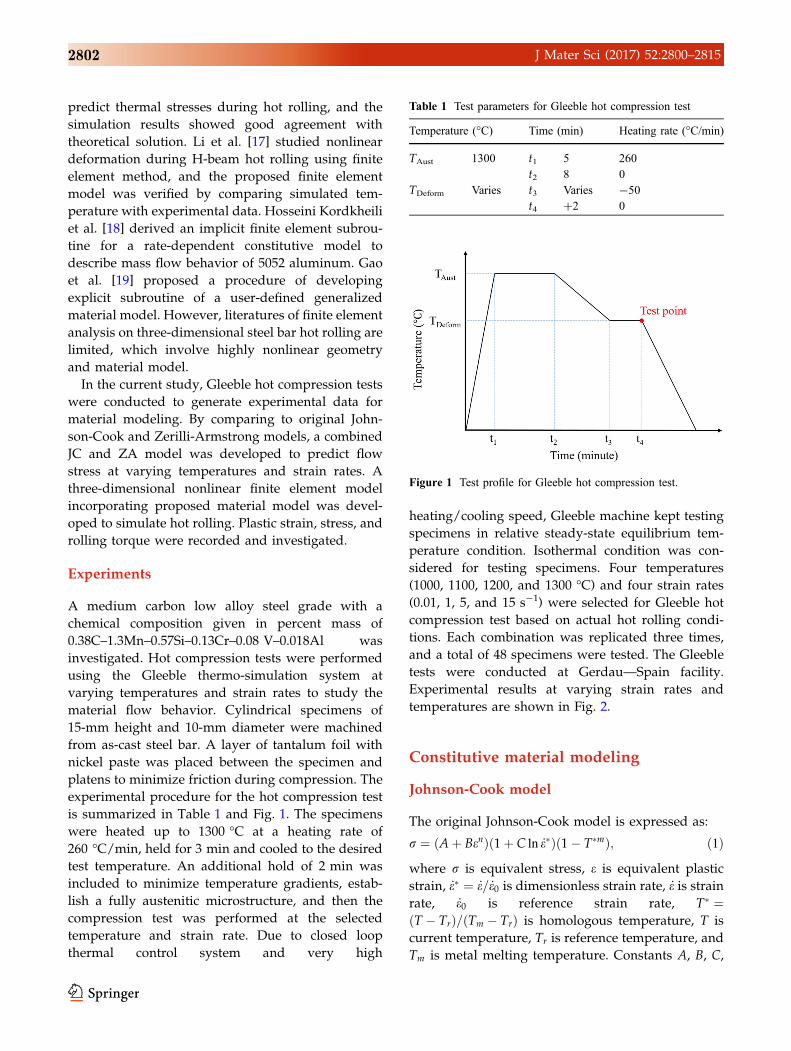
experimental procedure for the hot compression test
is summarized in Table 1 and Fig. 1. The specimens
were heated up to 1300 �C at a heating rate of
260 �C/min, held for 3 min and cooled to the desired
test temperature. An additional hold of 2 min was
included to minimize temperature gradients, estab-
lish a fully austenitic microstructure, and then the
compression test was performed at the selected
temperature and strain rate. Due to closed loop
thermal control system and very high
heating/cooling speed, Gleeble machine kept testing
specimens in relative steady-state equilibrium tem-
perature condition. Isothermal condition was con-
sidered for testing specimens. Four temperatures
(1000, 1100, 1200, and 1300 �C) and four strain rates
(0.01, 1, 5, and 15 s-1) were selected for Gleeble hot
compression test based on actual hot rolling condi-
tions. Each combination was replicated three times,
and a total of 48 specimens were tested. The Gleeble
tests were conducted at Gerdau—Spain facility.
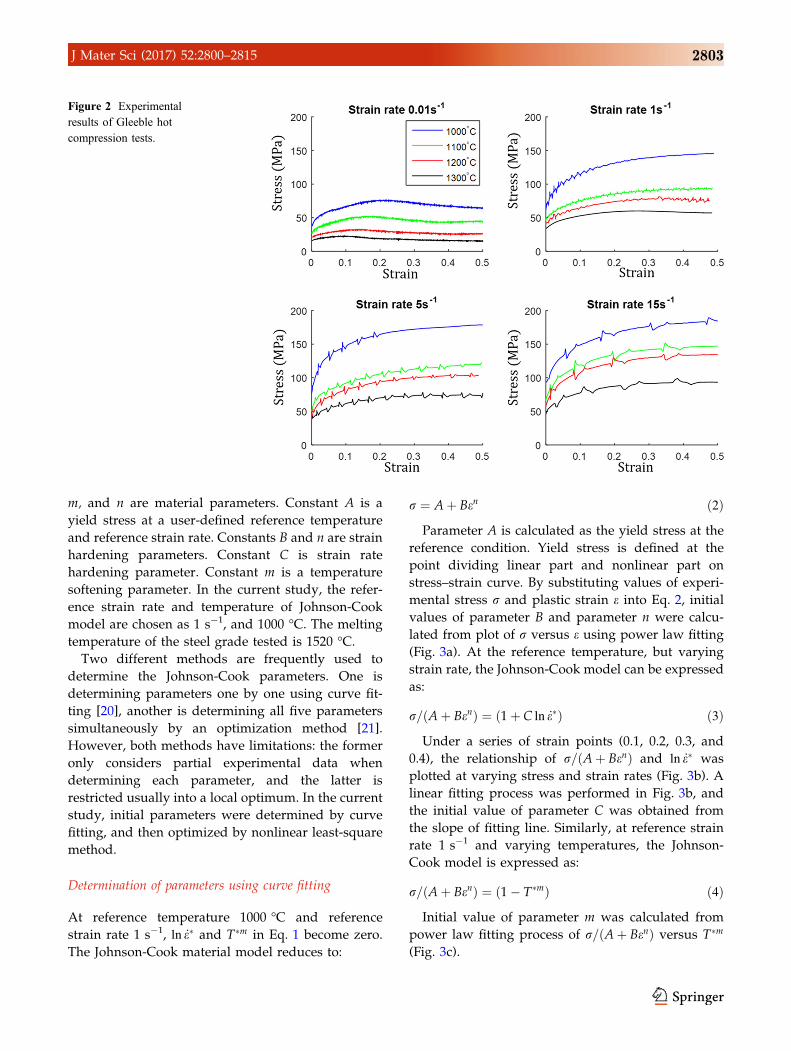
Experimental results at varying strain rates and
temperatures are shown in Fig. 2.
Constitutive material modeling
Johnson-Cook model
The original Johnson-Cook model is expressed as:
r ¼ Aþ Benð Þ 1þ C ln _e�ð Þ 1� T�mð Þ; ð1Þ
where r is equivalent stress, e is equivalent plastic
strain, _e� ¼ _e= _e0 is dimensionless strain rate, _e is strainrate, _e0 is reference strain rate, T� ¼T � Trð Þ= Tm � Trð Þ is homologous temperature, T is
current temperature, Tr is reference temperature, and
Tm is metal melting temperature. Constants A, B, C,
Table 1 Test parameters for Gleeble hot compression test
Temperature (�C) Time (min) Heating rate (�C/min)
TAust 1300 t1 5 260
t2 8 0
TDeform Varies t3 Varies -50
t4 ?2 0
Figure 1 Test profile for Gleeble hot compression test.
2802 J Mater Sci (2017) 52:2800–2815
m, and n are material parameters. Constant A is a
yield stress at a user-defined reference temperature
and reference strain rate. Constants B and n are strain
hardening parameters. Constant C is strain rate
hardening parameter. Constant m is a temperature
softening parameter. In the current study, the refer-
ence strain rate and temperature of Johnson-Cook
model are chosen as 1 s-1, and 1000 �C. The melting
temperature of the steel grade tested is 1520 �C.Two different methods are frequently used to
determine the Johnson-Cook parameters. One is
determining parameters one by one using curve fit-
ting [20], another is determining all five parameters
simultaneously by an optimization method [21].
However, both methods have limitations: the former
only considers partial experimental data when
determining each parameter, and the latter is
restricted usually into a local optimum. In the current
study, initial parameters were determined by curve
fitting, and then optimized by nonlinear least-square
method.
Determination of parameters using curve fitting
At reference temperature 1000 �C and reference
strain rate 1 s-1, ln _e� and T�m in Eq. 1 become zero.
The Johnson-Cook material model reduces to:
r ¼ Aþ Ben ð2Þ
Parameter A is calculated as the yield stress at the
reference condition. Yield stress is defined at the
point dividing linear part and nonlinear part on
stress–strain curve. By substituting values of experi-
mental stress r and plastic strain e into Eq. 2, initial
values of parameter B and parameter n were calcu-
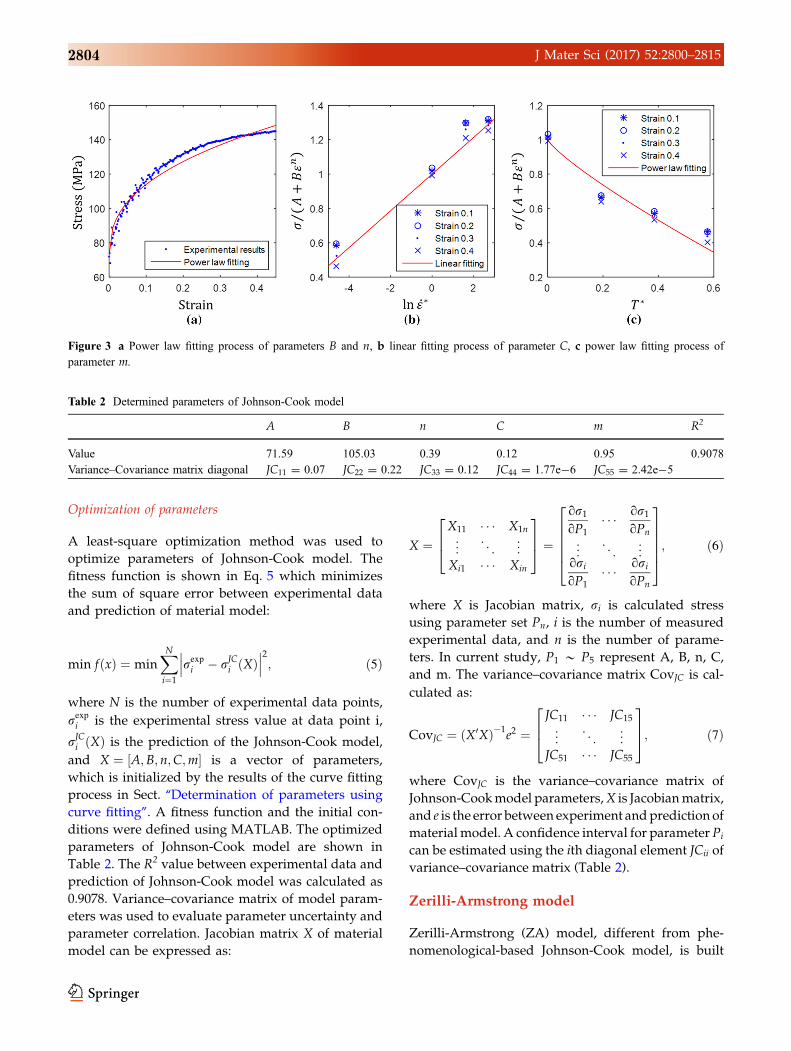
lated from plot of r versus e using power law fitting
(Fig. 3a). At the reference temperature, but varying
strain rate, the Johnson-Cook model can be expressed
as:
r= Aþ Benð Þ ¼ 1þ C ln _e�ð Þ ð3Þ
Under a series of strain points (0.1, 0.2, 0.3, and
0.4), the relationship of r= Aþ Benð Þ and ln _e� was
plotted at varying stress and strain rates (Fig. 3b). A
linear fitting process was performed in Fig. 3b, and
the initial value of parameter C was obtained from
the slope of fitting line. Similarly, at reference strain
rate 1 s-1 and varying temperatures, the Johnson-
Cook model is expressed as:
r= Aþ Benð Þ ¼ 1� T�mð Þ ð4Þ
Initial value of parameter m was calculated from
power law fitting process of r= Aþ Benð Þ versus T�m
(Fig. 3c).
Figure 2 Experimental
results of Gleeble hot
compression tests.
J Mater Sci (2017) 52:2800–2815 2803
Optimization of parameters
A least-square optimization method was used to
optimize parameters of Johnson-Cook model. The
fitness function is shown in Eq. 5 which minimizes
the sum of square error between experimental data
and prediction of material model:
min f xð Þ ¼ minXN
i¼1
rexpi � rJCi Xð Þ���
���2; ð5Þ
where N is the number of experimental data points,
rexpi is the experimental stress value at data point i,
rJCi Xð Þ is the prediction of the Johnson-Cook model,
and X ¼ A;B; n;C;m½ � is a vector of parameters,
which is initialized by the results of the curve fitting
process in Sect. ‘‘Determination of parameters using
curve fitting’’. A fitness function and the initial con-
ditions were defined using MATLAB. The optimized
parameters of Johnson-Cook model are shown in
Table 2. The R2 value between experimental data and
prediction of Johnson-Cook model was calculated as
0.9078. Variance–covariance matrix of model param-
eters was used to evaluate parameter uncertainty and
parameter correlation. Jacobian matrix X of material
model can be expressed as:
X ¼X11 � � � X1n
..
. . .. ..
.
Xi1 � � � Xin
2
64
3
75 ¼
or1oP1
� � � or1oPn
..
. . .. ..
.
orioP1
� � � orioPn
266664
377775; ð6Þ
where X is Jacobian matrix, ri is calculated stress
using parameter set Pn, i is the number of measured
experimental data, and n is the number of parame-
ters. In current study, P1 * P5 represent A, B, n, C,
and m. The variance–covariance matrix CovJC is cal-
culated as:
CovJC ¼ X0Xð Þ�1e2 ¼
JC11 � � � JC15
..
. . .. ..
.
JC51 � � � JC55
264
375; ð7Þ
where CovJC is the variance–covariance matrix of
Johnson-Cookmodel parameters,X is Jacobianmatrix,
and e is the error between experiment andpredictionof
material model. A confidence interval for parameter Pi
can be estimated using the ith diagonal element JCii of
variance–covariance matrix (Table 2).
Zerilli-Armstrong model
Zerilli-Armstrong (ZA) model, different from phe-
nomenological-based Johnson-Cook model, is built
Table 2 Determined parameters of Johnson-Cook model
A B n C m R2
Value 71.59 105.03 0.39 0.12 0.95 0.9078
Variance–Covariance matrix diagonal JC11 = 0.07 JC22 = 0.22 JC33 = 0.12 JC44 = 1.77e-6 JC55 = 2.42e-5
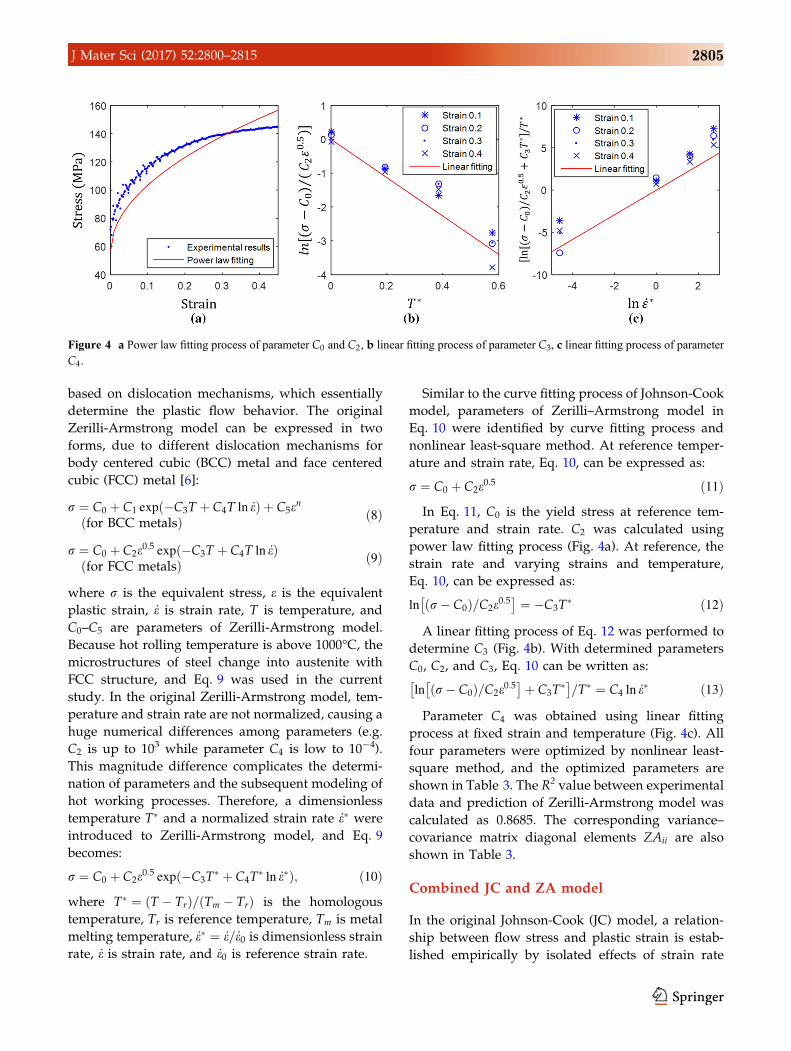
Figure 3 a Power law fitting process of parameters B and n, b linear fitting process of parameter C, c power law fitting process of
parameter m.
2804 J Mater Sci (2017) 52:2800–2815
based on dislocation mechanisms, which essentially
determine the plastic flow behavior. The original
Zerilli-Armstrong model can be expressed in two
forms, due to different dislocation mechanisms for
body centered cubic (BCC) metal and face centered
cubic (FCC) metal [6]:
r ¼ C0 þ C1 exp �C3T þ C4T ln _eð Þ þ C5en
for BCC metalsð Þ ð8Þ
r ¼ C0 þ C2e0:5 exp �C3T þ C4T ln _eð Þ
for FCC metalsð Þ ð9Þ
where r is the equivalent stress, e is the equivalent
plastic strain, _e is strain rate, T is temperature, and
C0–C5 are parameters of Zerilli-Armstrong model.
Because hot rolling temperature is above 1000�C, themicrostructures of steel change into austenite with
FCC structure, and Eq. 9 was used in the current
study. In the original Zerilli-Armstrong model, tem-
perature and strain rate are not normalized, causing a
huge numerical differences among parameters (e.g.
C2 is up to 103 while parameter C4 is low to 10-4).
This magnitude difference complicates the determi-
nation of parameters and the subsequent modeling of
hot working processes. Therefore, a dimensionless
temperature T� and a normalized strain rate _e� were
introduced to Zerilli-Armstrong model, and Eq. 9
becomes:
r ¼ C0 þ C2e0:5 exp �C3T
� þ C4T� ln _e�ð Þ; ð10Þ
where T� ¼ T � Trð Þ= Tm � Trð Þ is the homologous
temperature, Tr is reference temperature, Tm is metal
melting temperature, _e� ¼ _e= _e0 is dimensionless strain
rate, _e is strain rate, and _e0 is reference strain rate.
Similar to the curve fitting process of Johnson-Cook
model, parameters of Zerilli–Armstrong model in
Eq. 10 were identified by curve fitting process and
nonlinear least-square method. At reference temper-
ature and strain rate, Eq. 10, can be expressed as:
r ¼ C0 þ C2e0:5 ð11Þ
In Eq. 11, C0 is the yield stress at reference tem-
perature and strain rate. C2 was calculated using
power law fitting process (Fig. 4a). At reference, the
strain rate and varying strains and temperature,
Eq. 10, can be expressed as:
ln r� C0ð Þ=C2e0:5
� �¼ �C3T
� ð12Þ
A linear fitting process of Eq. 12 was performed to
determine C3 (Fig. 4b). With determined parameters
C0, C2, and C3, Eq. 10 can be written as:
ln r� C0ð Þ=C2e0:5
� �þ C3T
�� �=T� ¼ C4 ln _e� ð13Þ
Parameter C4 was obtained using linear fitting
process at fixed strain and temperature (Fig. 4c). All
four parameters were optimized by nonlinear least-
square method, and the optimized parameters are
shown in Table 3. The R2 value between experimental
data and prediction of Zerilli-Armstrong model was
calculated as 0.8685. The corresponding variance–
covariance matrix diagonal elements ZAii are also
shown in Table 3.
Combined JC and ZA model
In the original Johnson-Cook (JC) model, a relation-
ship between flow stress and plastic strain is estab-
lished empirically by isolated effects of strain rate
Figure 4 a Power law fitting process of parameter C0 and C2, b linear fitting process of parameter C3, c linear fitting process of parameter
C4.
J Mater Sci (2017) 52:2800–2815 2805
and temperature upon the flow stress. The concise
formulation of the Johnson-Cook model facilitates
calculation of the material model parameters using a
limited amount of experiments. However, this sim-
plification does not consider the coupled effect of
temperature and strain rate on flow stress, which was
observed from both current Gleeble test results and
literature data [5]. On the other hand, the original
Zerilli-Armstrong model takes into account the cou-
pled effect of temperature and strain rate on flow
stress. However, the actual coupled effect of tem-
perature and strain rate is complex. The fixed yield
stress C0 at varying temperatures and strain rates in
original Zerilli–Armstro model is not reasonable
according to actual situation.
To overcome these shortcomings, a combined JC
and ZA model was proposed and given by
r ¼ A1 þ B1eþ B2en1ð Þð C1 þ C2 � ln _e�ð Þ
þ C3 þ C4 � ln _e�ð Þ � T�Þm1þm2�ln _e�� �
ð14Þ
Equation 14 accounts for the modified strain
hardening effect of Johnson-Cook model, and the
coupled effect of strain rate and temperature based
upon Zerilli-Armstrong model. The development
process of this combined material model is discussed
in following sections.
Strain hardening effect
A strain hardening effect A1 þ B1eþ B2en1ð Þ was used
in current study, which was based upon the work of
Lin et al. [3]. Lin et al. modified the strain hardening
part of the Johnson-Cook model Aþ Benð Þ into
A1 þ B1eþ B2en1ð Þ. The introduction of B1e enables thenew model to describe actual complex stress–strain
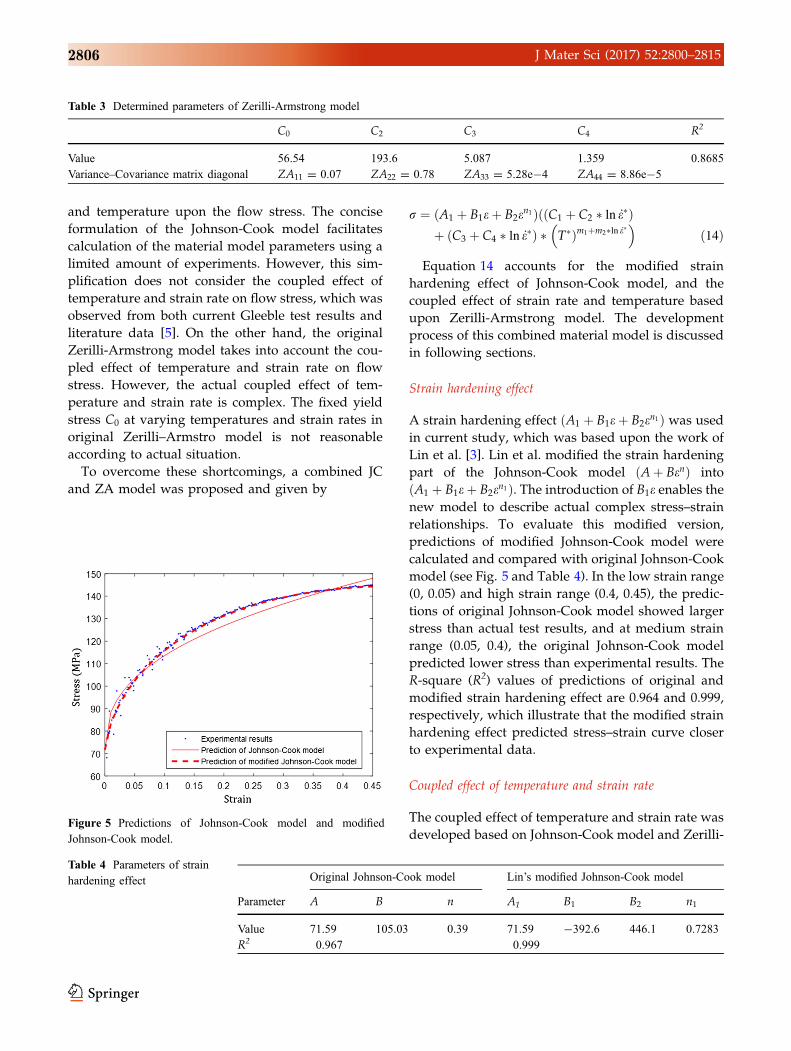
relationships. To evaluate this modified version,
predictions of modified Johnson-Cook model were
calculated and compared with original Johnson-Cook
model (see Fig. 5 and Table 4). In the low strain range
(0, 0.05) and high strain range (0.4, 0.45), the predic-
tions of original Johnson-Cook model showed larger
stress than actual test results, and at medium strain
range (0.05, 0.4), the original Johnson-Cook model
predicted lower stress than experimental results. The
R-square (R2) values of predictions of original and
modified strain hardening effect are 0.964 and 0.999,
respectively, which illustrate that the modified strain
hardening effect predicted stress–strain curve closer
to experimental data.
Coupled effect of temperature and strain rate
The coupled effect of temperature and strain rate was
developed based on Johnson-Cook model and Zerilli-
Table 3 Determined parameters of Zerilli-Armstrong model
C0 C2 C3 C4 R2
Value 56.54 193.6 5.087 1.359 0.8685
Variance–Covariance matrix diagonal ZA11 = 0.07 ZA22 = 0.78 ZA33 = 5.28e-4 ZA44 = 8.86e-5
Figure 5 Predictions of Johnson-Cook model and modified
Johnson-Cook model.
Table 4 Parameters of strain
hardening effect Original Johnson-Cook model Lin’s modified Johnson-Cook model
Parameter A B n A1 B1 B2 n1
Value 71.59 105.03 0.39 71.59 -392.6 446.1 0.7283
R2 0.967 0.999
2806 J Mater Sci (2017) 52:2800–2815
Armstrong model. The original Johnson-Cook model
predicts a temperature softening effect on flow stress
as 1� Tmð Þ, but the actual Gleeble test results
demonstrated that this temperature softening effect
varied with different strain rate conditions. Multi-
plication of temperature and strain rate in original
Zerilli-Armstrong model was used to present this
coupled effect. A modified temperature softening
effect with strain rate-dependent parameters is
shown in Eq. 15:
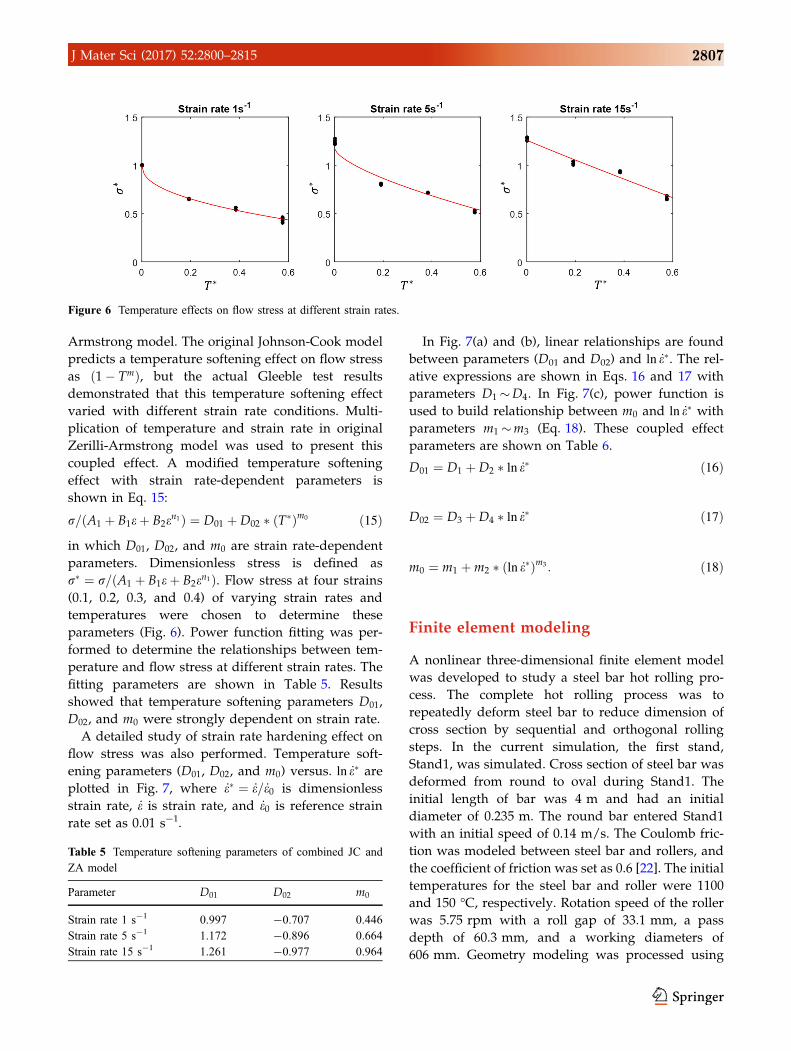
r= A1 þ B1eþ B2en1ð Þ ¼ D01 þD02 � ðT�Þm0 ð15Þ
in which D01, D02, and m0 are strain rate-dependent
parameters. Dimensionless stress is defined as
r� ¼ r= A1 þ B1eþ B2en1ð Þ. Flow stress at four strains
(0.1, 0.2, 0.3, and 0.4) of varying strain rates and
temperatures were chosen to determine these
parameters (Fig. 6). Power function fitting was per-
formed to determine the relationships between tem-
perature and flow stress at different strain rates. The
fitting parameters are shown in Table 5. Results
showed that temperature softening parameters D01,
D02, and m0 were strongly dependent on strain rate.
A detailed study of strain rate hardening effect on
flow stress was also performed. Temperature soft-
ening parameters (D01, D02, and m0) versus. ln _e� are
plotted in Fig. 7, where _e� ¼ _e= _e0 is dimensionless
strain rate, _e is strain rate, and _e0 is reference strain
rate set as 0.01 s-1.
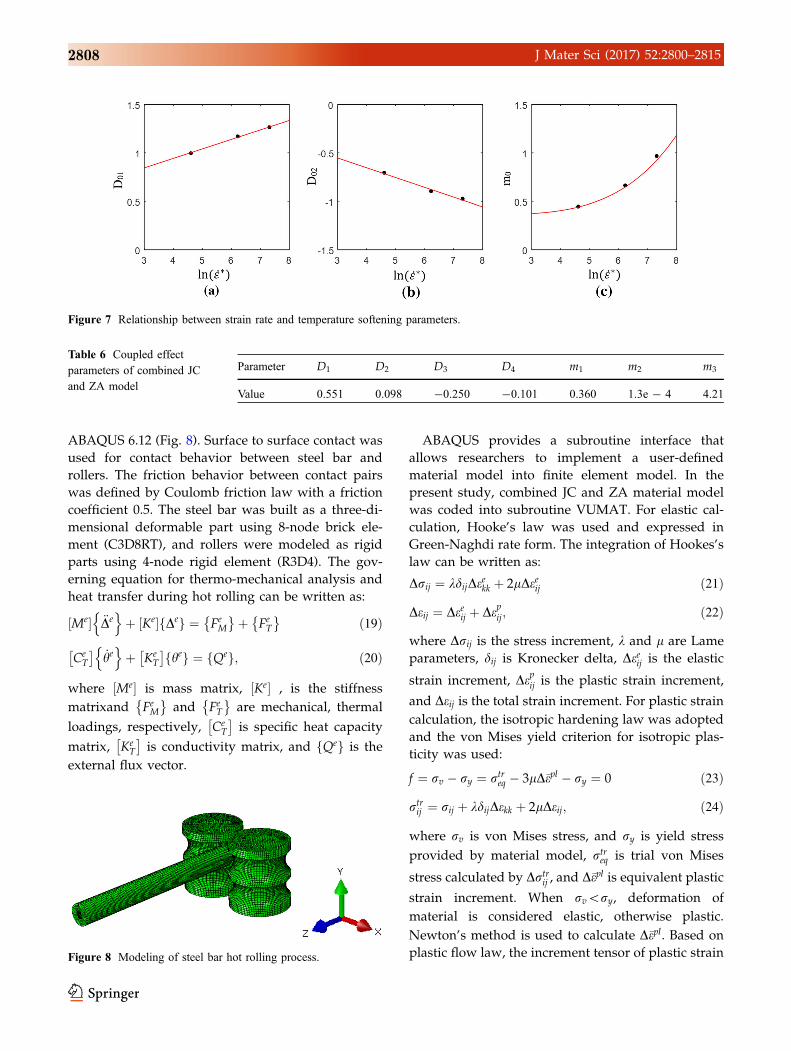
In Fig. 7(a) and (b), linear relationships are found
between parameters (D01 and D02) and ln _e�. The rel-
ative expressions are shown in Eqs. 16 and 17 with
parameters D1 �D4. In Fig. 7(c), power function is
used to build relationship between m0 and ln _e� with
parameters m1 �m3 (Eq. 18). These coupled effect
parameters are shown on Table 6.
D01 ¼ D1 þD2 � ln _e� ð16Þ
D02 ¼ D3 þD4 � ln _e� ð17Þ
m0 ¼ m1 þm2 � ln _e�ð Þm3 : ð18Þ
Finite element modeling
A nonlinear three-dimensional finite element model
was developed to study a steel bar hot rolling pro-
cess. The complete hot rolling process was to
repeatedly deform steel bar to reduce dimension of
cross section by sequential and orthogonal rolling
steps. In the current simulation, the first stand,
Stand1, was simulated. Cross section of steel bar was
deformed from round to oval during Stand1. The
initial length of bar was 4 m and had an initial
diameter of 0.235 m. The round bar entered Stand1
with an initial speed of 0.14 m/s. The Coulomb fric-
tion was modeled between steel bar and rollers, and
the coefficient of friction was set as 0.6 [22]. The initial
temperatures for the steel bar and roller were 1100
and 150 �C, respectively. Rotation speed of the roller
was 5.75 rpm with a roll gap of 33.1 mm, a pass
depth of 60.3 mm, and a working diameters of
606 mm. Geometry modeling was processed using
Figure 6 Temperature effects on flow stress at different strain rates.
Table 5 Temperature softening parameters of combined JC and
ZA model
Parameter D01 D02 m0
Strain rate 1 s-1 0.997 -0.707 0.446
Strain rate 5 s-1 1.172 -0.896 0.664
Strain rate 15 s-1 1.261 -0.977 0.964
J Mater Sci (2017) 52:2800–2815 2807
ABAQUS 6.12 (Fig. 8). Surface to surface contact was
used for contact behavior between steel bar and
rollers. The friction behavior between contact pairs
was defined by Coulomb friction law with a friction
coefficient 0.5. The steel bar was built as a three-di-
mensional deformable part using 8-node brick ele-
ment (C3D8RT), and rollers were modeled as rigid
parts using 4-node rigid element (R3D4). The gov-
erning equation for thermo-mechanical analysis and
heat transfer during hot rolling can be written as:
Me½ � €Den o
þ Ke½ � Def g ¼ FeM� �
þ FeT� �
ð19Þ
CeT
� �_he
n oþ Ke
T
� �hef g ¼ Qef g; ð20Þ
where Me½ � is mass matrix, Ke½ � , is the stiffness
matrixand FeM� �
and FeT� �
are mechanical, thermal
loadings, respectively, CeT
� �is specific heat capacity
matrix, KeT
� �is conductivity matrix, and Qef g is the
external flux vector.
ABAQUS provides a subroutine interface that
allows researchers to implement a user-defined
material model into finite element model. In the
present study, combined JC and ZA material model
was coded into subroutine VUMAT. For elastic cal-
culation, Hooke’s law was used and expressed in
Green-Naghdi rate form. The integration of Hookes’s
law can be written as:
Drij ¼ kdijDeekk þ 2lDeeij ð21Þ
Deij ¼ Deeij þ Depij; ð22Þ
where Drij is the stress increment, k and l are Lame
parameters, dij is Kronecker delta, Deeij is the elastic
strain increment, Depij is the plastic strain increment,
and Deij is the total strain increment. For plastic strain
calculation, the isotropic hardening law was adopted
and the von Mises yield criterion for isotropic plas-
ticity was used:
f ¼ rv � ry ¼ rtreq � 3lD�epl � ry ¼ 0 ð23Þ
rtrij ¼ rij þ kdijDekk þ 2lDeij; ð24Þ
where rv is von Mises stress, and ry is yield stress
provided by material model, rtreq is trial von Mises
stress calculated by Drtrij , and D�epl is equivalent plastic
strain increment. When rv\ry, deformation of
material is considered elastic, otherwise plastic.
Newton’s method is used to calculate D�epl. Based on
plastic flow law, the increment tensor of plastic strain
Figure 7 Relationship between strain rate and temperature softening parameters.
Table 6 Coupled effect
parameters of combined JC
and ZA model
Parameter D1 D2 D3 D4 m1 m2 m3
Value 0.551 0.098 -0.250 -0.101 0.360 1.3e - 4 4.21
Figure 8 Modeling of steel bar hot rolling process.
2808 J Mater Sci (2017) 52:2800–2815
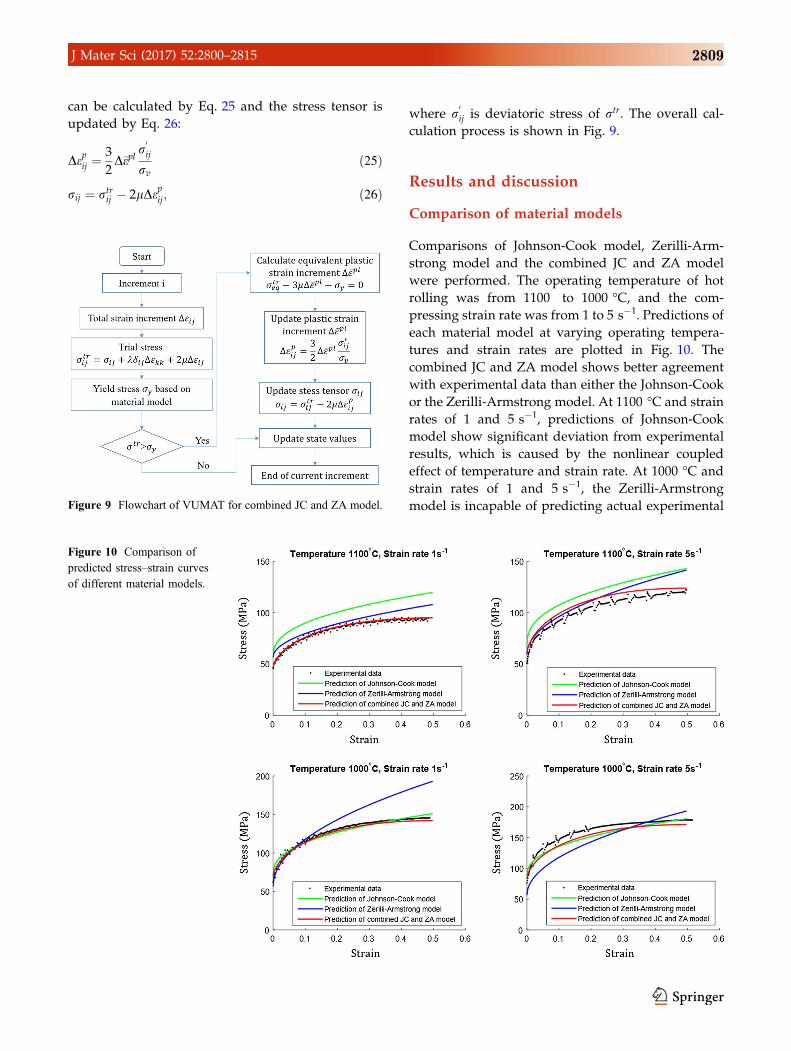
can be calculated by Eq. 25 and the stress tensor is
updated by Eq. 26:
Depij ¼3
2D�epl
r0
ij
rvð25Þ
rij ¼ rtrij � 2lDepij; ð26Þ
where r0
ij is deviatoric stress of rtr. The overall cal-
culation process is shown in Fig. 9.
Results and discussion
Comparison of material models
Comparisons of Johnson-Cook model, Zerilli-Arm-
strong model and the combined JC and ZA model
were performed. The operating temperature of hot
rolling was from 1100 to 1000 �C, and the com-
pressing strain rate was from 1 to 5 s-1. Predictions of
each material model at varying operating tempera-
tures and strain rates are plotted in Fig. 10. The
combined JC and ZA model shows better agreement
with experimental data than either the Johnson-Cook
or the Zerilli-Armstrong model. At 1100 �C and strain
rates of 1 and 5 s-1, predictions of Johnson-Cook
model show significant deviation from experimental
results, which is caused by the nonlinear coupled
effect of temperature and strain rate. At 1000 �C and
strain rates of 1 and 5 s-1, the Zerilli-Armstrong
model is incapable of predicting actual experimentalFigure 9 Flowchart of VUMAT for combined JC and ZA model.
Figure 10 Comparison of
predicted stress–strain curves
of different material models.
J Mater Sci (2017) 52:2800–2815 2809
results. The fixed C0 greatly limits the flexibility of
Zerilli-Armstrong model, producing the same yield
stress at varying temperatures and strain rates. With
the enhanced strain hardening effect and coupled
effect of temperature and strain rate, the combined JC
and ZA model demonstrated more accurate
predictions.
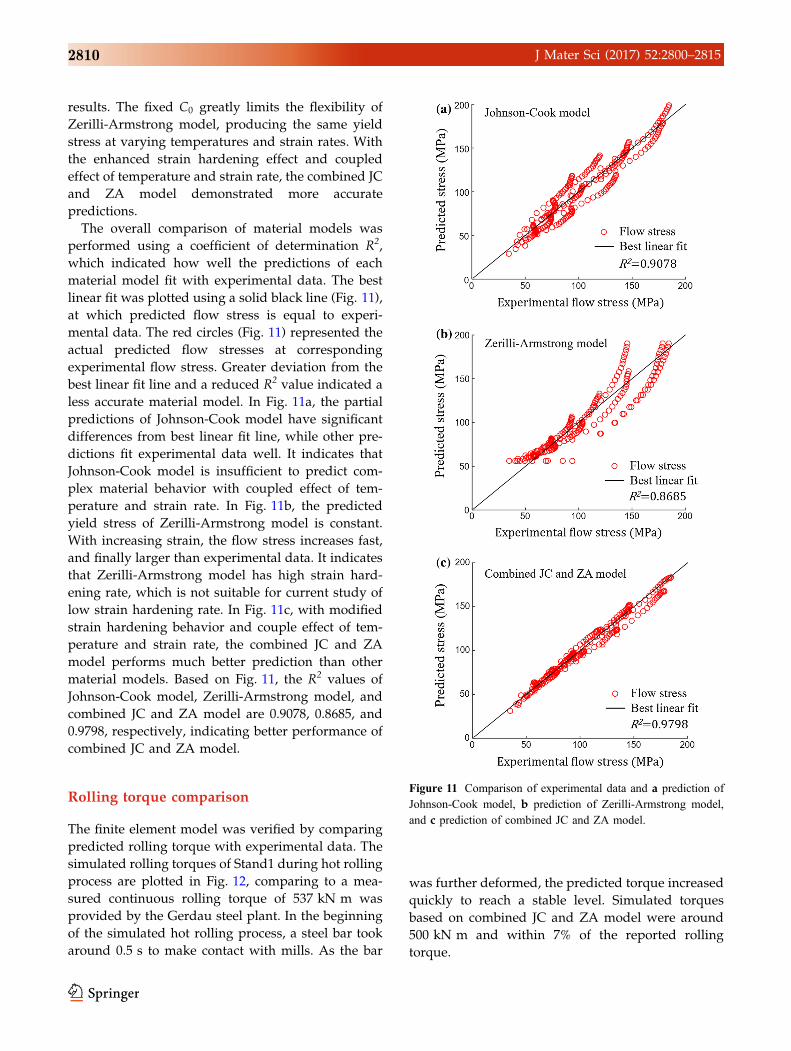
The overall comparison of material models was
performed using a coefficient of determination R2,
which indicated how well the predictions of each
material model fit with experimental data. The best
linear fit was plotted using a solid black line (Fig. 11),
at which predicted flow stress is equal to experi-
mental data. The red circles (Fig. 11) represented the
actual predicted flow stresses at corresponding
experimental flow stress. Greater deviation from the
best linear fit line and a reduced R2 value indicated a
less accurate material model. In Fig. 11a, the partial
predictions of Johnson-Cook model have significant
differences from best linear fit line, while other pre-
dictions fit experimental data well. It indicates that
Johnson-Cook model is insufficient to predict com-
plex material behavior with coupled effect of tem-
perature and strain rate. In Fig. 11b, the predicted
yield stress of Zerilli-Armstrong model is constant.
With increasing strain, the flow stress increases fast,
and finally larger than experimental data. It indicates
that Zerilli-Armstrong model has high strain hard-
ening rate, which is not suitable for current study of
low strain hardening rate. In Fig. 11c, with modified
strain hardening behavior and couple effect of tem-
perature and strain rate, the combined JC and ZA
model performs much better prediction than other
material models. Based on Fig. 11, the R2 values of
Johnson-Cook model, Zerilli-Armstrong model, and
combined JC and ZA model are 0.9078, 0.8685, and
0.9798, respectively, indicating better performance of
combined JC and ZA model.
Rolling torque comparison
The finite element model was verified by comparing
predicted rolling torque with experimental data. The
simulated rolling torques of Stand1 during hot rolling
process are plotted in Fig. 12, comparing to a mea-
sured continuous rolling torque of 537 kN m was
provided by the Gerdau steel plant. In the beginning
of the simulated hot rolling process, a steel bar took
around 0.5 s to make contact with mills. As the bar
was further deformed, the predicted torque increased
quickly to reach a stable level. Simulated torques
based on combined JC and ZA model were around
500 kN m and within 7% of the reported rolling
torque.
Figure 11 Comparison of experimental data and a prediction of
Johnson-Cook model, b prediction of Zerilli-Armstrong model,
and c prediction of combined JC and ZA model.
2810 J Mater Sci (2017) 52:2800–2815
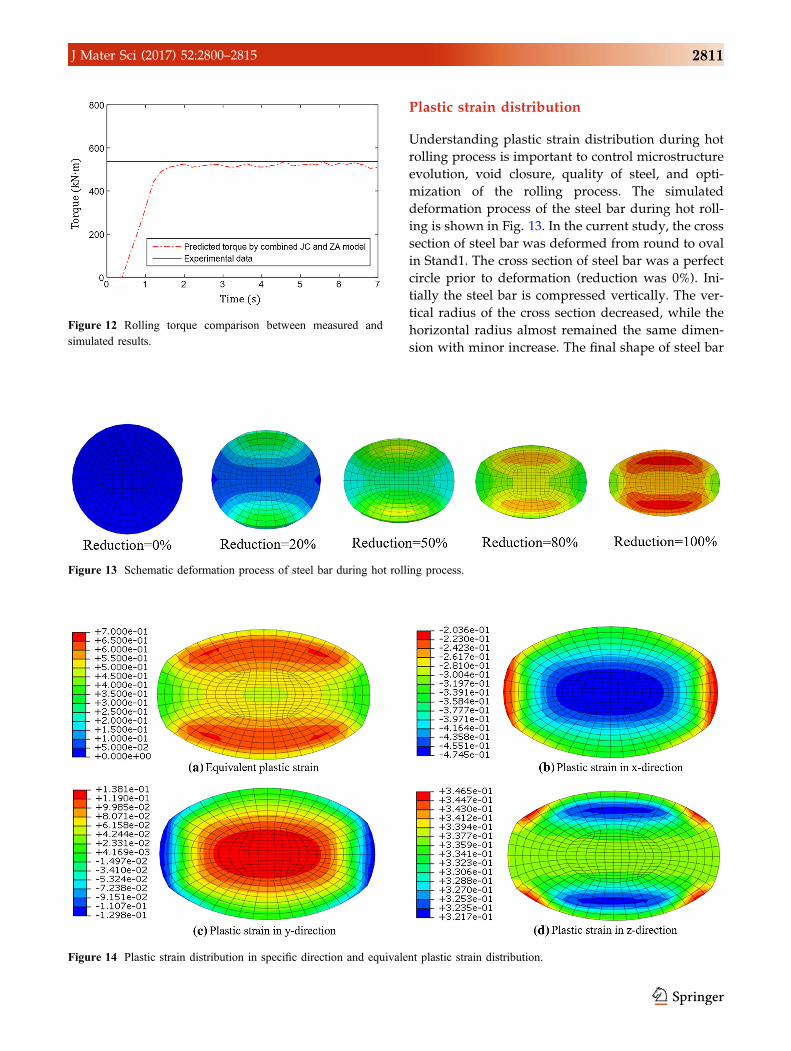
Plastic strain distribution
Understanding plastic strain distribution during hot
rolling process is important to control microstructure
evolution, void closure, quality of steel, and opti-
mization of the rolling process. The simulated
deformation process of the steel bar during hot roll-
ing is shown in Fig. 13. In the current study, the cross
section of steel bar was deformed from round to oval
in Stand1. The cross section of steel bar was a perfect
circle prior to deformation (reduction was 0%). Ini-
tially the steel bar is compressed vertically. The ver-
tical radius of the cross section decreased, while the
horizontal radius almost remained the same dimen-
sion with minor increase. The final shape of steel bar
Figure 12 Rolling torque comparison between measured and
simulated results.
Figure 13 Schematic deformation process of steel bar during hot rolling process.
Figure 14 Plastic strain distribution in specific direction and equivalent plastic strain distribution.
J Mater Sci (2017) 52:2800–2815 2811
cross section was shown in an oval shape with 100%
reduction.
Equivalent plastic strain, as well as plastic strain in
specific directions, was recorded and investigated.
Simulated equivalent plastic strain distributions after
hot deformation are shown in Fig. 14a. The maxi-
mum equivalent plastic strain 0.65 occurred at top
and bottom areas, and a minimum of 0.35 occurs
along the center horizontal axis. Specific strain com-
ponents of the strain tensor can be displayed for the
three normal strains. In the x-direction (Fig. 14b), the
maximum compressive plastic strain was at the bar
center, while smallest plastic strain happened on the
bar sides, which were not contacted with the mills.
Plastic strain in the y-direction (Fig. 14c) was a mix-
ture of tension at the bar center and compression on
the surfaces. During this rolling process, material at
the central portion of the bar moved towards the
surface, while surface friction at the roll caused
internal tension and compression at the surface in y-
direction. In the z-direction (Fig. 14d), the steel bar
was elongated parallel to the rolling direction, and
plastic strain in z-direction varied in a small range
(0.32–0.34).
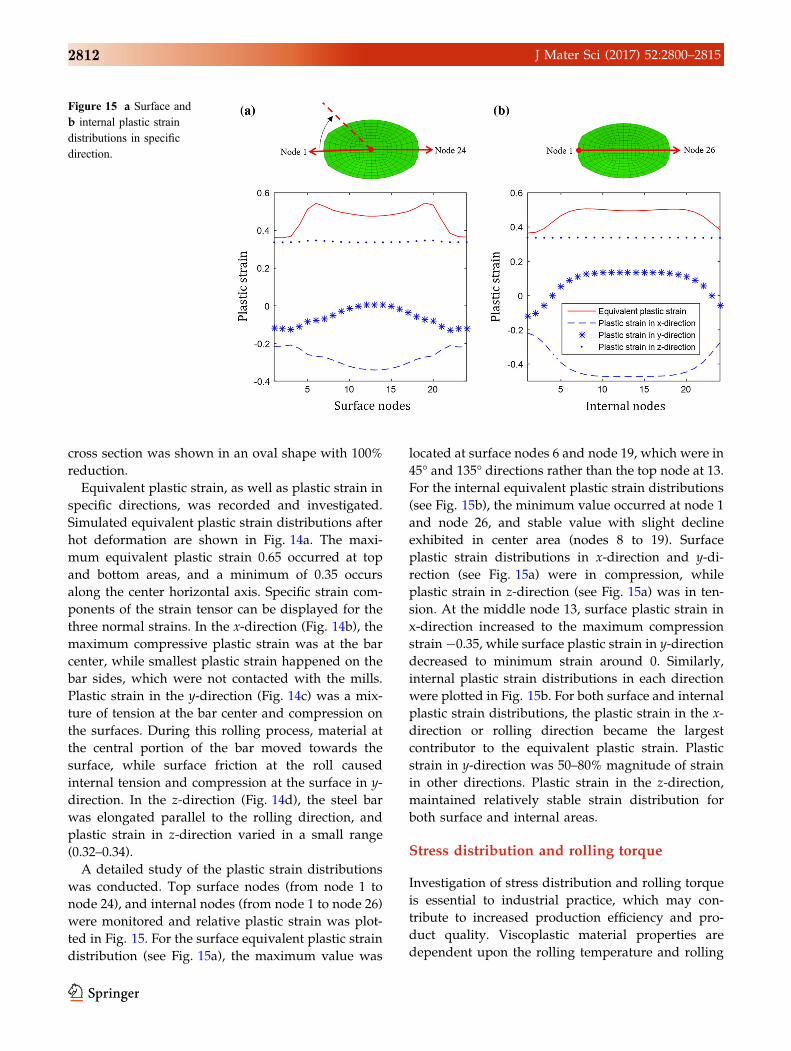
A detailed study of the plastic strain distributions
was conducted. Top surface nodes (from node 1 to
node 24), and internal nodes (from node 1 to node 26)
were monitored and relative plastic strain was plot-
ted in Fig. 15. For the surface equivalent plastic strain
distribution (see Fig. 15a), the maximum value was
located at surface nodes 6 and node 19, which were in
45� and 135� directions rather than the top node at 13.
For the internal equivalent plastic strain distributions
(see Fig. 15b), the minimum value occurred at node 1
and node 26, and stable value with slight decline
exhibited in center area (nodes 8 to 19). Surface
plastic strain distributions in x-direction and y-di-
rection (see Fig. 15a) were in compression, while
plastic strain in z-direction (see Fig. 15a) was in ten-
sion. At the middle node 13, surface plastic strain in
x-direction increased to the maximum compression
strain -0.35, while surface plastic strain in y-direction
decreased to minimum strain around 0. Similarly,
internal plastic strain distributions in each direction
were plotted in Fig. 15b. For both surface and internal
plastic strain distributions, the plastic strain in the x-
direction or rolling direction became the largest
contributor to the equivalent plastic strain. Plastic
strain in y-direction was 50–80% magnitude of strain
in other directions. Plastic strain in the z-direction,
maintained relatively stable strain distribution for
both surface and internal areas.
Stress distribution and rolling torque
Investigation of stress distribution and rolling torque
is essential to industrial practice, which may con-
tribute to increased production efficiency and pro-
duct quality. Viscoplastic material properties are
dependent upon the rolling temperature and rolling
Figure 15 a Surface and
b internal plastic strain
distributions in specific
direction.
2812 J Mater Sci (2017) 52:2800–2815
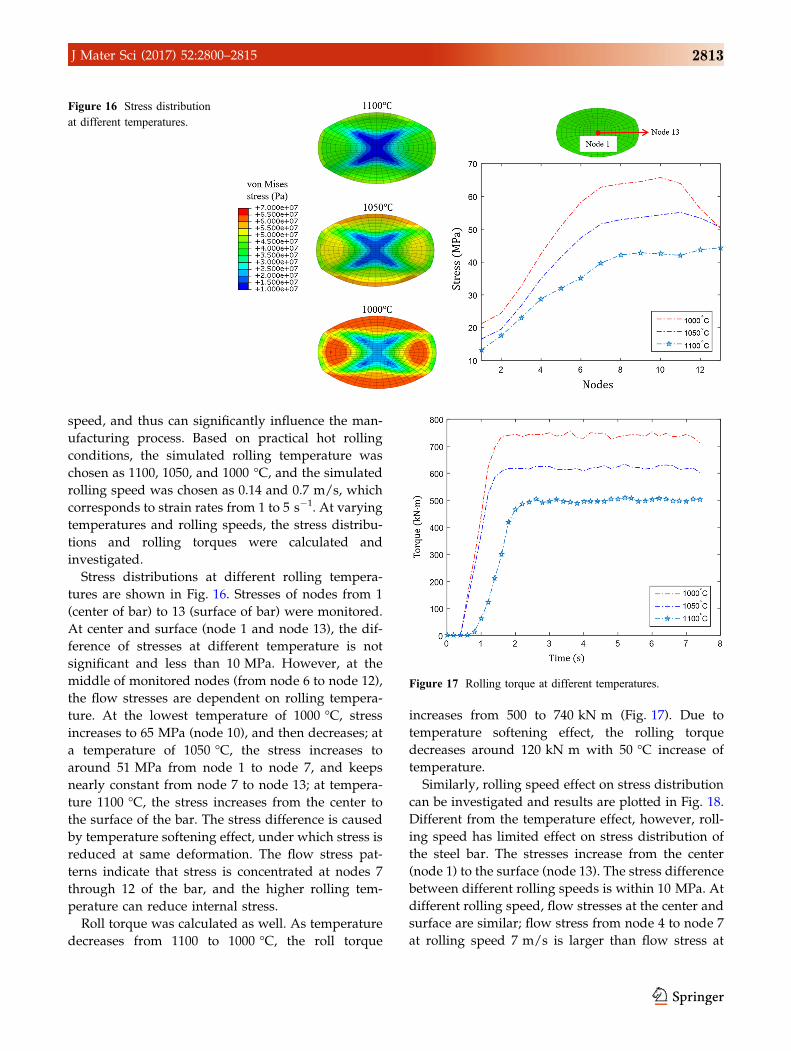
speed, and thus can significantly influence the man-
ufacturing process. Based on practical hot rolling
conditions, the simulated rolling temperature was
chosen as 1100, 1050, and 1000 �C, and the simulated
rolling speed was chosen as 0.14 and 0.7 m/s, which
corresponds to strain rates from 1 to 5 s-1. At varying
temperatures and rolling speeds, the stress distribu-
tions and rolling torques were calculated and
investigated.
Stress distributions at different rolling tempera-
tures are shown in Fig. 16. Stresses of nodes from 1
(center of bar) to 13 (surface of bar) were monitored.
At center and surface (node 1 and node 13), the dif-
ference of stresses at different temperature is not
significant and less than 10 MPa. However, at the
middle of monitored nodes (from node 6 to node 12),
the flow stresses are dependent on rolling tempera-
ture. At the lowest temperature of 1000 �C, stress
increases to 65 MPa (node 10), and then decreases; at
a temperature of 1050 �C, the stress increases to
around 51 MPa from node 1 to node 7, and keeps
nearly constant from node 7 to node 13; at tempera-
ture 1100 �C, the stress increases from the center to
the surface of the bar. The stress difference is caused
by temperature softening effect, under which stress is
reduced at same deformation. The flow stress pat-
terns indicate that stress is concentrated at nodes 7
through 12 of the bar, and the higher rolling tem-
perature can reduce internal stress.
Roll torque was calculated as well. As temperature
decreases from 1100 to 1000 �C, the roll torque
increases from 500 to 740 kN m (Fig. 17). Due to
temperature softening effect, the rolling torque
decreases around 120 kN m with 50 �C increase of
temperature.
Similarly, rolling speed effect on stress distribution
can be investigated and results are plotted in Fig. 18.
Different from the temperature effect, however, roll-
ing speed has limited effect on stress distribution of
the steel bar. The stresses increase from the center
(node 1) to the surface (node 13). The stress difference
between different rolling speeds is within 10 MPa. At
different rolling speed, flow stresses at the center and
surface are similar; flow stress from node 4 to node 7
at rolling speed 7 m/s is larger than flow stress at
Figure 16 Stress distribution
at different temperatures.
Figure 17 Rolling torque at different temperatures.
J Mater Sci (2017) 52:2800–2815 2813
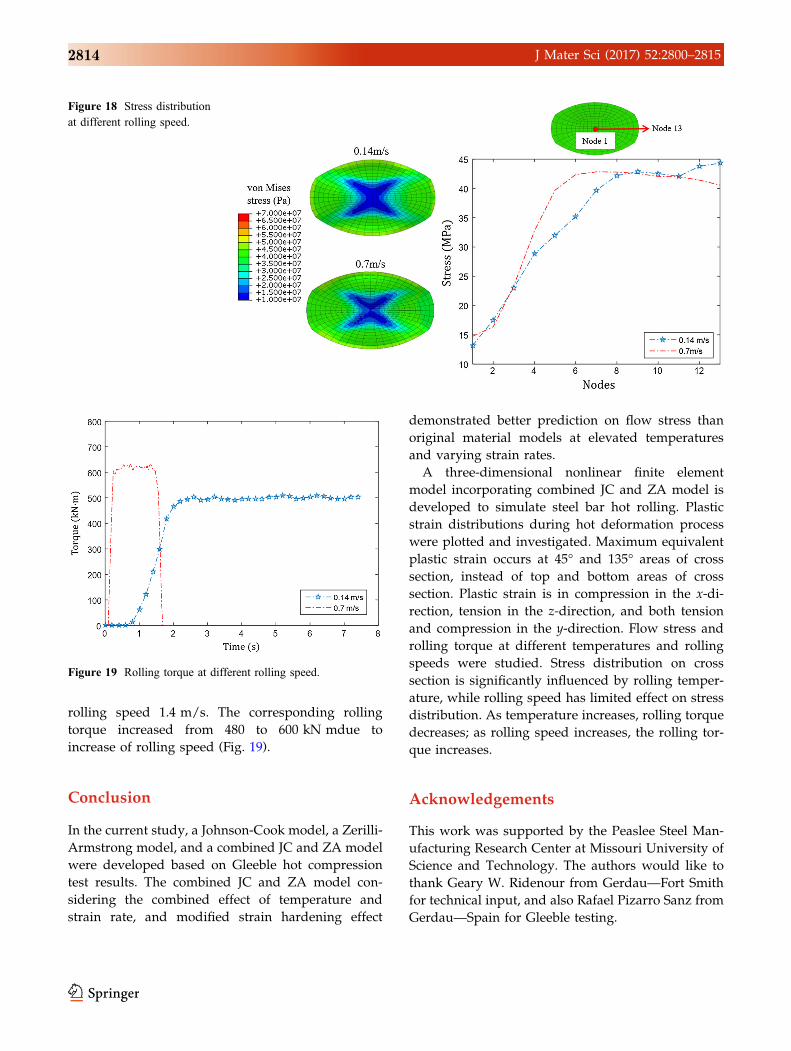
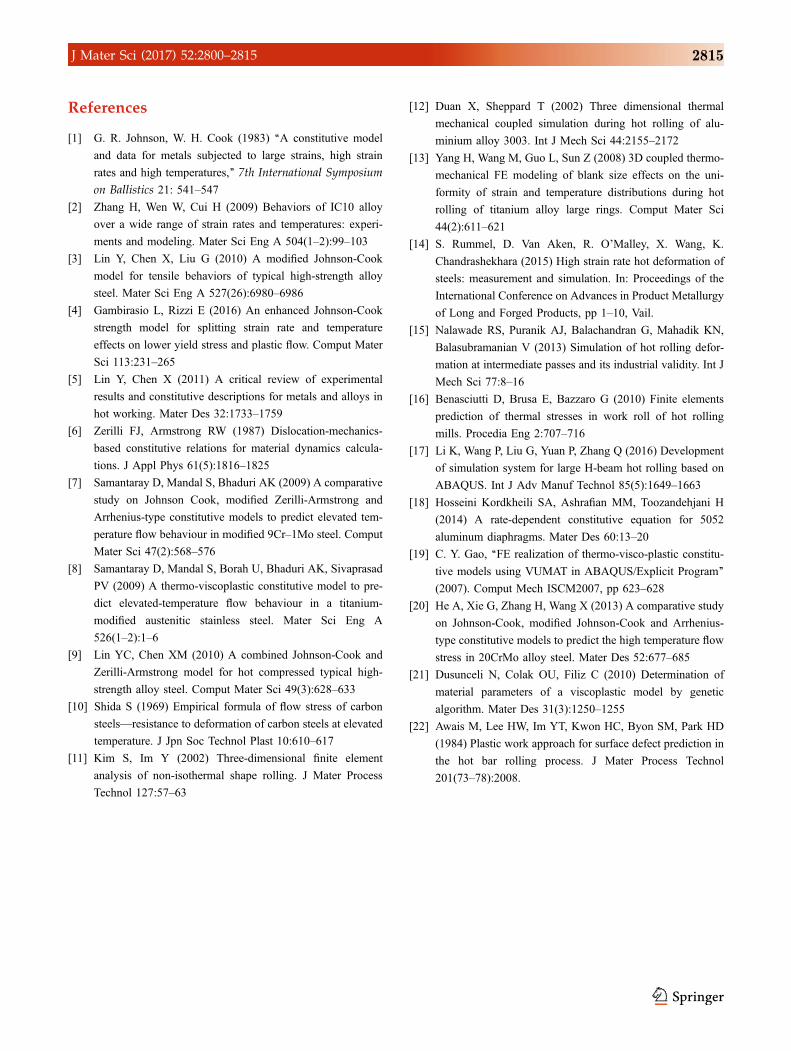
rolling speed 1.4 m/s. The corresponding rolling
torque increased from 480 to 600 kN mdue to
increase of rolling speed (Fig. 19).
Conclusion
In the current study, a Johnson-Cook model, a Zerilli-
Armstrong model, and a combined JC and ZA model
were developed based on Gleeble hot compression
test results. The combined JC and ZA model con-
sidering the combined effect of temperature and
strain rate, and modified strain hardening effect
demonstrated better prediction on flow stress than
original material models at elevated temperatures
and varying strain rates.
A three-dimensional nonlinear finite element
model incorporating combined JC and ZA model is
developed to simulate steel bar hot rolling. Plastic
strain distributions during hot deformation process
were plotted and investigated. Maximum equivalent
plastic strain occurs at 45� and 135� areas of cross
section, instead of top and bottom areas of cross
section. Plastic strain is in compression in the x-di-
rection, tension in the z-direction, and both tension
and compression in the y-direction. Flow stress and
rolling torque at different temperatures and rolling
speeds were studied. Stress distribution on cross
section is significantly influenced by rolling temper-
ature, while rolling speed has limited effect on stress
distribution. As temperature increases, rolling torque
decreases; as rolling speed increases, the rolling tor-
que increases.
Acknowledgements
This work was supported by the Peaslee Steel Man-
ufacturing Research Center at Missouri University of
Science and Technology. The authors would like to
thank Geary W. Ridenour from Gerdau—Fort Smith
for technical input, and also Rafael Pizarro Sanz from
Gerdau—Spain for Gleeble testing.
Figure 18 Stress distribution
at different rolling speed.
Figure 19 Rolling torque at different rolling speed.
2814 J Mater Sci (2017) 52:2800–2815
References
[1] G. R. Johnson, W. H. Cook (1983) ‘‘A constitutive model
and data for metals subjected to large strains, high strain
rates and high temperatures,’’ 7th International Symposium
on Ballistics 21: 541–547
[2] Zhang H, Wen W, Cui H (2009) Behaviors of IC10 alloy
over a wide range of strain rates and temperatures: experi-
ments and modeling. Mater Sci Eng A 504(1–2):99–103
[3] Lin Y, Chen X, Liu G (2010) A modified Johnson-Cook
model for tensile behaviors of typical high-strength alloy
steel. Mater Sci Eng A 527(26):6980–6986
[4] Gambirasio L, Rizzi E (2016) An enhanced Johnson-Cook
strength model for splitting strain rate and temperature
effects on lower yield stress and plastic flow. Comput Mater
Sci 113:231–265
[5] Lin Y, Chen X (2011) A critical review of experimental
results and constitutive descriptions for metals and alloys in
hot working. Mater Des 32:1733–1759
[6] Zerilli FJ, Armstrong RW (1987) Dislocation-mechanics-
based constitutive relations for material dynamics calcula-
tions. J Appl Phys 61(5):1816–1825
[7] Samantaray D, Mandal S, Bhaduri AK (2009) A comparative
study on Johnson Cook, modified Zerilli-Armstrong and
Arrhenius-type constitutive models to predict elevated tem-
perature flow behaviour in modified 9Cr–1Mo steel. Comput
Mater Sci 47(2):568–576
[8] Samantaray D, Mandal S, Borah U, Bhaduri AK, Sivaprasad
PV (2009) A thermo-viscoplastic constitutive model to pre-
dict elevated-temperature flow behaviour in a titanium-
modified austenitic stainless steel. Mater Sci Eng A
526(1–2):1–6
[9] Lin YC, Chen XM (2010) A combined Johnson-Cook and
Zerilli-Armstrong model for hot compressed typical high-
strength alloy steel. Comput Mater Sci 49(3):628–633
[10] Shida S (1969) Empirical formula of flow stress of carbon
steels—resistance to deformation of carbon steels at elevated
temperature. J Jpn Soc Technol Plast 10:610–617
[11] Kim S, Im Y (2002) Three-dimensional finite element
analysis of non-isothermal shape rolling. J Mater Process
Technol 127:57–63
[12] Duan X, Sheppard T (2002) Three dimensional thermal
mechanical coupled simulation during hot rolling of alu-
minium alloy 3003. Int J Mech Sci 44:2155–2172
[13] Yang H, Wang M, Guo L, Sun Z (2008) 3D coupled thermo-
mechanical FE modeling of blank size effects on the uni-
formity of strain and temperature distributions during hot
rolling of titanium alloy large rings. Comput Mater Sci
44(2):611–621
[14] S. Rummel, D. Van Aken, R. O’Malley, X. Wang, K.
Chandrashekhara (2015) High strain rate hot deformation of
steels: measurement and simulation. In: Proceedings of the
International Conference on Advances in Product Metallurgy
of Long and Forged Products, pp 1–10, Vail.
[15] Nalawade RS, Puranik AJ, Balachandran G, Mahadik KN,
Balasubramanian V (2013) Simulation of hot rolling defor-
mation at intermediate passes and its industrial validity. Int J
Mech Sci 77:8–16
[16] Benasciutti D, Brusa E, Bazzaro G (2010) Finite elements
prediction of thermal stresses in work roll of hot rolling
mills. Procedia Eng 2:707–716
[17] Li K, Wang P, Liu G, Yuan P, Zhang Q (2016) Development
of simulation system for large H-beam hot rolling based on
ABAQUS. Int J Adv Manuf Technol 85(5):1649–1663
[18] Hosseini Kordkheili SA, Ashrafian MM, Toozandehjani H
(2014) A rate-dependent constitutive equation for 5052
aluminum diaphragms. Mater Des 60:13–20
[19] C. Y. Gao, ‘‘FE realization of thermo-visco-plastic constitu-
tive models using VUMAT in ABAQUS/Explicit Program’’
(2007). Comput Mech ISCM2007, pp 623–628
[20] He A, Xie G, Zhang H, Wang X (2013) A comparative study
on Johnson-Cook, modified Johnson-Cook and Arrhenius-
type constitutive models to predict the high temperature flow
stress in 20CrMo alloy steel. Mater Des 52:677–685
[21] Dusunceli N, Colak OU, Filiz C (2010) Determination of
material parameters of a viscoplastic model by genetic
algorithm. Mater Des 31(3):1250–1255
[22] Awais M, Lee HW, Im YT, Kwon HC, Byon SM, Park HD
(1984) Plastic work approach for surface defect prediction in
the hot bar rolling process. J Mater Process Technol
201(73–78):2008.
J Mater Sci (2017) 52:2800–2815 2815


![Effect of Ladle, Tundish and Mold Design on Melt Flow ...web.mst.edu/~lekakhs/webpage Lekakh/Articles/187.pdf · FLUENT 12.0 CFD software [9] was used to solve multiple cases of 3-D](https://img.pdfslide.us/doc/110x75/5ecf79b96085d9294e78d652/effect-of-ladle-tundish-and-mold-design-on-melt-flow-webmstedulekakhswebpage.jpg)


![[PPT]PowerPoint Presentation - Missouri University of …web.mst.edu/~konurd/5412_files/Lecture Notes 01 - Linear... · Web viewEMGT 5412OperationsManagement Science Linear Programming:](https://img.pdfslide.us/doc/110x75/5adf40087f8b9ab4688be4a0/pptpowerpoint-presentation-missouri-university-of-webmstedukonurd5412fileslecture.jpg)