Embed Size (px)
Citation preview

INCLUSION ENGINEERING FOR IMPROVED PROPERTIES
IN STEEL CASTINGS
Kent D. Peaslee1, Vintee Singh
2 and Simon N. Lekakh
1
1Missouri University of Science & Technology
2Nucor Steel - Hickman
ABSTRACT
One of the most important factors affecting the toughness of steel castings is steel cleanliness.
Steel cleanliness is determined by the number, size, shape, and composition of the final
nonmetallic inclusions in the steel matrix. This paper reports on the effects of changing the melt
and ladle practices (calcium treatment, argon stirring, etc.) in steel foundries on the cleanliness
and resulting toughness of the final steel castings. Practice changes are correlated with inclusion
characterization using automated inclusion analysis and with final casting properties. FLUENT
modeling was used to understand the effects of various ladle parameters on the inclusion
flotation. This paper will correlate the toughness of steel castings with inclusion volume, shape
and spacing as influenced by ladle treatment before casting.
KEY WORDS: inclusions, reoxidation, toughness, calcium treatment
INTRODUCTION
Higher quality steel is being required in many new applications forcing steelmakers to ensure that
their steel products meet more stringent “cleanliness” standards. Mechanical properties are
affected by the volume fraction, size, distribution, composition, and morphology of inclusions.
The toughness of steel is very important in many critical applications where fracture resulting in
failure could produce catastrophic effects. Hence, the determination of the exact composition,
morphology and location of non-metallic inclusions is essential to the success of research aimed
at increasing toughness of steel parts.
Most inclusions in steel castings are a product of deoxidation in the ladle or reoxidation during
processing. During deoxidation, the dissolved oxygen content of the steel is reduced by adding
elements that have a greater affinity for oxygen than carbon and form thermodynamically more
stable oxides than iron oxide. The most common deoxidizer for steel castings is aluminum,
which produces solid particles of Al2O3. Alumina inclusions are dendritic when formed in a high
oxygen environment such as reoxidation and often coalesce to create irregular shaped “alumina
clusters” as a result of the collision of smaller particles1. These clusters significantly affect the
mechanical properties of steel, especially fracture sensitive properties such as toughness and
fatigue life, and may also result in the generation of surface defects2.
Exogenous inclusions arise from unintentional chemical and mechanical interaction of liquid steel
with its surroundings. They are generally deleterious to fracture sensitive mechanical properties
because of their large size and location near the surface3. The majority of these inclusions are
formed by reoxidation in which liquid steel, having "free" deoxidants (Al, Si, Mn or Ca) dissolved
in the molten steel, picks up oxygen from contact with the air during pouring and transportation
through the gating system. In addition, inclusions can be formed by reaction of the liquid steel

with gases or water vaporizing from the molding sands and debris in the gating system.
Exogenous inclusions are usually entrapped accidentally during tapping, pouring and
solidification resulting in a random distribution throughout steel castings. These inclusions act as
heterogeneous nucleation sites for precipitation of new inclusions during their motion in molten
steel4.
In a cast steel product, non-metallic inclusions are one of the primary sites at which void
nucleation occurs. Voids nucleated at an inclusion, either by decohesion of the inclusion-steel
interface or by inclusion fracture, grow until they coalesce by impingement or by the process of
void sheet coalescence.5 Void sheet coalescence requires fracture of the ligament between the
voids created at the larger non-metallic inclusions. Fracture toughness is the ability of a material
to arrest an existing crack and prevent the onset of rapid crack propagation at stress levels below
the yield stress.6 The characteristic inclusion volume fraction and the inclusion spacing have been
shown to greatly influence the fracture toughness of steel. Recent research has shown that
decreasing the volume fraction of inclusions that induce void nucleation and increasing the
inclusion spacing result in significant improvement in toughness.7 Hahn et al
8 found that fracture
toughness of steel (K1C) inversely varied with the volume fraction of the inclusions according to
Equation 1:
EdVK yieldfI 3
1
6
1
62
(1)
where: KI is fracture toughness, Vf is volume fraction of the inclusions, σyield
is
yield strength, E
is Young’s modulus, and d is particle diameter.
The fracture toughness varies directly with the inclusion spacing according to Equation 2:
21
1 )2( EsK yield
(2)
where: K1 is fracture toughness, σyield is
yield strength, E is Young’s modulus, and s is average
spacing between the inclusions.
One technique used to diminish the harmful effects of inclusions in steel is calcium treatment.
When Ca-treatment is effective, alumina inclusions are converted to molten calcium aluminates
which are globular in shape. The calcium aluminate inclusions retained in the steel suppress the
formation of harmful MnS inclusions during the solidification of steel by modifying MnS
inclusions to spherical CaS inclusions. When alumina is modified to calcium aluminate, the
reaction sequence with additional calcium additions (illustrated in Figure 1) is: Al2O3 -> CA6 ->
CA2 -> CA -> C12A7 , where C and A denotes CaO and Al2O3, respectively. The presence of
liquid calcium aluminates, CA2, CA, C12A7 at steelmaking temperatures (~ 1600 oC) results in
inclusions that are much easier to float than the solid alumina inclusions and also reduce the
tendency of blocking ladle and casting nozzles.
Although there has been a significant work done in larger steelmaking shops, very little research
has been done in proving the effects of calcium treatment in smaller ladles (less than 10 tons).
The purpose of this research was to investigate the effectiveness of calcium treatment in steel
foundries and determine the benefits on toughness. In order to increase the speed and efficiency
of inclusion evaluation, this research uses an automated inclusion analyzer, ASPEX PICA-1020.

Figure 1: Change in stable inclusion composition in Al-killed medium-carbon cast steel
with Ca-treatment, calculated with FACTSAGE software at 1600°C.
This equipment provides a rapid and accurate method for determining the composition, size,
number, spacing and distribution of inclusions present in the steel samples. It is an integrated
SEM and EDS system and allows for automated characterization of all the inclusions (1 μm to 5
mm) in a microscopic specimen including the volume fraction, size and shape, and complete
inclusion identification. In order to measure the spacing between the inclusions, all of the x-y
inclusion coordinates provided by the ASPEX inclusion analyzer were transported to a Microsoft
Excel file and a code written in Visual Basic to calculate the distance of an inclusion from each of
the other inclusions and determine the distance to the closest neighbor. These distances are
averaged over all inclusions to determine the average spacing between the inclusions in the
specimen in the final inclusions analysis.
CFD MODELING OF INCLUSION BEHAVIOR
Computational fluid dynamic (CFD) modeling using commercial software (FLUENT CFD
Version 6.3.26) was performed to predict inclusion flotation in typical foundry ladles as affected
by ladle capacity, inclusion type, inclusion size and argon stirring. Non-steady state heat transfer
was solved by using a “coupled” thermal boundary between the liquid steel (1600°C) and the
preheated ladle lining (900°C) assuming that there was radiation and convection from the open
steel surface at the top. Free convection flow of the liquid metal was solved using the Boussinesq
density model for thermally expanded liquids. Inclusions were injected into the liquid steel
through the central vertical plane. Heat transfer and flow equations were solved by applying the
specific drag forces assuming that solid particles were either spherical or non-spherical (shape
factor of 3.0). To simulate the formation of liquid inclusions (calcium injection), inclusions were
introduced in the liquid metal as liquid droplets with the possibility of collision and coalescence.
It was assumed that the injected particles were reflected back into the metal from the bottom of
the ladle while the particles escaped reaching the top or the sides of the metal surface.
The flotation of different size spherical inclusions by gravity forces alone and by natural
convection in a ladle is compared in Figure 2. It can be observed that although large spherical
particles float and escape in approximately the same time for both the cases, micron-sizes
particles were not floated out by gravity, but were partially removed from the liquid metal by
natural convection.
0
0.01
0.02
0.03
0.04
0.05
0 0.01 0.02 0.03 0.04 0.05 0.06
Incl
usi
on
s fo
rme
d, w
eig
ht
%
Ca additive, weight %
Al2O3
MnS
CaS
CACA6
CaO
C3A
CA2
CA

Figure 2: Comparison of inclusion flotation due to gravity and natural convection in the ladle
Figure 3a shows the effect of the inclusion shape factor and density on inclusion flotation in the
ladle, in the presence of natural convection in the liquid steel. Particles with lower density floated
faster than higher density particles. Non-spherical particles floated faster than spherical particles
because of the drag force, which is greater on the non-spherical particles and helps particles float
out under natural convection. Liquid droplets resulted in the highest flotation rate. As the number
of liquid calcium aluminate droplets increase with time, the possibility of droplet collision and
coalescence also increase with time. Droplet coalescence results in larger particles and a higher
flotation rate. Therefore, calcium treatment that modifies solid alumina and forms liquid calcium
aluminate inclusions has the opportunity of reducing the total number of inclusions.
The flotation of the injected spherical particles in the molten metal, in the presence of only
natural convection, for different ladle capacities is shown in Figure 3b. Ladle size has a negligible
effect on particle flotation in the model. Larger ladles had longer flotation distances compared to
the smaller ladle, but more intensive convection, thus reducing the flotation time. Because of
these two factors, the limited hold-time of the molten steel in the ladle is the main factor limiting
inclusion flotation.
The CFD modeling suggested two possible methods for increasing steel cleanliness. The first
method is modification of solid inclusions into liquid droplets by changing the composition
during Ca-treatment. The second method is to increase the intensity of the flow of the molten
metal by Ar-stirring in the ladle. Figure 4 shows the particle motion of spherical inclusions (50
µm diam.) in a ladle during Ar-stirring from the bottom. It can be seen that most of the particles
escaped the ladle after a 60 second Ar-stir. Figure 5 compares three mechanisms of inclusion
flotation, gravity, natural convection and Ar-stirring showing graphically the advantage of Ar-
stirring. The applied model did not take into account the attachment of particles to the bubble
surface which would increase the flotation efficiency.
EXPERIMENTAL PROCEDURE
Five heats (10 ladles) trials were completed at an industrial foundry to determine the effects of
Ca-wire feeding and Ar-stirring in the ladle on inclusion content in medium carbon cast steel. The
steel was melted in a one ton induction furnace and tapped twice into 1000 lb ladles. A
submerged lance was used for Ar-stirring in the ladle.
0
20
40
60
80
100
0 1 2 3 4 5
Par
ticl
e n
um
be
r (%
)
Time (min)
0.005 mm (convection)
0.005 mm (gravity)
0.2 mm (convection)
0.2 mm (gravity)
1 mm (convection)
1 mm (gravity)
9100 kg ladle

a) b)
Figure 3: Effect of a) particle geometry, density and form and b) ladle size on the inclusion
escape rate under the influence of natural convection
1 sec 4 sec 20 sec 60 sec
Figure 4: Effect of Ar-stirring (3.5 cfm in center of bottom) on distribution of 50 µm spherical
inclusions in a 9100 kg capacity ladle
Figure 5: Comparison of inclusion flotation rates in a ladle under different flotation mechanisms
0
10
20
30
40
50
60
70
80
90
100
40
50
60
70
80
90
100
0 1 2 3 4
Co
ale
sce
d d
rop
lets
(%
)
Pa
rtic
le n
um
be
r (%
)
Time (min)
Spherical solid
Nonspherical solid (factor 3)
Escaped coalesced droplets
Spherical solid, 1.7 g/cm3
Coalesced droplets
9100 kg ladle, 0.005 mm
40
50
60
70
80
90
100
0 2 4 6 8 10
Time (min)
Per
cen
t o
f p
arti
cle
rem
ain
ing
60 kg
335 kg
2700 kg
9100 kg
0.005 mm
inclusins
60 kg
335kg
2700kg
9100kg
2.7 g/cc

0
0.0002
0.0004
0.0006
0.0008
0.001
0.0012
0.0014
0.0016
0.0018
Furnace
before
deoxidants
Furnace after
Al addition
Ladle after
deoxidants
Ladle end of
pour
Final CastingFra
cti
on
of
are
a c
ov
ere
d b
y in
clu
sio
ns
others
TiO2
CA
Al2O3
MnO
MnSiO3
CaS
MnS
SulfidesSulfidesSulfidesSulfides
Oxides
OxidesOxides
Oxides
Sulfides
Oxides
After the steel was melted in the induction furnace, it was deoxidized with an addition of 0.04
weight % Al and alloyed to meet the final chemistry specification (aim in wt%: 0.25%C,
0.75%Mn, <0.01%P, <0.020%S, and 0.40%Si). During tap, an additional 1 lb of Al, 0.66 lbs of
Fe70Ti and 0.88 lbs of Fe51Si35Zr were added into the 1000 lb ladle. Ladle treatment options
included CaSi wire additions, Ca-wire additions Ar-lance stirring in the ladle for 1 min, and
combined Ar-stirring and CaSi wire additions.
Steel chemistry samples were collected from the furnace, ladle and mold using submerged
chemistry samplers. The samples were collected before and after deoxidation and post-tap
treatment. In addition, samples were cut from standard keel blocks cast from the same ladle.
Microscopic specimens were prepared from these samples and a 10 mm2 area was analyzed in
each specimen for inclusions using the Aspex PICA-1020 automated inclusion analyzer.
In order to conduct Charpy impact testing, cast keel blocks were poured during each trial. The
keel blocks were normalized by holding at 1650°F (900°C) for 1.5 hours and then air-cooled.
Charpy V-notch specimens of dimensions 10mm×10mm×55mm were prepared according to
ASTM E23 standards. The Charpy impact tests were conducted at a temperature of -40°C.
RESULTS AND DISCUSSION
Standard Practice: One ladle was treated using the standard melting practice with no additional
post-tap treatment. Figure 6 compares the total and dissolved oxygen and the inclusion area
fraction at the various stages of liquid processing. The dissolved oxygen dropped after
deoxidation, resulting in the formation of a large number of oxide inclusions and an increase in
the total oxygen. The total area of the oxide inclusions and the total oxygen increased during the
pour and also the casting had more inclusions than in the ladle, suggesting that there is significant
reoxidation during pouring and liquid steel transport. The area of Al2O3 and TiO2 inclusions
increased after the Al and FeTi additions in the ladle. The average size of the TiO2 inclusions in
the samples was 1.7 μm, significantly smaller than alumina inclusions which averaged 2.8 μm in
diameter.
a) b)
Figure 6: a) Oxygen content and b) area of inclusions by composition in the steel at various
stages of the casting process (standard practice with no Ca-wire or Ar-stir)
Ca-Treatment: To study the effects of Ca-treatment, ladles were fed with either CaSi-wire or
pure Ca-wire in the ladle. Figure 7 compares the total and dissolved oxygen in the liquid steel
and the area fraction covered by inclusions in calcium-treated steel (0.028 wt. % Ca added using
CaSi-wire). After Al-treatment in the furnace, there was an increase in the volume of alumina
0
20
40
60
80
100
120
140
160
180
200
Furnace
before
deoxidants
Furnace after
Al addition
Ladle after
deoxidants
Ladle end of
pour
Final Casting
Am
ou
nt
of
oxyg
en
(p
pm
)
Dissolved O
Total O
0
0.0002
0.0004
0.0006
0.0008
0.001
0.0012
0.0014
0.0016
0.0018
0 0.01 0.02 0.03 0.04 0.05 0.06 0.07
Wt% of Ca added
Fra
cti
on
of
are
a c
overe
d b
y i
nclu
sio
ns
0
0.0002
0.0004
0.0006
0.0008
0.001
0.0012
0.0014
0.0016
0.0018
Ladle after
deoxidants
Ladle before
CaSi
Ladle after
CaSi
Ladle end of
pour
Final CastingFra
cti
on
of
are
a c
ov
ere
d b
y i
nc
lus
ion
s
others
TiO2
CA
Al2O3
MnO
MnSiO3
CaS
MnS
SulfidesSulfidesSulfidesSulfides
OxidesOxides
Oxides
Oxides
Sulfides
Oxides
0
20
40
60
80
100
120
140
160
180
200
Ladle after
deoxidants
Ladle before
CaSi
Ladle after
CaSi
Ladle end of
pour
Final Casting
Am
ou
nt
of
oxyg
en
(p
pm
)
Dissolved O
Total O
0
20
40
60
80
100
120
140
160
180
200
0 0.01 0.02 0.03 0.04 0.05 0.06 0.07
Wt% of Ca added
Am
ou
nt
of
ox
yg
en
(p
pm
)
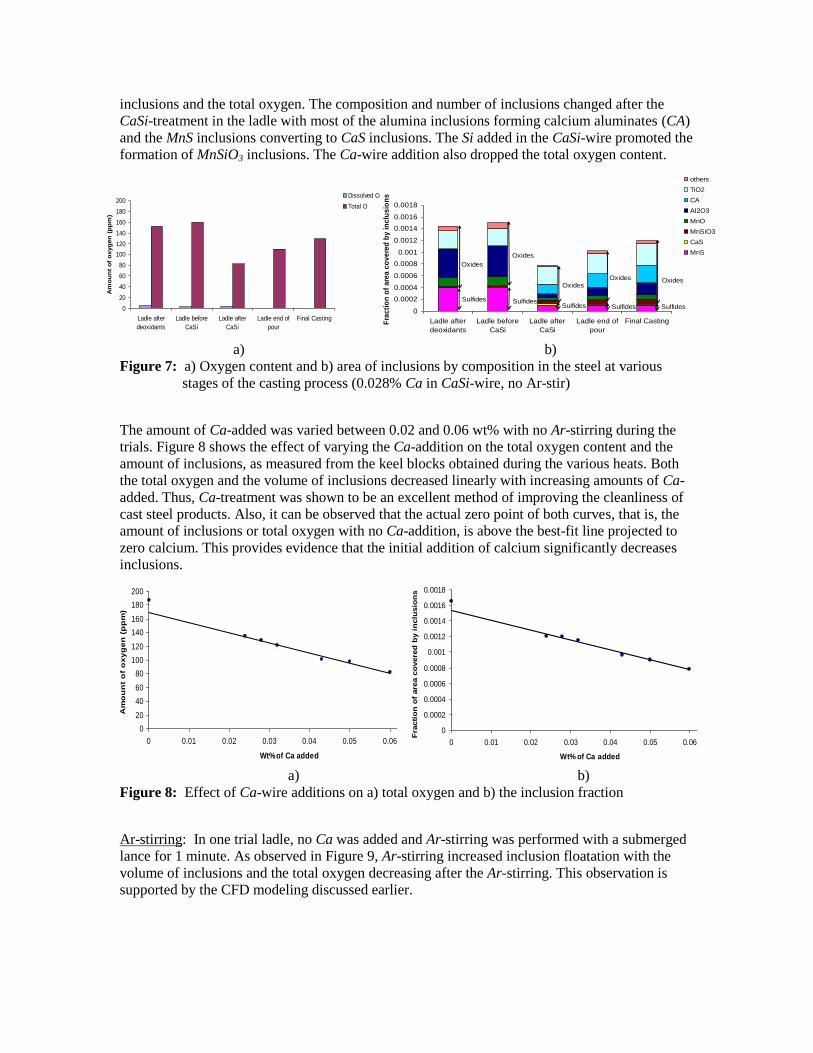
inclusions and the total oxygen. The composition and number of inclusions changed after the
CaSi-treatment in the ladle with most of the alumina inclusions forming calcium aluminates (CA)
and the MnS inclusions converting to CaS inclusions. The Si added in the CaSi-wire promoted the
formation of MnSiO3 inclusions. The Ca-wire addition also dropped the total oxygen content.
a) b)
Figure 7: a) Oxygen content and b) area of inclusions by composition in the steel at various
stages of the casting process (0.028% Ca in CaSi-wire, no Ar-stir)
The amount of Ca-added was varied between 0.02 and 0.06 wt% with no Ar-stirring during the
trials. Figure 8 shows the effect of varying the Ca-addition on the total oxygen content and the
amount of inclusions, as measured from the keel blocks obtained during the various heats. Both
the total oxygen and the volume of inclusions decreased linearly with increasing amounts of Ca-
added. Thus, Ca-treatment was shown to be an excellent method of improving the cleanliness of
cast steel products. Also, it can be observed that the actual zero point of both curves, that is, the
amount of inclusions or total oxygen with no Ca-addition, is above the best-fit line projected to
zero calcium. This provides evidence that the initial addition of calcium significantly decreases
inclusions.
a) b)
Figure 8: Effect of Ca-wire additions on a) total oxygen and b) the inclusion fraction
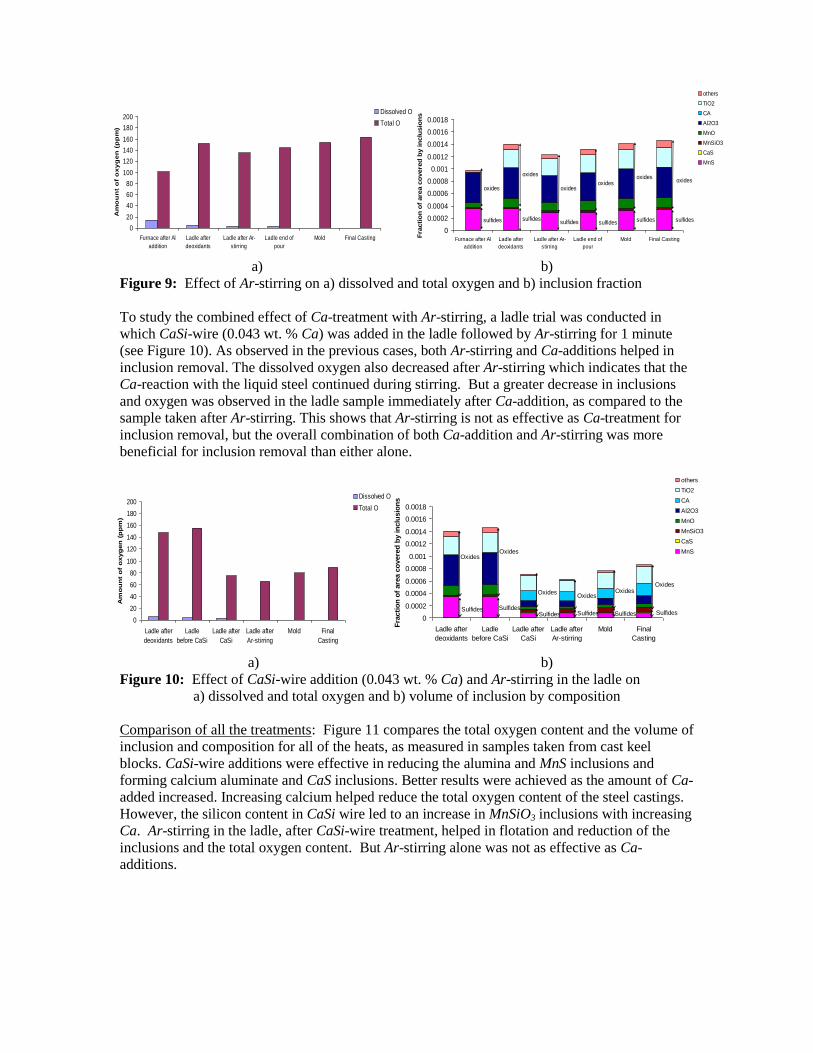
Ar-stirring: In one trial ladle, no Ca was added and Ar-stirring was performed with a submerged
lance for 1 minute. As observed in Figure 9, Ar-stirring increased inclusion floatation with the
volume of inclusions and the total oxygen decreasing after the Ar-stirring. This observation is
supported by the CFD modeling discussed earlier.
0
0.0002
0.0004
0.0006
0.0008
0.001
0.0012
0.0014
0.0016
0.0018
Furnace after Al
addition
Ladle after
deoxidants
Ladle after Ar-
stirring
Ladle end of
pour
Mold Final Casting
Fra
cti
on
of
are
a c
overe
d b
y in
clu
sio
ns
others
TiO2
CA
Al2O3
MnO
MnSiO3
CaS
MnS
sulfidessulfidessulfidessulfidessulfides
oxidesoxides
oxides
oxides
oxides
oxides
sulfides
0
0.0002
0.0004
0.0006
0.0008
0.001
0.0012
0.0014
0.0016
0.0018
Ladle after
deoxidants
Ladle
before CaSi
Ladle after
CaSi
Ladle after
Ar-stirring
Mold Final
Casting
Fra
cti
on
of
are
a c
overe
d b
y in
clu
sio
ns
others
TiO2
CA
Al2O3
MnO
MnSiO3
CaS
MnS
SulfidesSulfidesSulfidesSulfidesSulfides
OxidesOxides
Oxides
OxidesOxides
Sulfides
Oxides
0
20
40
60
80
100
120
140
160
180
200
Furnace after Al
addition
Ladle after
deoxidants
Ladle after Ar-
stirring
Ladle end of
pour
Mold Final Casting
Am
ou
nt
of
ox
yg
en
(p
pm
)Dissolved O
Total O
0
20
40
60
80
100
120
140
160
180
200
Ladle after
deoxidants
Ladle
before CaSi
Ladle after
CaSi
Ladle after
Ar-stirring
Mold Final
Casting
Am
ou
nt
of
oxyg
en
(p
pm
)
Dissolved O
Total O
a) b)
Figure 9: Effect of Ar-stirring on a) dissolved and total oxygen and b) inclusion fraction
To study the combined effect of Ca-treatment with Ar-stirring, a ladle trial was conducted in
which CaSi-wire (0.043 wt. % Ca) was added in the ladle followed by Ar-stirring for 1 minute
(see Figure 10). As observed in the previous cases, both Ar-stirring and Ca-additions helped in
inclusion removal. The dissolved oxygen also decreased after Ar-stirring which indicates that the
Ca-reaction with the liquid steel continued during stirring. But a greater decrease in inclusions
and oxygen was observed in the ladle sample immediately after Ca-addition, as compared to the
sample taken after Ar-stirring. This shows that Ar-stirring is not as effective as Ca-treatment for
inclusion removal, but the overall combination of both Ca-addition and Ar-stirring was more
beneficial for inclusion removal than either alone.
a) b)
Figure 10: Effect of CaSi-wire addition (0.043 wt. % Ca) and Ar-stirring in the ladle on
a) dissolved and total oxygen and b) volume of inclusion by composition
Comparison of all the treatments: Figure 11 compares the total oxygen content and the volume of
inclusion and composition for all of the heats, as measured in samples taken from cast keel
blocks. CaSi-wire additions were effective in reducing the alumina and MnS inclusions and
forming calcium aluminate and CaS inclusions. Better results were achieved as the amount of Ca-
added increased. Increasing calcium helped reduce the total oxygen content of the steel castings.
However, the silicon content in CaSi wire led to an increase in MnSiO3 inclusions with increasing
Ca. Ar-stirring in the ladle, after CaSi-wire treatment, helped in flotation and reduction of the
inclusions and the total oxygen content. But Ar-stirring alone was not as effective as Ca-
additions.

0
0.0002
0.0004
0.0006
0.0008
0.001
0.0012
0.0014
0.0016
0.0018
0.00 % Ca
0.00 ft/min
No Stir
Ladle Stir 0.024% Ca
12.5 ft/min
No Stir
0.028% Ca
12.5 ft/min
No Stir
0.032% Ca
12.5 ft/min
No Stir
0.043% Ca
12.5 ft/min
No Stir
0.043% Ca
12.5 ft/min
Ladle Stir
0.05% Ca
12.5 ft/min
No Stir
0.06% Ca
20 ft/min
No Stir
Fra
cti
on
of
are
a c
overe
d b
y in
clu
sio
ns Others
TiO2
CA
Al2O3
MnO
MnSiO3
CaS
MnS
0
20
40
60
80
100
120
140
160
180
200
0.00 % Ca
0.00 ft/min
No Stir
Ladle Stir 0.024% Ca
12.5 ft/min
No Stir
0.028% Ca
12.5 ft/min
No Stir
0.032% Ca
12.5 ft/min
No Stir
0.043% Ca
12.5 ft/min
No Stir
0.043% Ca
12.5 ft/min
Ladle Stir
0.05% Ca
12.5 ft/min
No Stir
0.06% Ca
20 ft/min
No Stir
Am
ou
nt
of
ox
yg
en
(p
pm
)
a)
b)
Figure 11: Comparison of a) total oxygen and b) volume and composition of inclusions
in cast keel blocks (from all trial ladles)
Toughness Results: Standard Charpy V-notch specimens were machined from normalized
(900oC for 1.5 hours) keel blocks according to ASTM E23 standards. Three Charpy tests were
completed at -40°C for each trial heat and the average plotted in the attached figures. As shown
in Figure 12, the toughness increased with the amount of calcium. Ar-stirring was also found to
be beneficial in increasing the toughness. The highest toughness average was for the trial with the
combined CaSi-addition and Ar-stirring.
As given in Equation 1 earlier, fracture toughness theoretically varies linearly with (Vf)-1/6
, where
Vf is the volume fraction of inclusions, assuming all of the other properties are constant. In this
work, the area fraction of inclusions (Af) was measured which is related to the volume fraction.
On this basis, toughness, as measured by the Charpy impact energy data, was plotted versus
inclusion (Af)-1/6
(see Figure 13). As observed from this figure, the Charpy impact toughness
varies linearly with the inclusion (Af)-1/6
verifying this relationship and the adverse affect of
inclusions on the toughness of cast steel.

Figure 12: Average Charpy impact energy absorbed for each of the different ladle treatments
Figure 13: Correlation between the toughness and the inclusions content
Figure 14 shows the effect of the (Af)-1/6
of a) oxide and b) sulfide inclusions on the Charpy
impact energy absorbed, as measured for all the cast samples. A linear relationship is observed
between the toughness and the oxide inclusion (Af)-1/6
showing that decreasing the volume of
oxide inclusions directly increases the toughness. The toughness data did not show quite as close
of a linear relationship when plotted against the (Af)-1/6
of sulfide inclusions, however, toughness
definitely increases with decreased sulfide inclusion volume. These results clearly suggest that
both types of inclusions are harmful to the toughness of cast products and must be avoided if
toughness is critical.
0
2
4
6
8
10
12
14
16
18
0.00 % Ca
0.00 ft/min
No Stir
Ladle Stir 0.024% Ca
12.5 ft/min
No Stir
0.028% Ca
12.5 ft/min
No Stir
0.032% Ca
12.5 ft/min
No Stir
0.043% Ca
12.5 ft/min
No Stir
0.043% Ca
12.5 ft/min
Ladle Stir
0.05% Ca
12.5 ft/min
No Stir
0.06% Ca
20 ft/min
No StirCh
arp
y Im
pact
En
erg
y A
bso
rbed
(ft
-lb
s)
0
2
4
6
8
10
12
14
16
18
20
2.8 2.9 3 3.1 3.2 3.3 3.4
(Fraction of Area Covered by Inclusions)^(-1/6)
Ch
arp
y I
mp
act
En
erg
y A
bso
rbed
(ft-
lbs)
(Fraction of Area Covered by Inclusions * 10^3)
2.075 0.6470.7740.9311.1271.3721.681

a)
b)
Figure 14: Correlation between the toughness and the inclusions content for a) oxides and b)
sulfides, as measured for all the cast samples
The toughness of the casting was also found to have a direct correlation with the aspect ratio of
the inclusions (Figure 15a) and the average spacing (Figure 15b) between inclusions. As
expected, the castings with inclusions that were rounder and less irregular in shape (smaller
aspect ratio) resulted in higher toughness. This verifies the observation that Ca-treatment helped
modify the inclusions to a round shape, which in turn increased the toughness of the casting. As
given in Equation 2 earlier, the fracture toughness is expected to varies linearly with s1/2
, where s
is average inclusion spacing, assuming all other properties for the system are constant. Using the
program written in Excel with the x-y location data provided by the ASPEX inclusion analysis,
the average inclusion spacing was calculated for each of the trial heats and plotted as (inclusion
spacing) 1/2
versus the average Charpy impact energy absorbed (see Figure 15b). The relationship
0
2
4
6
8
10
12
14
16
18
20
2.9 3 3.1 3.2 3.3 3.4
(Fraction of Area Covered by Oxide Inclusions)^(-1/6)
Ch
arp
y I
mp
act
En
erg
y A
bso
rbed
(ft
-lb
s)
(Fraction of Area Covered by Inclusions * 10^3)
0.6470.7740.9311.1271.3721.681
0
2
4
6
8
10
12
14
16
18
20
3.5 3.7 3.9 4.1 4.3 4.5 4.7 4.9 5.1
(Fraction of Area Covered by Sulfide Inclusions)^(-1/6)
Ch
arp
y I
mp
act
En
erg
y A
bso
rbed
(ft
-lb
s)
(Fraction of Area Covered by Inclusions * 10^3)
0.0720.0930.1200.1580.2110.2840.3900.544 0.057

was linear which verifies the theoretical relationship in Equation 2 and implies that it is not only
the volume of inclusions but the spacing between inclusions that affects cast steel toughness.
a)
b)
Figure 15: Effect of the a) average aspect ratio of inclusion and b) (average inclusion spacing) ½
on the Charpy impact energy absorbed as measured for all the cast samples
SUMMARY AND CONCLUSIONS
The use of modern tools such as automated inclusion analyzers to identify the number, shape,
size, composition and spacing of inclusions in steel casting is critical to studying the effects of
practice changes on steel quality. Automated inclusion analysis allows for collection of more
data in one hour than could be collected manually in several days.
Calcium treatment was found to be beneficial for inclusion modification and control. In all the
heats conducted with Ca-additions in the ladle, the fraction of area covered by inclusions and the
total oxygen was found to decrease after the Ca-treatment. The major reduction was found in
alumina and MnS inclusions. The inclusions present after Ca-treatment consisted primarily of
calcium aluminate and CaS inclusions. The shape factors of calcium aluminate and CaS
inclusions was close to 1 and their SEM images also showed a round shape, suggesting that they
are not as harmful to mechanical properties of cast steel as non-spherical inclusions. The volume
of inclusions and total oxygen were found to be directly decreased by the amount of Ca-added.
0
2
4
6
8
10
12
14
16
18
20
2 2.5 3 3.5 4 4.5 5
Average Aspect Ratio of the Inclusions
Ch
arp
y I
mp
ac
t E
ne
rgy
Ab
so
rbe
d (
ft-
lbs
)
0
2
4
6
8
10
12
14
16
18
20
0.14 0.145 0.15 0.155 0.16 0.165 0.17 0.175 0.18 0.185 0.19
(Inclusion Spacing)^0.5 (mm^0.5)
Ch
arp
y I
mp
act
En
erg
y A
bso
rbed
(ft-
lbs)

The average Charpy impact energy absorbed for cast products were found to be linearly
proportional to the volume fraction of inclusions to -1/6 power, in agreement with the relationship
in Equation 1. Samples with lower aspect factors (closer to round) resulted in higher toughness.
Increased spacing between inclusions improved toughness according to the relationship in
Equation 2. The Charpy impact energy absorbed was found to increase with increased amounts
of Ca-added in the ladle. The highest toughness was obtained in samples with high levels of
calcium added and then stirred with Ar.
ACKNOWLEDGEMENTS
The work for this project was made available through funding provided by U.S. Army Benet Labs
Award W15QKN-07-2-0004 and the funding for the ASPEX inclusion analyzer was made
available through U.S. Army DURIP Grant W911NF-08-1-0267. The Ca-wire feeder was
provided through a grant from P.C. Campana. The authors also acknowledge the support of the
Steel Founders Society of America and the member companies that participated in this research.
REFERENCES
1. R.W. Rastogi and A.W. Cramb, 2001 Steelmaking Conf. Proc., ISS, Warrendale, PA, Vol.
84, 2001, pp. 789-829.
2. R.A. Rege, E.S. Szekeres and W. D. Forgeng, Met. Trans., AIME, Vol.1, No. 9, 1970, pp.
2652.
3. L. Zhang, B.G. Thomas, “Literature Review: Inclusions in Steel Ingot Casting,” Met and
Materials Trans B, Vol.37B, No.5, 2006, pp.733-761.
4. T.B. Braun, J.F. Elliott, and M.C. Flemings, Met and Materials Trans B, Vol.10B, 1979, pp.
171-84.
5. T.B. Cox and J.R. Low, “Investigation of the Plastic Fracture of AISI 4340 and 18Ni-200
Grade Maraging Steels,” Met and Materials Trans A, Vol. 5A, 1974, pp.1457-70.
6. P. Kenny and J D Campbell, Prog. Mat. Sci., Vol. 13, 1967, pp. 135-181.
7. W.M. Garrison, “Controlling Inclusion Distributions to Achieve High Toughness in Steels,”
AIST Trans, Vol. 4, No. 5, 2007, pp.132-139.
8. G.T. Hahn, M.F. Kanninen, and A.R. Rosenfield, Annual Review of Materials Science, Vol.
2 , 1972, pp. 381-404.