Embed Size (px)
Citation preview

1 |BACK TO SECTION LISTING
| INSIGHT
What Winning Mobile Developers UseBy John Koetsier
Mobile App Analytics:

| 2 BACK TO SECTION LISTING
Executive Summary......................................................................................4What You’ll Get In This Report ...................................................................... 4
Introduction ..........................................................................................................6About This Report ........................................................................ 6Using This Report ......................................................................... 7
Big Picture: Market Share Vs. Market Leaders ...... 8Google Analytics: Monopoly Power On Android ...................... 9Flurry: Dominance On iOS ........................................................ 12But ... 2 Out Of 3 Mobile Developers Use More Than One Analytics Tool ..................................................................... 14And: The Most Successful Developer Use Multiple Tools ..... 15Only 30% Of Developers Say Google Is Their Primary Analytics Choice ......................................................................... 17
The Contenders: 8 Mighty Mites ........................... 18Amazon: Shockingly Good ........................................................ 19Tune: Tiny ... And Powerful ....................................................... 20Localytics: Users Love It ............................................................ 21Mixpanel: Jack Of All, Master Of One ....................................... 23Crashlytics: Never Stop Improving ........................................... 24Kochava: The Ratings King ........................................................ 25Appsflyer: 1 Sdk To Rule Them All............................................ 26Apsalar: A Tale Of 2 Platforms .................................................. 27
Quantitative Ranking: The Top 15 Analytics Solutions .................................................................. 28
SECTIONS

3 |BACK TO SECTION LISTING
iOS ............................................................................. 29iOS By Market Share .................................................................. 30iOS By Ratings ............................................................................. 31iOS By Install/Uninstall Ratio And Ratings............................... 32iOS By Big App Market Share .................................................... 34iOS By Uninstall Ratio ................................................................ 35
Google Play .............................................................. 37Google Play By Market Share ................................................... 38Google Play By Ratings .............................................................. 39Google Play By Install/Uninstall Ratio And Ratings ................ 41Google Play By Big App Market Share ..................................... 42Google Play By Uninstall Ratio.................................................. 44
Qualitative Ranking: The Top 10 Analytics Solutions .................................................................. 45
KPIS That Matter......................................................................... 47KPIS That Don’t Matter .............................................................. 48Key Characteristics ..................................................................... 48Global Rankings By Developer Users ...................................... 49
Conclusion: Recommended Solutions .................. 52Can’t Miss First Choice: Google Or Flurry ................................ 52Google Play Top Picks ................................................................ 53 iOS Top Picks .............................................................................. 53Big Media, Enterprise Solution ................................................. 54A Note On Pricing ....................................................................... 55
Extra: Additional Developer Insights .................... 57Most-Overlooked App Analytics Methods............................... 57What Developers Want Most .................................................... 57Platform Insights ........................................................................ 59
SECTIONS (CONTINUED)

| 4 BACK TO SECTION LISTING
EXECUTIVE SUMMARY
What you’ll get in this report:1. The top 15 analytics solutions ranked and rated on each platform
a. market share
b. ratings of apps using each solution
c. big app market share
d. installs per publisher
e. a combination score that takes into account both user ratings and install/uninstall ratio
2. Even more detail on the top 5 beside Google and Flurry on both iOS and Android: what we call the “mighty mites”
3. The best analytics solutions when you take out market share and only focus on ratings and install/uninstall ratiOS
4. Developer insightsa. Most overlooked app analytics methods
b. What developers want most from analytics
c. The most important features of app analytics solutions
d. Why some analytics solutions are churning and losing developer share
e. Developers and data: yes, they care
f. Speed matters ... and developers switch solutions for more of it
5. KPIs that matter, and KPIs that don’t
6. Most important features in analytics solutions

5 |BACK TO SECTION LISTING
Building a great app is step one.
Acquiring users is step two.
Engaging and monetizing users is step three.
But how can you engage and monetize when you don’t know what’s going on?
App analytics solutions are the answer. Or, more accurately, the hundreds of answers ... since there are many, many options for mobile developers to consider. But which ones are going to deliver the kind of value that will allow you to properly engage the users you acquire, understand what they’re doing, provide the value they’re seeking, and enable you to monetize your app?
250 million usersTo answer this question, we asked 230 app developers with 250 million currently active users how they track app data, what works best for them, and what doesn’t work.
1.8 million appsWe also partnered with MixRank to get access to SDK, ratings, and download data for over 1.8 million apps on Google Play and the iOS App Store.
What we’ve learned:• Google Analytics is essentially a monopoly on Google Play ... but it
probably isn’t the best solution
• Flurry owns iOS ... and has its own challenges
• Most developers use more than one analytics solution
• Some solutions are studs on one platform, and duds on another
• Twitter is deep; Facebook is broad
• At a certain scale, some developers prefer to roll their own
• Some of the best solutions are provided by the smallest competitors
EXECUTIVE SUMMARY
| 6 BACK TO SECTION LISTING
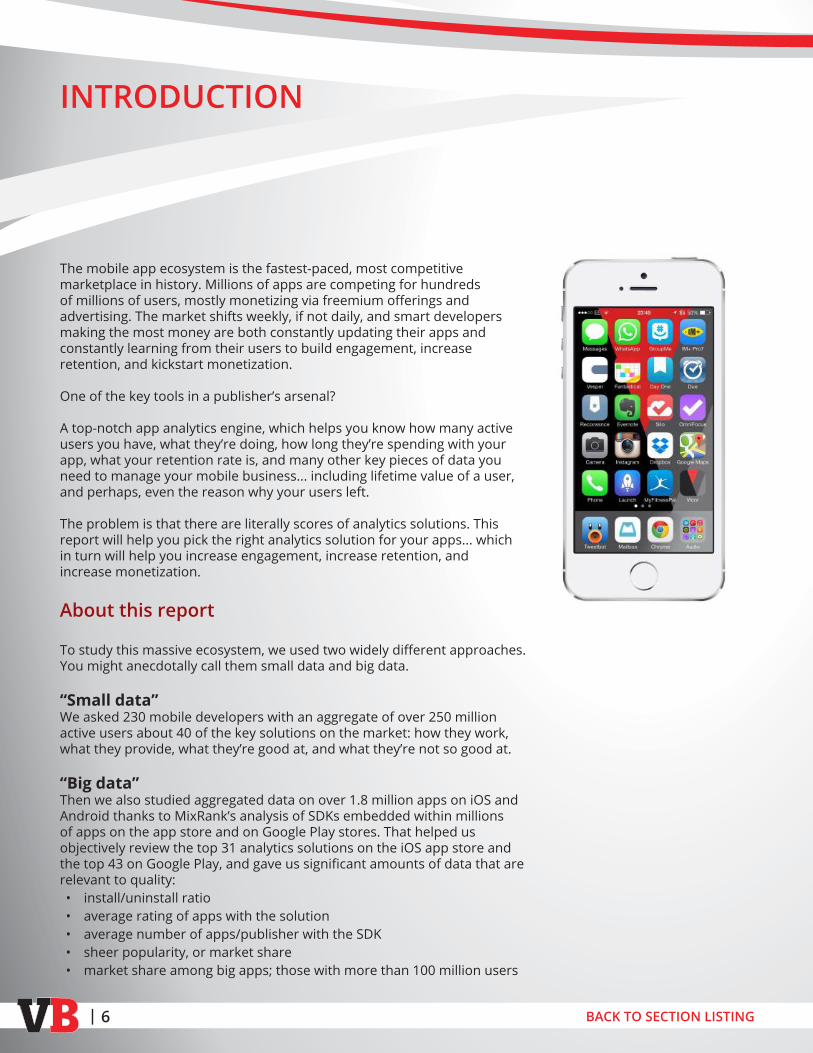
The mobile app ecosystem is the fastest-paced, most competitive marketplace in history. Millions of apps are competing for hundreds of millions of users, mostly monetizing via freemium offerings and advertising. The market shifts weekly, if not daily, and smart developers making the most money are both constantly updating their apps and constantly learning from their users to build engagement, increase retention, and kickstart monetization.
One of the key tools in a publisher’s arsenal?
A top-notch app analytics engine, which helps you know how many active users you have, what they’re doing, how long they’re spending with your app, what your retention rate is, and many other key pieces of data you need to manage your mobile business... including lifetime value of a user, and perhaps, even the reason why your users left.
The problem is that there are literally scores of analytics solutions. This report will help you pick the right analytics solution for your apps... which in turn will help you increase engagement, increase retention, and increase monetization.
About this report
To study this massive ecosystem, we used two widely different approaches. You might anecdotally call them small data and big data.
“Small data”We asked 230 mobile developers with an aggregate of over 250 million active users about 40 of the key solutions on the market: how they work, what they provide, what they’re good at, and what they’re not so good at.
“Big data”Then we also studied aggregated data on over 1.8 million apps on iOS and Android thanks to MixRank’s analysis of SDKs embedded within millions of apps on the app store and on Google Play stores. That helped us objectively review the top 31 analytics solutions on the iOS app store and the top 43 on Google Play, and gave us significant amounts of data that are relevant to quality:• install/uninstall ratio• average rating of apps with the solution• average number of apps/publisher with the SDK• sheer popularity, or market share• market share among big apps; those with more than 100 million users
INTRODUCTION

7 |BACK TO SECTION LISTING
The resultFrom that data, we’ve highlighted the top 15 solutions on each platform, and we present the top 5 in additional detail.
It’s clear that there are small solutions that work extremely well, and it’s also clear that there are giants in the ecosystem that, at least in Google’s case, essentially have a monopoly.
It’s also clear that there is a lot of wisdom in the crowd about what matters most in analytics, and which solutions are worth considering.
Using this report
This report is long, and there is a lot of data here. But don’t read it all.
To get the most out of this report, use the linked table of contents on pages 2-3 to bounce around to areas of key interest.
First:Read the table of contents as if it was the report itself. That will tell you a story in and of itself. Make mental notes for sections you want to go deeper on.
Second:Click on and read the sections you’re most interested in first. Then, go back and surf around, adding bits and pieces of the overall picture.
For you, the ratings section might be most important. For others, the more general overviews of market share and market leaders — or key “mighty mite” contenders — might be critical. Read either section first or second or fifth, as this report is designed to be used however you wish and in whatever order you wish.
What you will find, whatever order you read it in, is that each section reinforces and builds on data and insights in the othersections. And, we trust, that the full view of the app analytics space we present will help you make the right choices for your app’s success.
INTRODUCTION

| 8 BACK TO SECTION LISTING
As you’ll see in this report, Google’s market share in Android with its Mobile App Analytics product is incredibly dominant. And its ability to provide you with a customizable and flexible solution — if you’re willing to work to enable it — is impressive, to say the least.
Meanwhile, Flurry’s market share in iOS, although not quite as dominant, highlights that it is the top competitor in Apple’s space.
However, there are a number of much smaller companies offering solutions that may provide better intel for your specific app. And there are at least 5 solutions on Android and 11 on iOS that, across all the apps that use them, appear to result in higher average app ratings than Google Analytics.
That’s correlation, not causation, but it’s across literally millions of apps, so it’s worth looking at.
To tease out the data that will help you make an informed decision, we’ll rank the top 15 solutions on each of Android and iOS multiple ways, each time prioritizing different variables:
• market share
• big app market share (big apps = apps with more than 5M users)
• install/uninstall ratiOS
• ratings of apps using the app analytics solution
• and a combination score that takes into account both user ratings and install/uninstall ratio
And then we’ll delve into the strengths and weaknesses of the key solutions. Google and/or Flurry might be right for you...but there are many, many top publishers and developers who are specifically not using them, and there are good reasons for that.
BIG PICTURE: MARKET SHARE VS. MARKET LEADERS

9 |BACK TO SECTION LISTING
Google Analytics: Monopoly Power On Android
Google’s Mobile App Analytics is not just dominant in Google Play, it’s Godzilla to almost all the other Android analytics solutions. 1.5 million apps use its SDK on Android, (out of our sample size of just under 1.6 million apps on Google Play that use app analytics).
In chart form, it’s almost laughable.
While on iOS there are four companies with double-digit market share — and Apple didn’t have the foresight (or the technology) to ensure that it was one of them — only two solutions other than Google’s have even single-digit share on Google Play.
There are reasons for that, as competitor Peter Hamilton, CEO of Tune (HasOffers) told VB Insight.
“Google Analytics IS damn good,” he said in response to my question. In addition, he said that “GA is a free and easy solution to get started quickly and it is obviously very in sync with both Android app development and Adwords.”
BIG PICTURE: MARKET SHARE VS. MARKET LEADERS

| 10 BACK TO SECTION LISTING
BIG PICTURE: MARKET SHARE VS. MARKET LEADERS
Here’s the market share data for Google Play apps that use analytics, with full details.
On iOS, Google Analytics does very well indeed, with just under 30% market share, but nowhere near as high as on Android.
That share isn’t an accident. Google does some really basic things extremely well. In fact, when we asked developers who use Google Analytics — and they aren’t very hard to find — they rated it significantly higher than other players in terms of pure analytics power.
In fact, 65% of them said Google is either Very Good or Excellent at pure mobile analytics, while rating it significantly lower at building user engagement, helping publishers monetize, enabling marketing integrations for user acquisition, and helping developers improve user experience.
Rank Company Market share
1 Google Analytics 91.58%
2 Flurry 4.81%
3 Umeng 1.11%
4 Crashlytics 0.61%
5 Localytics 0.34%
6 Mixpanel 0.30%
7 HockeyApp 0.23%
8 HasOffers/Tune 0.21%
9 comScore 0.19%
10 Amazon 0.13%
11 TestFlight 0.14%
12 Omniture 0.12%
13 Adobe 0.12%
14 Apsalar 0.07%
15 Quantcast 0.05%

11 |BACK TO SECTION LISTING
BIG PICTURE: MARKET SHARE VS. MARKET LEADERS
That ties in very nicely with the quantitative data that we studied, which shows that Google’s install-versus-uninstall ratio is massive, especially on Android. For every 19.37 installs on Android, developers have uninstalled Google’s mobile app analytics SDK just once. That’s extremely impressive, and it conveys just how much value Google offers mobile developers.
It’s important to note, however, that being the default choice does not necessarily make Google’s Mobile App Analytics the preferred choice. And being “damn good” doesn’t mean it is “best.” As you’ll see below, Google Analytics only hits #6 when we ranked solutions by a key user engagement and satisfaction metric: overall ratings of app that use it.
That’s on Google’s home turf, Android, and in its own app store, Google Play. And it’s consistent with the qualitative measurements of developers who are actually using the SDK.
In addition apps on iOS that have Google’s analytics SDK only rate .5% higher than average ... and Google’s app analytics tool falls to the #12 spot for that metric.
As we’ll see, many smaller tools have much higher ratings, particularly for critical capabilities related to monetization, app marketing, user acquisition, and user engagement.
iOS is a much more level playing field for app analytics companies than Google Play, so Flurry’s domination of iOS analytics isn’t nearly as hard core as Google’s of Android. Still, Flurry has the most market share on iOS, even if it falls shy of an absolute majority.

| 12 BACK TO SECTION LISTING
BIG PICTURE: MARKET SHARE VS. MARKET LEADERS
Flurry: Dominance On iOS
Dominant market share hasn’t helped Flurry to get the best possible ratings for apps that use it, however. When ranked by analytics solutions whose client apps rate the highest, Flurry is only at #9 on iOS... although it hits #3 on Google Play.
And that hasn’t helped it retain developer share on Android. Ranked by install vs uninstall ratio, Flurry is #11 on Google Play with a 2.91 score. That compares to leaders on Google Play such as Crashlytics with a 5.54 — or the runaway leader (and massive outlier) Google Analytics, with a 19.37.
On iOS however, Flurry’s home turf, the tool does much better, with a class-leading install/uninstall ratio of 11.9. Essentially, Flurry is the default choice on iOS just as Google Analytics is the default choice on Android, although to a somewhat lesser degree.
Here’s the full market share data for apps on iOS that use analytics:

13 |BACK TO SECTION LISTING
BIG PICTURE: MARKET SHARE VS. MARKET LEADERS
One concern from our panel of 230 mobile app developers? Speed.
According to one developer, “Flurry was too slow. We moved to Localytics and then to Google Mobile Analytics.” That might be a bit unfair, since giant apps like Temple Run, Angry Birds, and Subway Surfer use Flurry on Android, and each of those solutions have easily 100 million+ users... certainly requiring significant amounts of speed.
And clearly, with iOS-leading market share and second place on Google Play, Flurry has a lot to offer developers.
In fact, Flurry ranked second — above Google — in overall scoring on global capabilities as rated by developers who scored the tools they actually use.
Developers ranked it third-highest for pure analytics data, second-highest for the ability to help developers improve their apps’ user experience, and fourth-highest for ability to aid in monetization. Overall, it’s second-ranked in total score on those and other global app analytics factors.
That, combined with the fact that it’s both available and strong on both major platforms, continues to keep it a major contender.
Rank Company Market Share
1 Flurry 36.07%
2 Google Analytics 28.89%
3 Crashlytics 7.61%
4 TestFlight 7.84%
5 BugSense 3.93%
6 Localytics 2.63%
7 HockeyApp 2.68%
8 Adobe 2.20%
9 HasOffers/Tune 1.99%
10 comScore 1.71%
11 Mixpanel 1.80%
12 AppsFlyer 0.91%
13 Apsalar 0.63%
14 Quantcast 0.62%
15 Kochava 0.47%
| 14 BACK TO SECTION LISTING
BIG PICTURE: MARKET SHARE VS. MARKET LEADERS
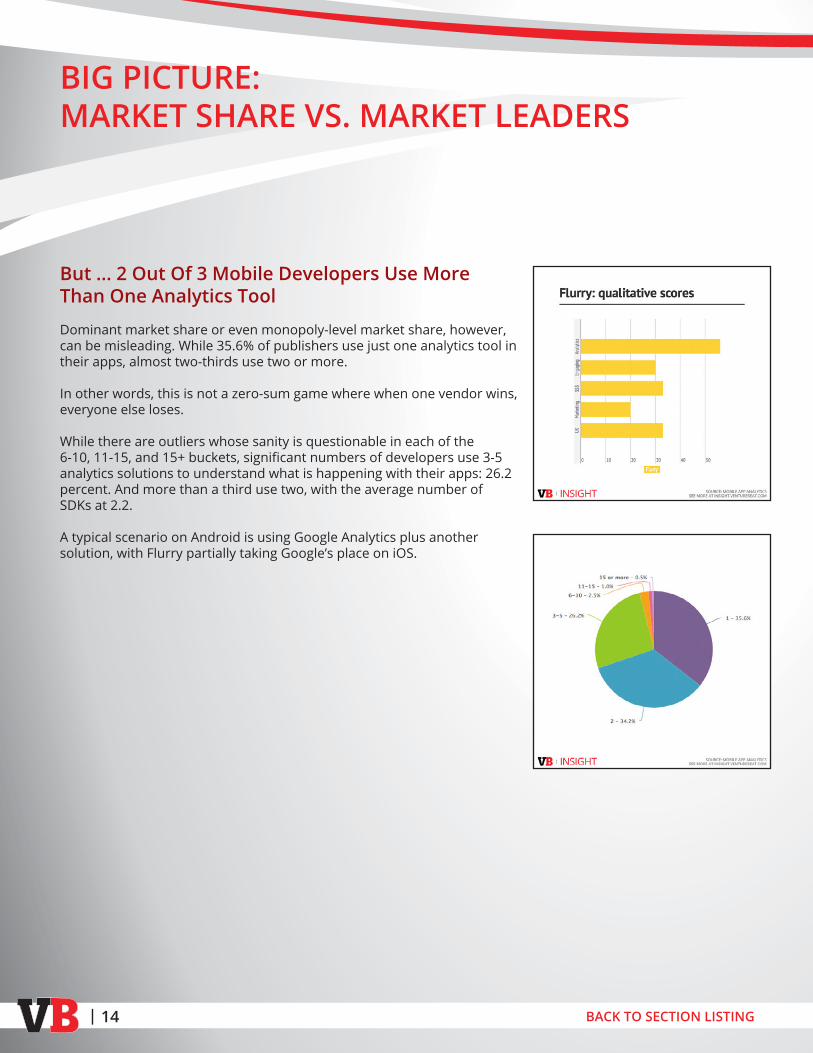
But ... 2 Out Of 3 Mobile Developers Use More Than One Analytics Tool
Dominant market share or even monopoly-level market share, however, can be misleading. While 35.6% of publishers use just one analytics tool in their apps, almost two-thirds use two or more.
In other words, this is not a zero-sum game where when one vendor wins, everyone else loses.
While there are outliers whose sanity is questionable in each of the 6-10, 11-15, and 15+ buckets, significant numbers of developers use 3-5 analytics solutions to understand what is happening with their apps: 26.2 percent. And more than a third use two, with the average number of SDKs at 2.2.
A typical scenario on Android is using Google Analytics plus another solution, with Flurry partially taking Google’s place on iOS.

15 |BACK TO SECTION LISTING
BIG PICTURE: MARKET SHARE VS. MARKET LEADERS
For example, while Supercell’s Clash of Clans uses Google’s mobile analytics, the company also plugs in Tune (HasOffers) to get a more complete picture of what’s happening in the app. Similarly, on iOS, Supercell pairs Flurry with Tune.
This suggests that many and in fact most developers are not finding all of their needs met in a single solution. It also suggests that there is room for more than just the market leaders.
And, finally, it’s a good reason for you to not stop your app analytics search at Google, or at Flurry. The best developers with the most popular apps go farther.
And: The Most Successful Developers Use Multiple Tools
It’s not just the case that most developers use multiple tools. Much more importantly — and more relevant for publishers who are looking to grow — the most successful developers preferentially use multiple tools.
In fact, developers with more than 2 million active users are more likely to use 3-5 analytics tools than they are to use either one or two tools.
(data courtesy of MixRank)

| 16 BACK TO SECTION LISTING
Here’s another way of looking at the same data, which shows that publishers with over 2 million monthly users are more likely to use 2-5 analytics solutions (with 2-3 being the most common). It also shows that relatively unsuccessful publishers are not only using fewer solutions in a lot of cases, but also that some of them are flailing wildly with huge numbers of analytics solutions — 8, 10, 12 — in a vain attempt to discover the silver bullet that will lead to success.
In other words, you can try too hard.
This effect is particularly noticeable when you remove some of the biggest apps in existence such as Facebook, Gmail, Google+, the Google app itself, or other major apps built by huge companies from the dataset. These companies typically have their own analytics solutions in-app or serverside, and would never allow an outside vendor access to their critical user data — especially a competitor in other arenas.
For example, none of these massive 500 million+ user apps from Google include any analytics solution besides Google’s own.
You, sadly, are not a Google or a Facebook — although your goal might be to get there.
To do that, most successful developers are integrating multiple analytics SDKs into their apps to eek every ounce of insightthey possible can out of their users’ activities, and to ensure that they have all angles covered: not just pure analyticspower, not just monetization, not just engagement ... but all of them together.
BIG PICTURE: MARKET SHARE VS. MARKET LEADERS
(data courtesy of MixRank)

17 |BACK TO SECTION LISTING
BIG PICTURE: MARKET SHARE VS. MARKET LEADERS
Only 30% Of Developers Say Google Is Their Primary Analytics Choice
Given that the majority of developers prefer to use multiple mobile app analytics solutions, vendors will be particularly interested in which solutions publishers consider their primary app analytics software.
While Google is by far the leader in installed base, this data shows that its position may not be as strong as that would suggest.
Two hundred-four of the 230 publishers we talked to had what they referred to as a primary app analytics platform ... suggesting that 26 of them didn’t consider any of their platforms primary. Of those who did, 64 said Google’s mobile analytics tool was their primary tool, and 7 more answered Google’s Universal Analytics, for a total of 71.
Flurry was the next highest, at 18, followed by Mixpanel and Localytics at 11, then Amazon and Adobe at 8.
But the biggest surprise was that 79 people answered various combinations of “other,” including Upsight, IBM Analytics, Crashlytics, comScore, Clicktale, AppSee, Apsalar, Amplitude, and more. The clear implication: mobile developers and publishers use a wide range of tools to analyze and understand what is happening inside their apps, and while Google is by far the leader, it’s not the only important player in the space.
In fact, about 70 percent of the developers we talked to do NOT consider Google to be their primary mobile analytics solution provider.
It’s there, it’s free, and it’s easy to integrate (especially on Android)... but it’s not the only game in town.
So let’s take a look at some of the top contenders.

| 18 BACK TO SECTION LISTING
THE CONTENDERS: 8 MIGHTY MITES
Given that most developers use multiple solutions, the most successful developers preferentially use multiple analytics engines, and only some 30% of mobile publishers actually consider Google analytics their primary data source on what users are doing, the differentiators are likely to be the second tier of analytics providers.
They don’t have majority market share, they (mostly) don’t have hundreds of thousands of apps in their stables of clients, but they do provide significant developer advantages in terms of user experience improvement.
While Google and Flurry are the 800-pound gorillas, there are easily eight mighty mites — 5 on each of Google Play and iOS, with some overlap between the platforms — that are worth your consideration.
On Google Play, those are:• Mixpanel
• Tune (HasOffers)
• Amazon
• Localytics
• Crashlytics
On iOS, those are:• Kochava
• AppsFlyer
• Apsalar
• Mixpanel
• Tune (HasOffers)
It’s true that these mighty mites have nowhere near the market share of a Google or a Flurry.
For example, Google Analytics has something like 300 times Mixpanel’smarket share on Android. And on iOS, Flurry has an even higher multiple of Kochava’s tiny 288 publishers and 642 apps.
But the 1,200 publishers with 5,000 apps using Mixpanel’s SDK on Android have generated almost 50% higher user ratings for their apps. And apps using Kochava on iOS are rated an astonishing 12 times higher than apps using Flurry.
We’ll list all the details in the ratings sections, but suffice it to say for now: these companies should be on your radar, and perhaps on your short list.

19 |BACK TO SECTION LISTING
THE CONTENDERS: 8 MIGHTY MITES
Amazon: Shockingly Good
Perhaps it should not be a surprise that a company that specializes in the biggest of big data and has its own Androidbased app store has a top-notch analytics solution. But it was.
For Android only, Amazon has a shockingly good mobile app analytics solution, Amazon Insights.
While its market share on the Amazon Appstore for Android is almost certainly higher, on Google Play Amazon has only about a .13% market share, good for 10th place on the charts. That’s not insignificant, however, as it comprises 937 app publishers and 2141 apps in our sample.
The key factor here is that with its own “Appstore for Android,” interest in mobile, interest in advertising, competition with Google, big data chops, and leading cloud expertise, Amazon has all the motivation and all the ingredients it needs to be a top-notch solution even as a niche player.
That’s clear when you see that it ranks fourth when judged by overall ratings of apps that use Amazon Insights, third in our overall ranking, third when we prioritized big app market share, and second when we prioritized both market share and ratings and install/uninstall ratio.
In addition, Amazon ranked second when we ignored market share and simply prioritized the install/uninstall ratio and ratings.
In our qualitative studies, Amazon doesn’t stand out overall, but does shine in two specific areas: monetization and user engagement.
When publishers rated the tools they use themselves, Amazon ranked third at monetization, with 36% saying it was either Excellent or Very Good, and fourth at helping enhance user engagement, with 31% rating it with the same score.
Imangi’s Temple Run 2 uses Amazon Insights, and multiple apps from Disney and GameLoft also use Insights.

| 20 BACK TO SECTION LISTING
Tune: Tiny ... And Powerful
From an overall market share standpoint, Tune (HasOffers) doesn’t seem significant.
The company has about a .21% share of the Android app analytics market, at least for apps on Google Play, and a more significant but still small 2% market share on iOS.
But overall market share isn’t everything.
On Google Play, Tune consistently ranks near the top of every measure we checked, besides market share. The company is fourth in our overall rankings, third when we prioritize market share, third when we prioritize install/uninstall ratiOS and ratings of apps that include the SDK, and second when we simply look at the overall ratings boosts apps that use the SDK enjoy.
We ranked analytics apps 7 different ways, weighting different factors each time. The actual scores will be listed in the ranking sections below, but here’s just a quick overview of where Tune/HasOffers landed.
On iOS, the company is not quite as dominant.
But on Google Play, few companies can match its share of global-sized apps (100 million+ users), as well as its share in the 50-100 million user app category and the 5-50 million bucket. Three apps with 100 million+ users, nine apps with 50-100 million users, and 107 apps with 5-50 million users use Tune for app analytics.
THE CONTENDERS: 8 MIGHTY MITES

21 |BACK TO SECTION LISTING
(See the full details below in the rankings section.)
Outside of Flurry and Google, you simply do not see this kind of scale anywhere else. And only Mixpanel seems to result in apps with a higher average user rating.
Major apps using Tune include Supercell’s Hay Day and Clash of Clans, Plants vs. Zombies, Bible, the Talking Tom (Cat) series by Outfit 7, and more.
Localytics: Users Love It
Localytics didn’t hit the heights in many of our quantitative rankings below, generally showing up in the middle of the pack in most categories. But most of those stats don’t take full account of how developers who are actually using each SDK feel about it.
It’s when you look here that Localytics really shines, with the highest overall score of any analytics solution.
We asked the 230 developers we surveyed to rate the tools they currently use on how well they work for five global factors that are critical in building great apps with high numbers of users and good levels of monetization:
• Pure analytics
• Building engagement
• Monetization
• Marketing integration
• Improving user experience
The leader? Localytics.
THE CONTENDERS: 8 MIGHTY MITES

| 22 BACK TO SECTION LISTING
Localytics scored the highest percentage of developers who said that it was Very Good or Excellent at those categories, with quite some distance between the next contender, Flurry. Here are the actual totals:
Developer Rankings
Pure Analytics
Building Engagement Monetization Marketing
Integration
Improving User
ExperienceTotal
Localytics 55% 52% 49% 36% 21% 212%
Flurry 56% 30% 33% 20% 33% 172%
Google 65% 30% 30% 22% 23% 170%
Mixpanel 43% 31% 31% 23% 31% 160%
Facebook 29% 46% 26% 31% 14% 146%
Amazon 42% 31% 36% 16% 16% 140%
ComScore 61% 29% 26% 7% 13% 136%
Adobe 53% 20% 14% 26% 12% 124%
Apsalar 23% 27% 36% 23% 9% 118%
Crashlytics 22% 14% 28% 11% 39% 114%
That’s an impressive showing.
Developers who currently use Localytics rated it higher for helping create user engagement than any other tool. They also rated it higher than any other tool for integration of marketing tools. It’s fourth for pure analytics behind leaders Google, comScore, and Flurry, and first again for monetization.
Those are all impressive feats for a tool that is fifth on Google Play for market share and sixth on iOS.
THE CONTENDERS: 8 MIGHTY MITES

23 |BACK TO SECTION LISTING
And all that developer love does show up in the quantitative analysis in at least one score: install versus uninstall ratios, where Localytics ranks just below category leaders Flurry and Google on iOS.
Major apps using Localytics on iOS include ESPN’s SportsCenter, eBay, FOX Sports Mobile, and theScore, while on Google Play you have some of the same apps, plus Amazon Kindle, popular fitness app RunKeeper, and augmented reality tool Layar.
Mixpanel: Jack Of All, Master Of One
Mixpanel is just pretty good at pretty much everything, ranking in the fours, fives and sixes in many of our quantitative rankings as well as many of our qualitative rankings.
Everything’s solid, nothing’s spectacular.
Except user ratings.
Mixpanel is the leading app analytics solution on Google Play when you rank it by the average ratings boost apps that use it generate. While the average analytics package boosts the ratings of apps by 2.93 over all apps in general, apps that use Mixpanel have an average ratings boost of 6.4%.
Perhaps that shouldn’t be a surprise.
In our qualitative scores from developers who actually use the tools, Mixpanel ranked second only to Localytics and Facebook in improving user engagement, and second only to Crashlytics and Flurry in improving user experience.
THE CONTENDERS: 8 MIGHTY MITES

| 24 BACK TO SECTION LISTING
THE CONTENDERS: 8 MIGHTY MITES
Thirty-one percent of developers using MIxpanel said it was either Very Good or Excellent at helping generate higher app engagement, and the same number said it was Very Good or Excellent at improving user experience. Those numbers may not sound high, but developers can be a tough crowd, and only two solutions out-scored Localytics in those categories.
Crashlytics: Never Stop Improving
Twitter’s Crashlytics has impressive market share on Google Play and IOS, ranking fourth on Google Play and third on iOS. And, somewhat like Mixpanel, it’s generally middle of the pack on most of our ratings. That in itself is in some sense amazing for a tool that was particularly focused from the very beginning on crash reporting.
However, there are two places where Crashlytics stands out.
One is its uninstall ratio on Google Play, which is second only to Google itself, at 5.54. (For every five and a half current installs, only one developer has uninstalled the SDK.) This suggests that mobile publishers find the tool extremely useful and, once installed, don’t remove it.

25 |BACK TO SECTION LISTING
THE CONTENDERS: 8 MIGHTY MITES
The other area Crashlytics particularly stands out in is perhaps not surprising, given the first. That’s its high rating in helping developers improve user experience in our qualitative study.
There, developers who actually use the tools rated Crashlytics highest of all, above Google, above Flurry, above Amazon. That’s impressive, and it makes sense: nothing hurts user experience more than a complete and utter crash.
Thirty-nine percent of developers said that Crashlytics was Very Good or Excellent in improving user experience. Again, that may not sound like much, but developers are hard to please in some ways, and that compares to scores of 33% for Flurry, 23% for Google, and 16% for Amazon.
As the team has built the tool, Crashlytics offers much more than just crash analysis, which it does supremely well, of course. That includes user data, retention data, session length, and more.
Apps that use Crashlytics include Pandora and MySpace, as well as Evernote and KakaoStory — and, of course, the Twitter app itself.
Kochava: The Ratings King
App ratings are critical to success, especially early in an app’s lifecycle.
They’re extremely important for organic growth as a factor that both users check when considering an install, that app store managers review before deciding whom to feature, and that factors in app store search and ranking algorithms. A bad rating can kill an app; a good rating aids your user acquisition efforts.
Later in an app’s lifecycle, they’re important too, as key metrics of user satisfaction and user experience, both of which have massive impact on monetization capability. And, of course, they’re a bit of a vanity metric as well: who doesn’t want 5-star apps, and who wants 1 or 2-star apps?
Kochava barely made it onto our radar, with just half a percent of market share on iOS and 650 or so installs in our sample size of 278,000 apps.

| 26 BACK TO SECTION LISTING
But it is clearly the ratings king.
Apps that use Kochava have an average user rating 14.2% higher than other apps. That’s tops on iOS, followed closely by AppsFlyer and Apsalar. By contrast, apps using market leaders Google and Flurry only see a .5% and 1.2% bump in user ratings, respectively.
Kochava promises real-time measurement, attribution, and optimization, all of which helps if you’re looking to improve user experience.
The biggest apps using its SDK include Domino’s Pizza, Radio Disney, and Sega’s Sonic Dash, as well as Backflip Studio’s DragonVale.
AppsFlyer: 1 SDK To Rule Them All
Another iOS-focused solution that helps developers build apps that generate great user ratings is AppsFlyer. On iOS, apps with the AppsFlyer SDK have ratings 13.5% higher than average.
That’s extremely impressive, and AppsFlyer is generating that boost on about double the market share of Kochava, which makes it even more impressive. That pushes AppsFlyer, which has about 1% market share on iOS, way up the charts in our rankings that prioritize ratings as well as install/uninstall ratio:
AppsFlyer has taken a very interesting tack in attacking the mobile space: one SDK to rule them all. The single 40kB SDK includes capabilities for analytics, for affiliate networks, for advertising-based monetization, for user acquisition, campaign tracking, retargeting ads, attribution tracking, and ROI analytics.
Big apps that use AppsFlyer include StumbleUpon and Foursquare, plus Sega’s Sonic Dash and the iconic Flashlight app.
THE CONTENDERS: 8 MIGHTY MITES

27 |BACK TO SECTION LISTING
THE CONTENDERS: 8 MIGHTY MITES
Apsalar: A Tale Of 2 Platforms
Apsalar is a poster child for why you need to approach analytics for different platforms in different ways.
On Android, Apsalar has the unfortunate distinction of owning the single worst install/uninstall ratio on any platform: .07. In other words, with about 1,100 installs in our 1.6 million Google Play app sample size, more than 14,000 apps have uninstalled the SDK.
On the surface, it looks like the company has had major issues, in spite of the fact that apps with this SDK have middle-of-the-pack ratings boosts over other apps, at 4.1% higher than average. But Apsalar CEO Michael Oiknine told me that was due to a partnership with another SDK that saw its installs skyrocket, but then drop after the partnership lapsed.
On iOS, Apsalar is a poster child for both getting high ratings and having the fifth-best install/uninstall ratio.
In other words, it’s a completely different universe.
In terms of ratings, apps using the Apsalar SDK on iOS are rated 13.2% higher than average apps — a massive boost only surpassed by Kochava and AppsFlyer.
It’s important to note that Apsalar accomplishes this feat with about 50% more market share than Kochava, which makes the achievement even more impressive. (As SDKs are installed more and more widely, they ratings for apps that use them tend to approach the average more and more, simply as a function of size in the market.)
Big apps that use Apsalar include Zombie Life, Infinity Blade II, and Sally’s Spa.

| 28 BACK TO SECTION LISTING
QUANTITATIVE RANKING: THE TOP 15 ANALYTICS SOLUTIONS
As we’ve noted above, we ranked the top 15 mobile analytics solutions on each of Google Play and the iOS app store in a variety of ways, each time prioritizing slightly different aspects to provide a different view.
Here are the full details...
Note:It’s important to not look simply at where a solution ranks, but also check the other sections of this report that reveal the focus for each analytics company and the results of our developer survey that highlight where each solution is strong. All the data together will give you a good sense of the correct analytics solution — as will our top picks at the end of this report.
Recommended solutions:To determine our Recommended Solutions at the bottom of this report, we add this data to the qualitative data revealed below.

29 |BACK TO SECTION LISTING
iOS
There are over 30 iOS-focused app analytics solutions.
We’ve ranked the top 15 by multiple factors below, but here are the top 31 ranked by market share. To give you some context, after the top 15, solutions have less than 450 installs.
1. Flurry
2. Google Analytics
3. Crashlytics
4. TestFlight
5. BugSense
6. Localytics
7. HockeyApp
8. Adobe Marketing Cloud (Omniture)
9. Tune/HasOffers
10. comScore
11. Mixpanel
12. AppsFlyer
13. Apsalar
14. Quantcast
15. Kochava
16. Adeven Adjust.io
17. Tapstream
18. Distimo
19. Ad-X
20. Kontagent (now Upsight)
21. GameAnalytics
22. Amplitude
23. Segment.io
24. Swrve
25. Apptimize
26. Leanplum
27. Optimizely
28. Taplytics
29. Appsperse
30. Aditic
31. adDash

| 30 BACK TO SECTION LISTING
iOS
iOS By Market Share
As we’ve previously seen, Flurry and Google lead iOS app analytics solutions in market share.
It’s important to note that not leading in market share is not necessarily a bad thing: some solutions, such as Adobe, Quantcast, or comScore, are aimed at the enterprise market, and will naturally therefore not be present in the legions of tiny and unsuccessful apps on the market.
In addition, solutions such as Localytics, Tune, Mixpanel, and Kochava are focused on huge mobile-first (and often mobile-only) apps. Again, the long tail with the majority of all apps is not something that these players are interested in.
Here are the full details with exact numbers.
Market Share Rank Company Percentage1 Flurry 36.07%2 Google Analytics 28.89%3 Crashlytics 7.61%4 TestFlight 7.84%5 BugSense 3.93%6 Localytics 2.63%7 HockeyApp 2.68%8 Adobe 2.20%9 HasOffers/Tune 1.99%
10 comScore 1.71%11 Mixpanel 1.80%12 AppsFlyer 0.91%13 Apsalar 0.63%14 Quantcast 0.62%15 Kochava 0.47%

31 |BACK TO SECTION LISTING
iOS
Publishers won’t necessarily go wrong when choosing a market-leading solution. The only challenge is that market share is typically a trailing indicator, not a leading indicator, and there can be up-and-coming solutions that do a better job at specific aspects of app analytics.
And, in fact, that’s what you’ll see as we rank the solutions according to different criteria.
iOS By Ratings
If you’re looking for an analytics solution that will help your team improve your app, make it more friendly, and make it something that users want to share, you’ll want to see which products tend to help produce the highest quality apps.
On iOS, apps that use the little-known Kochava mobile app analytics engine generate the highest overall boost in ratings. AppsFlyer is close behind, as is Apsalar. Apps that use Mixpanel or Tune are not far away, while apps that use comScore, BugSense, and Adobe are ignominiously rated below the average app.
It’s important to take these numbers with a grain of salt.
This is correlation we’re seeing here, not causation. Choosing comScore does not guarantee you bad ratings. There are certainly conflating variables at play here, and one of them will be that enterprise focused apps or apps from big old-school media companies are just not as likely to be consumer-friendly, user-friendly, and loved by the average user as consumerfirst apps from mobile-first or mobile-only companies.
That’s almost certainly what is happening in Adobe’s case.
In addition, an SDK like BugSense, with its focus on pinpointing problems and discovering bugs is most likely to be used by developers while they are in heavy ongoing development of their app and experiencing issues. That’s going to be reflected in user experience, and it’s going to result in apps using it being rated lower.
| 32 BACK TO SECTION LISTING
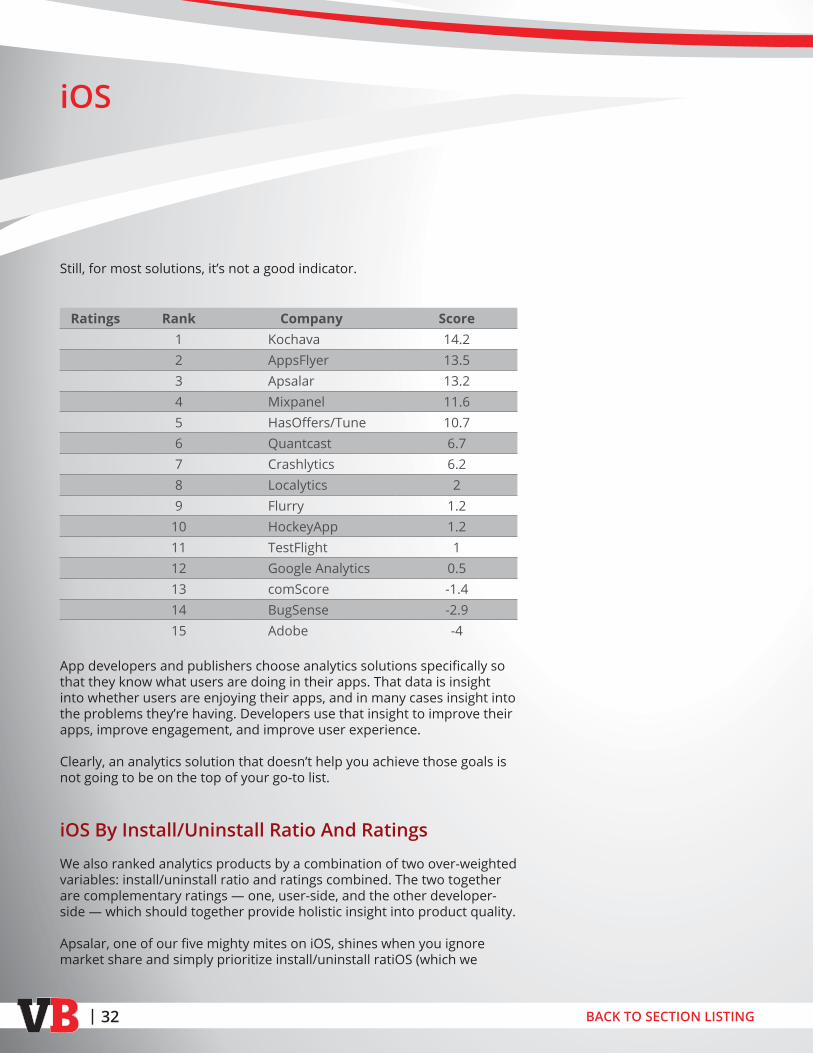
Still, for most solutions, it’s not a good indicator.
Ratings Rank Company Score1 Kochava 14.22 AppsFlyer 13.53 Apsalar 13.24 Mixpanel 11.65 HasOffers/Tune 10.76 Quantcast 6.77 Crashlytics 6.28 Localytics 29 Flurry 1.2
10 HockeyApp 1.211 TestFlight 112 Google Analytics 0.513 comScore -1.414 BugSense -2.915 Adobe -4
App developers and publishers choose analytics solutions specifically so that they know what users are doing in their apps. That data is insight into whether users are enjoying their apps, and in many cases insight into the problems they’re having. Developers use that insight to improve their apps, improve engagement, and improve user experience.
Clearly, an analytics solution that doesn’t help you achieve those goals is not going to be on the top of your go-to list.
iOS By Install/Uninstall Ratio And Ratings
We also ranked analytics products by a combination of two over-weighted variables: install/uninstall ratio and ratings combined. The two together are complementary ratings — one, user-side, and the other developer-side — which should together provide holistic insight into product quality.
Apsalar, one of our five mighty mites on iOS, shines when you ignore market share and simply prioritize install/uninstall ratiOS (which we
iOS

33 |BACK TO SECTION LISTING
iOS
calculated by dividing how many current installs the company has by the number of uninstalls that have happened) as well as ratings.
Appsflyer, Mixpanel, and Kochava also rank well, followed by a tight pack of Tune, Flurry, Quantcast, and Crashlytics.
While you can’t read too much into install/uninstall ratiOS, as developers are constantly testing new things, there are reasons why publishers stop using one analytics solution in favor of another. And analytics solutions that are good at retaining developer partners are clearly doing something right.
Here’s the raw data.
Install/Uninstall And Ratings Rank Company Score
1 Apsalar 1042 Appsflyer 703 Kochava 684 Mixpanel 645 HasOffers/Tune 516 Flurry 467 Quantcast 438 Crashlytics 439 Localytics 17
10 Google Analytics 1011 comScore 812 Bugsense 713 Hockeyapp 714 TestFlight 515 Adobe 5

| 34 BACK TO SECTION LISTING
iOS By Big App Market Share
Market share by category of app download bracket is tricky on iOS, as the app store doesn’t reveal the same amount of detail as Google Play. However, by compiling a list of the major apps in significant categories, it’s possible to get a good sense of the general terrain.
We define “big apps,” by the way, as apps with more than 5 million users.
It’s no shock that over-prioritizing big app market share appears to favor Flurry and Google, the two major competitors iniOS app analytics. If you have massively higher market share than your competitors, you’re also likely to have at leastsomewhat higher market share in the top end of the market.
Here’s the raw data when we prioritized big app market share.
Big App Market Share Rank Company Score
1 Flurry 1222 Google Analytics 1053 Crashlytics 294 TestFlight 255 comScore 226 Adobe 217 Bugsense 168 Hockeyapp 139 Localytics 12
10 HasOffers/Tune 1011 QuantCast 1012 Mixpanel 813 Appsflyer 514 Apsalar 215 Kochava 1
iOS

35 |BACK TO SECTION LISTING
iOS
An interesting reality, however, is revealed when we put market share and big app market share side-by-side.
Here it’s clear that total market share is actually inversely related to big app market share for some of the key players.
Localytics, comScore, Adobe, and Quantcast all have significantly more share of the big app analytics market than they do of the overall app analytics market, while Flurry and Google both have less.
Tune, Mixpanel, AppsFlyer, and HockeyApp are not pictured but exhibit the same variance: they punch above their weight class when you look at the most coveted segment of the market: large apps.
iOS By Uninstall Ratio
Developers uninstall SDKs for a variety of reasons.
In some cases, they need to make their apps faster. In other cases, there’s a strategic conflict. In many cases, however, it’s because the app has moved beyond the value offered by the SDK. In this case, developers integrate with a new solution that provides more benefits.
We calculated the current installed base versus the number of uninstalls for each of the top 15 solutions. The result?
Flurry leads, followed by Google, as the top two “sticky” SDKs. That essentially means that publishers who install Flurry on iOS typically don’t uninstall it, with the same true to a slightly lesser degree of Google.
Flurry is installed in 11.9 apps today for every one app that has uninstalled it, while Google is just over 10. Localytics and comScore are in the 8.3 to 8.5 range, while Apsalar (remember that name for the same stats for Android) and BugSense are in the sevens.

| 36 BACK TO SECTION LISTING
iOS
It’s easy to read too much into this data. SDKs that are easy to install are equally easy to uninstall, and mobile publishers are trying every angle for that little extra edge which will make a difference. What is clear, however, is that if your ratio is close to one, you’re in trouble. And if it’s below one, developers have spoken: you just do not have a good product.
But an app like TestFlight is often installed simply to enable sending the app to beta testers, its original and still primary claim to fame. So seeing TestFlight lower in these scores should not be a shock.
Here’s the full data:
Uninstall ratio Rank Company Score
1 Flurry 11.92 Google Analytics 10.093 Localytics 8.534 comScore 8.335 Apsalar 7.846 Bugsense 7.387 Crashlytics 6.998 QuantCast 6.419 Hockeyapp 5.64
10 Mixpanel 5.5511 Adobe 5.512 Appsflyer 5.1913 TestFlight 4.9214 HasOffers/Tune 4.7715 Kochava 4.76
Note: the average install-to-uninstall ratio on iOS is 6.92, which for vendors means that if you do win the install, you typically stay inside an app.

37 |BACK TO SECTION LISTING
GOOGLE PLAY
There are over 50 app analytics solutions on Google Play.
We’ve ranked the top 15 by multiple factors below, but here are the top 35 ranked by market share. To give you some context, after the top 15, solutions have under 550 installs.
1. Google Analytics
2. Flurry
3. Crashlytics (Twitter)
4. Umeng
5. HockeyApp
6. Localytics
7. Mixpanel
8. Tune/HasOffers
9. comScore
10. Amazon (Insights and A/B Testing)
11. TestFlight
12. Adobe Marketing Cloud (Omniture)
13. Apsalar
14. Quantcast
15. Amplitude
16. vServ AppWrapper
17. Baidu Mobile Statistics
18. Ad-X
19. Distimo
20. Apptentive
21. Tapstream
22. Splunk
23. Appboy
24. GameAnalytics
25. Rollbar
26. Segment.io
27. Adeven Adjust.io
28. Talking Data
29. Swrve
30. Moblin
31. Apptimize
32. Leanplum
33. Ensighten Mobile
34. Coremetrics
35. Vessel

| 38 BACK TO SECTION LISTING
GOOGLE PLAY
Google Play By Market Share
Again, market share is typically a trailing indicator, not a leading indicator, and there can be up-and-coming solutions that do a better job at specific aspects of app analytics. However, market share does indicate that a solution is meeting a wide swath of needs.
As we’ve previously seen, Google’s mobile analytics solution is the runaway market share leader for apps on Google Play.
Here’s the data in tabular form, with all the details.
Market Share Rank Company Percentage
1 Google Analytics 91.58%2 Flurry 4.81%3 Umeng 1.11%4 Crashlytics 0.61%5 Localytics 0.34%6 Mixpanel 0.30%7 HockeyApp 0.23%8 HasOffers/Tune 0.21%9 comScore 0.19%
10 Amazon 0.13%11 TestFlight 0.14%12 Omniture 0.12%13 Adobe 0.12%14 Apsalar 0.07%15 Quantcast 0.05%
However, the story is considerably more complex when we take the data and start to prioritize different elements to reveal more than just sheer market share.

39 |BACK TO SECTION LISTING
GOOGLE PLAY
In addition, the number of apps on Google Play is so vast that even at just under 5% market share, Flurry has a current installed base of just under 80,000 apps in the 1.6 million app sample we studied, and Crashlytics’ sub-1% market share translates to just under 10,000 apps. Which means, of course, that even the smaller players are working at some level of scale.
It’s worth taking a closer look at the data without the big kahuna, Google, hiding all the other players.
Without Google’s analytics for mobile, Flurry looks like the Google of the category, followed by China’s Umeng and Twitter’s Crashlytics.
Google Play By Ratings
Certain analytics SDKs are associated with high-quality apps that generate high user ratings in Google Play. That’s typically a good indicator to add to the mix when selecting a new solution.
Android apps that use Mixpanel generate the highest overall boost in ratings over the average of all apps. Tune is close behind, as are Flurry and Amazon. Apps that use Omniture and Quantcast are unfortunately rated below the average app.

| 40 BACK TO SECTION LISTING
It’s important to take these numbers with a grain of salt.
This is correlation we’re seeing here, not causation. Choosing Quantcast does not guarantee you bad ratings. There are certainly conflating variables at play here, and one of them will be that enterprise focused apps or apps from big old-school media companies are just not as likely to be consumer-friendly, user-friendly, and loved by the average user as consumer-first apps from mobile-first or mobile-only companies.
Still, it’s a good indicator highlighting where end-user value is being created.
Ratings Rank Company Score1 Mixpanel 6.42 HasOffers/Tune 5.93 Flurry 5.54 Amazon 5.15 Localytics 4.46 Google Analytics 4.27 Apsalar 4.18 Crashlytics 3.49 Adobe 3.02
10 HockeyApp 2.211 comScore 2.212 Umeng 1.513 Testflight 1.414 Omniture -215 Quantcast -3.3
App developers and publishers choose analytics solutions specifically so that they know what users are doing in their apps. That data is insight into whether users are enjoying their apps, and in many cases insight into problems they’re having. Developers use that insight to improve their apps, improve engagement, and improve user experience.
Clearly, an analytics solution that doesn’t help you achieve those goals is not going to be on the top of your go-to list.
GOOGLE PLAY
41 |BACK TO SECTION LISTING
GOOGLE PLAY
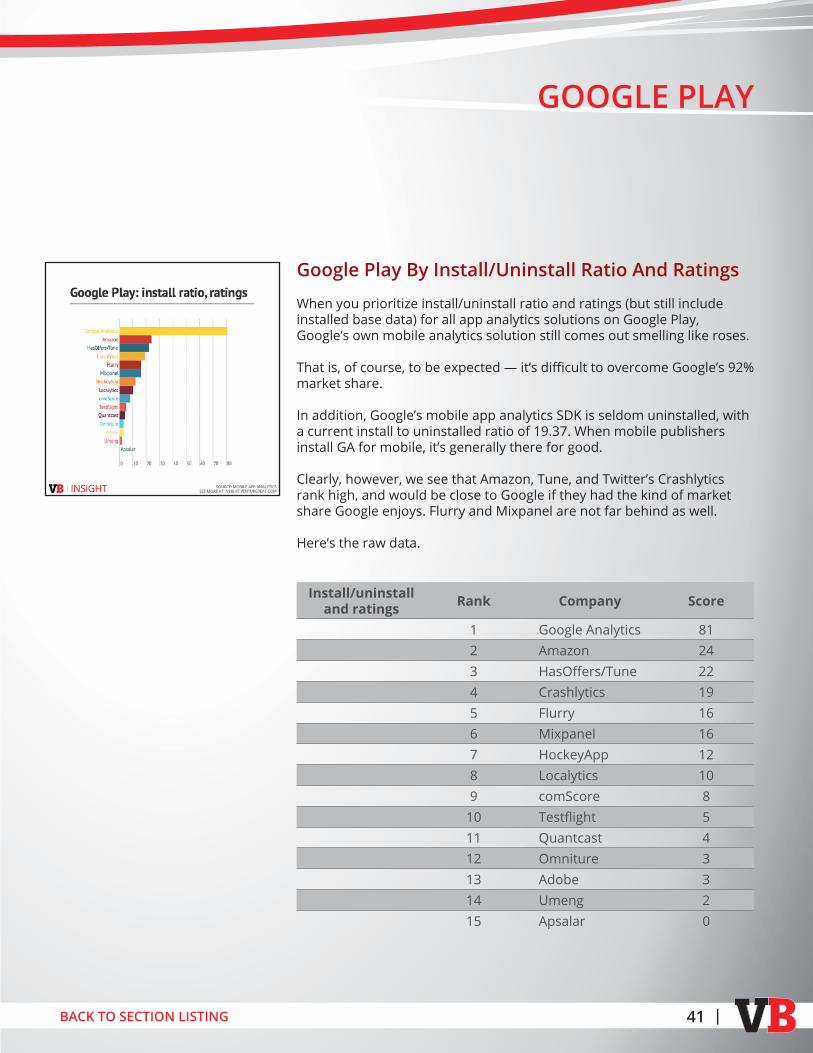
Google Play By Install/Uninstall Ratio And Ratings
When you prioritize install/uninstall ratio and ratings (but still include installed base data) for all app analytics solutions on Google Play, Google’s own mobile analytics solution still comes out smelling like roses.
That is, of course, to be expected — it’s difficult to overcome Google’s 92% market share.
In addition, Google’s mobile app analytics SDK is seldom uninstalled, with a current install to uninstalled ratio of 19.37. When mobile publishers install GA for mobile, it’s generally there for good.
Clearly, however, we see that Amazon, Tune, and Twitter’s Crashlytics rank high, and would be close to Google if they had the kind of market share Google enjoys. Flurry and Mixpanel are not far behind as well.
Here’s the raw data.
Install/uninstall and ratings Rank Company Score
1 Google Analytics 812 Amazon 243 HasOffers/Tune 224 Crashlytics 195 Flurry 166 Mixpanel 167 HockeyApp 128 Localytics 109 comScore 8
10 Testflight 511 Quantcast 412 Omniture 313 Adobe 314 Umeng 215 Apsalar 0

| 42 BACK TO SECTION LISTING
Apsalar gets a zero here because of its horrific install/uninstall ratio on Google Play. With just under 1,100 current installs, the SDK has been uninstalled over 14,000 times ... a clear signal of a serious issue on Android, even though the tool is solid and in some sense exemplary on iOS.
Google Play By Big App Market Share
The picture looks similar when you isolate for big app market share, which we defined for the purposes of this study as apps with more than 5 million users. This is possible to do cleanly and simply for apps on Google Play because Google reveals more app download information than the iOS app store.
For developers who want to scale, it’s important to know that an app analytics solution will not only scale, but will continue to provide value as you grow. The basic data needs you have when small grows into sophisticated cohort analysis and engagement solutions ... and the need to maintain speed at scale can be particularly challenging.
So you want to know which solutions scale well, especially for solutions which require integration work.
Google has a massive lead here, and part of that is due to the fact that the company eats its own dog food in its very successful mobile apps, many of which have over 500 million downloads, and some of which are over a billion.
GOOGLE PLAY

43 |BACK TO SECTION LISTING
Here’s the raw data.
Big App Market Share Rank Company Score
1 Google Analytics 2382 Flurry 613 Amazon 494 HasOffers/Tune 475 Crashlytics 446 Mixpanel 347 HockeyApp 268 Localytics 219 comScore 18
10 Testflight 1111 Quantcast 8.212 Umeng 7.813 Omniture 7.514 Adobe 6.715 Apsalar 1.2
Again, it’ll be easier to see what’s going on if you take the big fish out of the pond. Google is almost a default choice, but most developers are pairing it with something else that provides a different type of value.
Here, it’s clear that Flurry has a lead on Amazon and Tune, with Crashlytics not far behind.
GOOGLE PLAY

| 44 BACK TO SECTION LISTING
Google Play By Uninstall Ratio
As we said earlier for the iOS data, developers uninstall SDKs for a variety of reasons, and they aren’t always because a solution isn’t meeting their needs. Still, the install/uninstall ratio is interesting data for publishers who are looking for a new analytics partner.
We calculated the current installed base versus the number of uninstalls for each of the top 15 solutions. The result?
Google’s Mobile App Analytics shines.
With a ratio of 19.37 current installs to every one uninstall, Google is the runaway leader here. And, the company cements its position as the default analytics SDK for Android apps. This is the solution that stays in the app while developers experiment with alternate analytics engines.
Here’s the full data:
Uninstall Ratio Rank Company Score1 Google Analytics 19.372 Crashlytics 5.543 HockeyApp 5.294 Quantcast 3.875 HasOffers/Tune 3.76 Amazon 3.677 comScore 3.678 Omniture 3.59 Testflight 3.41
10 Adobe 3.0211 Flurry 2.9112 Mixpanel 2.5313 Localytics 2.2314 Umeng 1.6315 Apsalar 0.07
GOOGLE PLAY

45 |BACK TO SECTION LISTING
We asked developers what KPIs matter most, and then applied them to top solutions. The result is the top 10 solutions in our qualitative rankings.
First, we’ll look at KPIs that developers measure most — the frequency at which they incorporate certain KPIs into their measurements. Then, we look at which KPIs matter most to developers and publishers: the ones they base decisions on.
We’ll also evaluate the characteristics of app analytics vendors that matter most to them, and then finally showcase the top 10 solutions as ranked by developers who actually use them.
The top 10 that we were able to evaluate via survey are:
QUALITATIVE RANKING: THE TOP 10 ANALYTICS SOLUTIONS
1. Localytics
2. Flurry
3. Google
4. Mixpanel
5. Facebook
6. Amazon
7. comScore
8. Adobe
9. Apsalar
10. Crashlytics
Recommended solutions:For our Recommended Solutions, we add this data to the quantitative data.
Note:Some of the top solutions in our quantitative rankings didn’t have sufficient market share for us to evaluate them effectively via survey means and still achieve statistical relevance.

| 46 BACK TO SECTION LISTING
QUALITATIVE RANKING: THE TOP 10 ANALYTICS SOLUTIONS
KPIs That Matter
It’s clear from the developers we talked to that mobile publishers are all using the basic KPIs: tracking active users, installs, retention, session length, usage, and more.
Here’s the frequency data on what mobile developers are tracking most.
High-performing developers have a slight tendency to over-weight user variables such as session length and number of sessions over app crash data and upgrades. And developers with big apps tend to care more about life-time value, average revenue per user, and detailed stats such as cost per acquisition and cost per engagement.
So when we asked developers to rank the KPIs by importance, a different picture emerges.

47 |BACK TO SECTION LISTING
QUALITATIVE RANKING: THE TOP 10 ANALYTICS SOLUTIONS
After the first 3 identical answers (active users, installs, and retention), when top developers rank app KPIs by importance, the variable that are most related to engagement and monetization rise to the top.
In place of app crashes, session length, and number of sessions, KPIs that affect dollars hit the top 5: average revenue per user, lifetime value, and conversions. Behavior flow, also critical to understanding what users are doing and how you might be able to influence it, ranks next.
Why use analytics?One other question we asked developers: what’s your most important reason for using analytics? What do you want to achieve?
Here’s how they answered.
Most important, at almost 40%, is increasing user engagement, followed by improving monetization at about 25%. Clearly, developers don’t want analytics for the sake of analytics. They want analytics to make better apps, and make more money.
| 48 BACK TO SECTION LISTING
QUALITATIVE RANKING: THE TOP 10 ANALYTICS SOLUTIONS
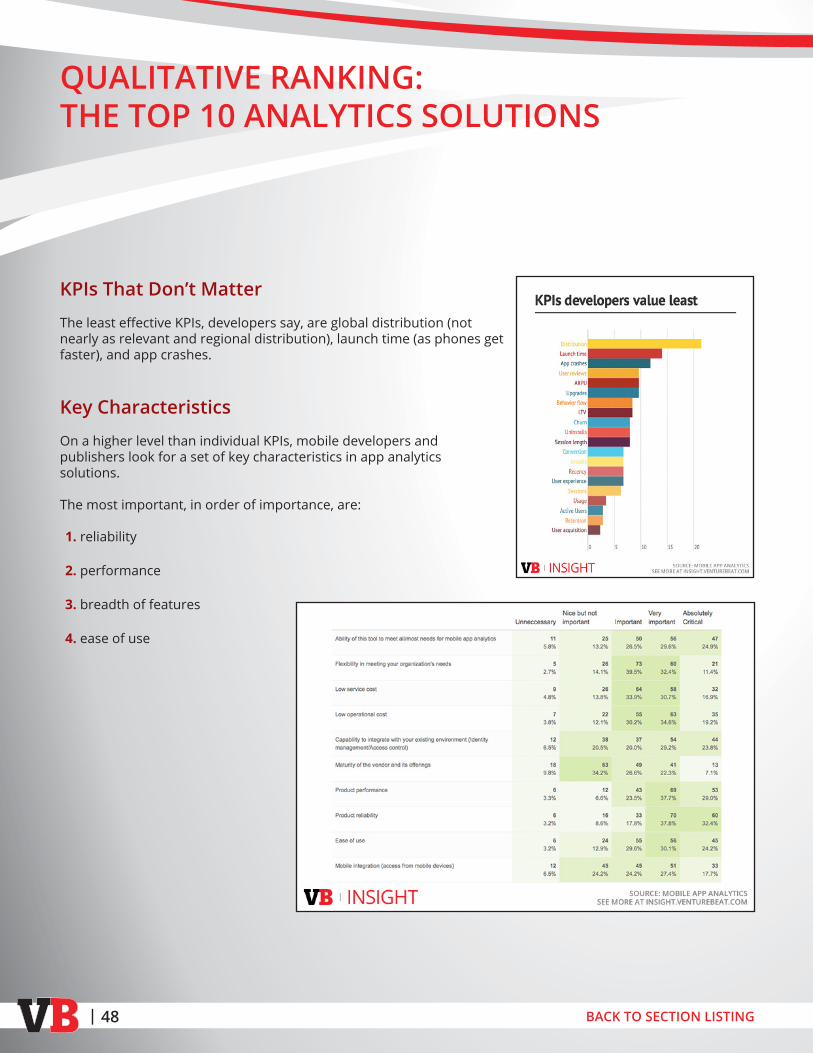
KPIs That Don’t Matter
The least effective KPIs, developers say, are global distribution (not nearly as relevant and regional distribution), launch time (as phones get faster), and app crashes.
Key Characteristics
On a higher level than individual KPIs, mobile developers and publishers look for a set of key characteristics in app analytics solutions.
The most important, in order of importance, are:
1. reliability
2. performance
3. breadth of features
4. ease of use
49 |BACK TO SECTION LISTING
QUALITATIVE RANKING: THE TOP 10 ANALYTICS SOLUTIONS
Less important are features like vendor maturity, as big old companies are frankly less likely to grok mobile. Flexibility is also less important than sheer performance, as is the ability to view the data collected on mobile devices.
The take-away for developers looking for a solution: find the best-in-class from a relatively young, energetic company that can deliver on its promises, like a Google, any of the mighty mites on the platforms they do well, or a Flurry.
Global Rankings By Developer Users
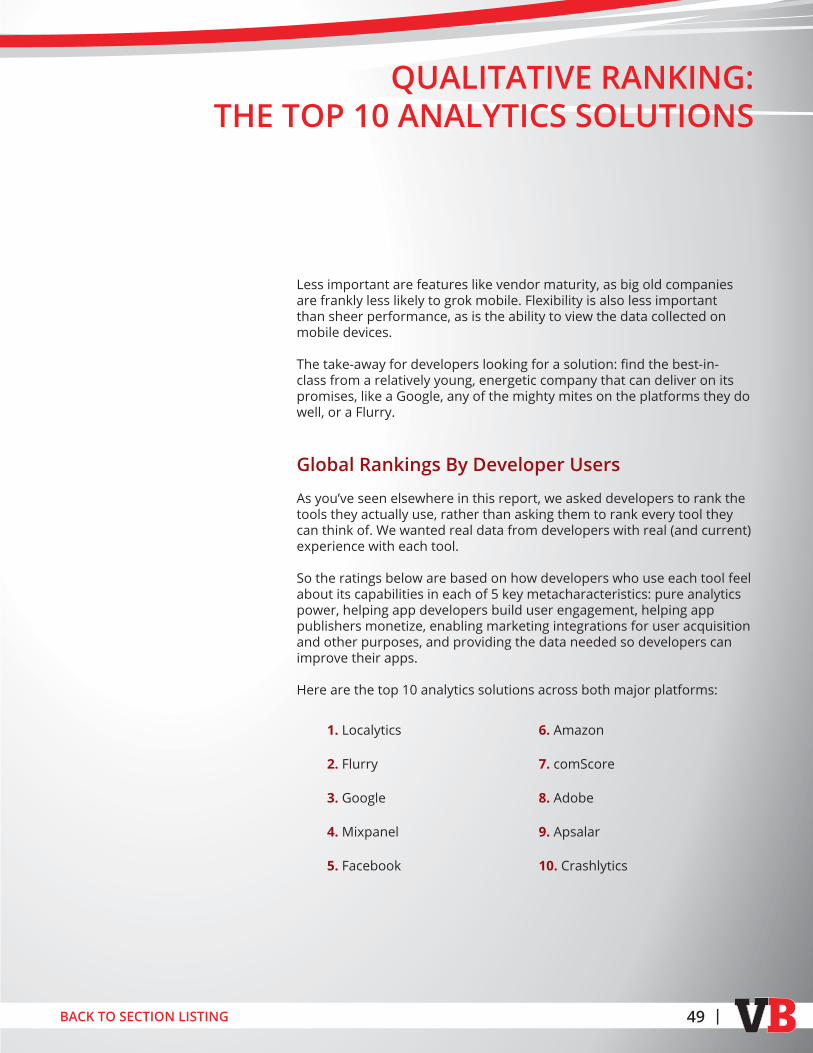
As you’ve seen elsewhere in this report, we asked developers to rank the tools they actually use, rather than asking them to rank every tool they can think of. We wanted real data from developers with real (and current) experience with each tool.
So the ratings below are based on how developers who use each tool feel about its capabilities in each of 5 key metacharacteristics: pure analytics power, helping app developers build user engagement, helping app publishers monetize, enabling marketing integrations for user acquisition and other purposes, and providing the data needed so developers canimprove their apps.
Here are the top 10 analytics solutions across both major platforms:
1. Localytics
2. Flurry
3. Google
4. Mixpanel
5. Facebook
6. Amazon
7. comScore
8. Adobe
9. Apsalar
10. Crashlytics

| 50 BACK TO SECTION LISTING
QUALITATIVE RANKING: THE TOP 10 ANALYTICS SOLUTIONS
Visually, here’s the data. (Bigger chunks of color are better; smaller chunks are worse.)
And here’s the raw data, so you can get the full details. In each row the numbers are the percentage of developers who use the specific tool who rate it either Excellent or Very Good in each category. (We’re not terribly interested in solutions that are just OK.)

51 |BACK TO SECTION LISTING
QUALITATIVE RANKING: THE TOP 10 ANALYTICS SOLUTIONS
The full data:
Ranking Vendor Pure Analytics
Building Engagement Monetization Marketing
Integration
Improving User
ExperienceTotal
1 Localytics 55% 52% 49% 36% 21% 212%2 Flurry 56% 30% 33% 20% 33% 172%3 Google 65% 30% 30% 22% 23% 170%4 Mixpanel 43% 31% 31% 23% 31% 160%5 Facebook 29% 46% 26% 31% 14% 146%6 Amazon 42% 31% 36% 16% 16% 140%7 ComScore 61% 29% 26% 7% 13% 136%8 Adobe 53% 20% 14% 26% 12% 124%9 Apsalar 23% 27% 36% 23% 9% 118%
10 Crashlytics 22% 14% 28% 11% 39% 114%
Some highlights:• Localytics scored highest overall by its users
• Localytics also scored highest in engagement, monetization, and marketing integration
• Platform leaders Flurry and Google come in second and third, respectively
• Google was rated as the best at pure analytics by its users
• Crashlytics was rated as best at helping app developers improve user experience
You’ll note that Facebook makes an appearance here, even though this report hasn’t mentioned the company yet. That’s simply due to the fact that Facebook does offer a mobile analytics solution (Facebook App Insights) for developers that, although it’s tailored specifically for monitoring and measuring “the health of your Facebook integrations” does also provide the ability to measure app events, track cohorts of users, and track other activities in your app. It’s a limited set of capabilities, but Facebook does a good job at delivering on them.
| 52 BACK TO SECTION LISTING
Can’t Miss First Choice: Google Or Flurry
Almost every app that uses analytics on Google Play uses Google’s solution. And more of the apps that use analytics on iOS use Flurry than any other solution.
If you’re in a big old company and you’re simply looking to not get fired, choose Google or Flurry.
But that’s not the only reason to pick these market leaders.
Major developers with hundreds of millions of users choose Google or Flurry as a baseline — one of the 2 or 3 analytics solutions they’ll use to make decisions on app changes. Google in particular has a huge amount of customizability in mobile app tracking if you care enough to embed tags in key events of your gameplay or app experience, and both solutions are capable of handing the biggest and most demanding of apps. On the other hand, Flurry is ranked higher by developers whoactually use it, and has top ranking on iOS.
VB Insight recommendation:1. Google If you have no competitive concerns vis-a-vis Google knowing too much about your app
2. Flurry If you and Google are frenemies
Important note:Although you should choose solutions on iOS and Google Play separately, as the platforms are different and the analytics solutions that are cross-platform don’t perform the same way on both, we recommend that your first-choice pick be first on both platforms, so that in at least one analytics solution you can see all of your data across both major mobile platforms.
CONCLUSION: RECOMMENDED SOLUTIONS

53 |BACK TO SECTION LISTING
CONCLUSION: RECOMMENDED SOLUTIONS
Google Play Top Picks
After your first pick, you need another solution to maximize your ability to grow your app. All the best publishers, such as Supercell, have multiple analytics partners.
Here, base your choice on what you need most in your app.
VB Insight recommendation:1. Tune (HasOffers) If you’re prepping for massive user growth
2. Localytics If you need to improve user experience and monetization
3. Mixpanel If you need to engage users more deeply
4. Amazon If you want to improve monetization
5. Crashlytics If stability is a concern
iOS Top Picks
Since you’re a smart developer, you’re choosing solutions for each of your app platforms independently. So you might havedifferent analytics vendors for iOS. Or, you might not.
Here, base your choice on what you need most in your app.

| 54 BACK TO SECTION LISTING
VB Insight recommendation:1. Localytics If you need to improve user experience and monetization
2. Tune (HasOffers) If you’re prepping for massive user growth
3. Mixpanel If you need to engage users more deeply
4. Apsalar If you want to drive higher ratings and engagement
5. AppsFlyer If you’re building monetization with media partners
Honorable mention: Kochava.
If it had just a bit more market share penetration to test its promising benefits on a wider selection of apps, we’d feel more comfortable about making this a VB Insight recommendation too.
Big Media, Enterprise Solution
Many of the solutions we’ve focused on in this report are mobile-first, and in some cases mobile only.
But there is a whole class of mobile applications that are mobile-and, many of which are from major enterprises and big media companies. Those solutions have suffered in comparison with the others because quantitatively they don’t reach the same level of users as the major mobile-first solutions, and qualitatively the apps are not always as consumer-friendly as they could be.
But, if you’re looking to do integrated analytics between web and mobile, you have Google as an option, but you also have comScore, Adobe, and Quantcast.
CONCLUSION: RECOMMENDED SOLUTIONS

55 |BACK TO SECTION LISTING
VB Insight recommendation:If you’re looking to do basic analytics, chose solutions above. If you’re looking to integrate online/offline/mobile marketingcampaigns, we recommend Adobe due to its tight integration into the Adobe Marketing Cloud.
A Note On Pricing
Pricing should not be the determining factor for your analytics solution. ROI should be.
If the solution you want or need to grow fast and monetize well is not free, pay for it. It’s a small price to pay to grow your mobile business, and nickel-and-diming here will cost you opportunity and revenue long term.
That said, there are plenty of free or almost-free solutions.
CONCLUSION: RECOMMENDED SOLUTIONS

| 56 BACK TO SECTION LISTING
Here’s an overview:• Adobe/Omniture
“Call sales”
• Amazon Amazon is free for up to 100 million events, after which you pay $1 for each million events
• Appsflyer Most features free; non-organic installs range from $0.05 to $0.01 at various volume levels
• Apsalar $1,000/month and up
• BugSense/Splunk Free to $750/month and up
• comScore “Call sales”
• Crashlytics Free
• Flurry Free
• Google Free (there is a premium version of the entire Google Analytics platform)
• HockeyApp Starting at $10/month for 5 apps, up to $500/month
• Kochava Monetizes on non-organic installs
• Localytics Free to $3,400/month at various usage levels
• Mixpanel Free to 200,000 data points, pricing from $150 to $2,000 thereafter
• Quantcast The dreaded “call sales,” which usually means doesn’t fit on a credit card
• TestFlight Free for now; premium features in the future
• Tune/HasOffers Free up to $50,000 attributions; graduated pricing starting at $0.002 per attribution and going down with volume
• Umeng Free
CONCLUSION: RECOMMENDED SOLUTIONS

57 |BACK TO SECTION LISTING
We saw some consistent themes in developers’ responses. They don’t all fit in the main body of this report, but can be of value to both developers/publishers and app analytics vendors.
Most-Overlooked App Analytics Methods
What do most developers miss out on when looking at analytics? Where could they improve?
• CPM calculations for various regions
• ARPD (average revenue per download)
• Cohort analysis: creating user targeting and funnels, segmenting based on those cohorts, and creating unique offers for those cohorts
• Personalization
• Custom dimensions and custom metrics in Google’s analytics solutions
What Developers Want Most
Analytics vendors are providing a lot of options. But they’re either not meeting all developers’ needs, or not getting the message across in terms of what they offer.
EXTRA: ADDITIONAL DEVELOPER INSIGHTS

| 58 BACK TO SECTION LISTING
Here’s what developers want — and feel they can’t get:
• Predictive analytics so I can intervene when usage drops to prompt re-engagement and renew loyalty
• A perfect flow funnel analysis: a flow chart of events and actions relative to KPIs
• Answers: why the uninstall happened
• Feature effectiveness analysis
• Net promoter score
• Heatmaps of user activity
• Intelligent selection of key KPIs to track given your specific app (could be a reason for analytics companies to focus on specific genres). Looking for things that are more specific than the common data ... for example, a game analytics system you could wrap to a specific type of game mechanics
• Don’t just give me the metrics, tell me what they mean
• Suggest new features
Not all developers/publishers are perfectly ethical. Here’s one request that isn’t likely to be fulfilled: turn on players’ microphones while using app and recording!
EXTRA: ADDITIONAL DEVELOPER INSIGHTS

59 |BACK TO SECTION LISTING
Platform Insights
Some key patterns that emerged from the data:
1. Use different tools on different platforms
• Apsalar on iOS is great; on Android not so much
• Supercell’s Clash of Clans uses Google and Tune on Android, but Flurry and Tune on iOS
2. At a certain scale, some big developers take analytics in-house. King, for instance, doesn’t use any outside analytics. Other big apps that completely depend on server-side processing and databases and have little app-side datastore and intelligence (e.g., email apps, many social apps) don’t use traditional app analytics, because their creators can get any needed data serverside. Example: the Facebook app.
3. In mobile analytics, Twitter is deep where Facebook is broad.
• Crashlytics, owned by Twitter, has decent market share but deep insights into apps
• Facebook’s APIs are very broadly spread throughout the app ecosystem, touching far more apps (105,000 on Google Play; 67,000 on iOS), but mostly focusing on social integration and very little on app analytics.
4. Most developers with web and mobile properties would prefer one solution for both, rather than separate solutions for each. However, Kissmetrics and Segment.io, two web solutions with some scale, have almost no penetration on mobile, and the same is true with comScore and Quantcast.
EXTRA: ADDITIONAL DEVELOPER INSIGHTS

http://insight.venturebeat.com/
| www.insight.venturebeat.com