Embed Size (px)
Citation preview
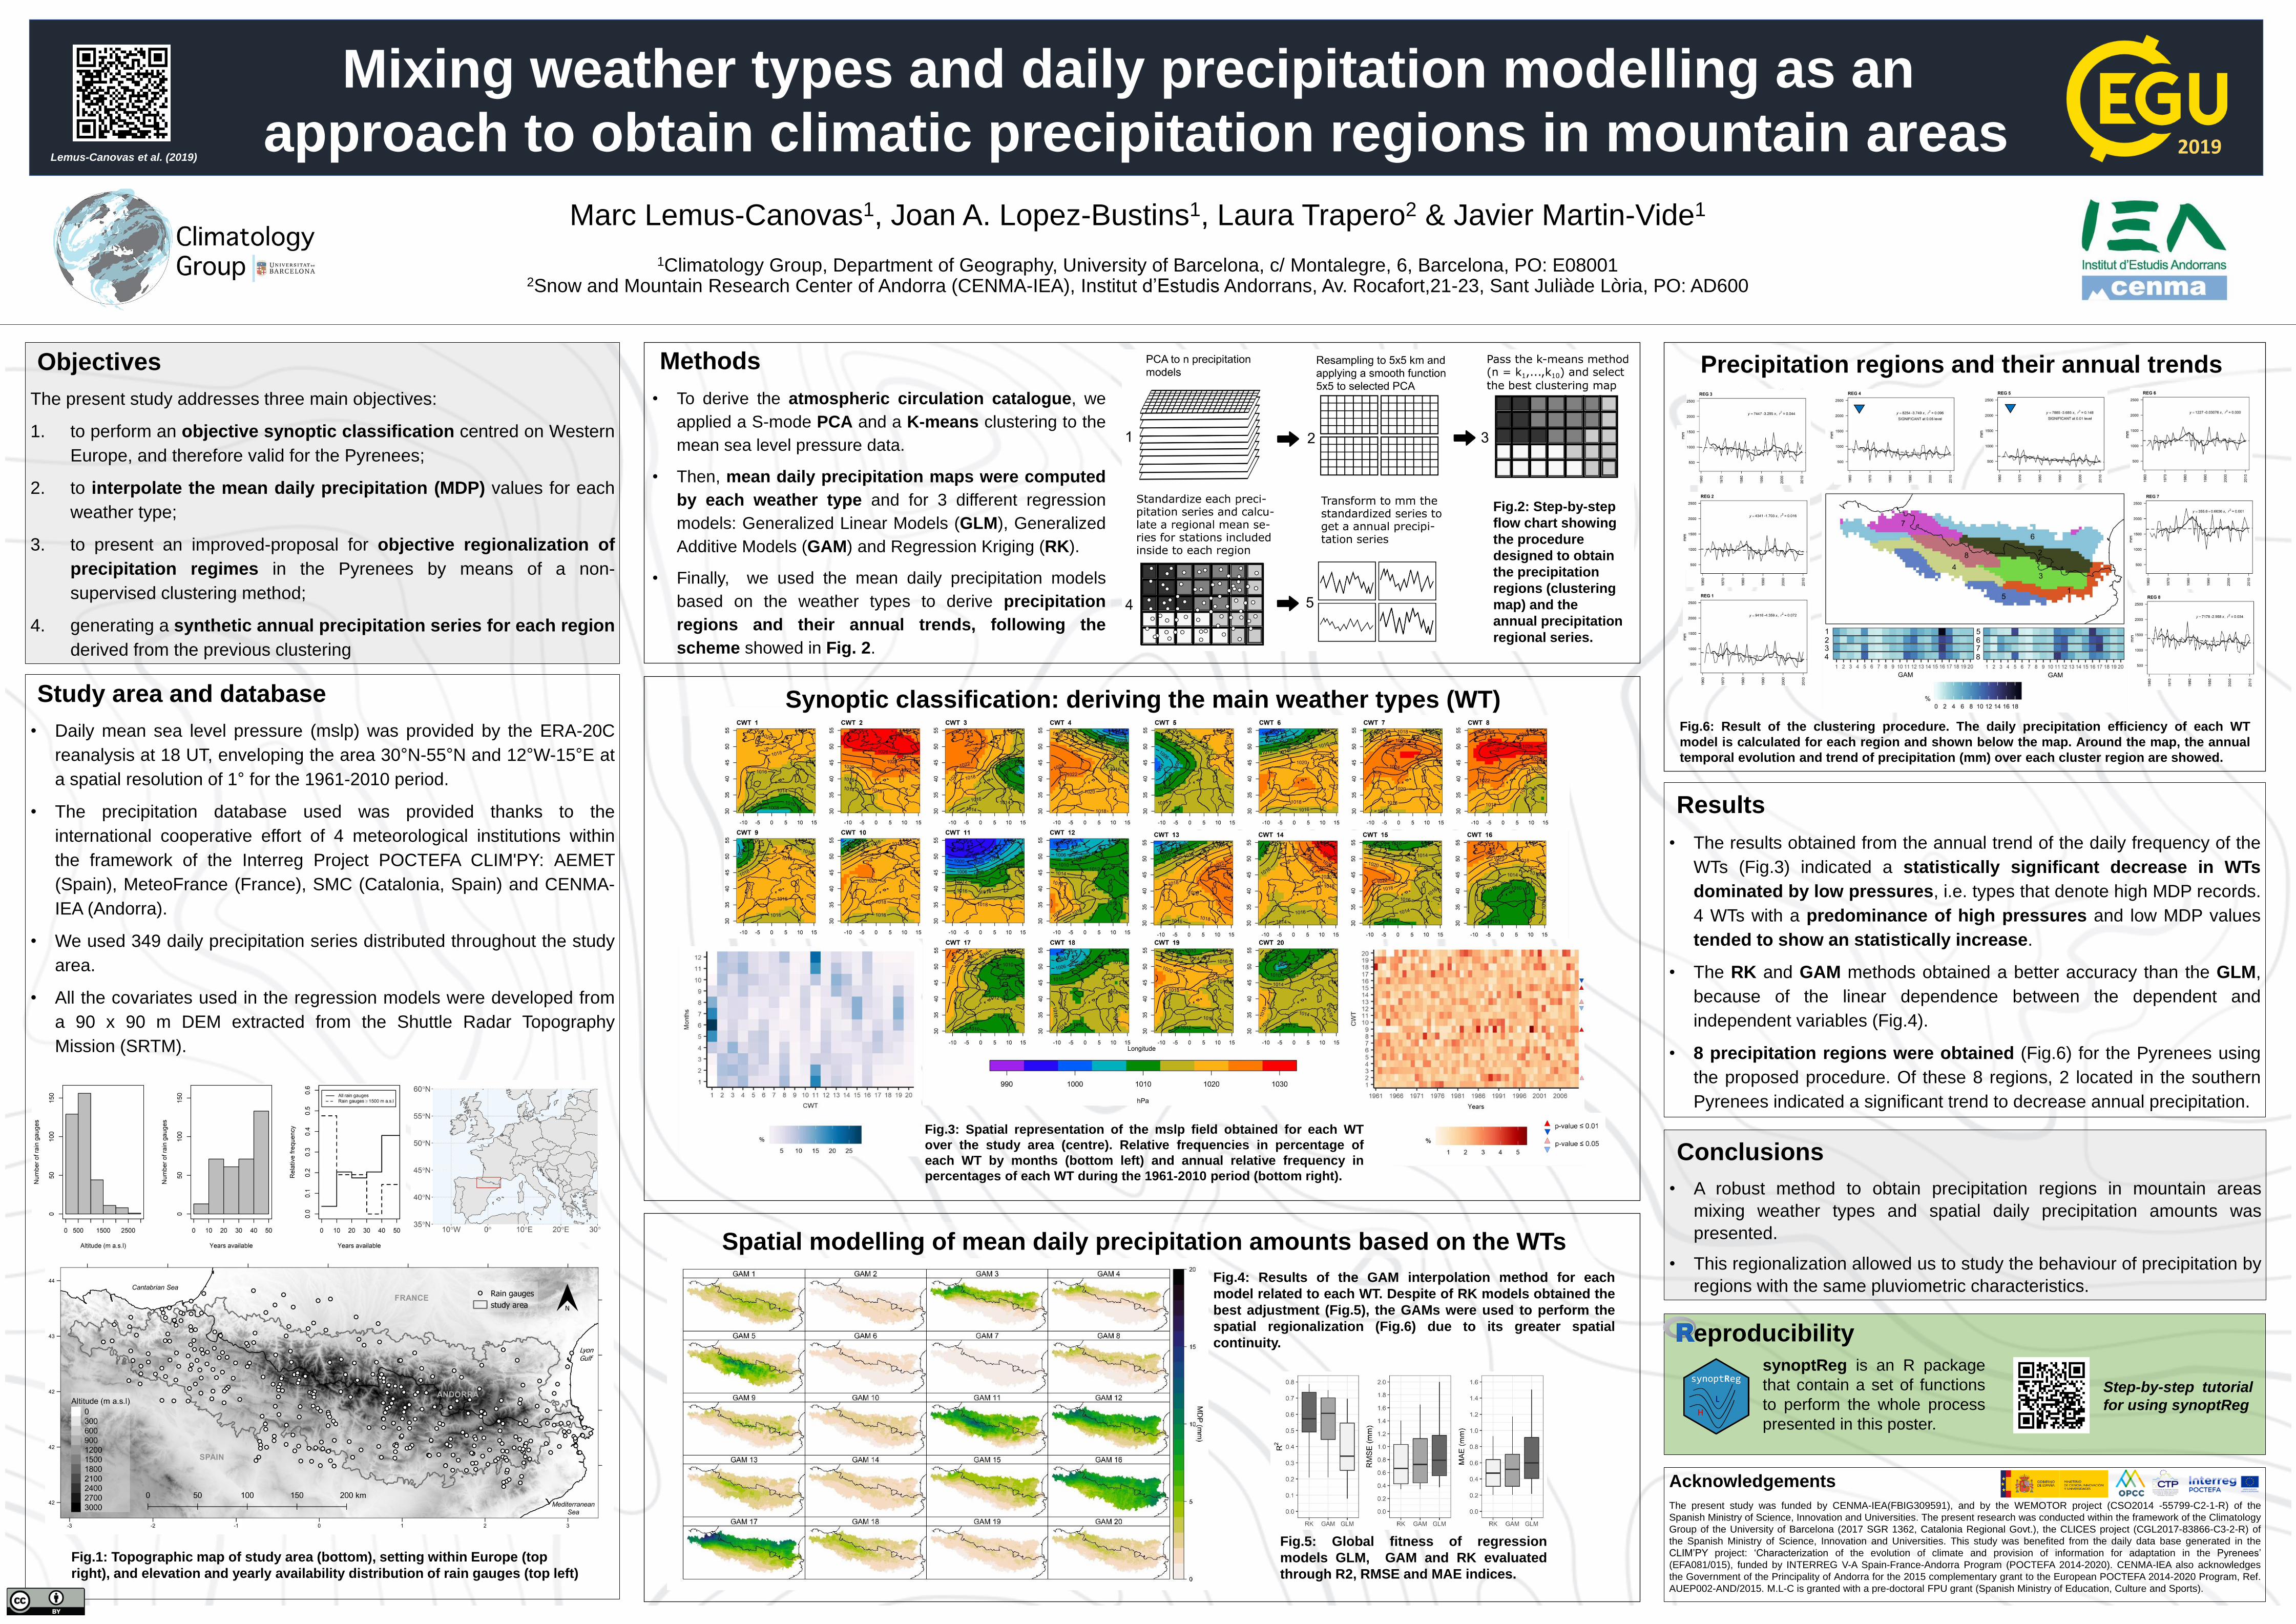
Mixing weather types and daily precipitation modelling as an approach to obtain climatic precipitation regions in mountain areas
Marc Lemus-Canovas1, Joan A. Lopez-Bustins1, Laura Trapero2 & Javier Martin-Vide1
1Climatology Group, Department of Geography, University of Barcelona, c/ Montalegre, 6, Barcelona, PO: E080012Snow and Mountain Research Center of Andorra (CENMA-IEA), Institut d’Estudis Andorrans, Av. Rocafort,21-23, Sant Juliàde Lòria, PO: AD600
Objectives
The present study addresses three main objectives:
1. to perform an objective synoptic classification centred on Western
Europe, and therefore valid for the Pyrenees;
2. to interpolate the mean daily precipitation (MDP) values for each
weather type;
3. to present an improved-proposal for objective regionalization of
precipitation regimes in the Pyrenees by means of a non-
supervised clustering method;
4. generating a synthetic annual precipitation series for each region
derived from the previous clustering
Study area and database
• Daily mean sea level pressure (mslp) was provided by the ERA-20C
reanalysis at 18 UT, enveloping the area 30°N-55°N and 12°W-15°E at
a spatial resolution of 1° for the 1961-2010 period.
• The precipitation database used was provided thanks to the
international cooperative effort of 4 meteorological institutions within
the framework of the Interreg Project POCTEFA CLIM'PY: AEMET
(Spain), MeteoFrance (France), SMC (Catalonia, Spain) and CENMA-
IEA (Andorra).
• We used 349 daily precipitation series distributed throughout the study
area.
• All the covariates used in the regression models were developed from
a 90 x 90 m DEM extracted from the Shuttle Radar Topography
Mission (SRTM).
Methods
• To derive the atmospheric circulation catalogue, we
applied a S-mode PCA and a K-means clustering to the
mean sea level pressure data.
• Then, mean daily precipitation maps were computed
by each weather type and for 3 different regression
models: Generalized Linear Models (GLM), Generalized
Additive Models (GAM) and Regression Kriging (RK).
• Finally, we used the mean daily precipitation models
based on the weather types to derive precipitation
regions and their annual trends, following the
scheme showed in Fig. 2.
Spatial modelling of mean daily precipitation amounts based on the WTs
Results
• The results obtained from the annual trend of the daily frequency of the
WTs (Fig.3) indicated a statistically significant decrease in WTs
dominated by low pressures, i.e. types that denote high MDP records.
4 WTs with a predominance of high pressures and low MDP values
tended to show an statistically increase.
• The RK and GAM methods obtained a better accuracy than the GLM,
because of the linear dependence between the dependent and
independent variables (Fig.4).
• 8 precipitation regions were obtained (Fig.6) for the Pyrenees using
the proposed procedure. Of these 8 regions, 2 located in the southern
Pyrenees indicated a significant trend to decrease annual precipitation.
Conclusions
• A robust method to obtain precipitation regions in mountain areas
mixing weather types and spatial daily precipitation amounts was
presented.
• This regionalization allowed us to study the behaviour of precipitation by
regions with the same pluviometric characteristics.
2019
Synoptic classification: deriving the main weather types (WT)
Precipitation regions and their annual trends
Fig.1: Topographic map of study area (bottom), setting within Europe (top
right), and elevation and yearly availability distribution of rain gauges (top left)
Fig.2: Step-by-step
flow chart showing
the procedure
designed to obtain
the precipitation
regions (clustering
map) and the
annual precipitation
regional series.
Fig.3: Spatial representation of the mslp field obtained for each WT
over the study area (centre). Relative frequencies in percentage of
each WT by months (bottom left) and annual relative frequency in
percentages of each WT during the 1961-2010 period (bottom right).
Fig.4: Results of the GAM interpolation method for each
model related to each WT. Despite of RK models obtained the
best adjustment (Fig.5), the GAMs were used to perform the
spatial regionalization (Fig.6) due to its greater spatial
continuity.
Fig.5: Global fitness of regression
models GLM, GAM and RK evaluated
through R2, RMSE and MAE indices.
Fig.6: Result of the clustering procedure. The daily precipitation efficiency of each WT
model is calculated for each region and shown below the map. Around the map, the annual
temporal evolution and trend of precipitation (mm) over each cluster region are showed.
Lemus-Canovas et al. (2019)
Acknowledgements
The present study was funded by CENMA-IEA(FBIG309591), and by the WEMOTOR project (CSO2014 -55799-C2-1-R) of the
Spanish Ministry of Science, Innovation and Universities. The present research was conducted within the framework of the Climatology
Group of the University of Barcelona (2017 SGR 1362, Catalonia Regional Govt.), the CLICES project (CGL2017-83866-C3-2-R) of
the Spanish Ministry of Science, Innovation and Universities. This study was benefited from the daily data base generated in the
CLIM’PY project: ‘Characterization of the evolution of climate and provision of information for adaptation in the Pyrenees’
(EFA081/015), funded by INTERREG V-A Spain-France-Andorra Program (POCTEFA 2014-2020). CENMA-IEA also acknowledges
the Government of the Principality of Andorra for the 2015 complementary grant to the European POCTEFA 2014-2020 Program, Ref.
AUEP002-AND/2015. M.L-C is granted with a pre-doctoral FPU grant (Spanish Ministry of Education, Culture and Sports).
Reproducibility
Step-by-step tutorial
for using synoptReg
synoptReg is an R package
that contain a set of functions
to perform the whole process
presented in this poster.