Embed Size (px)
Citation preview

The precipitation characteristics of ISCCP tropical weather states
by
Dongmin Lee l,2,3, Lazaros Oreopoulos2
George 1. Huffman4,2,William B. Rossow5, and In-Sik Kang3
1. GESTAR, University Space Research Association, Columbia, MD, USA
2. Earth Sciences Division, NASA-GSFC, Greenbelt, MD, USA
3. Seoul National University, Seoul, South Korea
4. Science Systems and Applications Inc., Lanham, MD
5. City College and Graduate School, City University of New York, New York, NY, USA
Corresponding author address:
Lazaros Oreopoulos
NASA-GSFC
Code 613
Greenbelt, MD 20771
USA
Lazaros. OreopoulosCU)nasa. gOY
Submitted to the
10umal of Climate
December 2011
https://ntrs.nasa.gov/search.jsp?R=20120003923 2018-05-11T00:27:21+00:00Z


Popular Summary
In order to understand the water budget of the planet it is important to measure the
rainfall distribution. We can now achieve relatively good rainfall estimates from satellites
over almost the entire planet. Only measuring rainfall amounts is however not enough for
understanding the underlying physical processes that determine where, when, and how
much rainfall occurs. We must also observe and measure other atmospheric
characteristics that are related to rainfall, such as the properties of clouds. In this paper
we propose a method that will help us better understand what cloud mixtures the
precipitation of the tropical region (covering about half the are of the planet and
exhibiting the strongest rainfall intensities) originates from. We achieve this by
combining different satellite measurements targeted to rainfall and cloud thicknesslheight
estimations. One of our main findings is that in the tropics about half of the total rainfall
comes from one particular type of cloud mixtures, associated with deep storm systems.
Surprisingly, our combined datasets indicate that even these clouds are often (about half
the time) not precipitating (raining); when they do they tend to precipitate more strongly
over ocean than over land, also a somewhat unexpected result given that several measures
of storminess are stronger over land. Our results can be used to check whether climate
models assign their precipitation in accordance with the observations and to therefore
indirectly assess whether predictions of future precipitation in a changed climate are
reliable.


Abstract
We examine the daytime precipitation characteristics of the International Satellite Cloud
Climatology Project (ISCCP) weather states in the extended tropics (35°S to 35°N) for a
10-year period. Our main precipitation data set is the TRMM Multisatellite Precipitation
Analysis 3B42 data set, but Global Precipitation Climatology Project daily data are also
used for comparison. We find that the most convective weather state (WSl), despite an
occurrence frequency below 10%, is the most dominant state with regard to surface
precipitation, producing both the largest mean precipitation rates when present and the
largest percent contribution to the total precipitation of the tropical zone of our study; yet,
even this weather state appears to not precipitate about half the time. WS 1 exhibits a
modest annual cycle of domain-average precipitation rate, but notable seasonal shifts in
its geographic distribution. The precipitation rates of the other weather states tend to be
stronger when occuring before or after WS 1. The relative contribution of the various
weather states to total precipitation is different between ocean and land, with WS 1
producing more intense precipitation on average over ocean than land. The results of this
study, in addition to advancing our understanding of the current state of tropical
precipitation, can serve as a higher order diagnostic test on whether it is distributed
realistically among different weather states in atmospheric models.


1
2
3
4
5
6
7
The precipitation characteristics of ISCCP tropical weather states
by
Dongmin Lee l,2,3, Lazaros Oreopoulos2
George 1. Huffman4,2,William B. Rossow5, and In-Sik Kang3
8 1. GESTAR, University Space Research Association, Columbia, MD, USA
9 2. Earth Sciences Division, NASA-GSFC, Greenbelt, MD, USA
10 3. Seoul National University, Seoul, South Korea
11 4. Science Systems and Applications lnc., Lanham, MD
12 5. City College and Graduate School, City University of New York, New York, NY, USA
13
14
15
16
17
18
19
20
21
22
23
24
25
26
Submitted to the
Journal of Climate
December 2011
Corresponding author address:
Lazaros Oreopoulos
NASA-GSFC
Code 613
Greenbelt, MD 20771
USA
Lazaros. Orco:goulos(a1nasa. gOY

26 Abstract
27 We examine the daytime precipitation characteristics of the International Satellite Cloud
28 Climatology Project (rSCCP) weather states in the extended tropics (35°S to 35°N) for a 10-year
29 period. Our main precipitation data set is the TRMM Multisatellite Precipitation Analysis 3B42
30 data set, but Global Precipitation Climatology Project daily data are also used for comparison.
31 We find that the most convective weather state (WS 1), despite an occurrence frequency below
32 10%, is the most dominant state with regard to surface precipitation, producing both the largest
33 mean precipitation rates when present and the largest percent contribution to the total
34 precipitation of the tropical zone of our study; yet, even this weather state appears to not
35 precipitate about half the time. WS 1 exhibits a modest annual cycle of domain-average
36 precipitation rate, but notable seasonal shifts in its geographic distribution. The precipitation
37 rates of the other weather states tend to be stronger when occuring before or after WS 1. The
38 relative contribution of the various weather states to total precipitation is different between ocean
39 and land, with WS 1 producing more intense precipitation on average over ocean than land. The
40 results of this study, in addition to advancing our understanding of the current state of tropical
41 precipitation, can serve as a higher order diagnostic test on whether it is distributed realistically
42 among different weather states in atmospheric models.
43
2

43 1. Introduction
44 The role of clouds in the water and energy cycle can not be overstated. Atmospheric heating
45 rates (due to radiative and thermodynamical processes), surface energy budgets (radiative and
46 turbulent), and precipitation rates have strong dependencies on cloud properties, and frequency
47 of occurrence. While the average effect of cloud can be studied in aggregate, grouping the
48 multitude of observed cloud systems into discernible cloud regimes and studying the energy and
49 water budgets associated with them can be a far more useful approach for understanding the
50 potential impact of cloud changes on future water and energy budget distributions. An additional
51 advantage of such a holistic approach is that more physically-based diagnostics to evaluate
52 Global Climate Model (GCM) hydrological and radiative budgets can be formulated.
53 A number of recent studies have focused on the topic of objectively identifying distinct
54 cloud regimes. The criterion commonly used for identifying cloud regimes is the co-variation of
55 cloud location (expressed as cloud top height or pressure) and extinction (expressed as cloud
56 optical thickness or reflectivity). Cloud mixtures exhibiting certain patterns in the co-variation of
57 these quantities can be identified as distinct cloud regimes. The patterns can be identified with
58 either neural network or k-means clustering techniques with the latter being generally easier to
59 implement and therefore more popular (Jakob and Tselioudis 2003; Rossow et ai. 2005; Zhang et
60 al. 2007; Gordon and Norris 2010; Greenwald et aI., 2010). The search for patterns can be
61 performed on either a global dataset of joint height-extinction variations or on distinct climatic
62 zones. The breakdown by climatic zone has the advantage that cloud regime identification can be
63 fine-tuned so that cloud mixtures that may have otherwise been obscured in a larger data set can
64 emerge from a more geographically targeted analysis. It also allows examing (dis)similarities
65 between different parts of the globe with regard to the presence and occurence frequency of
3

66 different cloud mixtures. Once the regimes have been identified, a variety of properties that
67 characterize them can be easily compiled.
68 A compelling question is whether distinct roles of cloud regimes in weather and climate
69 can be determined. If the atmospheric conditions under which particular cloud regimes form
70 have indeed identifiable features, it should be possible to associate changes in meteorological
71 conditions with changes in hydrology and energetics through these cloud regimes. Studies along
72 such lines have begun to emerge in recent years. Several previous studies (Jakob et al. 2005;
73 Williams and Webb 2008; Oreopoulos and Rossow 2011; Haynes et al. 2011) have focused on
74 the radiative characteristics of cloud regimes. Other studies have concentrated on precipitation
75 characteristics. For example, Jakob and Schumacher (2008) combined cloud regimes, inferred
76 from International Satellite Cloud CliInatology Project (ISCCP, Schiffer and Rossow 1983)
77 . cloud retrievals, with collocated precipitation and latent heating data from the Tropical Rainfall
78 Measuring Mission (TRMM) Precipitation Radar in the tropical western Pacific. By compositing
79 TRMM precipitation amount and type into the ISCCP regimes they managed to distinguish
80 between three major precipitation regimes and identify their surface precipitation rates and latent
81 heat profile characteristics. Zhang et al. (2010) defmed cloud/precipitation regimes in the tropics
82 from profiles of CloudSatiCALIPSO radar/lidar reflectivities and hydrometeor locations and then
83 compared with the corresponding regimes of a GCM operating in weather forecast mode.
84 Tromeur and Rossow (2008) found for the ±15° latitude zone that while the most convectively
85 active cloud regime dominated by organized deep convection dwarfs the precipitation rate of all
86 other regimes, the regime representing unorganized convection with much lower average
87 precipitation rate has nearly the same contribution, because it occurs much more frequently.
4

88 In this paper we conduct a more extensive and detailed analysis of the precipitation of
89 tropical (±35° latitude zone) cloud regimes (henceforth referred to as "weather states" following
90 Rossow et al. 2005 who explain that they are associated with distinct atmospheric conditions; see
91 also Jakob and Tselioudis 2003; Jakob et ai. 2005; Gordon and Norris 2010). One of our goals is
92 to confirm that these mesoscale weather states as identified by ISCCP help in the understanding
93 of tropical precipitation characteristics. Specifically, we examine the mean magnitude and range
94 of surface precipitation rate produced by the weather states, their relative contribution to the total
95 precipitation of the tropics, and the geographical distribution of weather state precipitation. We
96 also seek to further clarify the degree to which the most convectively active weather states
97 dominate the tropical precipitation, a topic also investigated by Rossow et aI. (2011) with a
98 different analysis approach. Our results are featured in section 4 which is broken into
99 subsections, each highlighting separate important aspects of the precipitation-weather state
100 relationship. We discuss means, geographical variations and frequency distributions of each
101 weather state's precipitation rates, and dependencies on the precipitation data set used. We pay
102 special attention to the strongest precipitating weather state, its seasonal variations and its
103 apparent effects on the precipitation of the other weather states when in close temporal
104 proximity.
105
106 2. Data sets
107 Our study uses three data sources: The ISCCP weather states for the extended tropics
108 (Oreopoulos and Rossow 2011) to identify cloud regimes, and two precipitation products, the
109 TMPA-3B42 (Huffman et aI., 2010), and GPCP-IDD (Huffman et aI., 2001).
5

110 Rossow et al. (200S) describe how the ISCCP weather state product is generated. Briefly, a
111 search for distinctive patterns is conducted in the joint frequency distributions of cloud top
112 pressure (Pc) and cloud optical thickness (r) constructed from individual daytime satellite image
113 pixel retrievals (fields-of-view about S km in size) within 2.S0 regions provided in the
114 International Satellite Cloud Climatology (ISCCP) D 1 dataset (Rossow and Schiffer, 1999).
115 Cluster centroids representing specific histogram patterns describing cloud variability are
116 identified using the "k-means" clustering algorithm (Anderberg, 1973).
117 A weather state dataset derived as described above is now available for the period 1983-
118 2008 between 6S0S to 6soN divided in three geographical zones. This dataset can be downloaded
119 from ftp://isccp.giss.nasa.gov/outgoing/PICKUPICLUSTERS/data11983-2008/. Here, we use the
120 data corresponding to the so-called "extended" tropicaVsubtropical zone between 3SoS and
121 3soN, ISCCP dataset Dl.WS.ET.dat. This dataset has been previously used by Mekonnen and
122 Rossow (2011) and Oreopoulos and Rossow (2011). The optimal cluster centroids are shown in
123 Fig. 1, while maps of weather state relative frequency of occurrence (RFO) are provided in Fig.
124 2. The weather state indices were assigned according to classical understanding of associated
125 convective activity strength, with indices increasing for the progressively more convectively
126 suppressed weather states. Note that this indexing convention follows Rossow et al. (200S), but
127 is opposite of that of Haynes et al. (2011).
128 The weather state data are jointly analyzed with two precipitation datasets for a 10-year
129 overlapping period from January 1998 to December 2007. One is based on the Tropical Rainfall
130 Measuring Mission (TRMM) Multi-satellite Precipitation Analysis (TMP A) algorithm which
131 seeks to provide a "best" estilnate of quasi-global (SOOS to SOON) precipitation from the wide
132 variety of modem satellite-borne precipitation sensors as well as gauge measurements where
6

·133 feasible. Estimates are provided at relatively fine scales, 0.25° xO.25°, 3-hourly (Huffman et al.
134 2010). We use the post-processed research product which is based on calibration by the TRMM
135 Combined Instrument (TCI) product and covers the period January 1998 to present. The research
136 product system has been developed as the version 6 algorithm for the TRMM operational
137 product 3842 (3842 V.6). Henceforth, we will call this product "TMPA-3B42".
138 The other precipitation product used is the GPCP-1 DD version 1.1 precipitation product
139 which was developed to support the Global Precipitation Climatology Project (GPCP)
140 established by the World Climate Research Programme to quantify multi-year global
141 distributions of precipitation. The product provides I-day (daily) precipitation estimates on a 1-
142 degree grid over the entire globe for the period October 1996 - present. The GPCP-1DD product
143 is a complement to the GPCP Version 2 Satellite-Gauge (SG) combination product (Adler et al.
144 2003). GPCP-I DD uses data from geostationary-satellite infrared sensors to compute the
145 threshold-matched precipitation index (TMPI) and provide precipitation estimates on a lOx 1 °
146 grid at 3-hourly intervals within the 40oN-40oS latitude zone. The TMPI sequence of
147 instantaneous 3-hourly estimates are summed to produce the daily value. Estimates outside this
148 latitude zone (not used in this study) are computed based on recalibrated Television Infrared
149 Observation Satellite Operational Vertical Sounder data from polar-orbiting satellites (Susskind
150 et al. 1997). Additionally, the GPCP-1DD product is scaled in both data regions to match the
151 monthly accumulation provided by the SG product which combines satellite and gauge
152 observations at a monthly time scale on a 2.5°x2.5° grid.
153
154
155
7
156 3. Analysis method
157 The analysis method is fairly straightforward and is based on compositing the precipitation data
158 as a function of weather state. The D1.WS.ET.dat file contains the weather state index in each
159 2.5 0 grid cell for every daytime 3-hour interval. Due to their different temporal and spatial
160 resolutions the two precipitation data sets have to be treated differently in the cOlnpositing
161 process. The 3-hour resolution of the TMPA-3842 data allows temporal matching with the
162 ISCCP weather state data. Spatial matching to the 2.5 0 resolution ISCCP weather state data is
163 achieved by taking the mean of all non-missing 0.25 0 precipitation data that fall into the 2.5 0 grid
164 cell. GPCP data are resampled from 10 to 2.5 0 via spatial interpolation.
165 For each 3-hour time period, the TMPA-3B42 data are stlgregated for each weather state in
166 order to calculate the state's precipitation statistics. However, something analogous cannot be
167 perfonned for the daily-averaged GPCP-IDD precipitation data. We therefore pursue two
168 avenues for segregating and compositing GPCP-IDD data: (1) we assign the same daily
169 precipitation rate to all weather states encountered during the daytime period of a grid cell; or (b)
170 we only consider those grid cells for which a single weather state persists during a day's daylight
171 hours and assign the corresponding GPCP-l DD daily precipitation rate (cf. Rossow et al. 2011).
172 Considering the above, only TMP A-3B42 composited precipitation can be characterized as
173 actual daytime (i.e. during sunlit hours) precipitation. Because the temporal matching with the
174 ISCCP weather states can be perfonned better, most of our analysis relies on TMPA-3B42
175 precipitation data. The availability of GPCP-l DD precipitation rates, even without the temporal
176 resolution of TMPA-3B42, may however still offer insight on certain aspects of weather state
177 precipitation, as we will show below. To construct two precipitation composites that are more
178 comparable, we also segregate TMPA-3842 precipitation as in method (2) of GPCP-IDD
8

179 compo siting, i.e., we consider the daily-averaged TMPA-3B42 precipitation rates of only those
180 grid cells where a single weather state persists during daytime.
181 As will be seen in the next section, precipitation data that have been segregated by weather
182 state can be analyzed in terms of their range and variability, geographical distributions, relative
183 contributions to the precipitation budget, and other features.
184
185 4. Characteristics of tropical weather state precipitation
186 In this section we identify the relative importance of the various weather states to the tropical
187 precipitation budget, examine the degree to which the weather states are hydrologically distinct,
188 investigate whether a weather state's precipitation is affected by the state that telnporally adjoins
189 it, examine the sensitivity of the results to the precipitation dataset used, and perform a separate
190 more detailed analysis on the seasonal and geographical precipitation characteristics of WS 1, the
191 most convectively intense weather state.
192
193 a. Means and geographic distribution ofTMPA-3B42 precipitation
194 The geographic distribution of the 10-yr mean daytime precipitation rate for each weather state
195 from TMPA-3B42 is shown in Fig. 3. These are mean rates (including zero precipitation) at the
196 time of weather state occurence. It is immediately obvious that ISCCP joint histogram clustering
197 succeeds in isolating the most intensively precipitating weather state, WS 1, with its large portion
198 of high optically thick clouds (Fig. 1). WS1 's mean precipitation rate indeed dwarfs the
199 precipitation of any other weather state in the tropics with vast regions of the tropical Pacific and
200 Atlantic oceans exhibiting mean annual precipitation rates in excess of 25 mm/day. There are
201 significant regional differences in WS I precipitation, like smaller rates over the Indian Ocean
9

202 and weaker precipitation over land (further discussed further). The mean precipitation rates for
203 the remaining weather states generally decrease monotonically with their assigned index, with
204 WS2 and WS3 producing significant precipitation (albeit always lower than 10 mmJday on an
205 annual basis) consistent with their implied level of convective activity (convective anvils that
206 often evolve from WS 1 convection in the case of WS2, and unorganized less penetrative
207 convection in the case of WS3). From the convectively suppressed states WS4 to WS8 (grouped
208 together in the precipitation frequency histograms of Rossow et al. 2011), WS8 is notable for a
209 stronger precipitation presence over land areas.
210 To gauge the hydrological importance of a weather state in the tropics, the contribution of
211 the weather state to the total precipitation of the entire region is calculated. These results are
212 shown in Fig. 4, as percentage contributions of each weather state to the total grid cell
213 precipitation. Two important points need to be kept in mind for the interpretation of these
214 figures. First, the contribution of each weather state to the total grid cell precipitation is not only
215 a function of the mean precipitation intensity when the state occurs, but also of its frequency of
216 occurrence in the particular grid cell. If for example, one compares the top panel of Fig. 3 with
217 the top panel of Fig. 4 (WS 1) there is not much spatial correlation between mean precipitation
218 rate and contribution. This is because areas where WS 1 produces large precipitation are often
219 also areas where WS 1 rarely occurs. Second, areas where a particular weather state appears to be
220 contributing significantly are not necessarily areas where that state produces significant
221 precipitation. In other words, the fractional contribution of a state may be large, but with a small
222 total grid cell precipitation, the absolute amounts of precipitation involved are small even for the
223 largest weather state contributor. An example of this is WS3 with small precipitation amount
10

224 being the largest contributor of precipitation off the west coast of S. America, a generally dry
225 area (Fig. 3).
226 The domain-average annual daytime mean precipitation and fractional contribution of each
227 weather state to the total tropical precipitation from TMPA-3B42 is shown in Fig. 5. To facilitate
228 the interpretation of the fractional contribution, the domain-average annual RFO is also included
229 in the graph. One can see that despite an RFO of only ~6%, WSI contributes about half of the
230 total precipitation of the ±35° latitude zone. This is because the mean precipitation rate of ~ 19
231 mmlday for this state is more than four times higher than the next strongest precipitating weather
232 state (WS2). But WS2, as well as WS3, are still significant precipitation contributors,
233 collectively contributing about 34% of the tropical precipitation, i.e., about 670/0 of the
234 precipitation that does not come from WSl. The most frequent state, WS8, with an RFO ~380/0
235 contributes less than 80/0 to the tropical precipitation budget because of its 2nd smallest (after
236 WS7) mean precipitation rate of ~O.6 mmlday.
237 Fig. 6 breaks down the results of Fig. 5 into land and ocean domain averages. A 2.5 0 grid
238 cell is defined as "land" when is contains less than 25% water, "ocean" when it is more that 75%
239 water and "mixed" in all other cases. According to this convention, in our latitude zone 23.1 % of
240 2.5 0 grid cells are land, 71.4% are ocean, and the remaining 5.5% are "mixed". One striking, and
241 somewhat unexpected finding is that the mean precipitation rate of WS I is significantly higher
242 over ocean (21 mmlday) than over land (14 mmlday). This basic result was reproduced when
243 GPCP-I DO data is used in place of TMPA-3B42 (not shown). The finding seems to contradict
244 conventional wisdom about the greater vigor (i.e., stronger updrafts) of continental deep
245 convection compared to oceanic deep convection. One possible explanation is the drier
246 environment of continental convection causing the evaporation of a significant fraction of the
11

247 precipitation before it reaches the ground. This phenomenon, discussed by Geerts and Dejene
248 (2005), who found radar reflectivity profiles peaking at high altitude and decreasing toward the
249 ground in Africa, would be captured by the TMPA-3B42 and GPCP-IDD datasets because of the
250 surface gauge rescaling employed. Another possible mechanism for less precipitation reaching
251 the surface over land could be rain being swept in greater amounts out of the convective cores by
252 the stronger updrafts of continental WS 1 systems.
253 Fig. 6 also shows that while the ranking of the weather states with respect to their
254 contribution to the total precipitation is not different between ocean and land, the relative
255 importance of the different weather states as contributors to the precipitation budget exhibits
256 some changes compared to the overall values. One can see, for example, that WS 1 is a larger
257 fractional contributor to ocean precipitation than land precipitation, that the opposite is true for
258 WS8, and that WS2 and WS3 are more on par in ocean precipitation contribution than in land
259 precipitation contribution. Differences in the relative fractional contribution between land and
260 ocean can come from the combination of changes in mean precipitation intensity and RFO. For
261 WSI we see that the RFO over ocean and land is about the same (0.062 and 0.065, respectively)
262 and the main factor making WSI a larger relative contributor over ocean is mean WSI
263 precipitation being greater in marine grid cells. In the case of WS3, where both the mean
264 precipitation and the RFO are substantially different between land and ocean, but in opposite
265 directions, it appears that the greater RFO over land dominates the fractional contribution.
266
267 b. Comparisons between different datasets and compositing approaches
268 We now examine whether global values of mean precipitation and contribution are similar when
269 daily-averaged GPCP precipitation is composited. Because of the different temporal resolution of
12

270 the GPCP dataset, additional assumptions have to be employed for compositing. The comparison
271 between TMPA-3B42 and GPCP-1DD weather state precipitation is shown in Fig. 7. The top left
272 panel of this figure is the same as in Fig. 5, which shows the domain-average daytime mean and
273 contribution to the total precipitation from our "best" compo siting method of TMPA-3B42 data
274 that are temporally matched with ISCCP weather state data. The other panels show results using
275 the alternate compo siting approaches discussed in section 3, necessitated by the daily-average
276 nature of the GPCP-1DD data set. The upper right panel shows domain average values obtained
277 by assuming that the GPCP-1DD precipitation is constant throughout the day: all weather states
278 identified during the sunlit period of a grid cell are assigned the same value of precipitation, the
279 (spatially interpolated to 2.5°) diurnal average provided by GPCP-1DD. The lower left panel
280 shows values obtained using only those grid cells for which the same weather state persists
281 during the day's daylight hours. Presumably, for the grid cells satisfying the single weather state
282 condition, the assumption of constant precipitation rate throughout the entire daytime period is
283 better. Note that because close the International Date Line daylight hours may be split between
284 two UTC days containing GPCP-1DD data, this area is under-represented in this form of
285 conditional compositing. In the lower right panel the TMP A-3B42 are composited the same way,
286 i.e., using the daily-averaged TMPA-3B42 precipitation and only those grid cells with
287 occurences of only one weather state during the entire daytime period.
288 The RFOs are comparable between the two panels that use all weather state data (upper
289 row panels) and the two panels that use only the fraction of grid cells with the same persistent
290 weather state throughout the day (lower row panels). The RFOs of the lower row panels increase
291 relative to those of the upper row panels for the states that have the largest fractions of grid cells
292 with a persistent daytime weather state. This is most notable for WS8 which has an RFO of
13

293 0.383 when all the grid cells are accounted for, and an RFO of 0.528 when we only consider the
294 grid cells with no diurnal variability of weather state occurrence. Indeed, for WS8 the fraction of
295 grid cells of the latter type is 18.4%, larger than the counterpart fraction of any other weather
296 state. On the other hand, the RFO of (weakly precipitating) WS7 drops from ~0.085 to 0.039
297 when implementing this screening because only 6.3% of grid cells (lowest of all weather states)
298 containing WS7 maintain this weather state for the entire daytime period; in other words, WS7
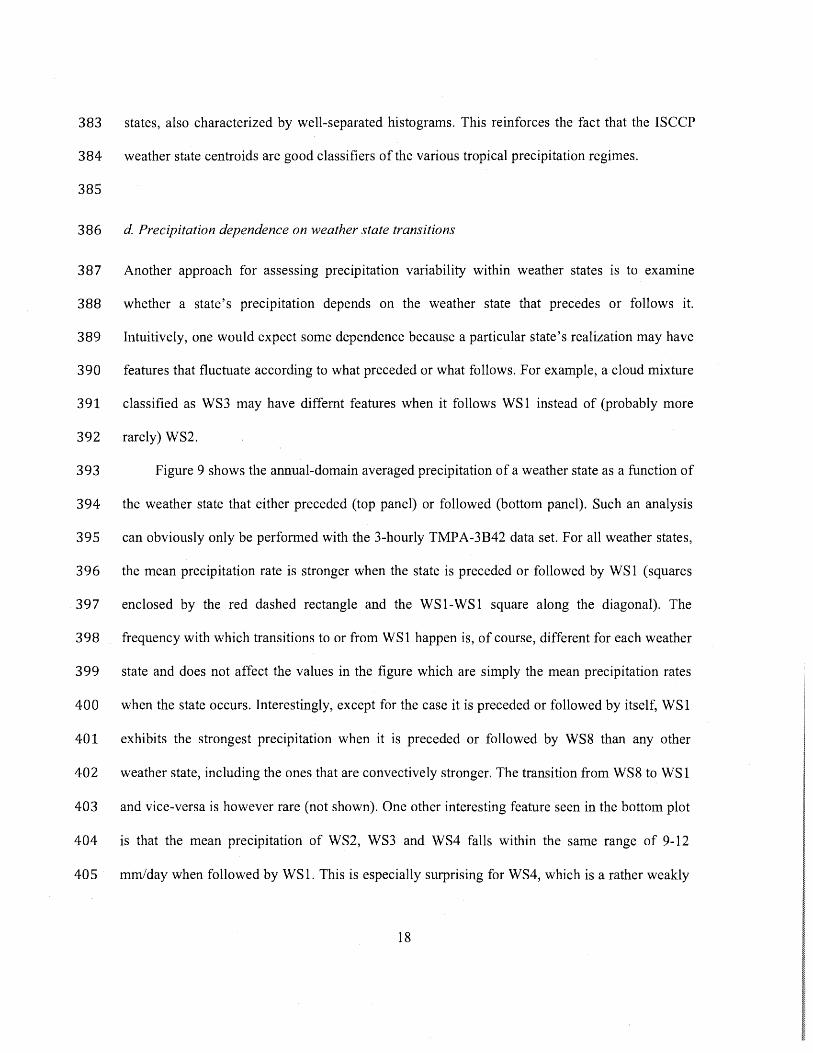
299 rarely persists during the daytime in the tropics. Overall, the fraction of grid cells with a single
300 weather state during daytime is about 13%, i.e., about 87% of data are discarded to produce the
301 lower two panels of Fig. 7.
302 Contrasting the upper two panels reveals that using the GPCP-1DD data and the constant
303 daytime precipitation assumption leads to a notably different, but not surprising, picture on the
304 precipitation intensity and relative importance of the three most convective states, compared to
305 TMPA-3B42. The precipitation rate of WS 1 falls from ~ 19 mmlday to ~ 14.5 mm/day and the
306 fractional contribution from 0.49 to 0.33. On the flip side, the mean precipitation rate and
307 fractional contribution of WS2 and WS3 increase: the ratio of WS2 and WS 1 fractional
308 contributions increases from 0.32 for TMPA-3B42 to 0.60 for GPCP-1DD, while the ratio of
309 WS3 to WS1 fractional contributions increases from 0.38 to 0.68. It appears therefore that when
310 WS2 or WS3 are observed in a grid cell on the same day as WS1, the constant daytime
311 precipitation assumption assigns to WS2 and WS3 day-averaged precipitation estimates inflated
312 by the occurrence of WS1 in the hours before or after (this is further examined later). One can of
313 course view this misassignment of precipitation also from the WS 1 perspective, with weaker
314 precipitation assigned to WS 1 in grid cells where convectively weaker states have also occurred
315 in the same day. Such misassignments seems to be also "benefiting" the convectively suppressed
14

316 states WS4 to WS8, making them appear somewhat stronger precipitation producers and
317 contributors according to GPCP-lDD compared to TMPA-3B42.
318 As pointed out earlier, one can attempt to bring the two precipitation data sets on a more
319 equal footing by including in the compositing only the grid cells with a single weather state
320 during daytime. The results from this analysis are shown in the lower two panels of Fig. 7. The
3 21 domain-averag~ annual precipitation rates and fractional contributions from the two satellite data
322 sets look in this case more similar when partitioned by ISCCP weather state. Some differences
323 remain, such as the different relative contribution strengths of WS2 and WS3 which are closer in
324 GPCP-lDD than TMPA-3B42, but the most important aspect of the analysis, WSI 's dominance,
325 has now been restored in GPCP-lDD to the same level as in TMPA-3B42.
326 The above analysis confirms the significant daytime variations in tropical precipitation
327 indicated by previous studies (e.g., Nesbitt and Zipser 2003). These variations can significantly
328 affect the outcome of compositing a daily-averaged product like GPCP-lDD.
329
330 c. Distributions a/precipitation within weather states
331 So far we have been examining only the mean annual precipitation of the ISCCP weather states
332 either on a domain-average or regional scale. With the aid of cumulative precipitation rate
333 histograms we will now look into the distribution of precipitation rates in order to gain better
334 understanding on the range and variability of a state's precipitation. Rossow et al. (2011) discuss
335 in detail other ways of constructing conditional precipitation histograms and their dependence on
336 spatial gridding.
337 Four sets of cumulative histograms are shown in Fig. 8, where each panel corresponds to
338 the same data set and compositing assumptions as in Fig. 7. The cumulative frequencies are
15

339 nonnalized relative to the number of each state's RFO. The first bin is considered non-
340 precipitating and includes all precipitation values below 0.048 mm/day, the lowest precipitating
341 value in the original spatial resolution TMPA-3B42 dataset.
342 Once again, the upper left panel, based on TMPA-3B42 corresponds to the best possible
343 temporal matching between weather state identification and precipitation. The first, perhaps
344 surprising, feature seen in this panel is that even for the strongest precipitating state, WS 1, about
345 half the time WS 1 is not precipitating according to TMPA-3B42. The frequent occurrence of
346 non-precipitating WS 1 cloud systems reminds us that the ISCCP weather states are only
347 statistical descriptions of cloud regimes that encompass a substantial variety of cloud mixtures.
348 These mixtures may include clouds with significantly higher and lower than WS 1 centroid
349 average cloud top pressures and optical depths respectively, that are still more closely related to
350 the WS 1 cluster centroid than any of the other centroids. A cursory analysis with one year of
351 ISCCP D 1 data indicated that the average cloud top pressure and cloud optical thickness of grid
352 cells containing WS1 was 317 hPa and 10.6 when TMPA-3B42 indicated no precipitation and
353 291 hPa and 13.5 when precipitation was detected. This finding suggests significant height and
354 extinction differences between non-precipitating and precipitating WS1 'so Variability among
355 tropical WS 1 has also been implied in the results shown in Fig. 6 of Oreopoulos and Rossow
356 (2011) showing very wide WSI shortwave and longwave cloud radiative effect histograms.
357 Finally, some zero precipitation WS 1 occurences may be due to space and time mis-matches:
358 TRMM obtains an instantaneous sample within a 3-hour period and so does ISCCP, but they do
359 not necessarily coincide within that time interval time, with separations high as 1-2 hours
360 possible. Likewise, because the ISCCP data is spatially salnpled at 30 km, and TRMM Inay not
16

361 be looking at the same pixels, different areas within the same grid cell may be captured by the
362 two datasets.
363 The fraction of non-precipitating WS 1 occurences drops dramatically when daily-averaged
364 precipitation values are used (the other three panels). This indicates that when WS 1 appears in a
365 grid cell at some point during daytime it is highly unlikely that no precipitation will be recorded
366 at some other time during the same day. Indeed, regardless of what data set or assumption is used
367 for compositing daily precipitation, there is never a higher than 10% chance that a grid cell
368 containing WSI will remain precipitation-free for the entire day.
369 The frequency of non-precipitating cloud mixtures increases rapidly as one progressively
370 moves to the most convectively suppressed weather states. For example, even for WS3, 86% of
371 occurences are not associated with any precipitation according to TMPA-3B42 (upper left
372 panel). These frequencies are again smaller when daily precipitation averages are composited:
373 the other three panels agree that only ~450/0 of grid cells containing WS3 at some point during
374 daytime will maintain zero precipitation throughout the day.
375 At the high end of the precipitation distribution we note from the upper left panel of Fig. 8
376 that while about 26% of WSI occurences are associated with rain rates above 24 mm/day, the
377 corresponding percentage drops to about 7% for WS2, 4% for WS3 and more rapidly therafter to
378 values below 0.5% for WS5 to WS8. This part of the histogram changes less by the details of
379 compositing (s result also found by Rossow et al. 2011). For example, the upper right panel
380 based on GPCP-lDD has counterpart values for WSl-WS3 of 23%, 7% and 30/0 indicating that
381 strong precipitation also tends to be persistent. The cumulative histograms of the last four
382 weather states form a group of histogram curves that is clearly distinct from the other weather
17
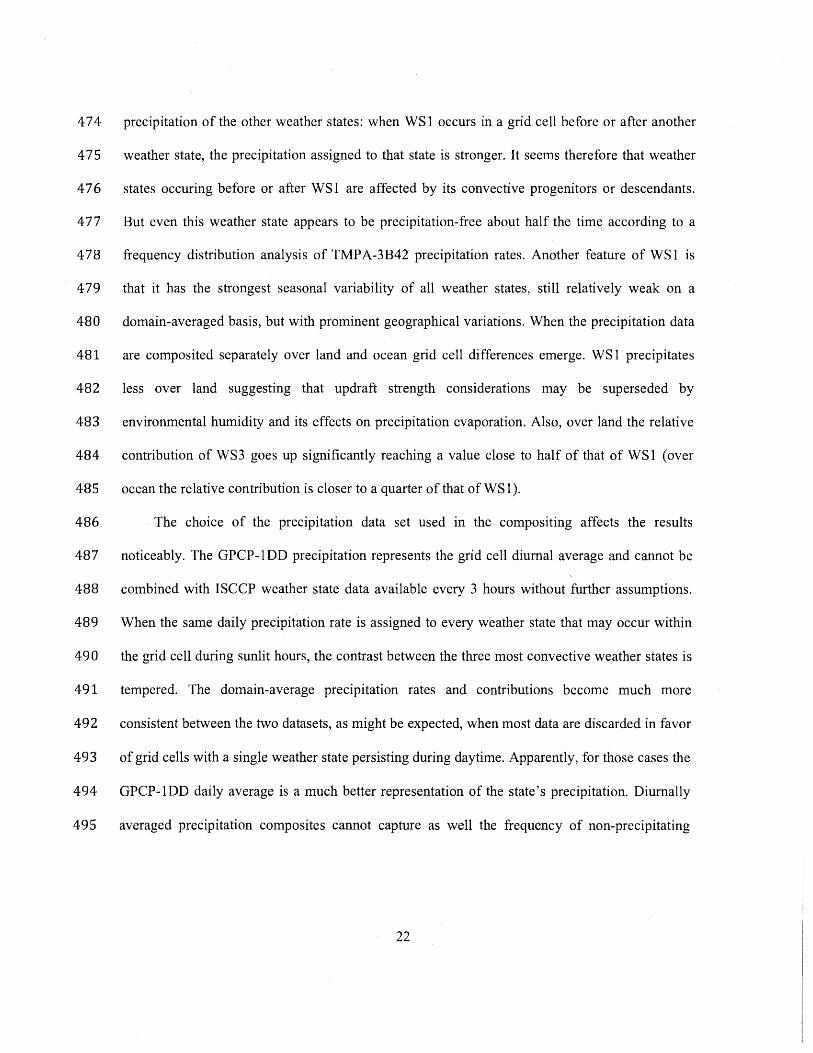
383 states, also characterized by well-separated histograms. This reinforces the fact that the ISCCP
384 weather state centroids are good classifiers of the various tropical precipitation regimes.
385
386 d. Precipitation dependence on weather state transitions
387 Another approach for assessing precipitation variability within weather states is to examme
388 whether a state's precipitation depends on the weather state that precedes or follows it.
389 Intuitively, one would expect some dependence because a particular state's realization may have
390 features that fluctuate according to what preceded or what follows. For example, a cloud mixture
391 classified as WS3 may have diffemt features when it follows WS 1 instead of (probably more
392 rarely) WS2.
393 Figure 9 shows the annual-domain averaged precipitation of a weather state as a function of
394 the weather state that either preceded (top panel) or followed (bottom panel). Such an analysis
395 can obviously only be performed with the 3-hourly TMPA-3B42 data set. For all weather states,
396 the mean precipitation rate is stronger when the state is preceded or followed by WS 1 (squares
397 enclosed by the red dashed rectangle and the WSI-WSI square along the diagonal). The
398 frequency with which transitions to or from WS 1 happen is, of course, different for each weather
399 state and does not affect the values in the figure which are simply the mean precipitation rates
400 when the state occurs. Interestingly, except for the case it is preceded or followed by itself, WSI
401 exhibits the strongest precipitation when it is preceded or followed by WS8 than any other
402 weather state, including the ones that are convectively stronger. The transition from WS8 to WS 1
403 and vice-versa is however rare (not shown). One other interesting feature seen in the bottOln plot
404 is that the mean precipitation of WS2, WS3 and WS4 falls within the same range of 9-12
405 mmlday when followed by WSI. This is especially surprising for WS4, which is a rather weakly
18

406 precipitating state when the analysis is not conditional on close temporal proximity of WS l. But
407 when WS 1 precedes, WS2 precipitates more that WS3 and WS4 (top plot). Because of their
408 lower values, the precipitation characteristics of other combinations of weather state transitions
409 (i.e., squares within the black dashed rectangle) do not merit further discussion here. We do,
410 however, show the geographical distribution of the sum of the precipitation values enclosed
411 within the black and red rectangles in the middle panel of Fig. 10. This is simply the map of the
412 mean precipitation rate originating from all weather states except WSI, i.e., WS2 to WS8. This
413 map should be contrasted with the counterpart maps in the top and bottom panels which shows
414 again mean precipitation rates originating from WS2 to WS8, but this time only considering the
415 cases where WS 1 either precedes (top panel) or follows (bottom panel), i.e., the same values
416 used for obtaining the means within the red dashed rectangle of Fig. 9. WS2 to WS8 are
417 precipitating stronger everywhere when they are in temporal proximity to WS 1, and more so
418 when they precede WS 1 rather than follow it. These transition results can be explained by the
419 changing weather states representing different parts of the same stonn system. The domain-
420 average precipitation rates for the three panels from top to bottom are 8.l6, l.56 and 10.71
421 mmJday.
422
423 e. Seasonal variations ofWSl
424 Our analysis so far has clearly demonstrated that WS 1 is by far the most important weather state
425 for tropical precipitation. This comes as no surprise, since it simply expresses the fact that deep
426 convection is a major contributor of tropical precipitation. In this subsection we perfonn
427 additional analysis of WS 1 precipitation characteristics, focusing on seasonal variations. The
428 seasonal variations of the other states' precipitation were also examined but are not shown
19

429 because both the precipitation rates and their relative seasonal variability are appreciably weaker.
430 From a domain-average perspective, even the WSI annual cycle of mean precipitation is not
431 particularly strong (Fig. 11), a result also found by Tselioudis and Rossow (2011). The
432 maximum value occurs in June, but is only ~6% higher than the annual mean; the minimum
433 value occurs in March, but is only ~4.50/0 below the annual mean. Seasonal variations in the
434 fractional contribution relative to the annual mean are even lower (2.50/0 above annual mean in
435 October and 2.70/0 below annual mean in June are the highest deviations). This is because months
436 with relatively high precipitation rates have also relative low RFOs and vice-versa.
437 Even though the seasonal variations of WS 1 domain-average precipitation are not strong,
438 geographical distributions vary significantly with season. The 10-year average seasonal daytime
439 precipitation totals (in imn) of WSI are shown in the top four panels of Fig. 12. There are
440 substantial zonal movements of WS 1 precipitation in accordance with movements of WS 1
441 occurences (shown in the bottom four panels of Fig. 12 as absolute counts). The band of deep
442 convection known as the ITCZ moves northward from DJF to JJA and this is reflected in the
443 northward displacement of WS 1 precipitation. WS 1 produces the lowest precipitation totals over
444 Africa and S. America in JJA and the highest precipitation totals over south Asia, including India
445 and the bay of Bengal. The eastern equatorial Pacific WS 1 precipitation is also stronger during
446 JJA. DJF marks the return of WS 1 precipitation south of the equator in Africa and S. America,
447 and is also characterized by high precipitation totals in the South Pacific Convergence Zone and
448 the western part of the maritime continent where WS 1 occurence peaks. Thus, while the WS 1
449 precipitation totals of the entire geographical zone do not change by much, the zonal and
450 meridional precipitation Inovements are quite prOlninent. Overall, the seasonality of tropical
20

451 precipitation geographical shifts seems to come primarily from WS 1, with other states not
452 exhibiting much geographical motion.
453
454 5. Summary and discussion
455 We provide a comprehensive picture of the relationship between ISCCP weather states (also
456 called cloud regimes by some authors) and precipitation for the entire tropics (35°S to 35°N),
457 thus significantly expanding the limited knowledge frOlTI prior studies which were more
458 geographically restricted. Our analysis relies on the concepts of conditional sampling/sorting and
459 composite averaging. By employing these concepts on two widely used merged (satellite and
460 surface) precipitation data sets, TMPA-3B42 and GPCP-IDD we gain insight on how the
461 tropical precipitation budget is partitioned among the various weather states identified by
462 analysis of ISCCP-retrieved cloud properties. We focus primarily on the TMPA-3B42
463 precipitation dataset because it has the same 3-hour temporal resolution as the ISCCP weather
464 states. Because weather states can only be identified during daytime when cloud optical
465 thickness from passive visible observations is available, our findings, based on 10 years of
466 measurements, only apply to daytime precipitation. GPCP-IDD precipitation compositing
467 applies by nature to diurnally-averaged precipitation.
468 We find that the mixture of high and optically thick clouds represented by weather state
469 with index "1" (WS 1) in the ISCCP data set and considered the most convectively active is
470 associated with almost half the tropical precipitation despite the fact that it occurs only about 6%
471 of the time. This is because its mean precipitation rate at the time of occurrence is about 19
472 mmlday, more than four times higher than the second most active state (WS2) which happens to
473 also have the second highest mean precipitation rate. The presence of WS 1 affects the apparent
21
474 precipitation of the other weather states: when WS 1 occurs in a grid cell before or after another
475 weather state, the precipitation assigned to that state is stronger. It seems therefore that weather
476 states occuring before or after WS 1 are affected by its convective progenitors or descendants.
477 But even this weather state appears to be precipitation-free about half the time according to a
478 frequency distribution analysis of TMP A-3B42 precipitation rates. Another feature of WS 1 is
479 that it has the strongest seasonal variability of all weather states, still relatively weak on a
480 domain-averaged basis, but with prominent geographical variations. When the precipitation data
481 are composited separately over land and ocean grid cell differences emerge. WS 1 precipitates
482 less over land suggesting that updraft strength considerations may be superseded by
483 environmental humidity and its effects on precipitation evaporation. Also, over land the relative
484 contribution of WS3 goes up significantly reaching a value close to half of that of WS 1 (over
485 ocean the relative contribution is closer to a quarter of that of WS 1).
486 The choice of the precipitation data set used in the compo siting affects the results
487 noticeably. The GPCP-l DD precipitation represents the grid cell diurnal average and cannot be
488 combined with ISCCP weather state data available every 3 hours without further assumptions.
489 When the same daily precipitation rate is assigned to every weather state that may occur within
490 the grid cell during sunlit hours, the contrast between the three most convective weather states is
491 tempered. The domain-average precipitation rates and contributions become much more
492 consistent between the two datasets, as might be expected, when most data are discarded in favor
493 of grid cells with a single weather state persisting during daytime. Apparently, for those cases the
494 GPCP-l DD daily average is a much better representation of the state's precipitation. Diurnally
495 averaged precipitation composites cannot capture as well the frequency of non-precipitating
22

496 WS 1 occurences, revealing that once WS 1 appears in a grid cell it very uncommon that the cell
497 will remain precipitation-free for the entire 24-hour period.
498 Since clouds are the most prominent regulators of radiation and precipitation, it is natural to
499 explore in future work the connections between precipitation, radiation, and the state of the
500 atmosphere as a function of cloud regime within the weather state framework. Some work along
501 these lines has already been performed to some extent (e.g., Gordon and Norris 2010;
502 Oreopoulos and Rossow 2011; this work), but the unifying effort that will fully integrate the
503 physical relationships between atmospheric dynamical and thermodynamical states and the
504 budgets of radiation and precipitation into a coherent picture has not yet materialized. Once such
505 an effort is completed, a better foundation on how to conjointly analyze cloud regimes and
506 associated meteorology with energy and water budgets will be available for climate models to
507 capitalize on. This can lead to significant leaps in the quality of model hydrology and energetics.
508
509 Acknowledgements
510 Lazaros Oreopoulos and Dongmin Lee acknowledge funding from NASA's Modeling Analysis
511 and Prediction program and the CloudSatlCALIPSO Science Team recompetition, both managed
512 by Dr. David Considine. William B. Rossow acknowledges funding from the NASA
513 MEASURES and NEWS programs. We would like to thank A. Del Genio for helpful
514 discussions.
515
23

515 References
516 Adler, R. F., and Coauthors, 2003: The Version-2 Global Precipitation Climatology Project
517 (GPCP) Monthly Precipitation Analysis (l979-present). J. Hydrometeor., 4, 1147-1167.
518 Geerts, B. and T. Dejene, 2005: Regional and Diurnal Variability of the Vertical Structure of
519 Precipitation Systems in Africa Based on Spacebome Radar Data. J. Climate, 18,893-916.
520 Gordon, N. D. and J. R. Norris, 2010: Cluster analysis of mid latitude oceanic cloud regimes:
521 mean properties and temperature sensitivity. Atmos. Chern. Phys., 10,6435-6459.
522 Greenwald, T. 1., Y."K. Lee, 1. A. Otkin, and T. L'Ecuyer, 2010): Evaluation of mid latitude
523 clouds in a large-scale high .. resolution simulation using CloudSat observations. J. Geophys. Res.,
524 115, D19203, doi:10.1029/2009JD013552.
525 Haynes,1. M., C. Jakob, W. B. Rossow, G. Tselioudis, and 1. Brown (2011), Major
526 characteristics of Southern Ocean cloud regimes and their effects on the energy budget, J.
527 Climate, in press.
528 Huffman, G. 1., R. F. Adler, M. Morrissey, D. T. BoIvin, S. Curtis, R. Joyce, B McGavock, 1.
529 Susskind, 2001: Global Precipitation at One-Degree Daily Resolution from Multi-Satellite
530 Observations. J. Hydrometeor., 2, 36-50.
531 Huffman, G. 1., R. F. Adler, D. T. BoIvin, E. 1. Nelkin, 2010: The TRMM Multi-satellite
532 Precipitation Analysis (TMPA). Chapter 1 in Satellite Applications/or Sur/ace Hydrology, F.
533 Hossain and M. Gebremichael, Eds. Springer Verlag, ISBN: 978-90-481-2914-0, 3-22.
534 Jakob, C., and C. Schumacher, 2008: Precipitation and latent heating characteristics of the major
535 Tropical Western Pacific cloud regimes. J. Climate, 21, 4348-4364.
24

536 Jakob, C., and G. Tselioudis, 2003: Objective identification of cloud regimes in the Tropical
537 Western Pacific. Geophys. Res. Lett., 30(21), 2082.
538 Jakob, C., G. Tselioudis, and T. Hume, 2005: The radiative, cloud, and thermodynamic
539 properties of the major tropical Western Pacific cloud regimes. J. Climate, 8, 1203-1215.
540 Mekonnen, A. and W.B. Rossow, 2011: The interaction between deep convection and easterly
541 waves over Tropical North Africa: A Weather State perspective. J. Climate, 24,4276-4294.
542 Nesbitt, S. W., and E. J. Zipser, 2003: TheOiurnal Cycle of Rainfall and Convective Intensity
543 according to Three Years ofTRMM Measurements. J. Climate, 16, 1456-1475.
544 Oreopoulos, L. and W. B. Rossow, 2011: The cloud radiative effects of International Satellite
545 Cloud Climatology Project weather states. J. Geophys. Res., 116, 012202,
546 doi:10.1029/2010J0015472.
547 Rossow, W. B. and R. A. Schiffer, 1999: Advances in understanding clouds from ISCCP. Bull.
548 Amer. Meteorol. Soc., 80, 2261-2288.
549 Rossow, W.B., G. Tselioudis, A. Polak, and C. Jakob, 2005: Tropical climate described as a
550 distribution of weather states indicated by distinct mesoscale cloud property mixtures. Geophys.
551 Res. Lett., 32, L21812.
552 Rossow, W. B., A. Mekonnen, C. Pearl, and W. Goncalves, 2011: Tropical precipitation
553 extremes. J. Climate, submitted.
554 Susskind, J., P. Piraino, L. Rokke, T. Iredell, and A. Mehta, 1997: Characteristics of the TOVS
555 Pathfinder Path A dataset. Bull. Amer. Meteor. Soc., 78, 1449-1472.
556 Schiffer, R.A., and W.B. Rossow, 1983: The International Satellite Cloud Climatology Project
557 (ISCCP): The first project of the World Climate Research Programme. Bull. Amer. Meteor. Soc.,
25

558 64, 779-784.
559 Tromeur, E. and W. B. Rossow, 2010: Interaction of Tropical Deep Convection with the Large-
560 Scale Circulation in the MJO. J. Climate, 23,1837-1853.
561 Tselioudis, G., and W. B. Rossow, 2011: Time scales of variability of the tropical atmosphere
562 derived from cloud-defined weather states. J. Climate, 24, 602-608.
563 Williams, K. D., and M. J. Webb, 2008: A quantitative performance assessment of cloud regimes
564 in climate models. Clim. Dyn., 33, 141-157.
565 Zhang, Y., S. Klein, G. G. Mace, and J. Boyle, 2007: Cluster analysis of tropical clouds using
566 CloudSat data. Geophys. Res. Lett., 34, L12813, doi:10.1029/2007GL029336.
567 Zhang, Y., S. A. Klein, 1. Boyl~, and G. G. Mace, 2010: Evaluation of tropical cloud and
568 precipitation statistics of Community Atmosphere Model version 3 using CloudSat and
569 CALIPSO data. J. Geophys. Res., 115, D12205, doi:lO.102912009JD012006.
570
26

570 Figure Captions
571 Figure 1. Cluster centroids for the 8 weather states of the extended tropics geographical zone
572 (35° S to 35° N) derived from ISCCP Dl data. Each plot shows the normalized frequency of
573 occurrence (in 0/0) within Pc- r bins.
574 Figure 2. The geographical distribution of the relative frequency of occurrence (RFO) of the 8
575 weather states of the extended tropics geographical zone for the period 1998-2007. Values are
576 normalized relative to the total number of weather state occurrences with valid TMPA-3B42
577 precipitation measurements within the geographical area for this period.
578 Figure 3. Geographical distribution of the 10-yr mean precipitation rate (mm/day) for each of
579 the 8 extended tropics weather states.
580 Figure 4. Geographical distribution of the fractional contribution to the total 10-yr grid cell
581 precipitation rate of each weather state.
582 Figure 5. Domain-average values of the mean precipitation rates and fractional contributions
583 shown in Figs. 3 and 4. Also included is the domain-average RFO of each weather state.
584 Figure 6. As in Fig. 5, but when TMPA-3B42 precipitation is aggregated separately over ocean
585 (left) and over land (right).
586 Figure 7. (upper left panel): As in Fig. 5; (upper right panel): as the upper left panel, but using
587 GPCP-l DD precipitation rates, assumed constant throughout the day; (lower left panel): as the
588 upper right panel, but using only those grid cells with the same weather state occurring during
589 daytime; (lower right panel): as the upper left panel, but with precipitation diurnally averaged for
590 those grid cells with the same weather state persisting during daytime.
27

591 Figure 8. Cumulative histograms of precipitation rate for each weather state for the precipitation
592 datasets and compositing assumptions used in Fig. 7.
593 Figure 9. Mean TMPA-3B42 precipitation rate of each each weather state (with "0" designating
594 cloud-free 2.5 0 cells, and grey squares indicating non-existent combinations) at time T as a
595 function of either the weather state 3 hours earlier, T-3h (top) or 3 hours later, T+3h (bottom).
596 The values within the dashed red rectangle of the upper (lower) panel come from the same
597 precipitation data used for the top (bottom) panel of Fig. 10. The black dashed rectangles contain
598 means from precipitation data used in the middle panel of Fig. 10.
599 Figure 10. (middle): Geographical distribution of mean total (combined) daytime precipitation
600 rate from TMP A-3B42 of weather states 2 to 8; (top): same as the middle panel, but when the
601 weather state occuring three hours earlier is WS 1; (bottom): same as the middle panel, but when
602 the weather state occuring three hours later is WS 1. The domain average values are 1.56, 8.16,
603 and 10.71 mmJday, respectively. These panels show the geographical distribution of the sum of
604 the means highlighted in the black and red dashed rectangles of Fig. 9, as explained in the
605 caption of that figure.
606 Figure 11. 10-yr mean annual cycle ofWSl TMPA-3B42 precipitation when present, fractional
607 contribution to domain precipitation, and RFO.
608 Figure 12. Geographical distribution of the yearly average seasonal precipitation total (in mm)
609 for WS 1 (top four panels) and the average number of WS 1 occurrences (bottom four panels).
610
28

610
611
612 Figure 1
613
":il 50
5180
e 310 ::J
~ 440 o aS60
g. S80 .... " 800 ::J
==,=d.g tOOO
thickness 0.4
0,2
• 0.1
29

30N 15N
EO 155 305 30N 15N
EO 155 305 30N 15N·
EQ 0.02
155 0.018 305 30N 0.016 15N
EQ 0.014
155 0.012
305 30N 0.01 15N
EO 0.008
155 305 0.006
30N 0.004
15N
EO 0.002 15S , 305 30N 15N
EO 15S
305 30N
15N
EO· 155
305
613
614 Figure 2
30

615
616 Figure 3
30N
15N
EO 15S
30S·
JON 15N
EO
2
180
31

30N t5N EQ
155· 305 30N 15N
EO 155
305 30N' t5N
EO, 0.9
i5S
305 0.8 30N 15N 0.7
EO 155 0.6
305. 0.5 30N'··,
15N 0.4 EO
155 0.3
305· 30N 0.2
15N
EO 155
30S 30N 15N
EQ
155
30S 30N
1SN
EQ
155
30S
617
618 Figure 4
32

619
620
621
622
623
....... c ~ 15 Q) L-
a. c Q)
...c 3: 10 c o ~ co ....... '5. .~ 5 L-
a. c co Q)
E o
624 Figure 5
625
• precipitation
II o contribution
WS1 WS3 WS4
0.6 TMPA-3842
0.5 ::u "'Tl 0
0.4 0 ..., -+0 ..., ID ("') ~
0.3 o· :::::J ID
("') 0
0.2 :::::J ~
::::!. 0" C ~
0.1 o· :::::J
WS5 WS6 WS7 WS8 0
33

625
0.6 ->. • precipitation TMPA·3842, ocean (Q 20 J2 E [I 0.5 .s 0 contribution ;0 ..... " c 0 ~ 15 0.4 0 Q)
., '- -a. .,
Q)
c Q)
U .t: 0.3 0' ~ 10
::::J
C ~
.Q (')
(0 0
0.2 :J -" ~
'0.. .,
'0 & c
~ 5 -0. 0.1
o· ::::J
C C\1 CD E
0 WS1 WS2 WS3 WS4 WS5 WS6 WS7 WS8 0
0.6
~ 20 TMPA .. 3B42, land
ro "0 0.5 -E ;0 E " 0 ..... c 15 0.4 0 Q) -, rn -Q) @ 10-
0. $l c 0.3 0' Q) :J .t: 10 :: !B.
(') c 0 0 0.2 ::I
:;:; -12 ., fr 'a
5 c
'(3 -~ 0.1
o· ::I
a. c ro en E 0 WS1 WS5 WS6 WS7 WS8 0
626
627 Figure 6
628
34

628
629
630
~ >. GPCP.1DD, constant e1)
~ ~ g :u g, ]j
." TI 0 'E 0 Q ~ Q
I 2? ~ 0-
C i n. '" 15 } :2. ~ ~ g § § '"' j ~ ! ~
:5 g- o &
() g <:: :!: 0-
g 0. :l
t: ~ I'\l Q $1 e !:
>: ';: ro
~ '"0
E ~
S :u g ;U ." g ."
C 0 0
~ ~ '" Q ~
~
~ a :-(i
c c: n
5' ~ ~ ~ c:
i: ::! ~ 10 9'!. 9!.
c 0 Q a Q 0 ~ § :l
~ Q. :;,
'0.,
~ r:r
2 g s-a
(5 :;, g
:::.
c ~
<II
E E
631
632 Figure 7
633
35

633
634
635
i)' c Q) ;:I 0' Q) .!: Q) >
'16 "3 E :::J 0
636
0.2
TMPA-3B42
0.8
~ ~.
0.6 .. --. ~
0.4
0.2
10 precipitation (mm/day)
/ /
--WS1 WS2
- -WS3 -----WS4
100 1000
GPCp·10D, single WS o ~----~------~------~------~----~ o 0.1 10 100 1000
precipitation (mm/day)
637 Figure 8
638
36
0.8 » 0 c (I) ::::I 0' 0.6 ~ G) > ~
0.4 :; E ::l 0
0,2
0.8 >. u c Il) ;:I 0' 0.6 .g ~ ~ 0.4 :; E :;) u
0.2
0 0
.-- ,.-...
0.1
0.1
/
/ /
,/
GPCP-100, constant precip
10
precipitation (mm/day)
100 1000
TMPA-3B42. single WS
10 100 1000
precipitation (mm/day)

8
7
6
......... CS en := ...r 4 c: Q.) L.. L.,.
:3 :::J U
2
o
8
7
6
Ss (/)
3: ..... 4 c Q) L.,. L.,.
3 ::J U
2
o
638
639 Figure 9
--------------------------------,
.3 4-
Next, WS (T +3hr)
37
I I I I I I I

640
641
642
643
30N 15N
EO 30
155 25
305 30N 15N
10 EO
155 7
305 5
30N· 3
15N 2
EO
155
305 644
645 Figure 10
646
38

646
647
648
649
~20.5 C'O
""C -E E ---c 20 0
:,j:j C'O
.:!::: e. 'u Q) 19.5 l-e. I-
0 C 0 19 :,j:j ::::l
..a ·c +-' C 0 u 18.5 C'O c 0
:,j:j u C'O
18 l-I+-
650
651 Figure 11
o precip (mm/day) 8-- __
-[;1. . '. . .
----B •.. RFO
. I
----~
. .
.'
- -$ - - contribution
o- ... t>... ,,0---. ... , ...
'0- - -.' ...
u c ..a I-
Q) C'O Q) C'O o -, u.. ~
C> e. +-' > ::::l Q) U 0 « C/) 0 Z
39
;0
0.65 b
0.6
0.55
X ..... o 0' ...., -., ...., OJ ncr ::::l OJ

652
653 Figure 12
301'4 151'4
EO 155 305 301'4 ~~---~::-
30N 15N
EQ
155 305 30N 15N
EO
155 305
180
150
120
90
60
30
70
60
50
40
30
20
10
40