Embed Size (px)
Citation preview
Frontogenetic Precipitation Bands and CSI Primer
Excerpts from Nicosia and Grumm (1998), Przybylinski (2000),Schumacher (2002), Banacos (2003), and Funk (2008)
Winter Weather WorkshopNational Weather Service Wakefield, VA
December 3, 2008
Outline• Define Frontogenesis and Frontolysis
• Examine Factors Contributing to Frontogenesis/Frontolysis
• Dynamic Response to Frontogenesis
• Frontogenetical Circulations and the Development of Mesoscale Precipitation Bands
• Diagnosing CSI, CI, and EPV
• Case Study: The Development of CSI Precipitation Bands in Southeast Virginia on 10/27/2008
Frontogenesis and Frontolysis Defined
• Frontogenesis refers to the change in the magnitude and orientation of the temperature gradient at a level or layer due to the directional and speed changes in the wind field.
• Frontogenesis increases the horizontal thermal gradient with time.
• Frontolysis – similar process as described above, except that frontolysis decreases the horizontal thermal gradient with time.
Factors Contributing to Frontogenesis/Frontolysis
There are three factors which can effect the horizontal thermal gradient resulting in frontogenesis or frontolysis.
• Deformation (Primary synoptic scale contributor)• Shear• Confluence (stretching)/Difluence (spreading)
• Tilting (differential vertical motion)
• Diabatic Heating
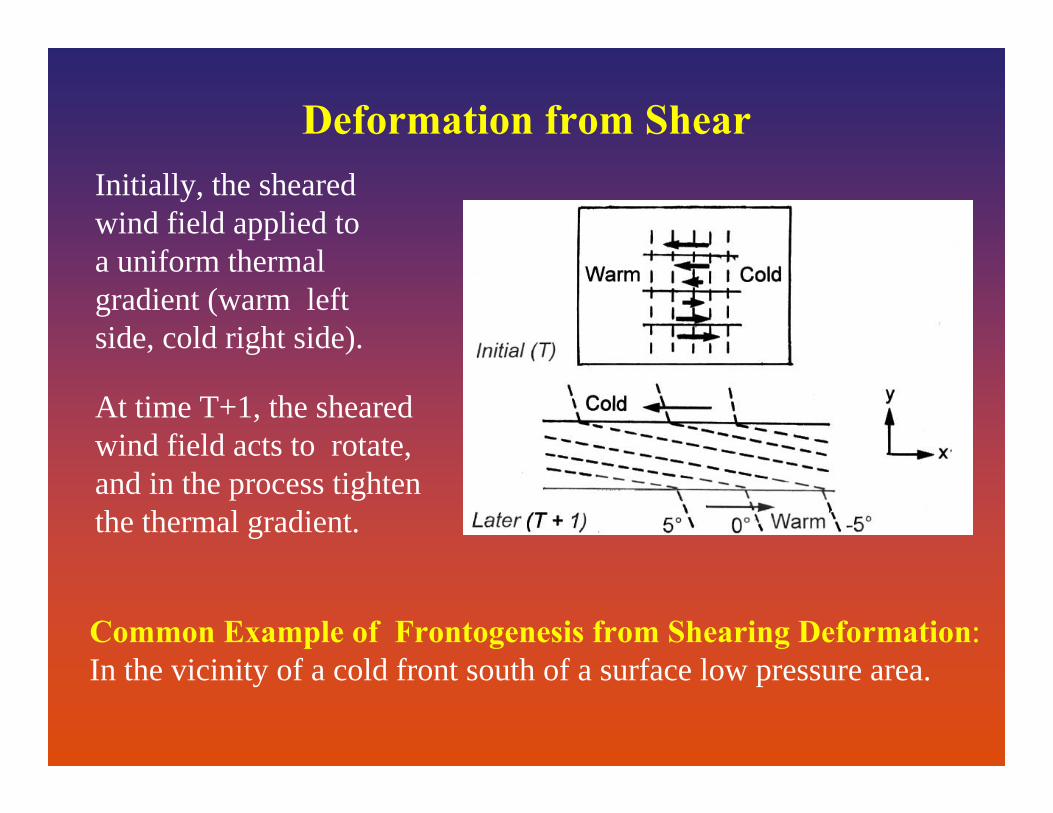
Deformation from ShearInitially, the shearedwind field applied toa uniform thermalgradient (warm leftside, cold right side).
Common Example of Frontogenesis from Shearing Deformation:In the vicinity of a cold front south of a surface low pressure area.
At time T+1, the shearedwind field acts to rotate,and in the process tightenthe thermal gradient.
Deformation from Confluence/Difluence
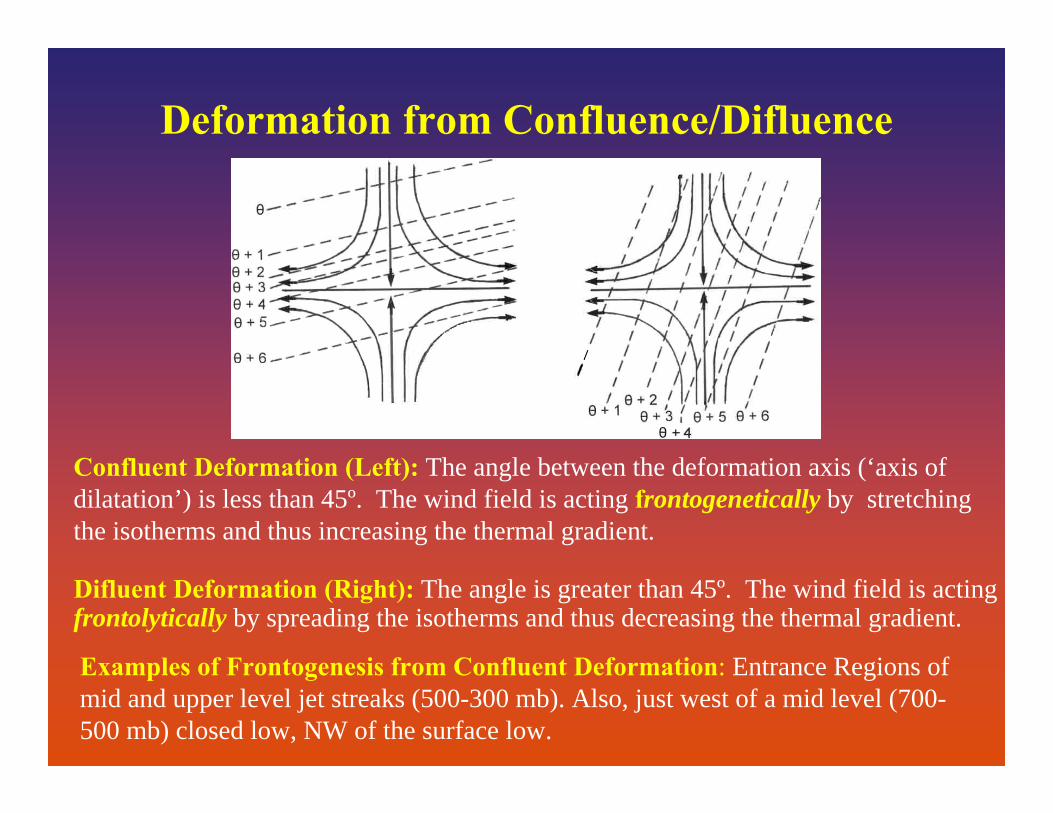
Examples of Frontogenesis from Confluent Deformation: Entrance Regions of mid and upper level jet streaks (500-300 mb). Also, just west of a mid level (700-500 mb) closed low, NW of the surface low.
Confluent Deformation (Left): The angle between the deformation axis (‘axis of dilatation’) is less than 45º. The wind field is acting frontogenetically by stretching the isotherms and thus increasing the thermal gradient.
Difluent Deformation (Right): The angle is greater than 45º. The wind field is acting frontolytically by spreading the isotherms and thus decreasing the thermal gradient.
Tilting (differential vertical motion)
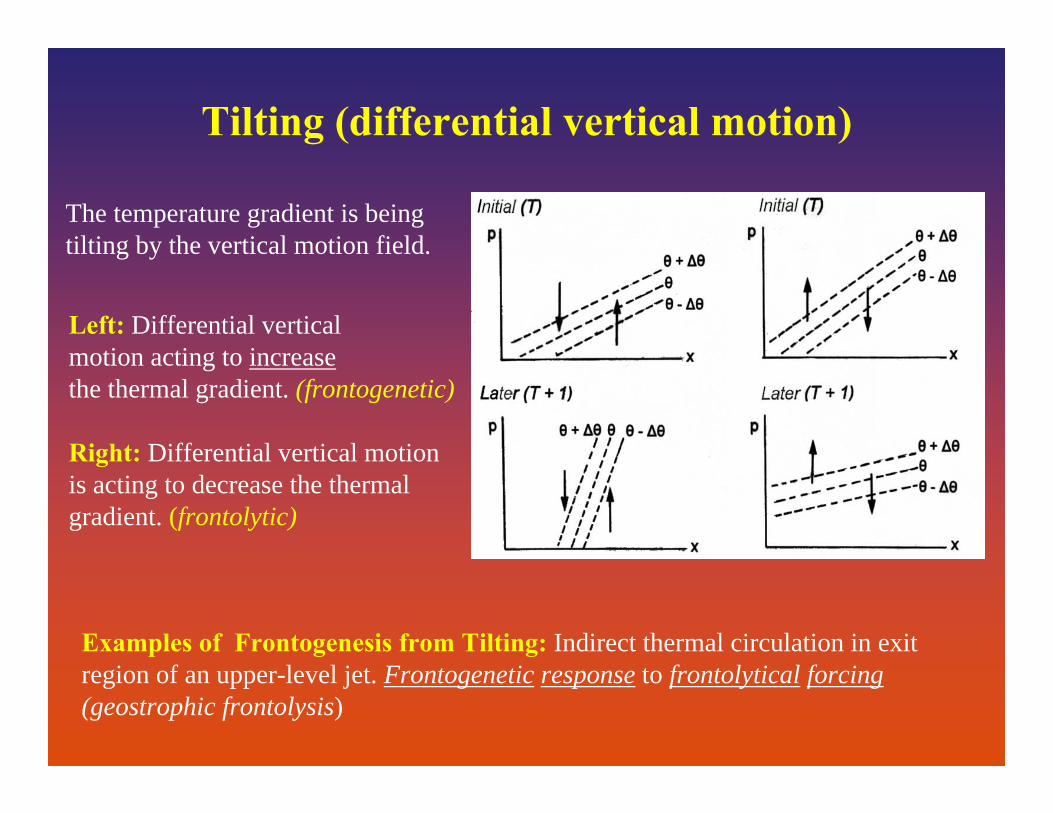
The temperature gradient is being tilting by the vertical motion field.
Left: Differential verticalmotion acting to increasethe thermal gradient. (frontogenetic)
Right: Differential vertical motion is acting to decrease the thermal gradient. (frontolytic)
Examples of Frontogenesis from Tilting: Indirect thermal circulation in exit region of an upper-level jet. Frontogenetic response to frontolytical forcing(geostrophic frontolysis)
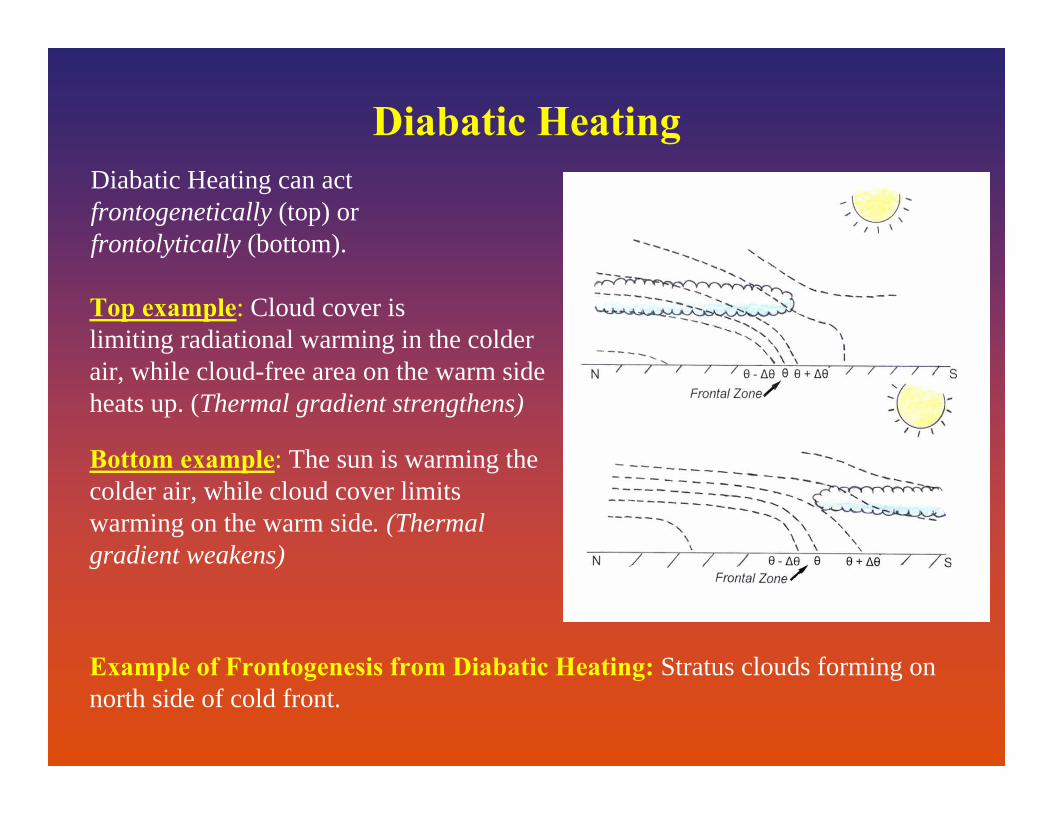
Diabatic HeatingDiabatic Heating can actfrontogenetically (top) or frontolytically (bottom).
Top example: Cloud cover islimiting radiational warming in the colder air, while cloud-free area on the warm side heats up. (Thermal gradient strengthens)
Bottom example: The sun is warming the colder air, while cloud cover limits warming on the warm side. (Thermal gradient weakens)
Example of Frontogenesis from Diabatic Heating: Stratus clouds forming on north side of cold front.
Dynamic Response to Frontogenesis
• An increase in the temperature gradient disrupts the thermal wind balance, since the horizontal temperature gradient becomes too large for the associated vertical wind shear.
• To restore thermal wind balance, the atmosphere produces a thermally-direct ageostrophic circulation traverse to the baroclinic zone.
• As a consequence of the ageostrophic circulation, upward vertical motion increases on the warm side of the low-mid level (1000-500 mb) frontogenetic zone.
• This thermodynamically-direct ageostrophic circulation attempts to weaken the horizontal baroclinicity, while at the same time increase the vertical wind shear, in an attempt to bring the atmosphere back in thermal wind balance.
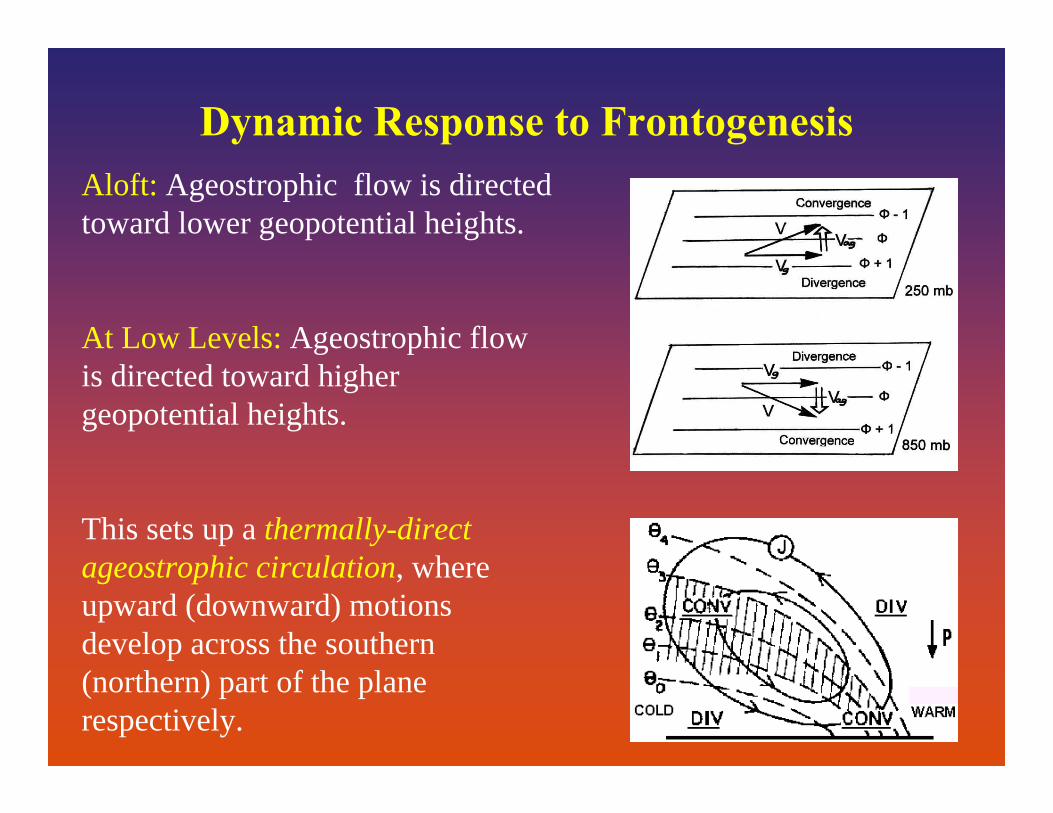
Dynamic Response to FrontogenesisAloft: Ageostrophic flow is directed toward lower geopotential heights.
At Low Levels: Ageostrophic flow is directed toward higher geopotential heights.
This sets up a thermally-direct ageostrophic circulation, where upward (downward) motions develop across the southern (northern) part of the plane respectively.
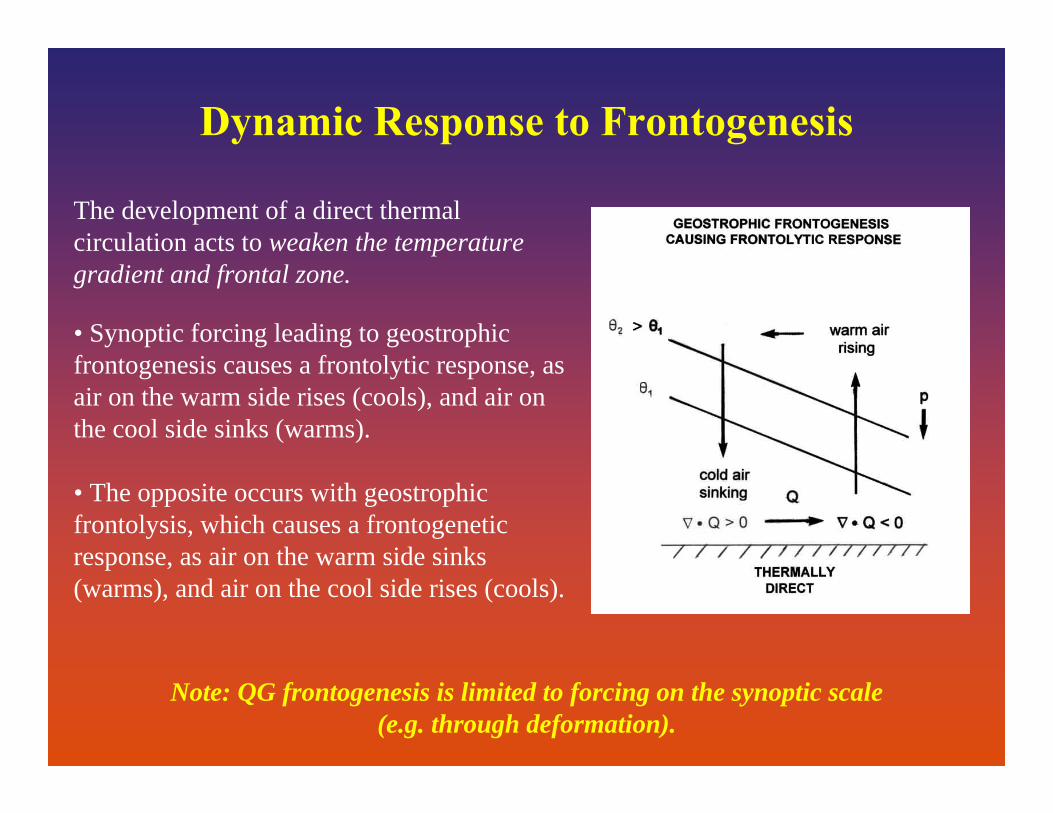
• Synoptic forcing leading to geostrophic frontogenesis causes a frontolytic response, as air on the warm side rises (cools), and air on the cool side sinks (warms).
• The opposite occurs with geostrophicfrontolysis, which causes a frontogeneticresponse, as air on the warm side sinks (warms), and air on the cool side rises (cools).
Note: QG frontogenesis is limited to forcing on the synoptic scale(e.g. through deformation).
Dynamic Response to Frontogenesis
The development of a direct thermal circulation acts to weaken the temperature gradient and frontal zone.
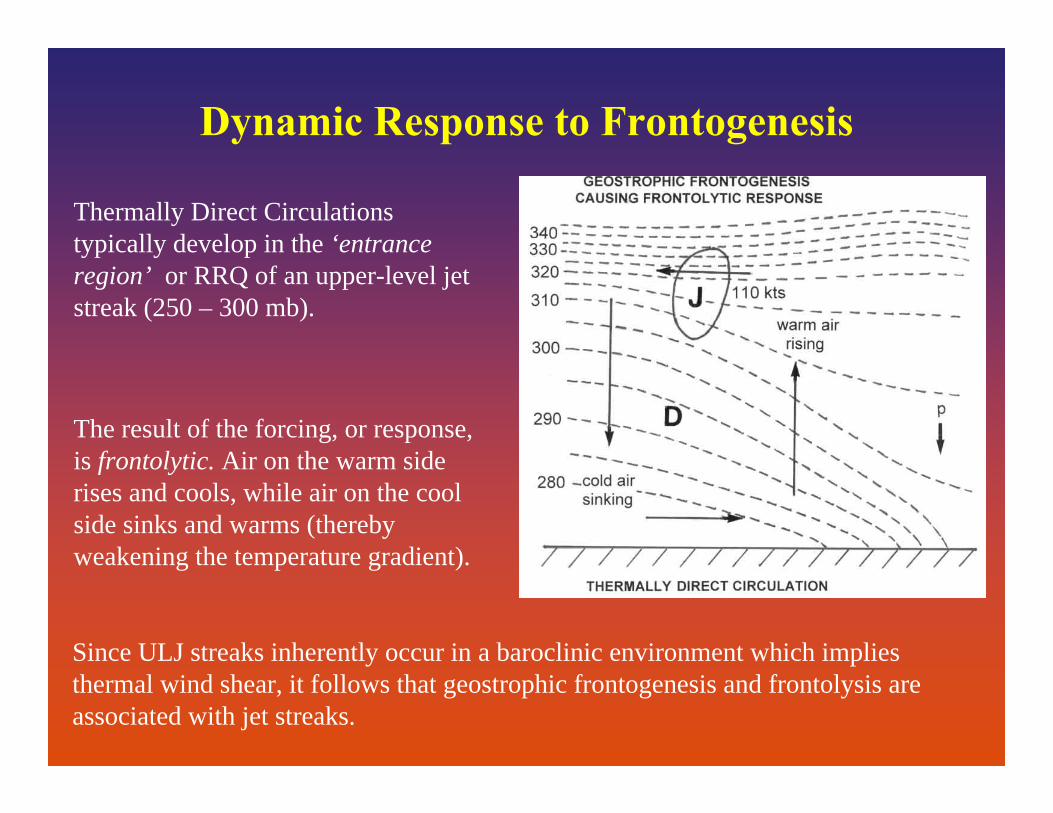
Thermally Direct Circulations typically develop in the ‘entrance region’ or RRQ of an upper-level jet streak (250 – 300 mb).
The result of the forcing, or response, is frontolytic. Air on the warm side rises and cools, while air on the cool side sinks and warms (thereby weakening the temperature gradient).
Since ULJ streaks inherently occur in a baroclinic environment which implies thermal wind shear, it follows that geostrophic frontogenesis and frontolysis are associated with jet streaks.
Dynamic Response to Frontogenesis
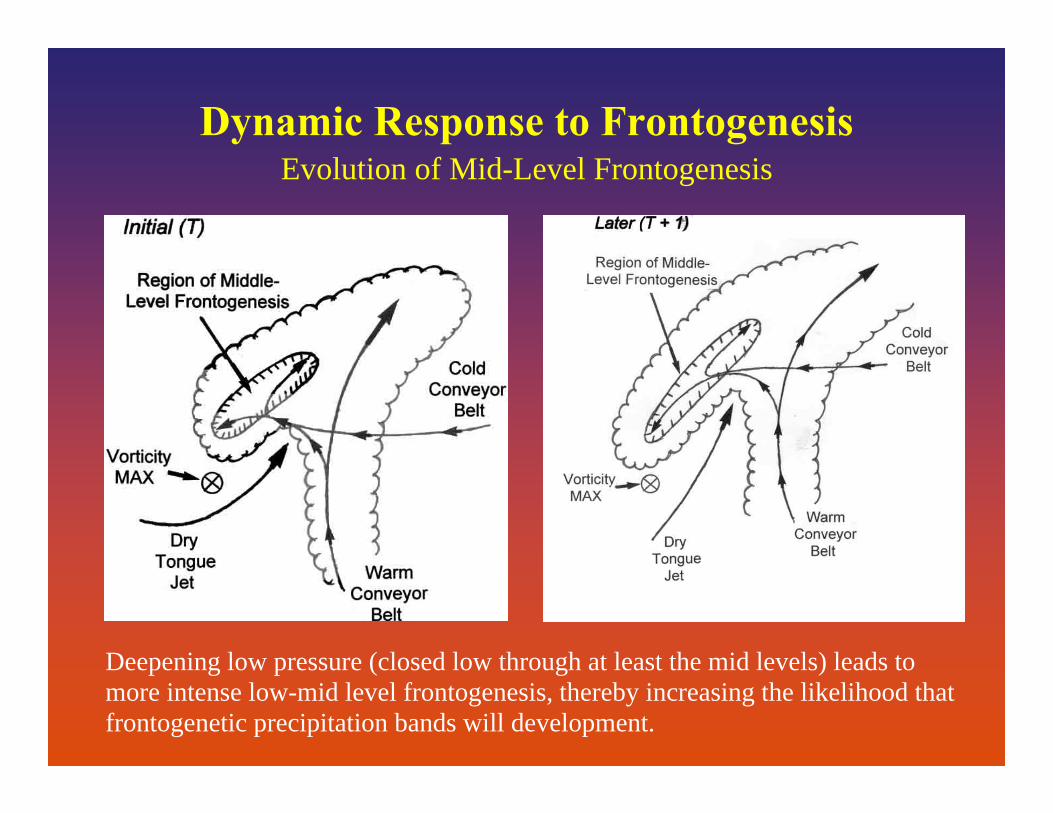
Evolution of Mid-Level Frontogenesis
Deepening low pressure (closed low through at least the mid levels) leads to more intense low-mid level frontogenesis, thereby increasing the likelihood that frontogenetic precipitation bands will development.
Dynamic Response to Frontogenesis
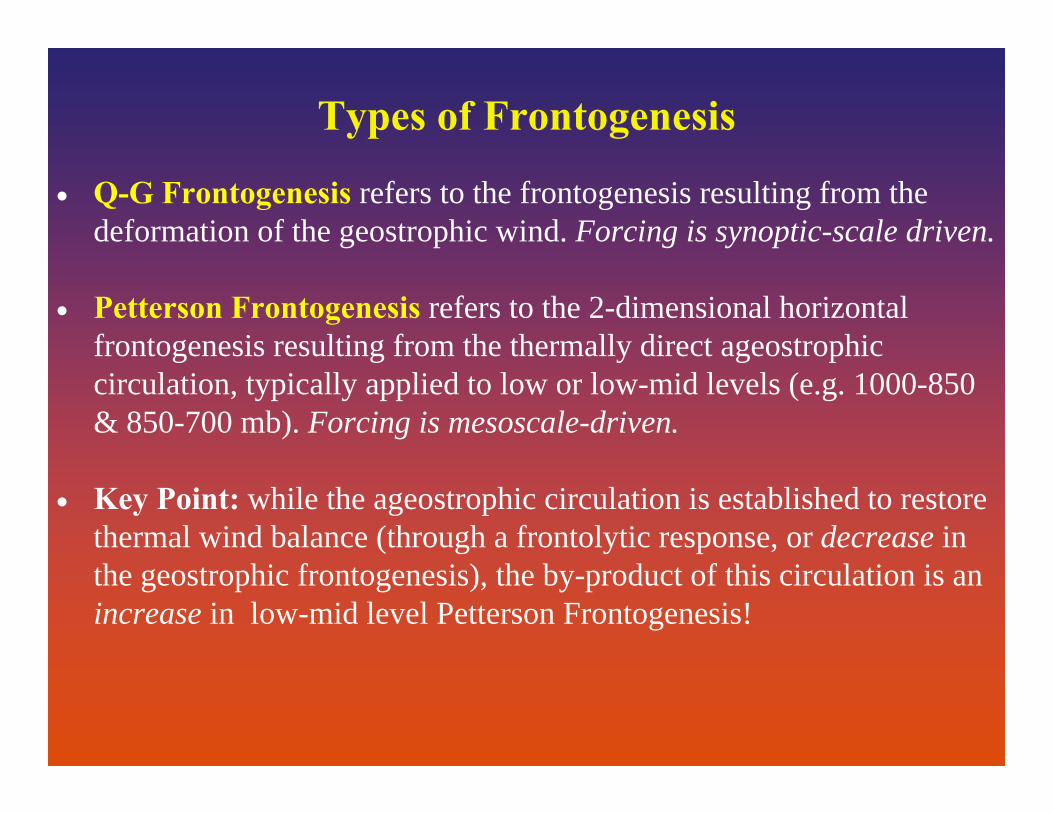
Types of Frontogenesis
• Q-G Frontogenesis refers to the frontogenesis resulting from the deformation of the geostrophic wind. Forcing is synoptic-scale driven.
• Petterson Frontogenesis refers to the 2-dimensional horizontal frontogenesis resulting from the thermally direct ageostrophic circulation, typically applied to low or low-mid levels (e.g. 1000-850 & 850-700 mb). Forcing is mesoscale-driven.
• Key Point: while the ageostrophic circulation is established to restore thermal wind balance (through a frontolytic response, or decrease in the geostrophic frontogenesis), the by-product of this circulation is an increase in low-mid level Petterson Frontogenesis!
• Frontogenetical circulations typically result in one band of precipitation which is parallel to the frontal zone.
• The strength of the circulation can be affected by the ambient static stability.
• Numerous studies have shown that a weakly stable environment in the presence of frontogenesis lead to one band of heavy precipitation.
• However, the same studies have also shown that a greater instability resulted in multiple (narrow) convective bands of precipitation (also parallel to the frontal zone).
Frontogenetical Circulations and the Development of Mesoscale Precipitation Bands
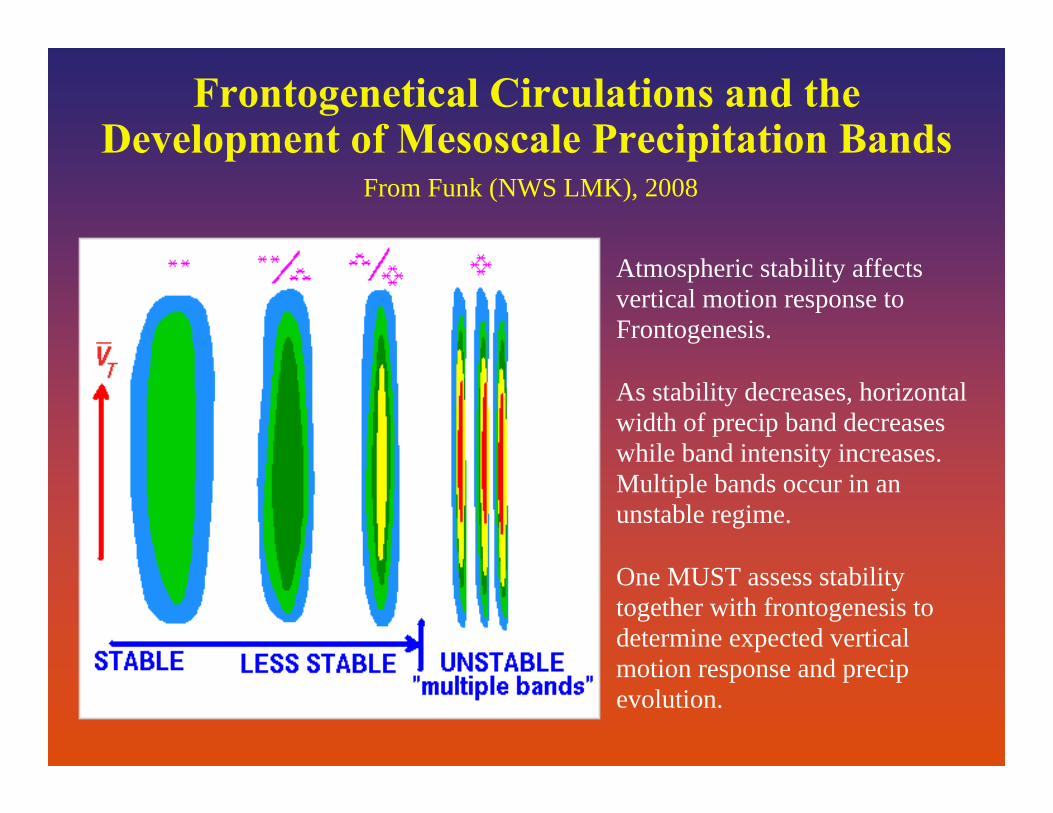
Atmospheric stability affects vertical motion response to Frontogenesis.
As stability decreases, horizontal width of precip band decreases while band intensity increases. Multiple bands occur in an unstable regime.
One MUST assess stability together with frontogenesis to determine expected vertical motion response and precipevolution.
From Funk (NWS LMK), 2008
Frontogenetical Circulations and the Development of Mesoscale Precipitation Bands
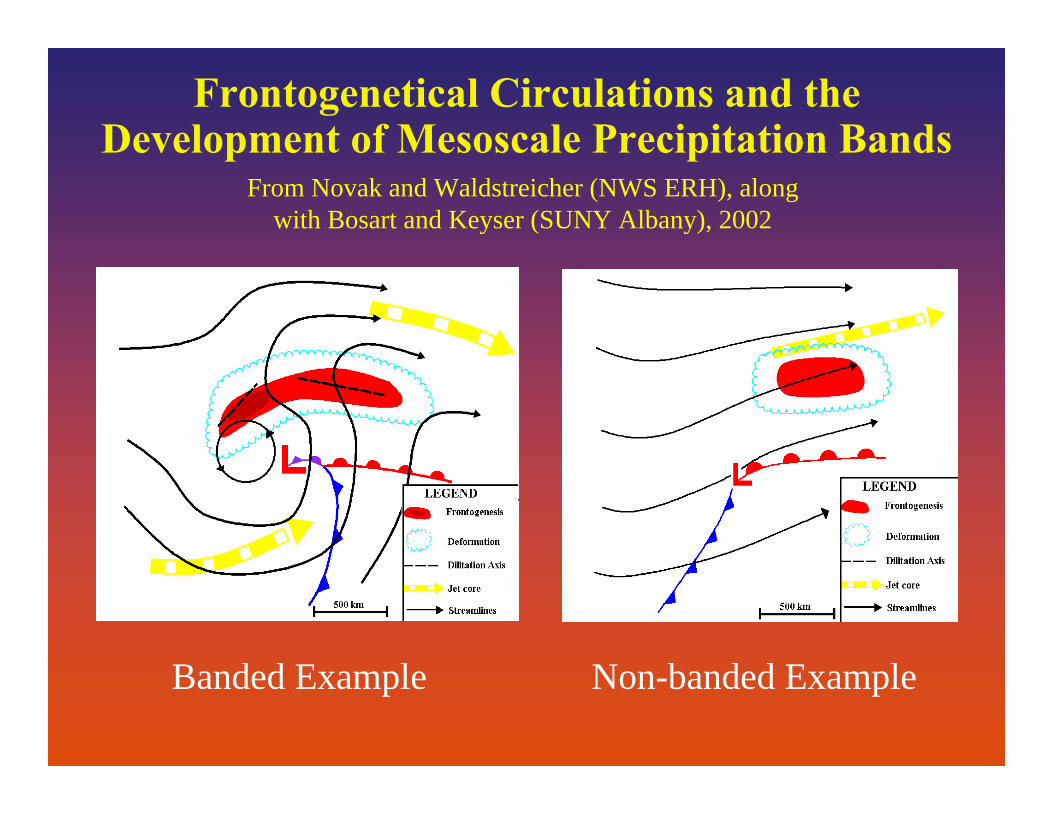
Banded Example Non-banded Example
From Novak and Waldstreicher (NWS ERH), along with Bosart and Keyser (SUNY Albany), 2002
Frontogenetical Circulations and the Development of Mesoscale Precipitation Bands
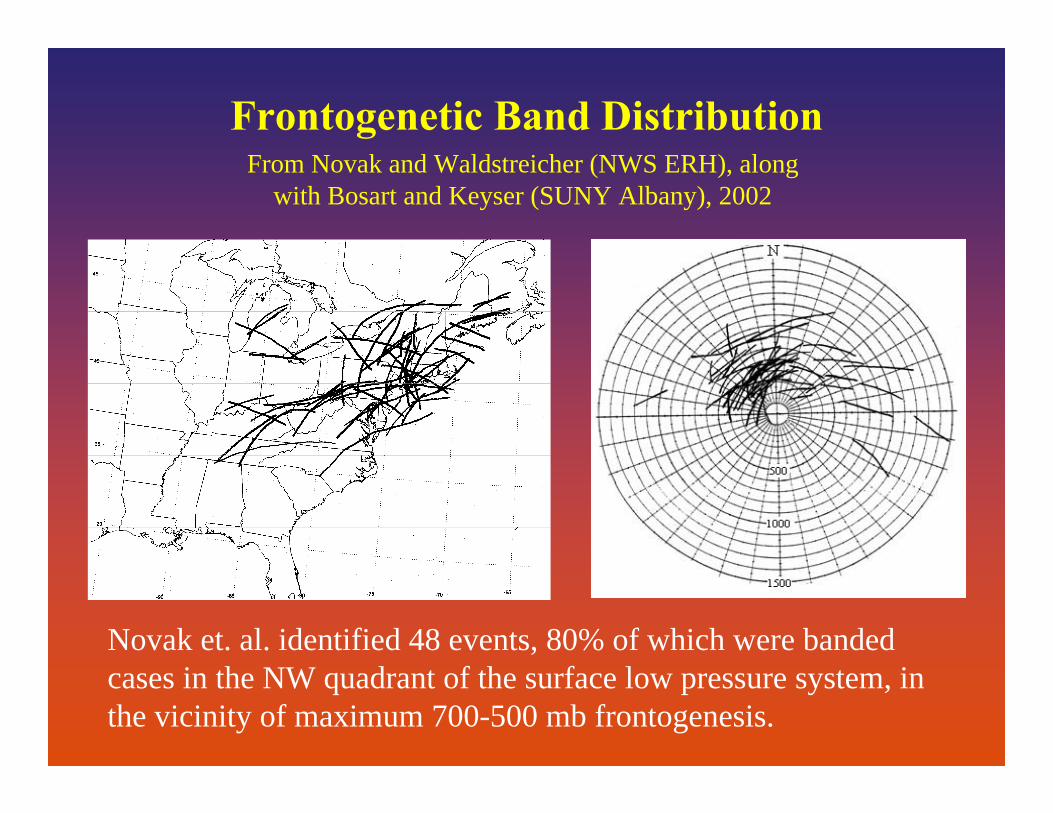
Frontogenetic Band DistributionFrom Novak and Waldstreicher (NWS ERH), along
with Bosart and Keyser (SUNY Albany), 2002
Novak et. al. identified 48 events, 80% of which were banded cases in the NW quadrant of the surface low pressure system, in the vicinity of maximum 700-500 mb frontogenesis.
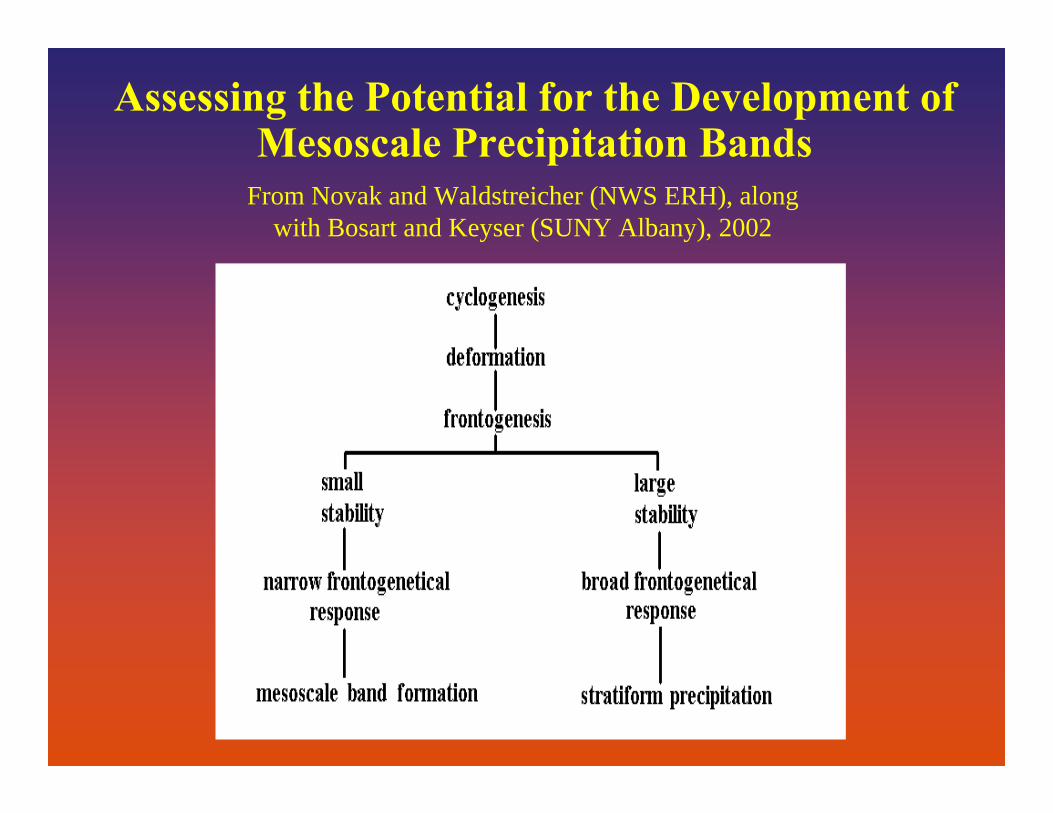
Assessing the Potential for the Development of Mesoscale Precipitation Bands
From Novak and Waldstreicher (NWS ERH), along with Bosart and Keyser (SUNY Albany), 2002
Dynamic Consequences of Intense Frontogenesis(Introduce EPV, CSI, CI)
• When the vertical wind shear and associated horizontal temperature gradient are large (i.e. strong horizontal frontogenesis), the change in momentum with respect to height (decreasing pressure) will be greater, with the momentum surfaces attaining a more shallow slope in the x-p plane.
• When this happens, there is a better chance that theta-e will slope more steeply than the momentum surfaces, which is a necessary condition for Conditional Symmetric Instability (CSI).
• By definition, the greater the vertical wind shear, the more reduced the Equivalent Potential Vorticity (EPV) becomes.
Dynamic Consequences of Intense Frontogenesis(Introduce EPV, CSI, CI)
• The closer EPV is to zero, the more responsive the atmosphere will be to a given amount of forcing.
• When EPV becomes negative, CSI (potential for slantwise convection), and/or CI (potential for upright convection) is present.
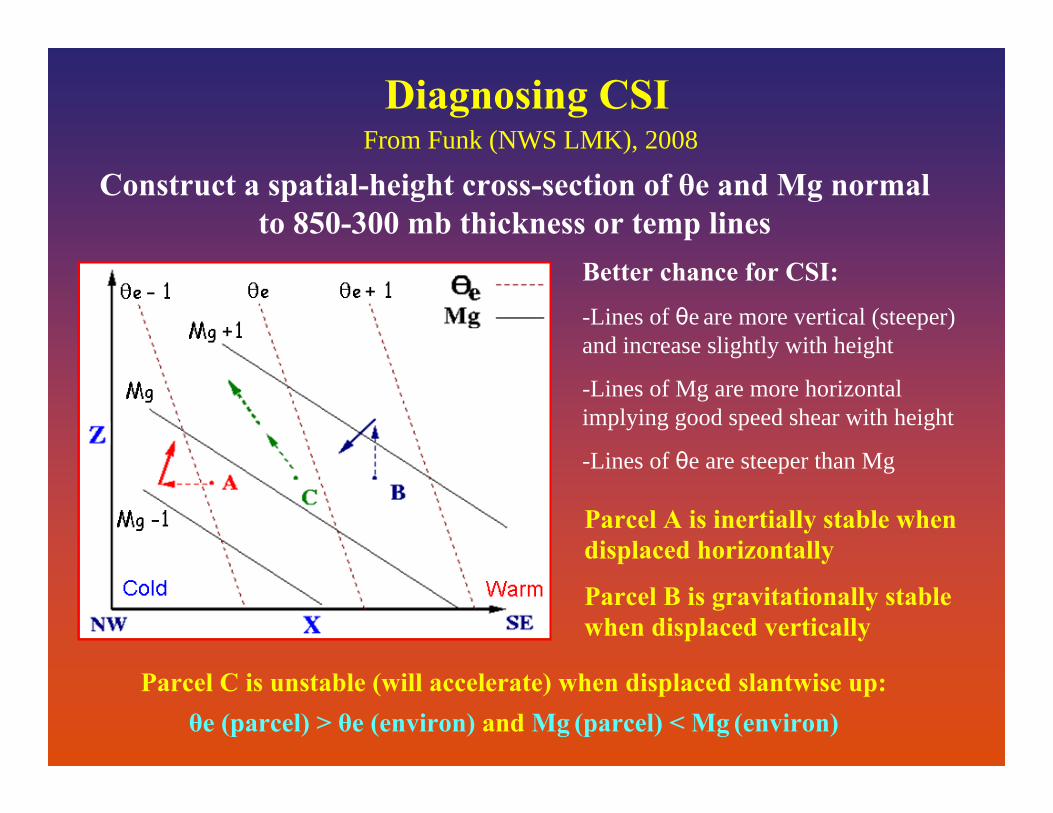
Diagnosing CSI
Better chance for CSI:
-Lines of θe are more vertical (steeper) and increase slightly with height
-Lines of Mg are more horizontal implying good speed shear with height
-Lines of θe are steeper than Mg
Construct a spatial-height cross-section of θe and Mg normal to 850-300 mb thickness or temp lines
Parcel C is unstable (will accelerate) when displaced slantwise up:θe (parcel) > θe (environ) and Mg (parcel) < Mg (environ)
Parcel A is inertially stable when displaced horizontally
Parcel B is gravitationally stable when displaced vertically
From Funk (NWS LMK), 2008
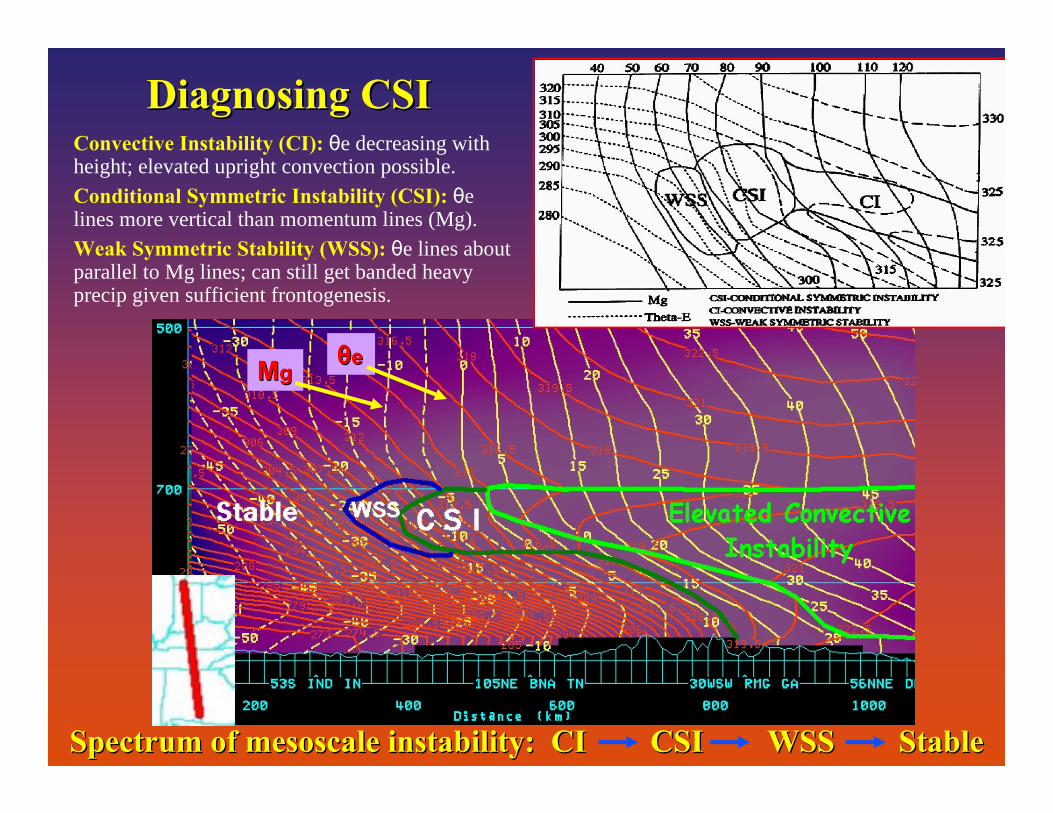
Spectrum of Spectrum of mesoscalemesoscale instability: CI CSI WSS Stableinstability: CI CSI WSS Stable
MMggθθee
Convective Instability (CI): θe decreasing with height; elevated upright convection possible.Conditional Symmetric Instability (CSI): θe lines more vertical than momentum lines (Mg).Weak Symmetric Stability (WSS): θe lines about parallel to Mg lines; can still get banded heavy precip given sufficient frontogenesis.
Diagnosing CSIDiagnosing CSI
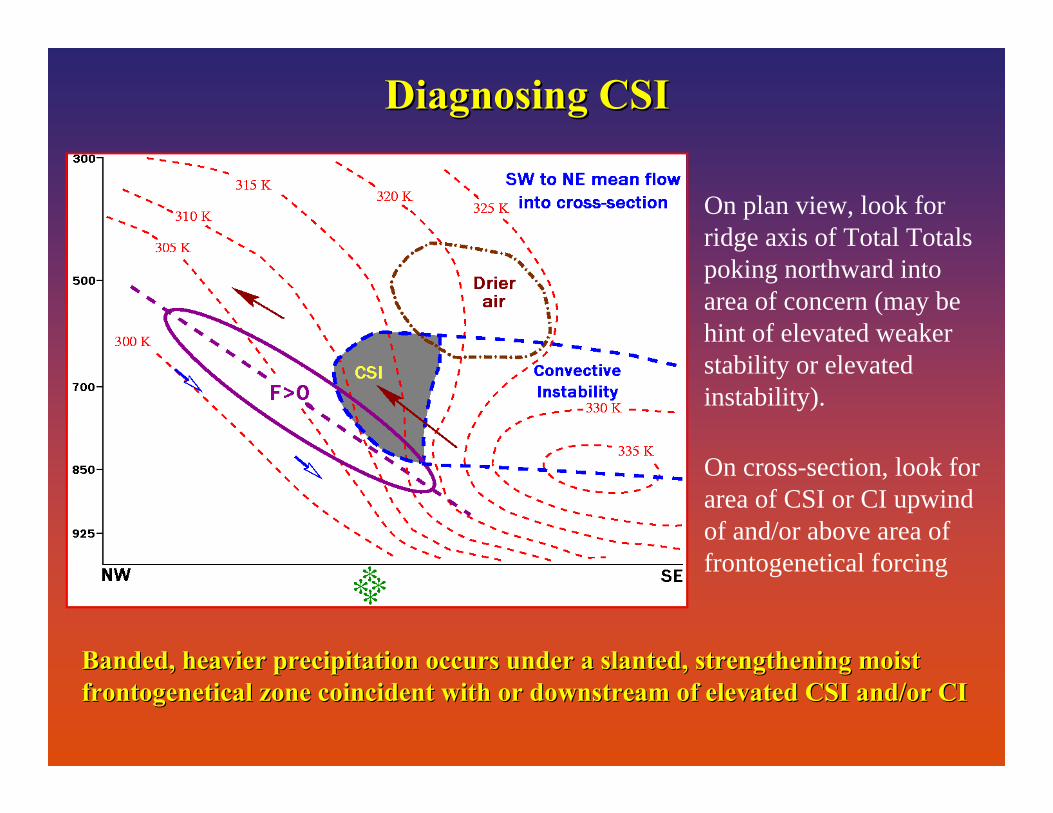
Banded, heavier precipitation occurs under a slanted, strengthenBanded, heavier precipitation occurs under a slanted, strengthening moist ing moist frontogeneticalfrontogenetical zone coincident with or downstream of elevated CSI and/or CIzone coincident with or downstream of elevated CSI and/or CI
06z 23Dec
On plan view, look for ridge axis of Total Totals poking northward into area of concern (may be hint of elevated weaker stability or elevated instability).
On cross-section, look for area of CSI or CI upwind of and/or above area of frontogenetical forcing
Diagnosing CSIDiagnosing CSI
Diagnosing CSIDiagnosing CSI
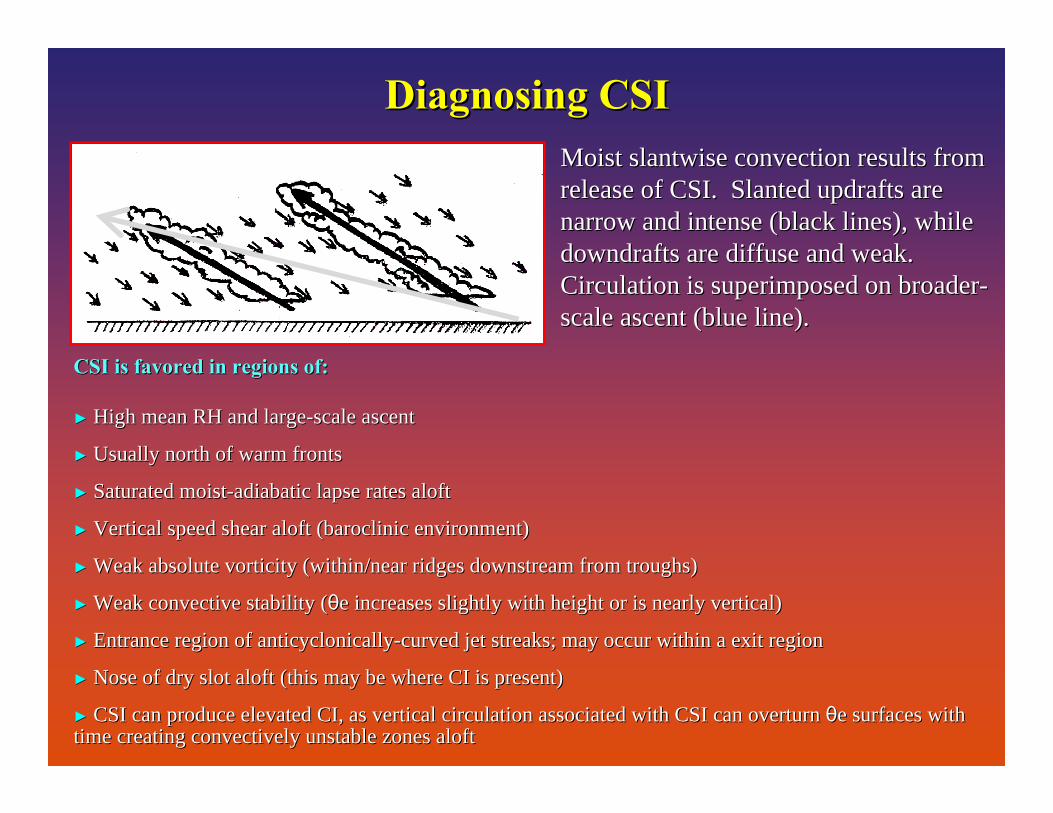
CSI is favored in regions of:CSI is favored in regions of:
►► High mean RH and largeHigh mean RH and large--scale ascentscale ascent
►► Usually north of warm frontsUsually north of warm fronts
►► Saturated moistSaturated moist--adiabatic lapse rates aloftadiabatic lapse rates aloft
►► Vertical speed shear aloft (Vertical speed shear aloft (baroclinicbaroclinic environment)environment)
►► Weak absolute Weak absolute vorticityvorticity (within/near ridges downstream from troughs) (within/near ridges downstream from troughs)
►► Weak convective stability (Weak convective stability (θθe e increases slightly with height or is nearly vertical)increases slightly with height or is nearly vertical)
►► Entrance region of Entrance region of anticyclonicallyanticyclonically--curved jet streaks; may occur within a exit regioncurved jet streaks; may occur within a exit region
►► Nose of dry slot aloft (this may be where CI is present)Nose of dry slot aloft (this may be where CI is present)
►► CSI can produce elevated CI, as vertical circulation associatedCSI can produce elevated CI, as vertical circulation associated with CSI can overturn with CSI can overturn θθe surfaces with e surfaces with time creating convectively unstable zones alofttime creating convectively unstable zones aloft
Moist slantwise convection results from Moist slantwise convection results from release of CSI. Slanted updrafts are release of CSI. Slanted updrafts are narrow and intense (black lines), while narrow and intense (black lines), while downdrafts are diffuse and weak. downdrafts are diffuse and weak. Circulation is superimposed on broaderCirculation is superimposed on broader--scale ascent (blue line).scale ascent (blue line).
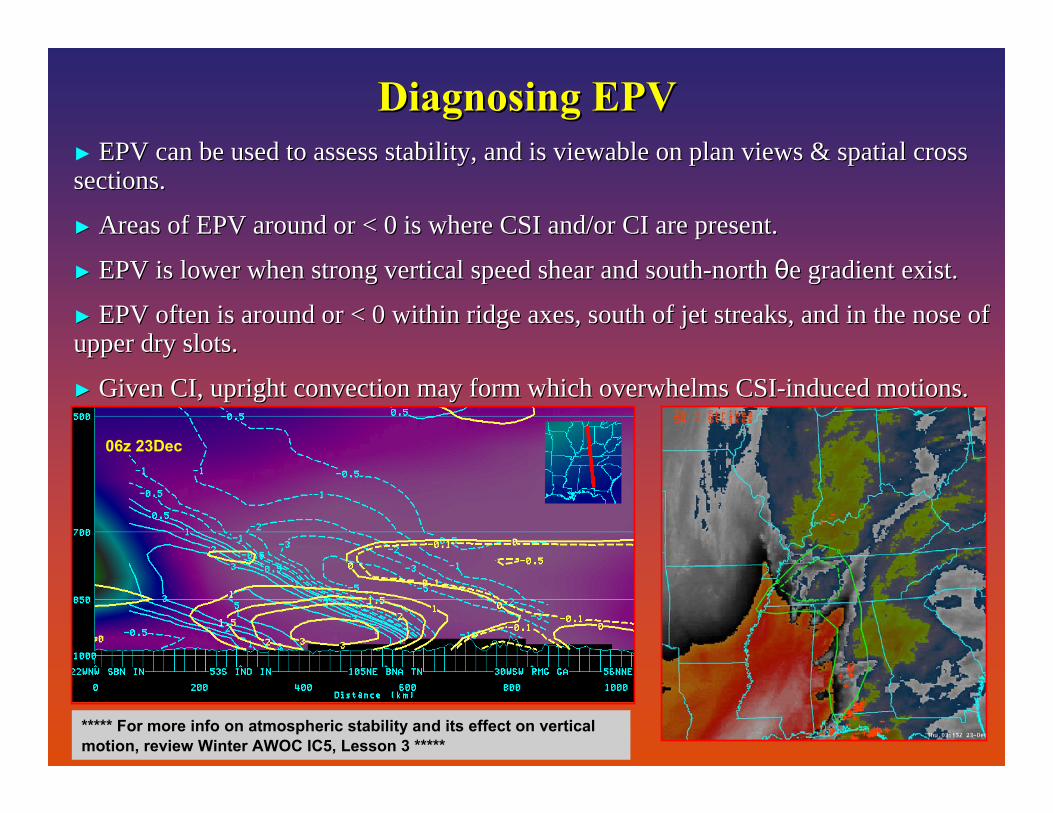
Diagnosing EPVDiagnosing EPV► EPV can be used to assess stability, and is viewable on plan vieEPV can be used to assess stability, and is viewable on plan views & spatial cross ws & spatial cross sections.sections.
►► Areas of EPV around or < 0 is where CSI and/or CI are present.Areas of EPV around or < 0 is where CSI and/or CI are present.
►► EPV is lower when strong vertical speed shear and southEPV is lower when strong vertical speed shear and south--north north θθe e gradient exist.gradient exist.
►► EPV often is around or < 0 within ridge axes, south of jet streEPV often is around or < 0 within ridge axes, south of jet streaks, and in the nose of aks, and in the nose of upper dry slots.upper dry slots.
►► Given CI,Given CI, upright convection may form which overwhelms CSIupright convection may form which overwhelms CSI--induced motions.induced motions.
06z 23Dec
***** For more info on atmospheric stability and its effect on vertical motion, review Winter AWOC IC5, Lesson 3 *****
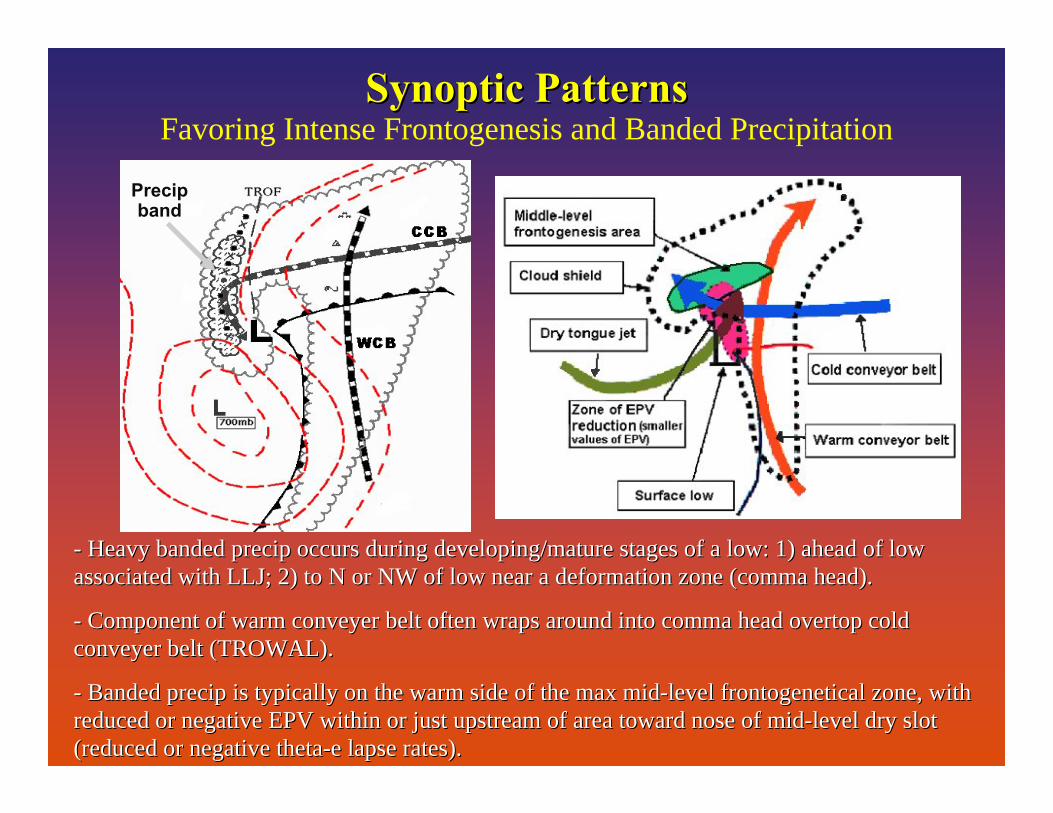
Precipband
-- Heavy banded Heavy banded precipprecip occurs during developing/mature stages of a low: 1) ahead of looccurs during developing/mature stages of a low: 1) ahead of low w associated with LLJ; 2) to N or NW of low near a deformation zonassociated with LLJ; 2) to N or NW of low near a deformation zone (comma head).e (comma head).
-- Component of warm conveyer belt often wraps around into comma hComponent of warm conveyer belt often wraps around into comma head overtop cold ead overtop cold conveyer belt (TROWAL).conveyer belt (TROWAL).
-- Banded Banded precipprecip is typically on the warm side of the max midis typically on the warm side of the max mid--level level frontogeneticalfrontogenetical zone, with zone, with reduced or negative EPV within or just upstream of area toward nreduced or negative EPV within or just upstream of area toward nose of midose of mid--level dry slot level dry slot (reduced or negative theta(reduced or negative theta--e lapse rates).e lapse rates).
Synoptic PatternsSynoptic PatternsFavoring Intense Frontogenesis and Banded Precipitation
• As Theta-e decreases with height, EPV then becomes more negative.
• Therefore, negative EPV values will be largest when 1) the vertical wind shear and associated horizontal temperature gradient are large and when 2) theta-e decreases with height or decreasing pressure.
⇒ When both of these processes are occurring, upright convection will dominate over slantwise convection given sufficient lift and saturation.
When will CI Dominate over CSI ?
Summary of Slantwise vs. Upright Convection
• Slantwise convection (CSI) will dominate when the horizontal baroclinicity (vertical wind shear) is strong (leading to negative EPV) yet when theta-e is either constant or slightly increasing with height (i.e. when the column is saturated through mid levels).
• Upright convection (CI) will dominate when the horizontal baroclinicity (vertical wind shear) is strong, and when theta-e decreases with height (i.e. when dry advection occurs at mid levels, leading to a “more negative” EPV).
• In general, mesoscale convective precipitation bands will take muchlonger to develop under slantwise convection compared to upright convection.
Mesoscale Precipitation Bands
Case Study:The Development of CSI Precipitation
Bands in Southeast Virginia on 10/27/2008
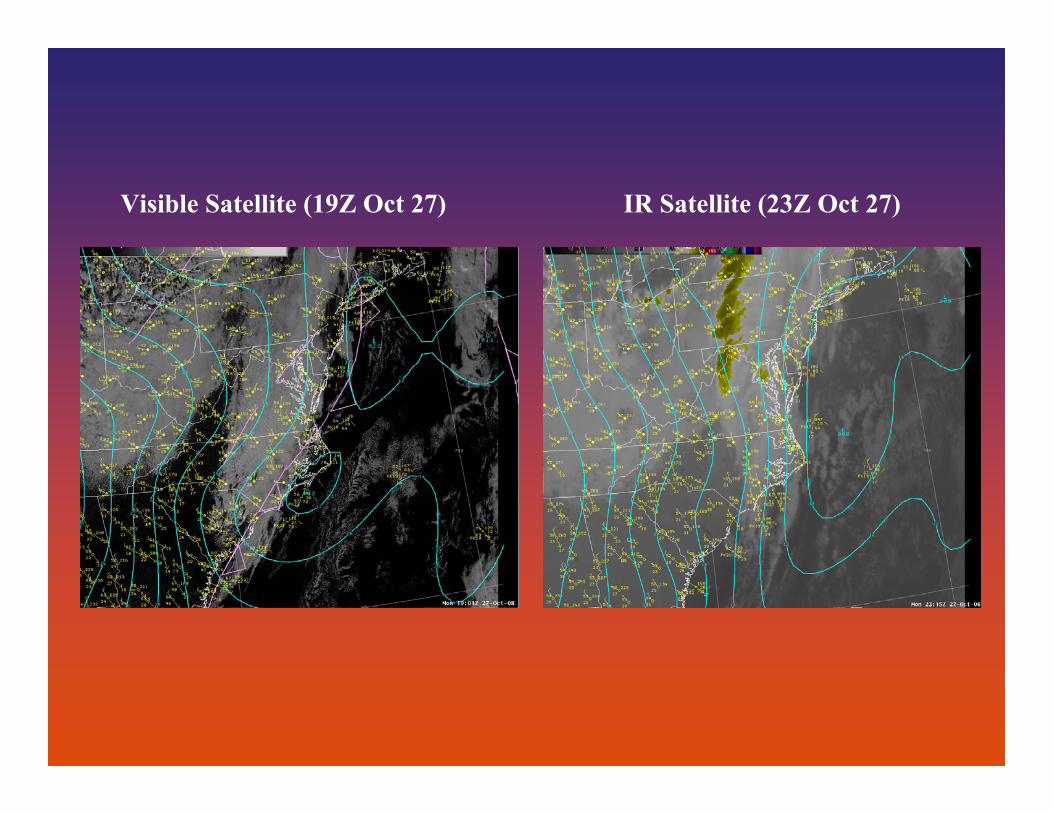
Visible Satellite (19Z Oct 27) IR Satellite (23Z Oct 27)
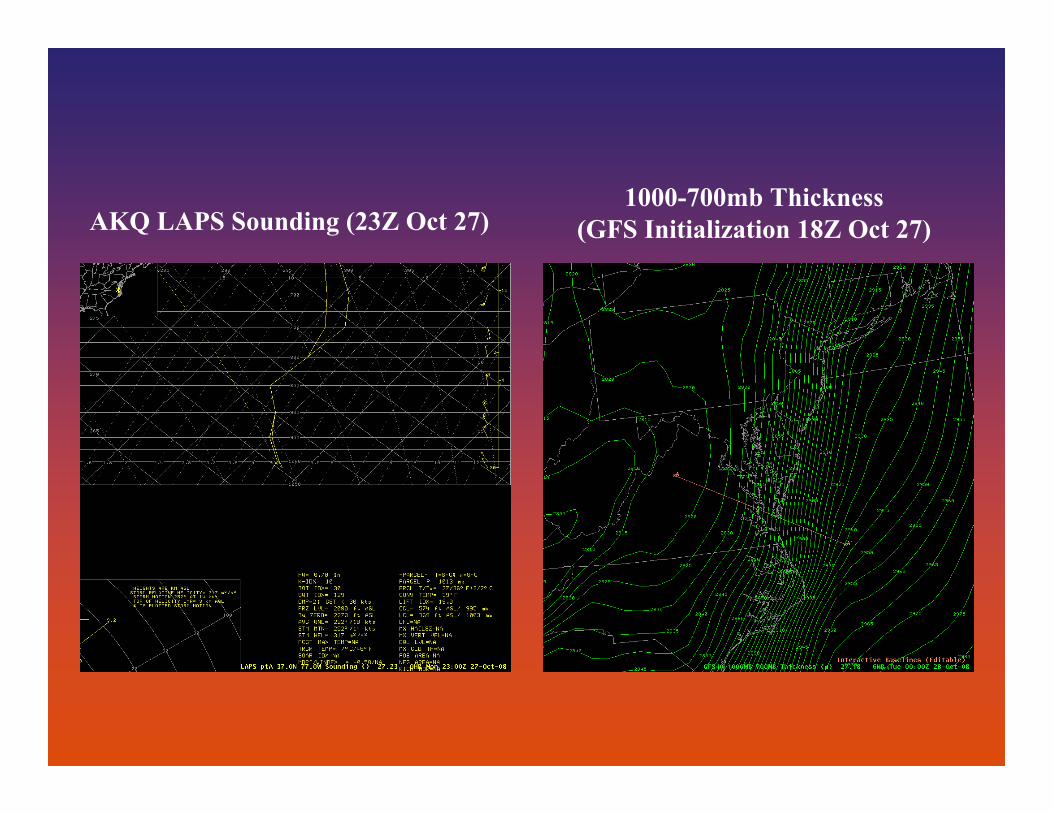
AKQ LAPS Sounding (23Z Oct 27)1000-700mb Thickness
(GFS Initialization 18Z Oct 27)
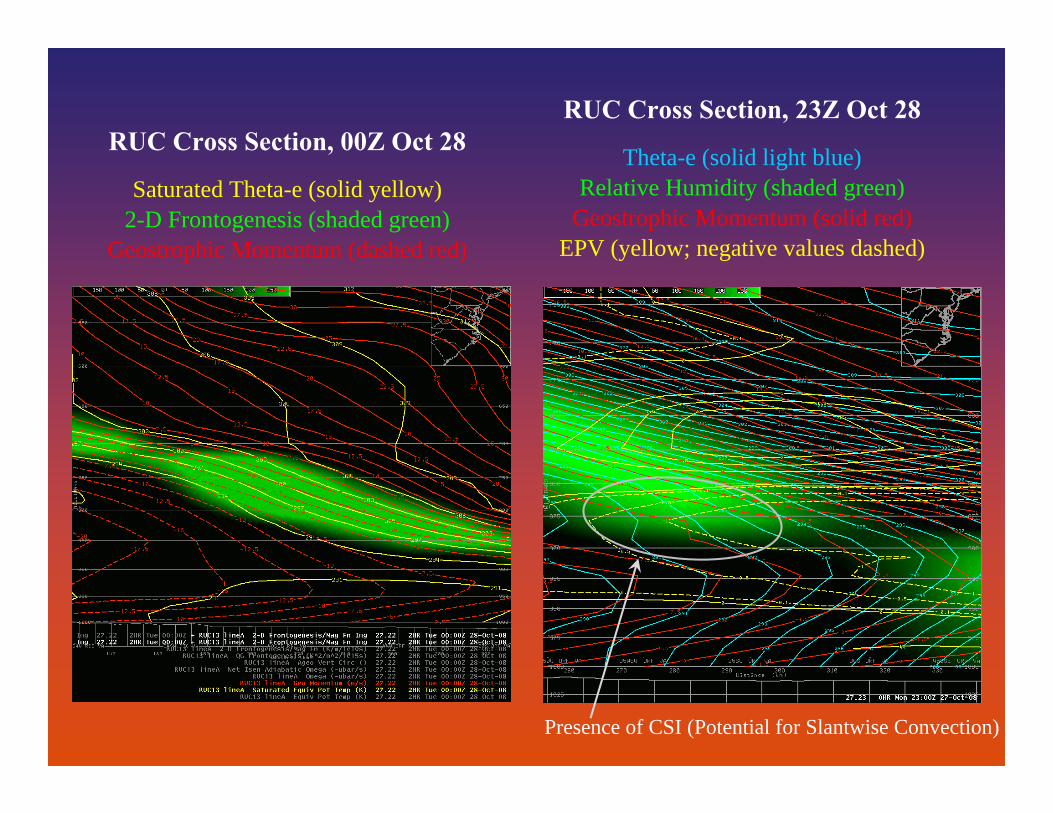
RUC Cross Section, 00Z Oct 28
Saturated Theta-e (solid yellow)2-D Frontogenesis (shaded green)
Geostrophic Momentum (dashed red)
RUC Cross Section, 23Z Oct 28
Theta-e (solid light blue)Relative Humidity (shaded green)
Geostrophic Momentum (solid red)EPV (yellow; negative values dashed)
Presence of CSI (Potential for Slantwise Convection)
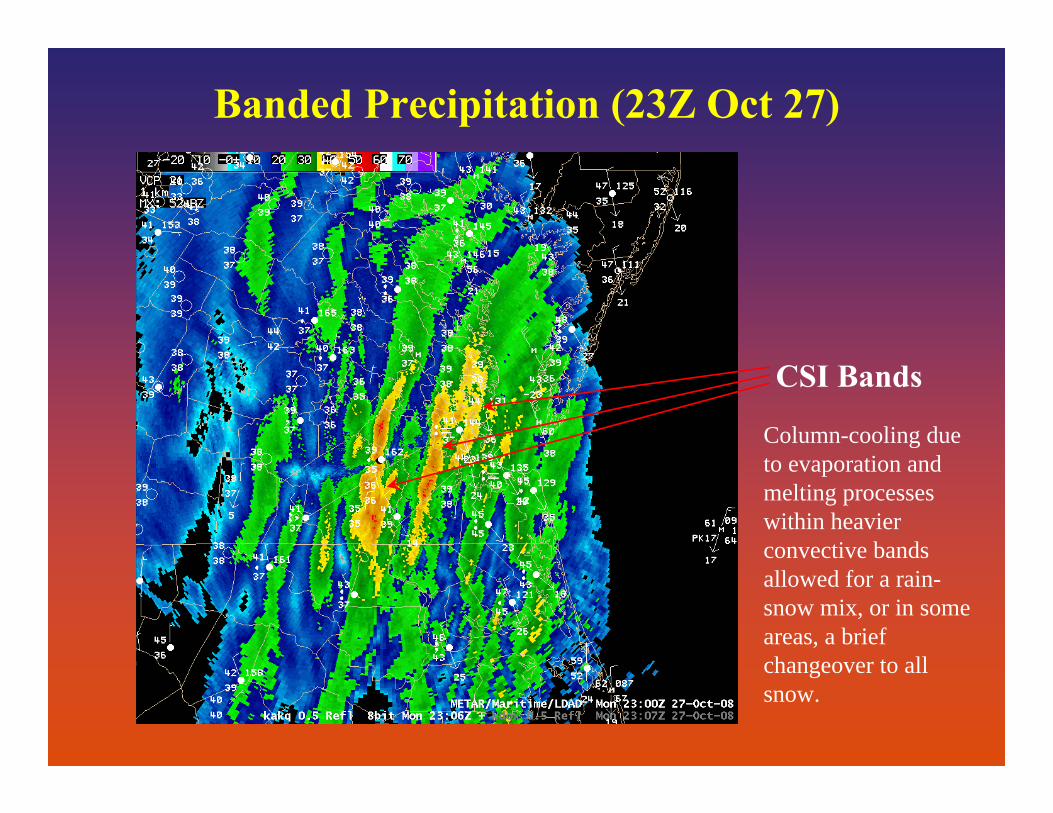
Banded Precipitation (23Z Oct 27)
CSI Bands
Column-cooling due to evaporation and melting processes within heavier convective bands allowed for a rain-snow mix, or in some areas, a brief changeover to all snow.
The End