Embed Size (px)
Citation preview
Mississippi Transportation Research Center
U.S. Department of Transportation Federal Highway Administration
Mississippi Department of Transportation
Implementation of a Real-Time Intersection
Accident Detection System (Phase 1)
Project No: FHWA/MS-DOT-RD-04-164 Prepared by:
Yunlong Zhang Department of Civil Engineering Mississippi State University Rose Qingyang Hu Department of Electrical and Computer EngineeringMississippi State University Yuanchang Xie Department of Civil Engineering Mississippi State University October 2004
Technical Report Documentation Page
1.Report No.
FHWA/MS-DOT-RD-04-164 2. Government Accession No.
3. Recipient’s Catalog No.
5. Report Date
October 2004 4. Title and Subtitle
Implementation of a Real-Time Intersection Accident Detection System (Phase 1) 6. Performing Organization Code
7. Author(s)
Yunlong Zhang, Rose Qingyang Hu, and Yuanchang Xie 8. Performing Organization Report No.
MS-DOT-RD-04-164 10. Work Unit No. (TRAIS)
9. Performing Organization Name and Address
Department of Civil Engineering Mississippi State University P.O. Box 9546 Mississippi State, MS 39762-9546
11. Contract or Grant No.
13. Type Report and Period Covered
Final Report 12. Sponsoring Agency Name and Address
Federal Highway Administration and Mississippi Department of Transportation 14. Sponsoring Agency Code
15. Supplementary Notes
Project conducted in cooperation with Federal Highway Administration and the Mississippi Department of Transportation 16. Abstract
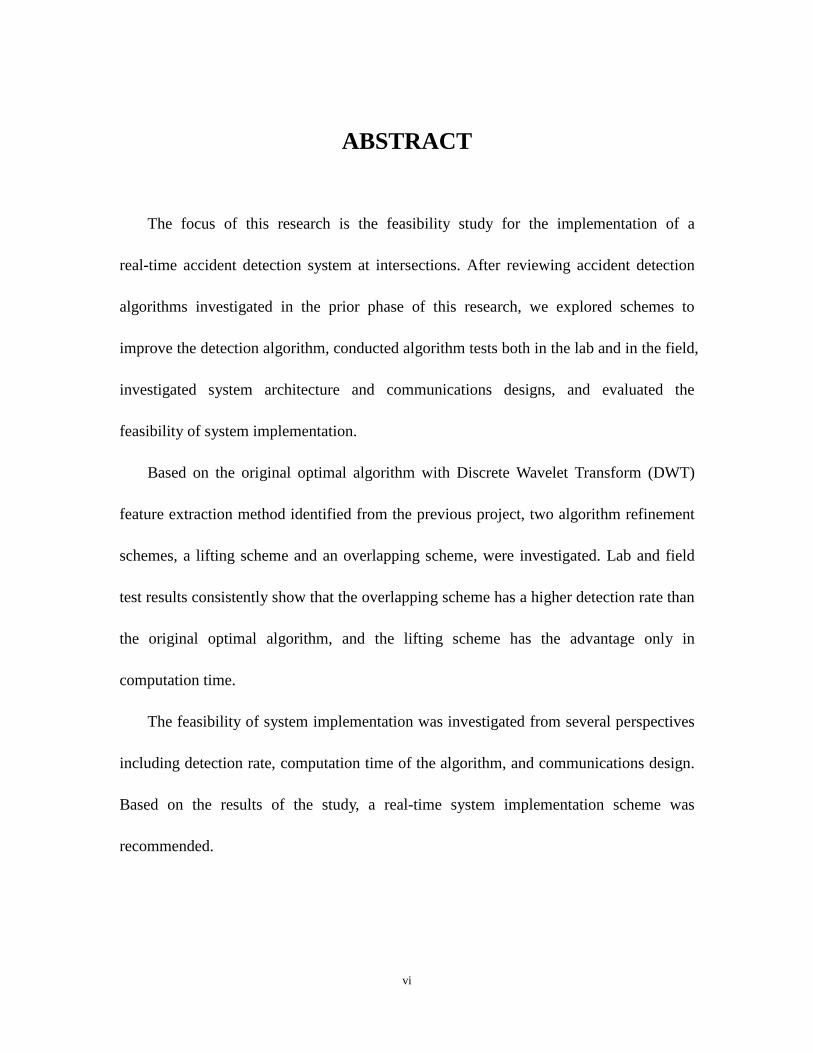
The focus of this research is the feasibility study for the implementation of a real-time accident detection system at intersections. After reviewing accident detection algorithms investigated in the prior phase of the research, we explored schemes to improve the algorithm, conducted algorithm tests both in the lab and in the field, investigated system architecture and communications mechanisms, and evaluated the feasibility of implementation. Based on the original optimal algorithm with Discrete Wavelet Transform (DWT) feature extraction method identified from the previous project, two algorithm refinement schemes, a lifting scheme and an overlapping scheme, were investigated. Lab and field test results consistently show that the overlapping scheme has a higher detection rate than the original optimal algorithm, and the lifting scheme has the advantage only in computation time. The feasibility of system implementation was investigated from several perspectives including detection rate, computation time of the algorithm, and communications design. Based on the results of the study, a real-time system implementation scheme was recommended. 17. Key Words
Accident detection, Real-time, Implementation, Audio, Acoustic, Crash
18. Distribution Statement
Unclassified
19. Security Classif. (of this report)
Unclassified 20. Security Class if. (of this page)
Unclassified 21. No. of Pages
62 22. Price
Form DOT F 1700.7 (8-72) Reproduction of completed page authorized

i
ACKNOWLEDGMENT The authors want to thank the Mississippi Department of Transportation (MDOT) for their sponsorship of the project. Special thanks are given to Mr. Bob Mabry of MDOT Traffic Engineering Division for his support and advice throughout the duration of this project. The authors also want to recognize the following Mississippi State University graduate students for their contributions to the study and to this report: Navaneethakrishnan Balraj Department of Electrical and Computer Engineering Sumit Arora Department of Electrical and Computer Engineering
ii
TABLE OF CONTENTS
CHAPTER 1. SUMMARY OF ALGORITHMS INVESTIGATED........ 1
1.1 Introduction ..................................................................................................1
1.2 Feature Extraction.........................................................................................2
1.3 Feature Optimization Method.......................................................................4
1.4 Feature Classification Method......................................................................6
CHAPTER 2. ALGORITHM REFINEMENTS FOR REAL-TIME
IMPLEMENTATION................................................................................... 7
2.1 Lifting Scheme [1]........................................................................................7
2.1.1 Lifting Scheme Algorithm............................................................................................... 8
2.1.2 Testing Results and Conclusion.................................................................................... 10
2.2 Overlapping Scheme...................................................................................11
2.2.1 Overlapping Scheme Algorithm ................................................................................... 11
2.2.2 Lab Real-Time Testing and Results .............................................................................. 14
2.3 Summary of Algorithm Refinements..........................................................19
CHAPTER 3. REAL-TIME SYSTEM TEST IN THE FIELD.............. 21
3.1 Real-Time Testing Using MATLAB Simulink...........................................21
3.2 Test Design .................................................................................................24
3.3 Test Results Analysis ..................................................................................25
CHAPTER 4. SYSTEM ARCHITECTURE AND COMMUNICATIONS
SYSTEM ...................................................................................................... 28
4.1 System Description.....................................................................................28
4.2 Communications Mechanisms....................................................................31
4.2.1 Wireline Communications System – Open Transport Network (OTN) ......................... 32
iii
4.2.2 Wireless Communications System ................................................................................ 39
CHAPTER 5. FEASIBILITY OF REAL-TIME IMPLEMENTATION
....................................................................................................................... 43
5.1 Detection Accuracy.....................................................................................43
5.2 Algorithms’ Computation Time ..................................................................44
5.3 Communications Feasibility.......................................................................45
CHAPTER 6. SYSTEM IMPLEMENTATION RECOMMENDATIONS
....................................................................................................................... 47
6.1 System Architecture....................................................................................47
6.2 Data Transmission ......................................................................................48
6.3 Algorithms ..................................................................................................48
6.4 Summary of Recommended System Configuration ...................................49
CHAPTER 7. SUMMARY AND FUTURE WORK................................ 51
7.1 Summary.....................................................................................................51
7.2 Future Work ................................................................................................52
REFERENCES............................................................................................ 54

iv
LIST OF TABLES
Table 1 Maximum likelihood classification accuracies for two-class system ................11
Table 2 Maximum likelihood classification accuracies for multi-class system..............11
Table 3 Result comparison between traditional DWT and overlapping ........................ 16
Table 4 Comparison among original DWT, lifting scheme, and overlapping scheme .. 20
Table 5 Field test results................................................................................................. 25
v
LIST OF FIGURES
Figure 1 Major steps in audio pattern recognition ........................................................... 2
Figure 2 Projection of data onto x-axis............................................................................ 5
Figure 3 Projection of data onto line y=x ........................................................................ 5
Figure 4 Block diagram showing lifting scheme ............................................................. 8
Figure 5 One signal that has two crashes occurred within 3 seconds............................ 13
Figure 6 Using 3-second window to sample the input sound ........................................ 14
Figure 7 Application of overlapping scheme................................................................. 14
Figure 8 Algorithm based on DWT(Haar) feature extraction........................................ 15
Figure 9 Algorithm based on DWT(Haar) feature extraction and overlapping scheme 16
Figure 10 Sample signal 1 with multiple crashes .......................................................... 17
Figure 11 Sample signal 2 with multiple crashes........................................................... 17
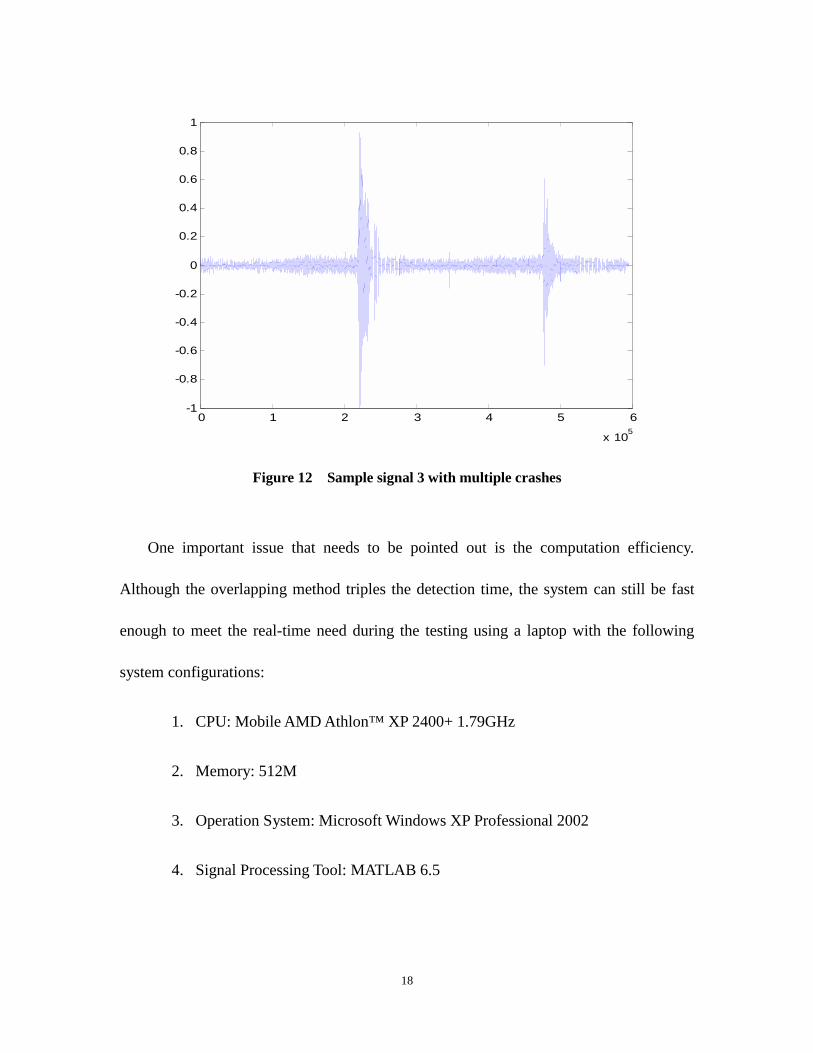
Figure 12 Sample signal 3 with multiple crashes .......................................................... 18
Figure 13 Block diagram of real-time testing system using MATLAB Simulink ......... 22
Figure 14 Real-time detection system using MATLAB Simulink................................. 23
Figure 15 Plot of incoming signal.................................................................................. 23
Figure 16 Plot of a signal classified as “crash”.............................................................. 24
Figure 17 Real-time accident detection at intersection.................................................. 28
Figure 18 Recommended system diagram..................................................................... 50
vi
ABSTRACT
The focus of this research is the feasibility study for the implementation of a
real-time accident detection system at intersections. After reviewing accident detection
algorithms investigated in the prior phase of this research, we explored schemes to
improve the detection algorithm, conducted algorithm tests both in the lab and in the field,
investigated system architecture and communications designs, and evaluated the
feasibility of system implementation.
Based on the original optimal algorithm with Discrete Wavelet Transform (DWT)
feature extraction method identified from the previous project, two algorithm refinement
schemes, a lifting scheme and an overlapping scheme, were investigated. Lab and field
test results consistently show that the overlapping scheme has a higher detection rate than
the original optimal algorithm, and the lifting scheme has the advantage only in
computation time.
The feasibility of system implementation was investigated from several perspectives
including detection rate, computation time of the algorithm, and communications design.
Based on the results of the study, a real-time system implementation scheme was
recommended.
1
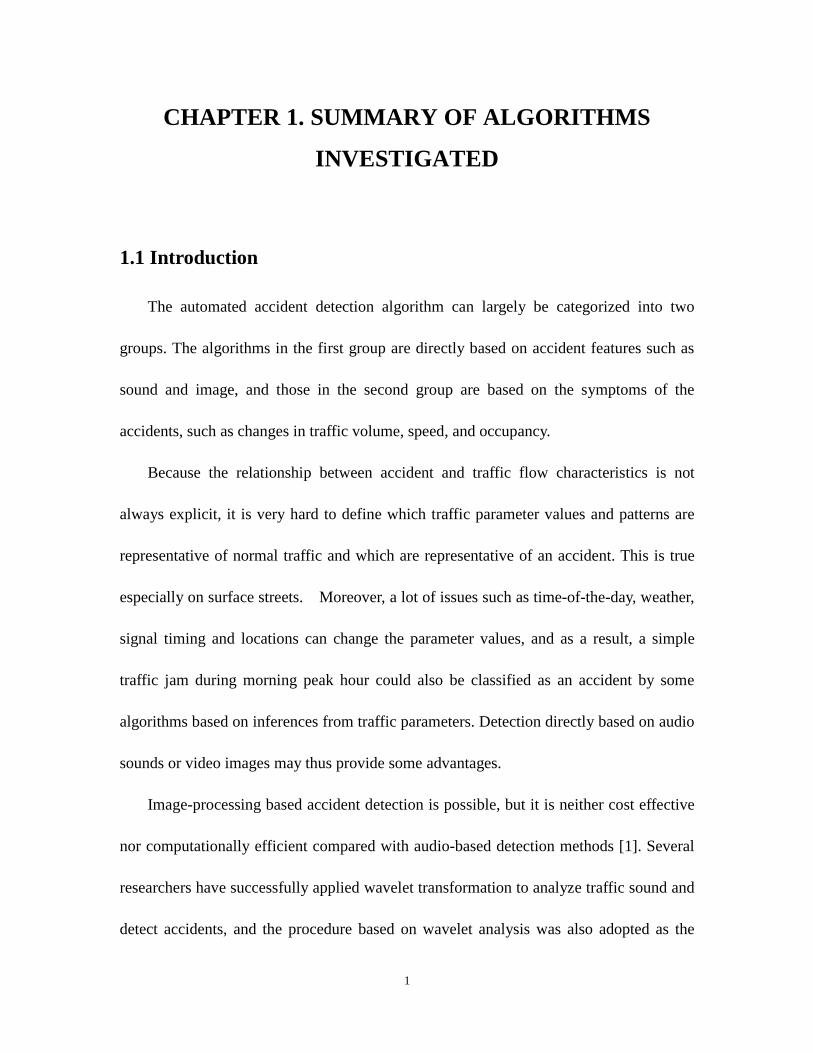
CHAPTER 1. SUMMARY OF ALGORITHMS
INVESTIGATED
1.1 Introduction
The automated accident detection algorithm can largely be categorized into two
groups. The algorithms in the first group are directly based on accident features such as
sound and image, and those in the second group are based on the symptoms of the
accidents, such as changes in traffic volume, speed, and occupancy.
Because the relationship between accident and traffic flow characteristics is not
always explicit, it is very hard to define which traffic parameter values and patterns are
representative of normal traffic and which are representative of an accident. This is true
especially on surface streets. Moreover, a lot of issues such as time-of-the-day, weather,
signal timing and locations can change the parameter values, and as a result, a simple
traffic jam during morning peak hour could also be classified as an accident by some
algorithms based on inferences from traffic parameters. Detection directly based on audio
sounds or video images may thus provide some advantages.
Image-processing based accident detection is possible, but it is neither cost effective
nor computationally efficient compared with audio-based detection methods [1]. Several
researchers have successfully applied wavelet transformation to analyze traffic sound and
detect accidents, and the procedure based on wavelet analysis was also adopted as the
2
base-line method during the algorithm development stage in this accident detection
research. Normally, there are three major steps involved in the audio accident detection
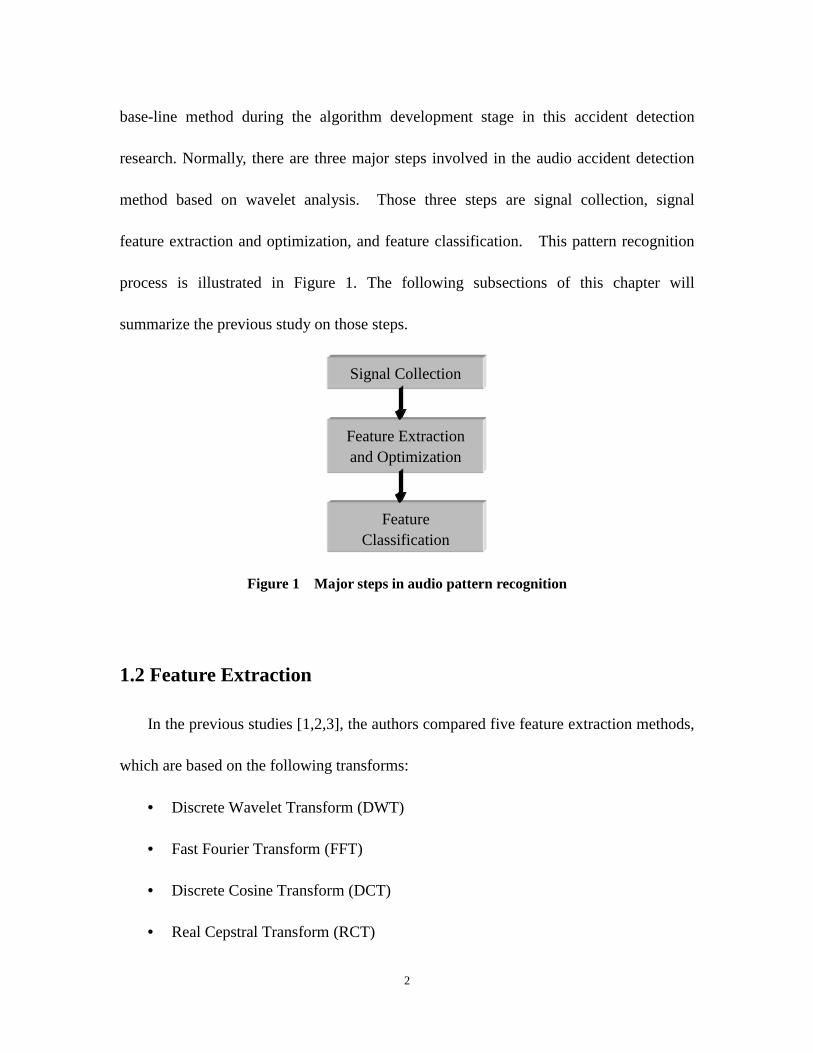
method based on wavelet analysis. Those three steps are signal collection, signal
feature extraction and optimization, and feature classification. This pattern recognition
process is illustrated in Figure 1. The following subsections of this chapter will
summarize the previous study on those steps.
Figure 1 Major steps in audio pattern recognition
1.2 Feature Extraction
In the previous studies [1,2,3], the authors compared five feature extraction methods,
which are based on the following transforms:
• Discrete Wavelet Transform (DWT)
• Fast Fourier Transform (FFT)
• Discrete Cosine Transform (DCT)
• Real Cepstral Transform (RCT)
Feature Extraction and Optimization
Feature Classification
Signal Collection
3
• Mel frequency Cepstral Transform (MCT)
The test results show that compared with other feature extraction methods, extraction
based on DWT can provide the highest classification accuracy. DWT was thus adopted as
the feature extraction method in this project.
The development of the Discrete Wavelet Transform was motivated by the fact that
DWT offers some advantages in analyzing the temporal and spectral properties of
non-stationary signals such as traffic acoustic signals. A feature vector, Fr
, is formed
through computing the root-mean-square (RMS) energy of the wavelet detail coefficients
at each scale, jED and the RMS energy of the wavelet approximation coefficients at the
final scale, MEA ,
[ ]TMMM EDEDEDEAF 11 L
r−= (1-1)
Where the superscript T denotes a vector transpose, and
[ ]∑−
=
=1
0
2)(1A
MP
iMA
MM iA
PEA (1-2)
[ ]∑−
=
=1
0
2)(1DjP
ijD
jj iD
PED (1-3)
For Mj ,,3,2,1 L= , the constant M is the maximum wavelet decomposition level;
DjP is the number of detail coefficients at level j ; and A
MP is the number of
approximation coefficients at level M . According to equation (1-1), after the DWT
feature extraction, the data space dimension is reduced to 1+M . The value of M is
determined by the wavelet filter length and the original signal length. The most it can
4
ever be is )(log2 NM = , where N is the length of the original signal and the mother
wavelet’s high-pass and low-pass filters have length 2, as in the case with the Haar
mother wavelet. However, for longer mother wavelets, such as the higher order
Daubechies or Biorthogonal mother wavelets, the maximum scale M can be much
lower.
We compared the DWT feature extraction methods based on different mother
wavelets such as Haar, Daubechies4, Daubechies15, Coif lets2, Coif lets5, Symlets2, and
Symlets8. All the features extracted are optimized and classified, and the classification
results show that DWT based on Haar mother wavelet can consistently achieve the best
accuracy. In this project, DWT with Haar mother wavelet was adopted. And when we
refer to DWT in this report, it means DWT with Haar mother wavelet.
1.3 Feature Optimization Method
The Fisher’s Linear Discriminant Analysis (LDA) method is selected for feature
optimization. LDA is based on the projection of the whole data set, and it tries to
maximize the intraclass variance and minimize the interclass variance. A simple example
of LDA is shown in Figures 2 and 3.
5
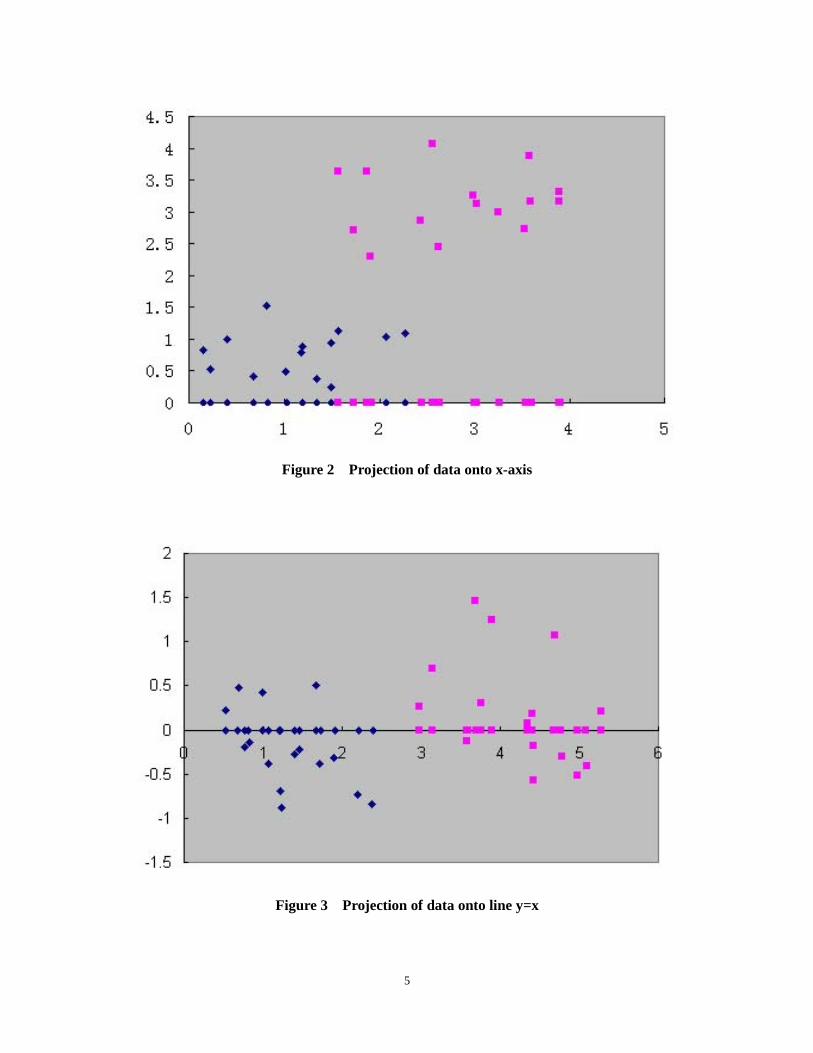
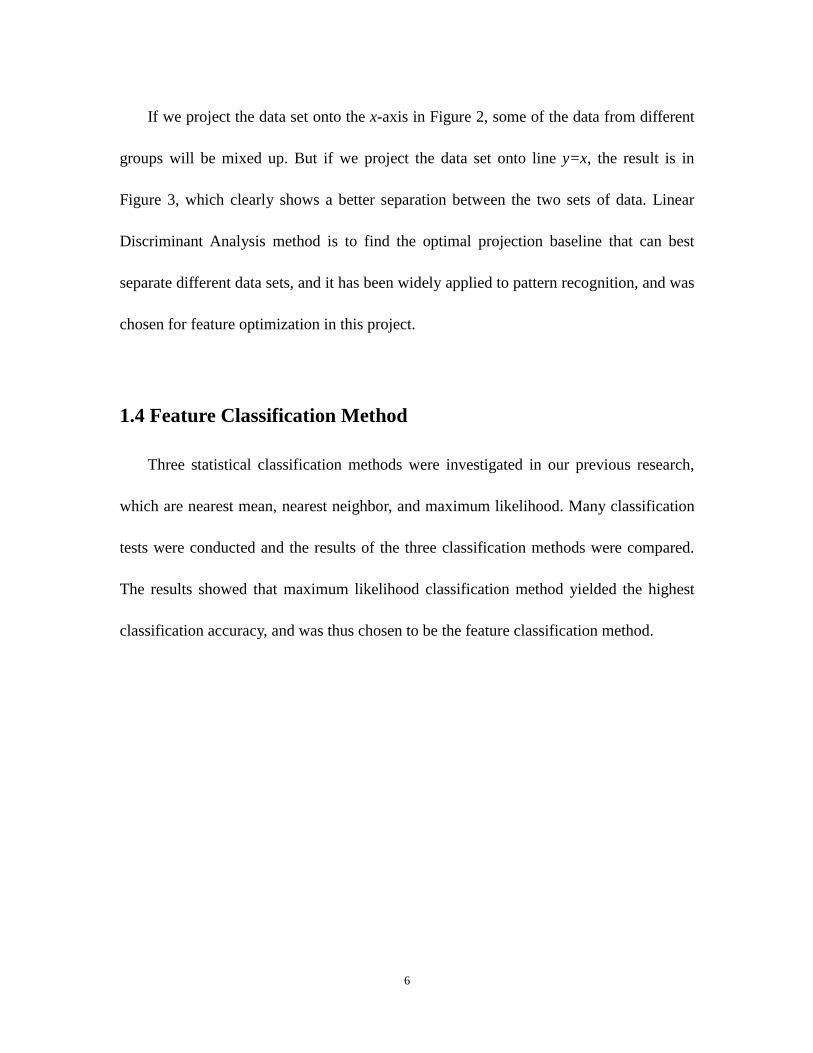
Figure 2 Projection of data onto x-axis
Figure 3 Projection of data onto line y=x
6
If we project the data set onto the x-axis in Figure 2, some of the data from different
groups will be mixed up. But if we project the data set onto line y=x, the result is in
Figure 3, which clearly shows a better separation between the two sets of data. Linear
Discriminant Analysis method is to find the optimal projection baseline that can best
separate different data sets, and it has been widely applied to pattern recognition, and was
chosen for feature optimization in this project.
1.4 Feature Classification Method
Three statistical classification methods were investigated in our previous research,
which are nearest mean, nearest neighbor, and maximum likelihood. Many classification
tests were conducted and the results of the three classification methods were compared.
The results showed that maximum likelihood classification method yielded the highest
classification accuracy, and was thus chosen to be the feature classification method.
7
CHAPTER 2. ALGORITHM REFINEMENTS FOR
REAL-TIME IMPLEMENTATION
To facilitate the real-time implementation of an automated accident detection system,
a lot of research work was conducted to improve the speed and performance of the
detection algorithm. Particularly, we proposed to use a lifting scheme to speed up the
algorithm, and also developed an overlapping scheme to improve the classification
accuracy. The performances of the refined algorithms were tested in a lab environment in
real-time by running the detection programs while playing back recorded sound signals.
2.1 Lifting Scheme [1]
In order to meet the requirement of a real-world system, the detection algorithms
must be fast enough for real–time applications. The computational time proved to be
faster with the lifting scheme compared with other existing algorithms based on the
discrete wavelet transform [4]. The main property of the lifting scheme is that all the
derivation is from the spatial domain. This is in contrast to the conventional approach
where the derivation is based on the frequency domain. The main advantage of being in
the spatial domain is that no prerequisite of Fourier Transform is required. When the
system is installed, it will perform at least one feature extraction operation every 3
seconds. If we use the lifting scheme to improve the processing speed of the traditional
8
DWT-based feature extraction method, it will save a lot of computation time.
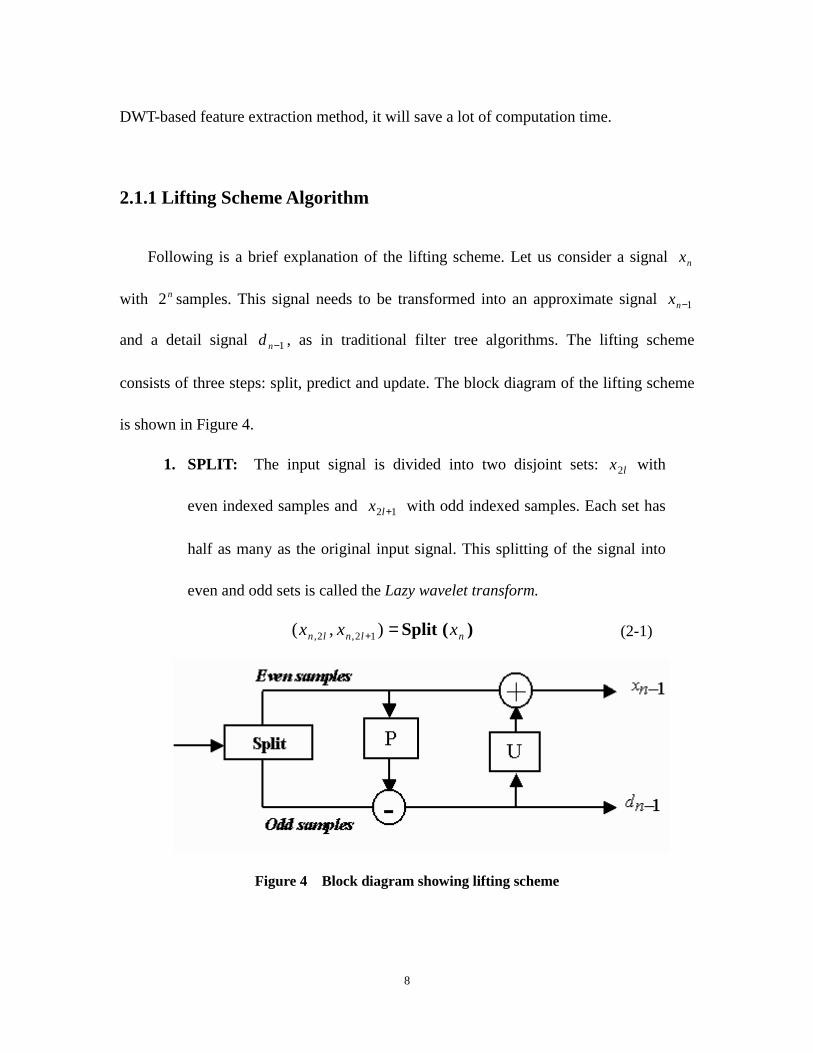
2.1.1 Lifting Scheme Algorithm
Following is a brief explanation of the lifting scheme. Let us consider a signal nx
with n2 samples. This signal needs to be transformed into an approximate signal 1−nx
and a detail signal 1−nd , as in traditional filter tree algorithms. The lifting scheme
consists of three steps: split, predict and update. The block diagram of the lifting scheme
is shown in Figure 4.
1. SPLIT: The input signal is divided into two disjoint sets: lx2 with
even indexed samples and 12 +lx with odd indexed samples. Each set has
half as many as the original input signal. This splitting of the signal into
even and odd sets is called the Lazy wavelet transform.
)(Split nlnln xxx =+ ),( 12,2, (2-1)
Figure 4 Block diagram showing lifting scheme
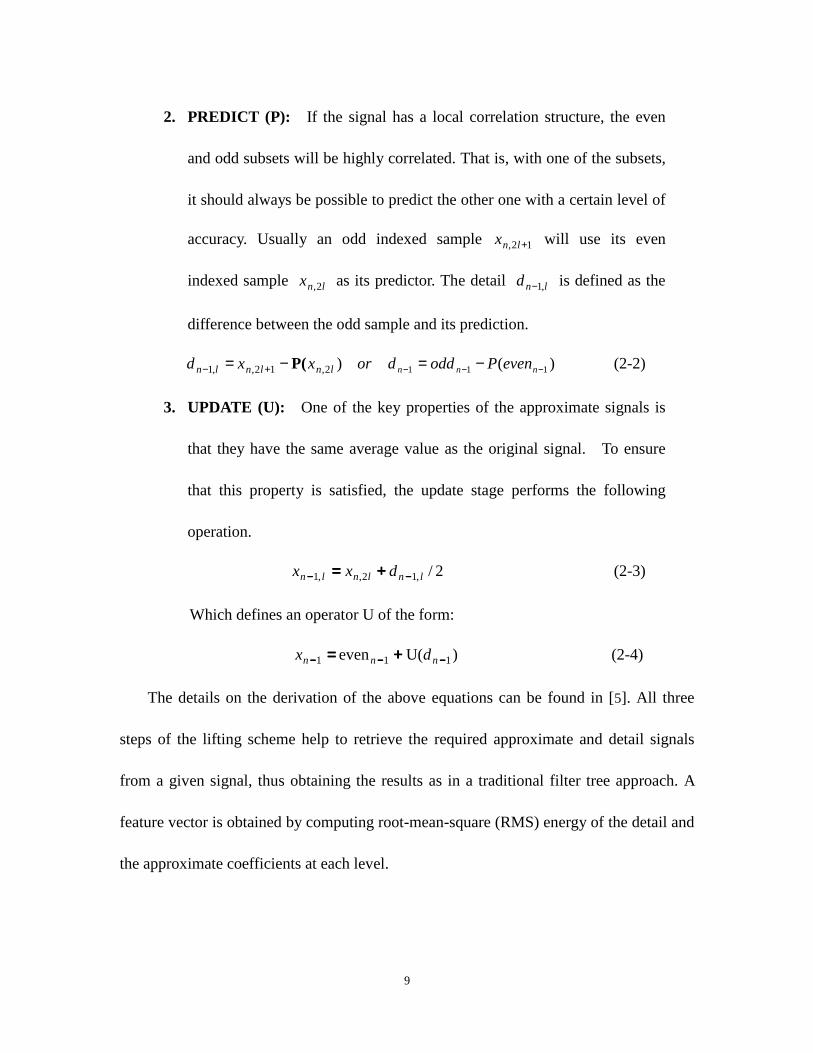
9
2. PREDICT (P): If the signal has a local correlation structure, the even
and odd subsets will be highly correlated. That is, with one of the subsets,
it should always be possible to predict the other one with a certain level of
accuracy. Usually an odd indexed sample 12, +lnx will use its even
indexed sample lnx 2, as its predictor. The detail lnd ,1− is defined as the
difference between the odd sample and its prediction.
)() 1112,12,,1 −−− −=−= +− nnn evenPodddorxxd lnlnln P( (2-2)
3. UPDATE (U): One of the key properties of the approximate signals is
that they have the same average value as the original signal. To ensure
that this property is satisfied, the update stage performs the following
operation.
2/ ,12,,1 lnlnln dxx −−−−−−−− ++++==== (2-3)
Which defines an operator U of the form:
) U(even 111 −−−−−−−−−−−− ++++==== nnn dx (2-4)
The details on the derivation of the above equations can be found in [5]. All three
steps of the lifting scheme help to retrieve the required approximate and detail signals
from a given signal, thus obtaining the results as in a traditional filter tree approach. A
feature vector is obtained by computing root-mean-square (RMS) energy of the detail and
the approximate coefficients at each level.
10
2.1.2 Testing Results and Conclusion
To test the effect of the lifting scheme, we conducted comparisons between different
design schemes. First, the authors considered two different types of feature extraction
methods: DWT scheme and the lifting scheme. The system is designed such that the
audio signals could be either classified using a two-class system (crash or non-crash) or a
multi-class system (crash, normal traffic, pile drive, siren, bird chirping, etc.). Maximum
likelihood classifier and LDA were used as the methods for feature classification and
feature reduction respectively.
Tables 1 and 2 show the maximum likelihood classification results comparisons
between the DWT scheme and the lifting scheme. All results reflect the leave-one-out
testing scheme: a crash signal or special non-crash (breaking, sirens, etc.) is tested based
on the classified database that excludes the signal being tested. Table 1 is for the
two-class system, and Table 2 is for the multi-class system. Clearly, both DWT and the
lifting schemes provide satisfactory detection results in both two-class and multi-class
systems, but the DWT’s performance is consistently better. Among all 4 combinations,
the two-class system with the DWT method performed the best, achieving 94% overall
accuracy with a 95% confidence interval at 0.04. Thus DWT method using the Haar
mother wavelet would be a better choice, based on the overall classification accuracy, for
implementation of the algorithm in real time system. The lifting scheme, due to its much
faster execution, may also be considered in a real-world system where computation time
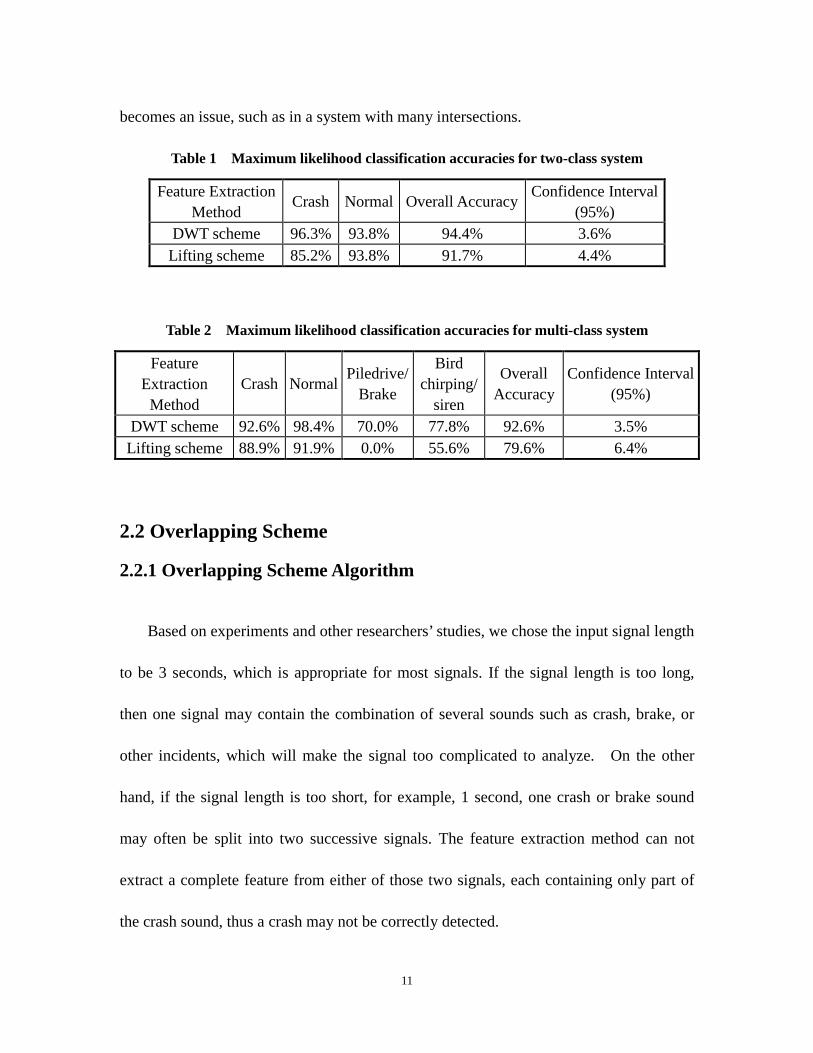
11
becomes an issue, such as in a system with many intersections.
Table 1 Maximum likelihood classification accuracies for two-class system
Feature Extraction Method
Crash Normal Overall Accuracy Confidence Interval(95%)
DWT scheme 96.3% 93.8% 94.4% 3.6% Lifting scheme 85.2% 93.8% 91.7% 4.4%
Table 2 Maximum likelihood classification accuracies for multi-class system
Feature Extraction
Method Crash Normal Piledrive/
Brake
Bird chirping/
siren
Overall Accuracy
Confidence Interval(95%)
DWT scheme 92.6% 98.4% 70.0% 77.8% 92.6% 3.5% Lifting scheme 88.9% 91.9% 0.0% 55.6% 79.6% 6.4%
2.2 Overlapping Scheme
2.2.1 Overlapping Scheme Algorithm
Based on experiments and other researchers’ studies, we chose the input signal length
to be 3 seconds, which is appropriate for most signals. If the signal length is too long,
then one signal may contain the combination of several sounds such as crash, brake, or
other incidents, which will make the signal too complicated to analyze. On the other
hand, if the signal length is too short, for example, 1 second, one crash or brake sound
may often be split into two successive signals. The feature extraction method can not
extract a complete feature from either of those two signals, each containing only part of
the crash sound, thus a crash may not be correctly detected.

12
Even with a 3 second signal length, it may still happen that one crash sound is split
into two signals even though the probability is smaller compared with the case with a
one-second signal length. In addition, it’s also common that two or more crash sounds
may occur within 3 seconds. To separate these crash sounds correctly is essential for
accurate crash detection.
To overcome the two aforementioned problems, we proposed and tested an
overlapping scheme, which uses a 3-second window to sample the original input sound
every second. This scheme results in an overlapped portion between two consecutive
samples and the overlapped signal length is 2 seconds. With this, the instance that one
sound splits into two signals can be mostly avoided. For example, since we continuously
sample the input sound with a 3-second window every second, the end of the first signal
is in the middle of the next signal, and its beginning is in the middle of the previous
signal. Even if one crash sound is split into the first signals, it will be completely included
within the third signal. The other problem we mentioned before can also be effectively
avoided by the overlapping scheme. This is illustrated by Figure 5, which shows one
signal that has two crashes occurring within 3 seconds. If we simply use the 3-second
window to sample this signal, what we will get probably is the portion indicated by the
solid line. But if we use the overlapping scheme and sample the signal every 1 second
using a 3-second window, then the chance we can separate the two crashes will be greatly
increased, as indicated by the dashed lines in Figure 5. By decomposing the signal with
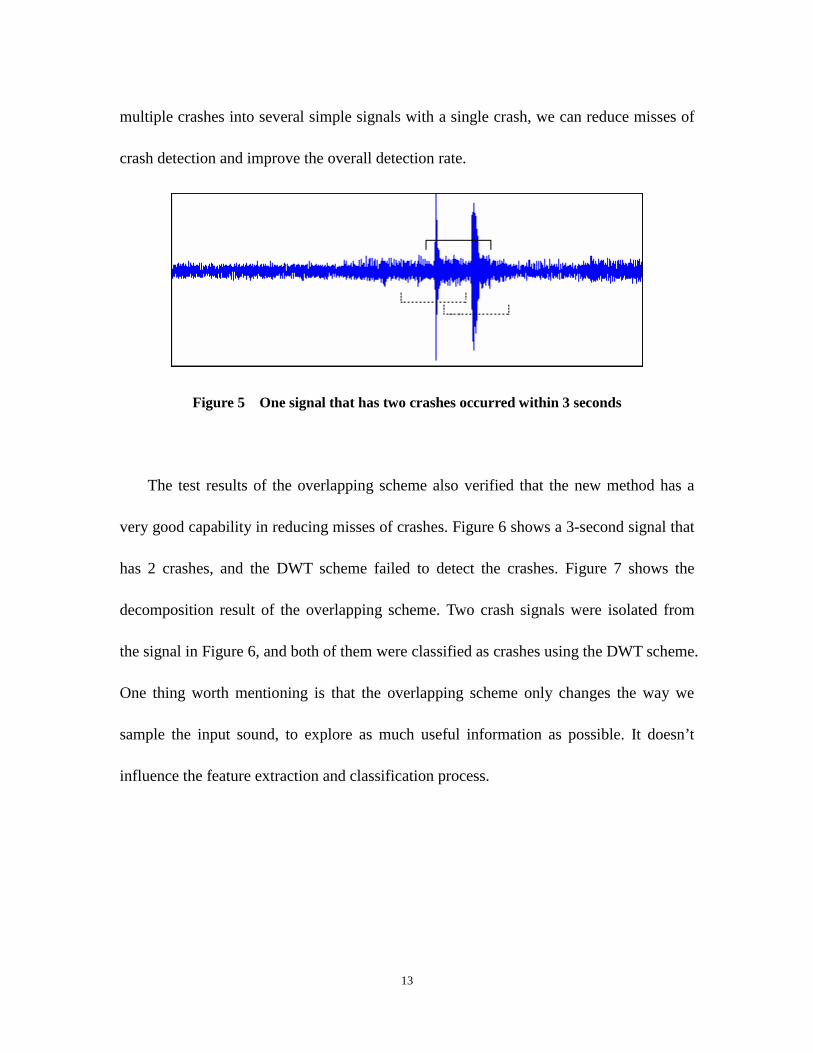
13
multiple crashes into several simple signals with a single crash, we can reduce misses of
crash detection and improve the overall detection rate.
Figure 5 One signal that has two crashes occurred within 3 seconds
The test results of the overlapping scheme also verified that the new method has a
very good capability in reducing misses of crashes. Figure 6 shows a 3-second signal that
has 2 crashes, and the DWT scheme failed to detect the crashes. Figure 7 shows the
decomposition result of the overlapping scheme. Two crash signals were isolated from
the signal in Figure 6, and both of them were classified as crashes using the DWT scheme.
One thing worth mentioning is that the overlapping scheme only changes the way we
sample the input sound, to explore as much useful information as possible. It doesn’t
influence the feature extraction and classification process.
14
0 1 2 3 4 5 6 7
x 104
-1
-0.8
-0.6
-0.4
-0.2
0
0.2
0.4
0.6
0.8
1
Figure 6 Using 3-second window to sample the input sound
Figure 7 Application of overlapping scheme
2.2.2 Lab Real-Time Testing and Results
To test the effectiveness of the overlapping scheme, we selected 16 crash video clips
from the TRIMARC project, which was conducted by the Kentucky Transportation
Cabinet, City of Louisville Public Works, Louisville Police Department, Northrop
15
Grumman, and Mitsubishi Electric Company. These videos include the background and
crash sounds, and can best represent the real-time environment. Results without the
overlapping scheme (procedure shown in Figure 8) and with the overlapping scheme
(Figure 9) were compared and the results were tabulated in Table 3.
Figure 8 Algorithm based on DWT(Haar) feature extraction
DWT Feature Extraction
Fisher’s LDA Method
Maximum Likelihood
Overlapping
Signal Collection
Crash or Non-Crash
Maximum Likelihood
Signal Collection
DWT Feature Extraction
Fisher’s LDA Method
Crash or Non-Crash
16
Figure 9 Algorithm based on DWT(Haar) feature extraction and overlapping scheme
Table 3 Result comparison between traditional DWT and overlapping
No Overlapping Overlapping Signal # of Crashes Crash Miss Crash Miss
1 2 1 1 1 1 2 2 2 0 2 0 3 2 1 1 2 0 4 1 1 0 1 0 5 2 2 0 2 0 6 1 1 0 1 0 7 2 1 1 2 0 8 2 2 0 2 0 9 1 1 0 1 0 10 1 1 0 1 0 11 2 2 0 2 0 12 5 5 0 5 0 13 5 4 1 5 0 14 2 2 0 2 0 15 2 2 0 2 0 16 2 2 0 2 0
Total 34 30 4 33 1 Accuracy ---- 88.2% 97.1%
The results show that the overlapping method improved accuracy, especially when
there are two or more crashes occurring in one 3-second signal. Having several crashes in
three seconds is common, since one accident may have more than one crash sound and
sometimes one accident may cause several immediate secondary crashes. A few actual
cases with multiple crashes occurring within a short time span are shown in Figures 10,
11 and 12. We can certainly see the need of addressing this issue and the proposed
overlapping scheme can do exactly that task.
17
0 2 4 6 8 10 12 14
x 105
-1
-0.8
-0.6
-0.4
-0.2
0
0.2
0.4
0.6
0.8
Figure 10 Sample signal 1 with multiple crashes
0 1 2 3 4 5 6 7
x 105
-1
-0.8
-0.6
-0.4
-0.2
0
0.2
0.4
0.6
0.8
1
Figure 11 Sample signal 2 with multiple crashes
18
0 1 2 3 4 5 6
x 105
-1
-0.8
-0.6
-0.4
-0.2
0
0.2
0.4
0.6
0.8
1
Figure 12 Sample signal 3 with multiple crashes
One important issue that needs to be pointed out is the computation efficiency.
Although the overlapping method triples the detection time, the system can still be fast
enough to meet the real-time need during the testing using a laptop with the following
system configurations:
1. CPU: Mobile AMD Athlon™ XP 2400+ 1.79GHz
2. Memory: 512M
3. Operation System: Microsoft Windows XP Professional 2002
4. Signal Processing Tool: MATLAB 6.5
19
2.3 Summary of Algorithm Refinements
In this study, we proposed two improvements, a lifting scheme and an overlapping
scheme, to the baseline DWT scheme developed in the previous stage of the research.
The test results in Tables 1 and 2 show that although the lifting scheme can improve the
computational efficiency of the detection algorithm, its detection accuracy is consistently
lower than that of the DWT. Faster speed was achieved at the expense of lower
accuracy. For an accident detection system, accuracy is the most important factor and
speed is secondary as long as real-time processing is still maintained. Because of this we
will not recommend using the lifting scheme in our accident detection system as long as
adequate computational resources are available to provide real-time applications.
The overlapping scheme uses a 3-second window to sample the input sound every
second and avoids two major problems that may cause negative effects on detection rate.
Theoretically the overlapping scheme should have higher crash detection accuracy than
the DWT scheme or the lifting scheme; this is confirmed by the results in Table 3.
Compared with the DWT scheme, an overlapping scheme will triple the detection time, it
can make better use of the available input sound and it also significantly improves the
crash detection rate. We used a laptop to do real-time data sampling and ran the
detection algorithm based on an overlapping scheme, and it didn’t show any delay. In
real-world implementation, with properly designed system architecture, more powerful
computers, and well-written algorithm code, the computational time should not be an
20
obstacle for adopting the overlapping scheme.
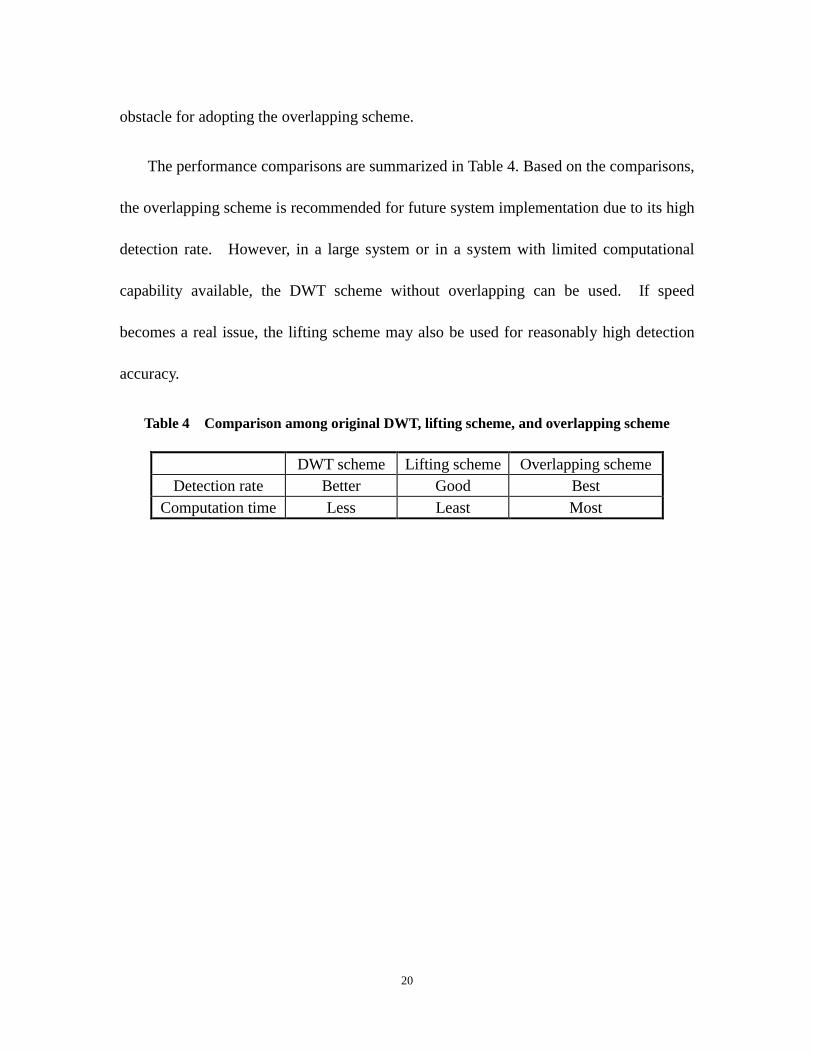
The performance comparisons are summarized in Table 4. Based on the comparisons,
the overlapping scheme is recommended for future system implementation due to its high
detection rate. However, in a large system or in a system with limited computational
capability available, the DWT scheme without overlapping can be used. If speed
becomes a real issue, the lifting scheme may also be used for reasonably high detection
accuracy.
Table 4 Comparison among original DWT, lifting scheme, and overlapping scheme
DWT scheme Lifting scheme Overlapping scheme Detection rate Better Good Best
Computation time Less Least Most
21
CHAPTER 3. REAL-TIME SYSTEM TEST IN THE
FIELD
All the tests reported in Chapter 2 are real-time testing. The tests were conducted
by playing back recorded audio signals. The results reported in chapter 2 on one hand
provide the basis of algorithm selection for real-world systems, and on the other hand,
they also present the real-time testing results of the selected algorithm. Results of the
lab testing by playing back original audio crash signals recorded at intersections in real
time are also reported in [1,2]. In order to achieve more convincing test results, we also
conducted field tests at one typical intersection in the downtown area of Starkville, MS.
3.1 Real-Time Testing Using MATLAB Simulink
The real time accident detection processing is developed in MATLAB Simulink.
The system uses an external sound card to send the recorded signal to the Simulink. The
input signal to the Simulink is a series of three-second frames with 66,176 samples. The
testing was either conducted at intersection in real time while audio signals are being
collected, or processed in real time while the recorded signals are being played back.
Before any processing was conducted, all signals were normalized such that each signal’s
maximum amplitude was one. For every incoming signal, it was processed by
extracting energy features using discrete wavelet transform or a lifting scheme. It was
22
then compared with the classified database and classified when its feature was similar to
any of the signals in the training database. When a signal is identified as “crash”, an alert
signal is produced.
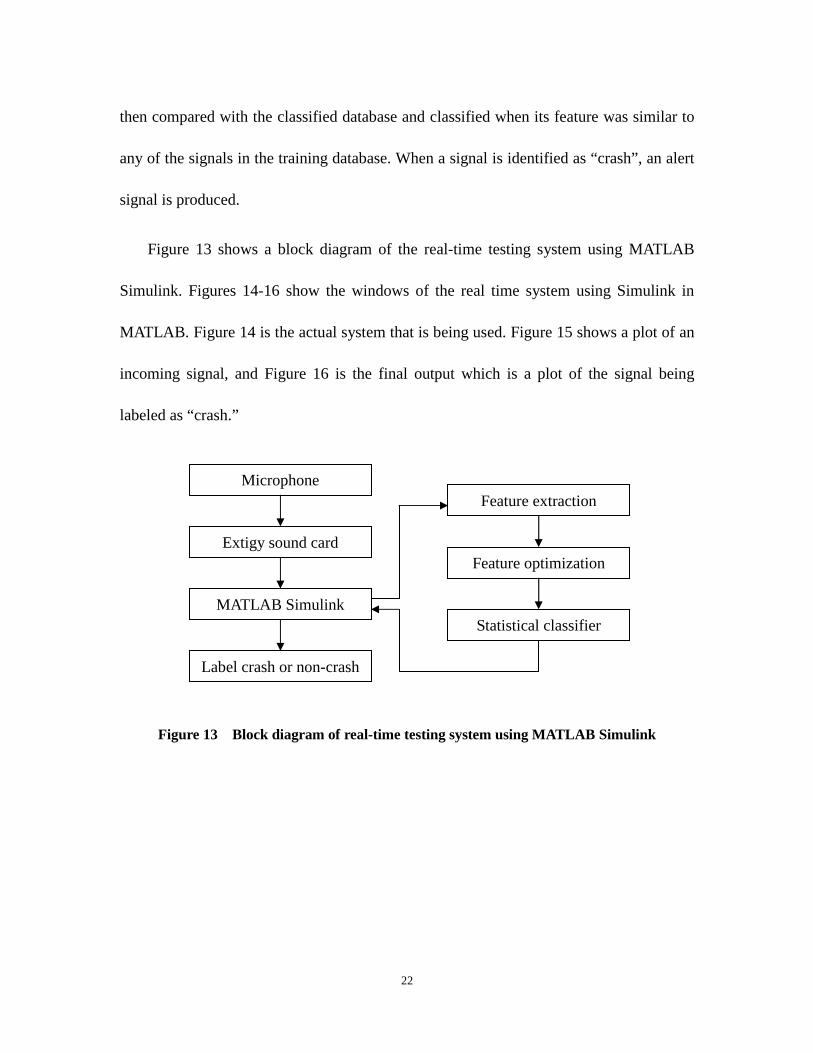
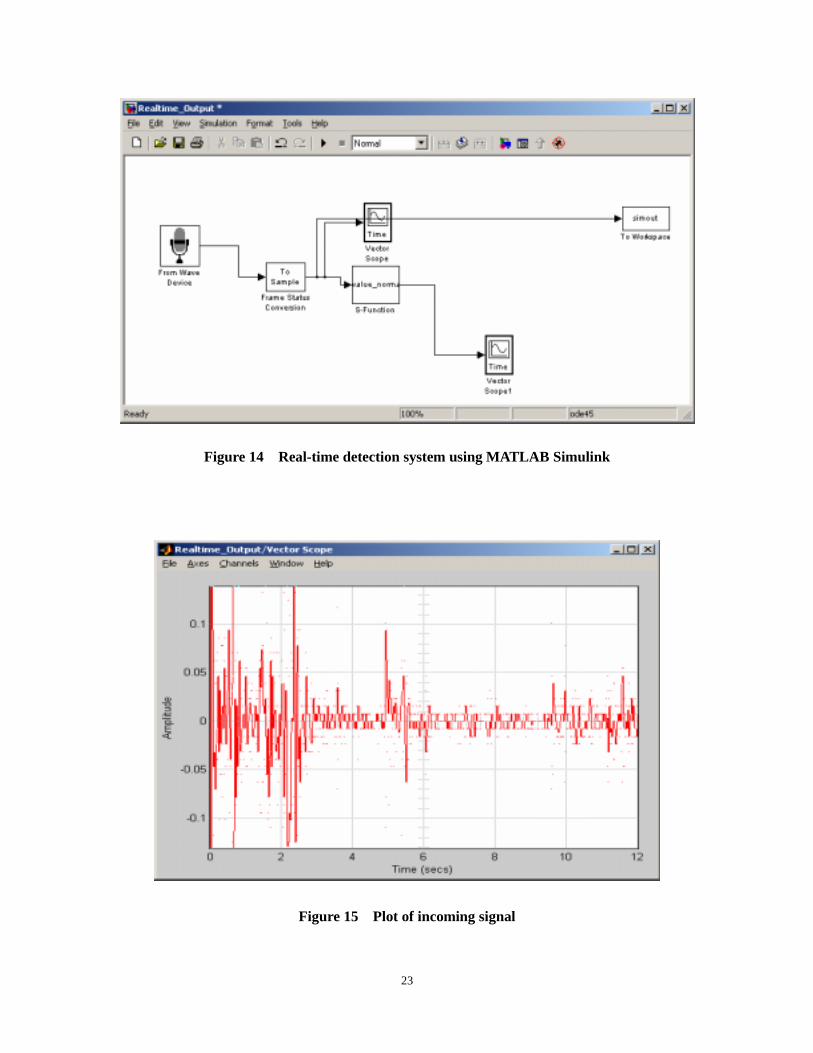
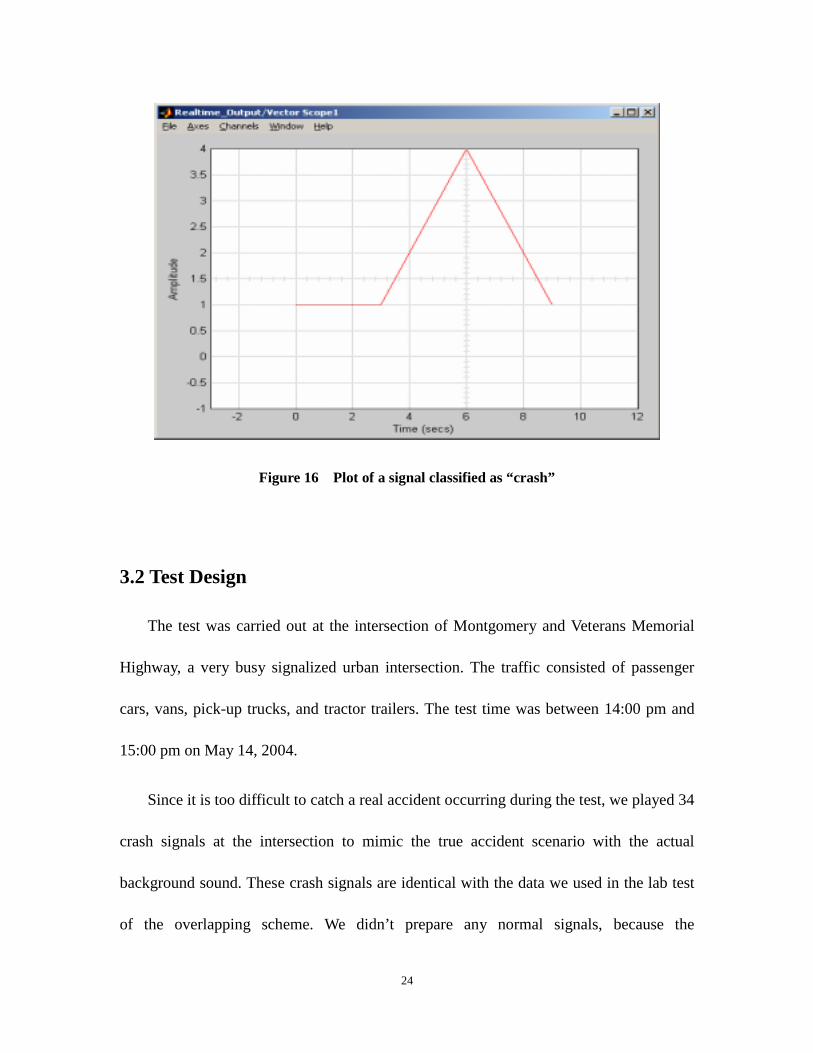
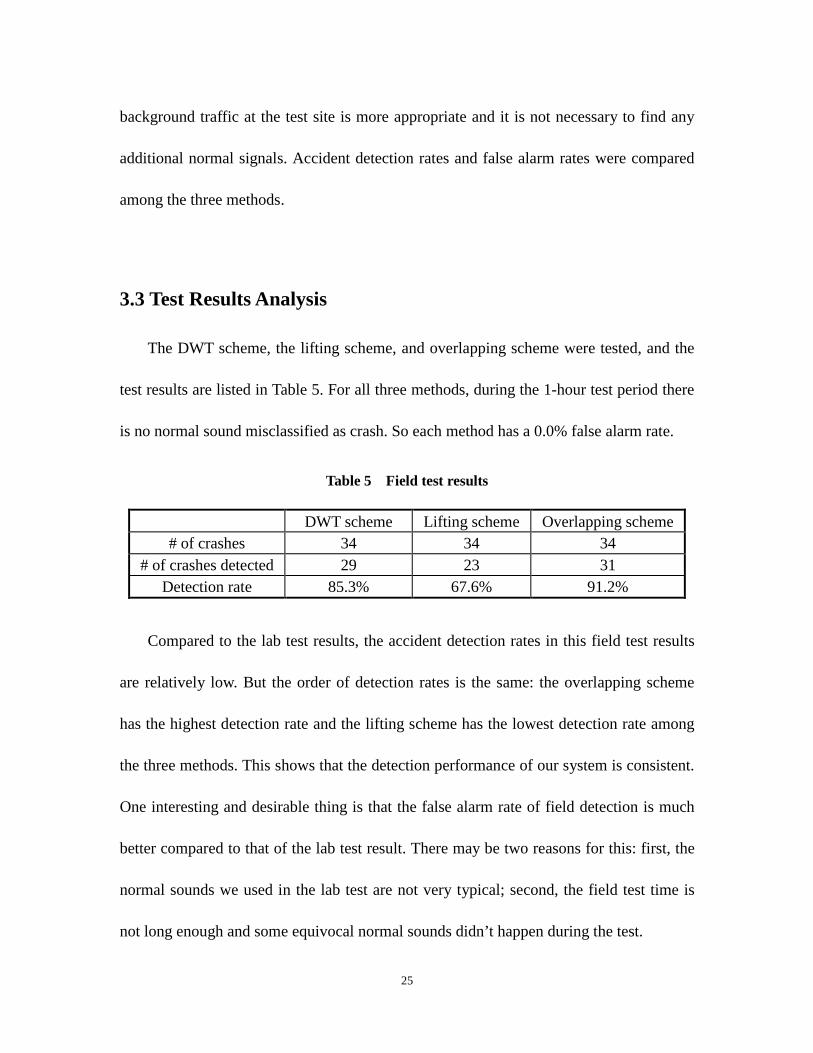
Figure 13 shows a block diagram of the real-time testing system using MATLAB
Simulink. Figures 14-16 show the windows of the real time system using Simulink in
MATLAB. Figure 14 is the actual system that is being used. Figure 15 shows a plot of an
incoming signal, and Figure 16 is the final output which is a plot of the signal being
labeled as “crash.”
Figure 13 Block diagram of real-time testing system using MATLAB Simulink
Microphone
Extigy sound card
MATLAB Simulink
Label crash or non-crash
Feature extraction
Feature optimization
Statistical classifier
23
Figure 14 Real-time detection system using MATLAB Simulink
Figure 15 Plot of incoming signal
24
Figure 16 Plot of a signal classified as “crash”
3.2 Test Design
The test was carried out at the intersection of Montgomery and Veterans Memorial
Highway, a very busy signalized urban intersection. The traffic consisted of passenger
cars, vans, pick-up trucks, and tractor trailers. The test time was between 14:00 pm and
15:00 pm on May 14, 2004.
Since it is too difficult to catch a real accident occurring during the test, we played 34
crash signals at the intersection to mimic the true accident scenario with the actual
background sound. These crash signals are identical with the data we used in the lab test
of the overlapping scheme. We didn’t prepare any normal signals, because the
25
background traffic at the test site is more appropriate and it is not necessary to find any
additional normal signals. Accident detection rates and false alarm rates were compared
among the three methods.
3.3 Test Results Analysis
The DWT scheme, the lifting scheme, and overlapping scheme were tested, and the
test results are listed in Table 5. For all three methods, during the 1-hour test period there
is no normal sound misclassified as crash. So each method has a 0.0% false alarm rate.
Table 5 Field test results
DWT scheme Lifting scheme Overlapping scheme # of crashes 34 34 34
# of crashes detected 29 23 31 Detection rate 85.3% 67.6% 91.2%
Compared to the lab test results, the accident detection rates in this field test results
are relatively low. But the order of detection rates is the same: the overlapping scheme
has the highest detection rate and the lifting scheme has the lowest detection rate among
the three methods. This shows that the detection performance of our system is consistent.
One interesting and desirable thing is that the false alarm rate of field detection is much
better compared to that of the lab test result. There may be two reasons for this: first, the
normal sounds we used in the lab test are not very typical; second, the field test time is
not long enough and some equivocal normal sounds didn’t happen during the test.
26
Comparisons between Tables 1, 2, 3 and 5 also show that the lab test results of
detection rate are obviously better than the field test results. There are also two possible
reasons for this. First, the accident sounds we played were recorded from real accidents
happening at intersections, and they already included the background sound. When we
played these accident sounds during the test, the inputs to our detection system were not
only the recorded accident sound, but also the pure traffic background sound at that
intersection. This combined input sound changed the feature of recorded accident sound,
thus reducing the detection rate. Second, when we were doing the real-time field test,
the on-vehicle speaker was used to play the accident sound. It is very difficult to adjust
the volume of the speaker to an optimal point that can best balance the accident sound
against the pure background traffic sound. So sometimes the volume of accident sounds
was relatively higher than the background traffic sound, and sometimes the volume of
accident sounds was inundated by the background traffic sound. The features we
extracted from these input sounds also varied consequently with those changes and may
have caused the deterioration of the detection rates.
The crash signals we used in real-world field testing were recorded at intersections
and have already included the background sound. While in the lab environment it is
very quiet and the recorded sounds, which are the actual sounds as the crashes occurred,
can be considered as the only inputs to the detection system. Because of this, we have a
reason to believe that the detection results from the lab tests better represent the true
27
performance of our detection algorithms. Although the detection rates of field test are
inferior to the lab test results, it again showed the benefits of using the overlapping
scheme since with the overlapping scheme the system was still be able to achieve a 91%
detection rate even under adverse conditions. The real performance of detection rate in
the field is yet to be defined. Installing the system at intersections with extremely high
accident rates may seem to be a solution, but at this stage we do not have the hardware in
place to conduct an actual field test of an extended duration.
As expected we were not able to “catch” any live accidents during the field testing.
The field testing results however showed that false alarm was not an issue, and that is
very encouraging. High false alarm rate is a common killer of the automated accident
detection system, as people will get impatient and lose confidence if the system false
alarms are frequent.
28
CHAPTER 4. SYSTEM ARCHITECTURE AND
COMMUNICATIONS SYSTEM
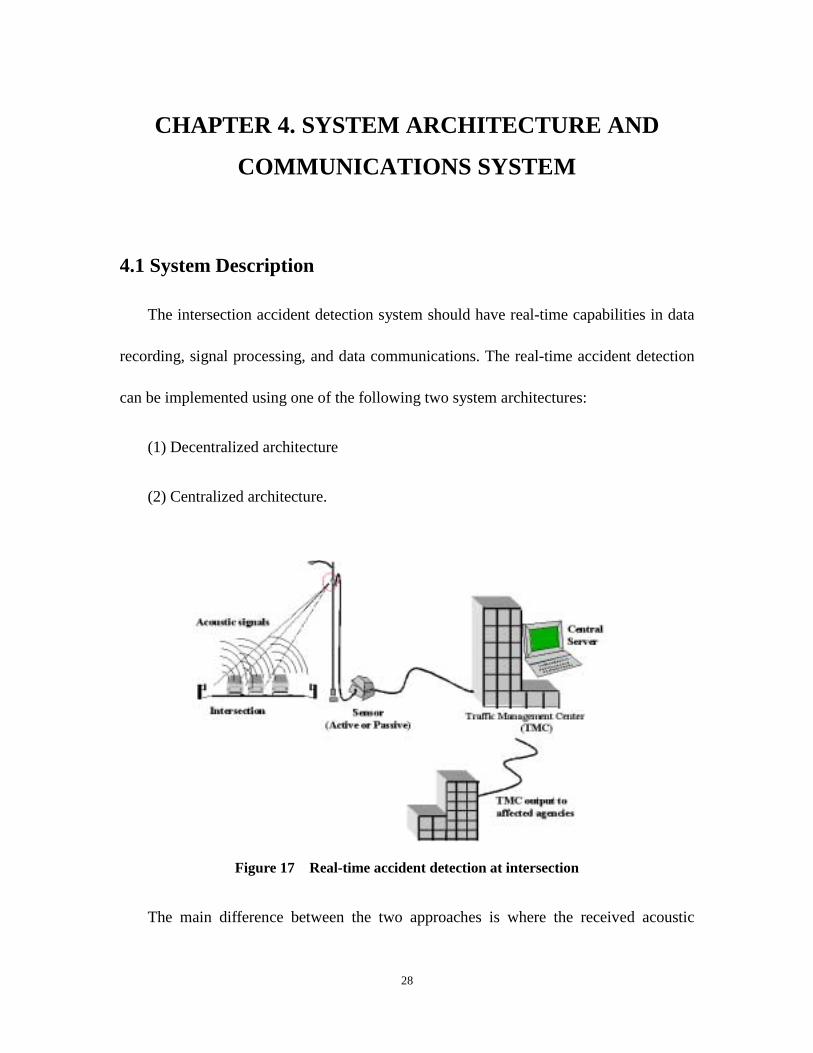
4.1 System Description
The intersection accident detection system should have real-time capabilities in data
recording, signal processing, and data communications. The real-time accident detection
can be implemented using one of the following two system architectures:
(1) Decentralized architecture
(2) Centralized architecture.
Figure 17 Real-time accident detection at intersection
The main difference between the two approaches is where the received acoustic
29
signals will be processed and what data will be transmitted to the traffic management
center.
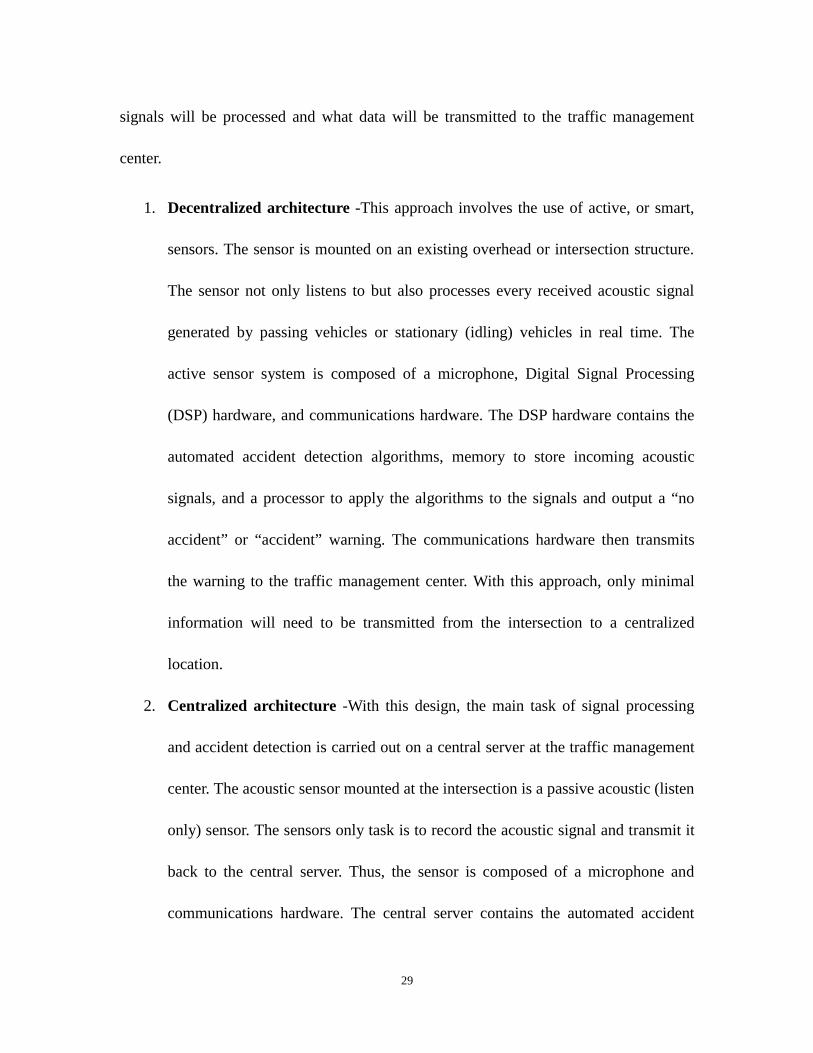
1. Decentralized architecture -This approach involves the use of active, or smart,
sensors. The sensor is mounted on an existing overhead or intersection structure.
The sensor not only listens to but also processes every received acoustic signal
generated by passing vehicles or stationary (idling) vehicles in real time. The
active sensor system is composed of a microphone, Digital Signal Processing
(DSP) hardware, and communications hardware. The DSP hardware contains the
automated accident detection algorithms, memory to store incoming acoustic
signals, and a processor to apply the algorithms to the signals and output a “no
accident” or “accident” warning. The communications hardware then transmits
the warning to the traffic management center. With this approach, only minimal
information will need to be transmitted from the intersection to a centralized
location.
2. Centralized architecture -With this design, the main task of signal processing
and accident detection is carried out on a central server at the traffic management
center. The acoustic sensor mounted at the intersection is a passive acoustic (listen
only) sensor. The sensors only task is to record the acoustic signal and transmit it
back to the central server. Thus, the sensor is composed of a microphone and
communications hardware. The central server contains the automated accident
30
detection algorithms, memory to store incoming acoustic signals, and a processor
to apply the algorithms to the signals and output a “no accident” or “accident”
warning. Once an accident is detected, a warning will be presented to the
operator and then sent to affected agencies. By using centralized architecture,
the local communications hardware has to periodically transmit the audio signal
recorded at the intersection to the central server.
The decentralized design has particularly high operational requirements for the active
sensors. Almost all of the signal processing is completed at the intersection. Each
intersection has to retrieve data, video, and voice communications instead of a shared
common communications architecture as in a centralized approach. However, the
volume of transmitted data from the acoustic sensor to the central server is very low.
Therefore, this approach has a very low requirement for the performance of the
communications network and the central server. On the contrary, the centralized design
has particularly high performance requirements for the communications network and the
central server. A large volume of unprocessed signals needs to be transmitted from the
acoustic sensor through the communications network, and then be processed
simultaneously by the central server. The pros and cons of the two designs will be
compared based on existing infrastructure deployment, cost, performance, reliability, and
scalability.
31
4.2 Communications Mechanisms
Transmission of data between intersections and the traffic management center is an
important component of the Real-time Intersection Accident Detection System.
Communications technologies are comprised of wireline and wireless solutions. One
way and two-way communications links that can be evaluated include wide area wireless
communications technologies such as cellular phone, broadcast radio and TV, radio
broadcast digital services (RBD), digital spread spectrum radio, satellite communications,
etc. Wireline communications technologies can also be evaluated such as dial-up public
telephone, Integrated Services Digital Network (ISDN), Synchronous Optical Networks
(SONET), etc.
The current research on communications mechanisms provides investigation on
Siemens OTN systems, which can incorporate voice, video, and data information from
sensors and other field devices located at intersections and transfer the signals seamlessly
via high-speed multi-megabit fiber optic cables. Research on wireless communications
mechanism for the same purpose has also been conducted. The final selection on the
communications infrastructure will depend on the cost of the deployment, scalability of
the network, performance of the communications, the design structure and capacity
requirements, as well as the ability to leverage the existing communications networks.
32
4.2.1 Wireline Communications System – Open Transport Network
(OTN)
4.2.1.1 OTN Architecture
MDOT currently is using Siemens Open Transport Network (OTN) as the fiber optic
communications network in its transportation systems. OTN is a fiber-based system
SONET for voice, data, LAN and video information. Its architecture is based on 4
major system components:
• The fiber optic backbone, on which all information of the equipment is
multiplexed;
• The OTN nodes, which form the access ports to the network;
• The interface cards, which provide the user access to the system;
• The OTN Management System (OMS) for central network management.
Among the 4 system components, the interface cards provide communications
between the optical rings and the applications we are interested in. OTN has 4 different
interface cards for data applications, voice applications, Local Area Networks, and video
applications, respectively.
1. Data applications: RS232, RS422, RS485, G703, V-series, point-to-point,
multipoint, multidrop;
2. Voice applications: 30B+D, UP0, S0, G703 Digital, E & M, Public Address,
2Mbps, analog (2 / 4 wire);
33
3. Local Area Networks: Ethernet IEEE 802.3;
4. Video: PAL/NTSC, CVBS, M-JPEG Compression, Fixed/Switched
An OTN network is built up with nodes interconnected by a dual fiber optic ring. A
network can consist of up to 250 nodes. It can extend over a couple of hundred meters up
to 1,243 miles and more. The possible geographical extensiveness of an OTN network
means a saving on modems and signal amplifiers. The OTN system can offer a capacity
of 150 Mbps (OTN-150), 600 Mbps (OTN-600) and 2.5 Gbps (OTN-2500).
Communications between OTN nodes in the ring is based on Time Division Multiplexing
(TDM), allowing multiple users sharing the transmission medium on the ring. TDM
divides the time domain into repetitive periods called frames, which are subdivided into
time slots. These time slots are one bit long. The time slots are allocated to the user
applications during which they can transmit user data. OTN-2500 system has a frame
length of 31.25 µs (one fourth of the 125 µs frame used by telephone communications)
and each frame contains 73,728 bits. Thus every time slot in a frame corresponds to a 32
kbps (=1 bit/31.25µs) system bandwidth. The bandwidth allocation to each application
has to be on increments of 32 kbps. OTN guarantees direct access to the network at any
time, avoiding long access delay and enabling real time applications. Each application
has its own virtual connection because the transmission capacity on the backbone is
allocated in a semi-permanent way, which means the allocated bandwidth is always
available for that application, independently of other applications running on the network.
New applications can be realized by simply adding additional interface cards, which are
34
allocated part of the available bandwidth of the backbone.
4.2.1.2 MDOT OTN System Implementation
The existing MDOT OTN network is OTN-2500 based and supports 2.5 Gbps
bandwidth. For the time being, the network only consists of one node and is expected to
expand to 2-4 nodes in the near future. Each node of the MDOT OTN system carries 2
fibers in and 2 fibers out. Each fiber has a bandwidth of 2.5 Gbps. Its double ring
structure and redundant power and optic controls provide a highly resilient
communications system. This structure allows the network to work around cable breaks
and product failures, without affecting the devices connected to the nodes, thus achieving
optimum network availability. The major application running in the current OTN network
is video application. The OTN-2500 system is actually sufficient to support all present
and future applications. The variety of the applications it supports is a unique feature of
the OTN system. It enables the network to handle voice, data and video services all by
one network via a single, reliable communications backbone. OTN makes sure all the
information gets to the other end in a fast, transparent and reliable way.
The real-time intersection accident detection system is based on a crash detection and
verification algorithm, with an audio-based component for automated crash detection
using the approach described in [2], along with a video-based component for crash
verification performed at the traffic management center after a crash warning is activated
35
by the detection system. This combined audio-detection/video-verification mechanism
will be able to provide real-time crash warnings to the operators through its fast audio
detection capability while it can also identify, through the video cameras, the nature and
severity of the crash, which in turn determines the requirements of incident responses.
The multimedia capability of the OTN network provides the bandwidth needed for the
data + video transmission, facilitates direct, real-time access to the network, and ensures
accurate, responsive, convenient detection on the accidents at the intersections.
4.2.1.2.1 Real-Time Audio-Based Accident Detection
In order to set up a service between interface ports of different nodes, bits are
allocated in the TDM time frame. This time slot allocation reserves a permanent virtual
connection between the two ports, thus providing a guaranteed transmission path between
the communicating devices. The number of time slots allocated to continuous accident
detection signal transmission depends on the bandwidth needed. The typical frequency
of the audio detection signal is 11,025 Hz. The analog signal is sampled at 22,050 Hz and
8-bit resolution, resulting in 177 kbps payload data rate at each node. Real-time audio
signal transmission from all 250 nodes (maximum) will generate about 48-56 mbps data
traffic, which will not impose too much bandwidth burden on an OTN-2500 network. In
the decentralized scenario, high processing power sensors have to be deployed at all
intersections, which may lead to both scalability and reliability issues. Thus the
36
centralized architecture is the desirable option for accident detection at intersections if the
transmission backbone is based on an OTN-2500 system.
The audio sensor at each intersection can be directly connected to the OTN data
interfaced card. For an OTN RS232 data card, it can carry 12 ports and the maximum
speed per port is 100 kbps. An OTN RS485 data card can be programmed to support
different data rates up to 2 Mbps. Furthermore, an OTN system is also able to support
structured G.703 service, which transmits data rates ranging from 64 kbps to 2.048 Mbps,
supplied in 64 Kbps increments. Thus there are several options for transferring the
real-time accident detection signals from the intersections to the TMC:
1. Split the traffic signal into several ports on a low speed RS232MM card or
2. Program a RS485 card to achieve the data rate for the accident detection signal
transmission; or
3. Transmit it through a structured G.703 high speed data card.
Among the 3 possible options, RS485 features the most suitable interface card to
carry the accident detection signals. The RS485 interface card is designed to interconnect
RS485 busses via OTN. OTN allows RS485 networks to be created over large distances,
without the use of repeaters. Each RS485 card has 3 independent ports. Payload data
rates are programmable into the following values: 1.2 kbps, 2.4 kbps, 4.8 kbps, 9.6 kbps,
19.2 kbps, 38.4 kbps, 64 kbps, 93.75 kbps, 128 kbps, 187.5 kbps, 256 kbps, 384 kbps,
500 kbps, 1.5 Mbps, 2 Mbps. Among these values, 187.5 kbps fits into the need of the
37
required data rate. If the additional transmission overhead is counted, the number of bits
per frame reserved for each data connection is 12. Thus the total bandwidth required for
real-time accident detection at all 250 nodes will be 12*250=3,000 bits per frame, which
is about 3,000/73,728 = 4% of total capacity. The communications backbone has
sufficient bandwidth to support centralized real-time audio-based accident detection for
all the intersections.
The binary signals presented to the interface cards are inserted into the frame and
further multiplexed into two outgoing optical fibers, with each running in the opposite
direction providing 100% self-healing capability. In order for the control center to
identify the signals from different intersections, the OTN system has its proprietary
addressing format. The address is provided in the hierarchical structure such as <node
number, card number, port number>. Based on the address information, the TMC can
accurately identify where the signals come from (from which intersection and from which
application) and route them to the corresponding TMC unit promptly for further
processing.
4.2.1.2.2 Video-Based Accident Verification
Coding and compression techniques (e.g. M-JPEG) have provided the ability to
reduce video transmission bandwidth requirements, thereby trading bandwidth for image
quality. It is assumed that each video connection consumes 10-12 Mbps bandwidth
38
without compression. The network delivers acceptable video quality at a compressed data
rate of 2 Mbps (e.g., using MPEG- 4). Due to high bandwidth requirements on each video
connection, TMC is not expected to support concurrent video monitoring on all sites.
Imagine if the OTN system scales to 250 nodes and each node is equipped with real-time
video surveillance. A bandwidth of 250*12 Mbps = 3.0 Gbps is required, which is already
beyond the maximum OTN-2500 capacity of 2.5 Gbps. The suitable interface card for the
video application is the MPEG interface card. All MPEG cards have 4 video inputs, each
with their own codecs, which can be transmitted simultaneously. The same MPEG card
can also be used as an output board, which then has 4 independent output ports. The
MPEG cards can offer a higher compression ratio than the M-JPEG coding, allowing a
higher number of video connections to be transmitted through the same OTN.
We proposed the audio-detection/video-verification mechanism, which provides
real-time audio signal monitoring but only activates video signal transmission when an
accident alarm is received. In this way, the OTN network capacity will not be over
engineered. This is achieved by the unique video switching capability provided by the
OTN system. Instead of monitoring all the nodes (e.g., 250) simultaneously, the traffic
monitor center can switch among different remote site cameras and conduct time-sharing
monitoring. A small number (less than 250) of high quality video buses are
programmed on OTN, among which some are reserved for the advanced digital video
detection and recognition. The bandwidth needed per video bus relies on the following
39
parameters: color depth, horizontal resolution, vertical resolution, and frames per second.
The bandwidth per video bus on an MPEG card can be configured from 1 Mbps to 12
Mbps, depending on the above parameters. 2 Mbps is adequate for most video
applications. Each video bus is associated with a video output port of an MPEG card. The
operator can dynamically connect any camera from any intersection to any video output.
This video switching capability on OTN provides the TMC operators with full access to
all cameras without the burden of designing a fixed video network of matrices and
switches or the burden of transmitting overwhelming video traffic.
4.2.2 Wireless Communications System
Wireless communications can extend the access ranges for the intersections that do
not have easy access to the existing OTN communications infrastructure. Relying on
wireless medium, data collection devices/sensors are electronically linked via wireless
communications to a central base station server. Each sensor is equipped with a wireless
modem to convert computer signals to radio waves, which can be propagated via the
wireless medium to the base station. The base stations can be connected to the MDOT
TMC through wireline communications medium, e.g., the leased telephone lines. A
wireless modem at the base station then converts the radio waves back to computer
signals for further wireline transmission. Due to the poor transmission quality and limited
bandwidth availability on the wireless medium, decentralized architecture is preferred so
40
that a minimum amount of signals will be carried through the unreliable and precious
wireless channels. There are several ways to implement the wireless communications in
the real-time accident detection systems between the intersections and the base stations.
4.2.2.1 3G/4G Cellular Communications
The support of continuous transmission of the audio accident signals through the
cellular network is almost impossible since there is no leased spectrum in the commercial
cellular networks. By using the decentralized scheme, we assume only the alarm signal
activates the transmission to the control center. Whenever an accident is detected, the
local equipment will dial in and transmit one bit or two bits alarm signal to the base
station, which propagates the alarm signals to the control center. Currently 3G wireless
communications can support data rates up to 384 kbps. The use of cellular spectrum for
erratic transmissions and high bandwidth video signals does not make the best or most
efficient use of cellular communications infrastructure. So, further research needs to be
conducted on how to carry the video based accident verification signals through the
cellular networks. Future 4G cellular technology will be able to support data rates up to
500 Mbps, which is 250 times the maximum data rate promised for today’s cellular
network and makes the video transmission possible by then.
41
4.2.2.2 220 Mhz Land Mobile Communications
The FCC recently reallocated the 220 Mhz land mobile spectrum, resulting in many
new channels, many of which have been auctioned to the public. The FHWA obtained
temporary rights to five narrowband (in 5 kHz) frequency pairs in this band, which were
set aside for ITS experimentation purposes. The permission for exclusive access to any of
these 5 frequency pairs needs to be further applied. Due to the limitations of the
bandwidth provided by the wireless medium, high-efficiency modems are needed in order
to deal with impairments experienced in the wireless channel if the same quality of
transmission is required. This represents a key technical challenge faced in the system.
Fortunately, nowadays modulation and demodulation schemes used in the 220 Mhz
frequency band can eliminate the noise along the wireless transmission, making the
quality of transmission comparable to that of the wireline communications. The
wireless modems at the intersections are polled periodically and pass audio signals to the
transceivers located together. The base stations will pick up the wireless signals from
the transceivers and then will forward the signals to the control center, through the leased
telephone lines. The FHWA spectral allocation to ITS has not received much attention,
and this may be due to the fact that certain ITS applications, such as video transmission,
require data rates which cannot be supported on narrowband channels. More research
needs to be conducted in this area. The overall performance and cost effectiveness of
using wireless communications in this system can be evaluated through the next phase of

42
the project.
43
CHAPTER 5. FEASIBILITY OF REAL-TIME
IMPLEMENTATION
The feasibility of real-world implementation was evaluated by examining the
real-time testing performance of the system. We also looked into a number of other
implementing issues, and a summary of the feasibility study is provided in this chapter.
5.1 Detection Accuracy
System reliability and performance is the most important issue. If a system shows a
low detection rate and a high false alarm rate in lab testing, the eventual implemented
system will more than likely fail.
Our system has showed a high detection rate in lab testing and limited field testing.
Because it is very difficult to obtain crash signals, all these tests were carried out based
on the current database with a limited number of crash signals, which may not be able to
cover all typical crash sound features and thus could affect the accident detection rate.
However, eventually more and more newly detected crash signals will be added into the
database and that will definitely help expand and improve the crash signal database and
further improve the accident detection rate. A low false alarm rate in lab testing and 0
false alarm rate in limited field testing is very encouraging. Furthermore, just like the
case that the detection rate will improve with the expansion of the crash database, the
44
false alarm rate will also be improved as we add more and more normal crash signals into
the database. Based on the system performance from multiple stages of testing, we feel
confident that the system will have good reliability and performance when eventually
implemented in the field.
5.2 Algorithms’ Computation Time
We did the computational time testing using the same laptop as we used in the
overlapping lab test (Section 2.2.2). The result showed that it takes on average 0.2
seconds to process one 3-second signal. That means in one 3-second sampling period we
can analyze up to 15 input signals using the DWT scheme. In other words, using an
ordinary laptop, we can process accident data from 15 intersections simultaneously with
the DWT scheme, 5 intersections with the overlapping scheme, and many more
intersections with the lifting scheme.
Currently, the detection algorithms are coded in MATLAB. Although MATLAB is
user friendly and very easy to use, the code is not very efficient. The code written by
other languages such as Visual C++ can be much faster. In addition, there may also be
several other possible ways to improve the algorithm coding that can make the algorithm
even faster. As computers become more affordable and much more powerful, we do not
think computation time will become a major problem for real-world system
implementation.
45
5.3 Communications Feasibility
Currently MDOT has already installed an OTN-2500 system that supports 2.5 Gbps
bandwidth. This system is not fully utilized, and we can make use of this system to
transmit audio traffic signals from intersections to the traffic management center. Take
centralized system architecture as an example, as it has a higher requirement on data
communications. As illustrated in section 4.2.1, assuming the analog audio signal is
sampled at 22 Khz and 8 bit resolution, it results in 176 kbps audio data traffic at each
node. Considering the upper bound of the system is 250 intersections, the maximum
audio data transmission demand is only 44 Mbps, which is really negligible compared to
the 2.5 Gbps system capacity. Besides, the system also has a unique feature of being
able to handle voice, data and video services all by one network via a single, reliable
communications backbone. Along with OTN system’s dynamic video switching
capability, we can realize the proposed audio-detection/video-verification mechanism
under the current system’s data transmission capacity.
The current deployed OTN-2500 system provides a very good basis for the
implementation of Real-Time Accident Detection System, so we do not need to reinvent
the wheel. This will significantly reduce the cost of accident detection system
implementation. Besides, we can integrate the Real-Time Accident Detection System
into the current traffic surveillance system, and make full use of the unused capacity of
OTN-2500 system to transmit traffic sound data and use the traffic surveillance system to

46
confirm the detection results of our accident detection system.

47
CHAPTER 6. SYSTEM IMPLEMENTATION
RECOMMENDATIONS
This chapter documents recommendations for system implementation.
Recommended configurations of the real-world system are described in the following
sections.
6.1 System Architecture
We recommend using the centralized system architecture. The reasons are the
following:
1. Normally the centralized architecture is more economic than the decentralized
system. Providing signal processing capability at intersection level sometimes
means higher maintenance costs and lower reliability. On the contrary, simple
sensor with basic signal collection and transmission abilities requires less
maintenance and can be more robust.
2. Another reason is that the transmission of all the sampled raw audio signals at
most takes less than 4% of the total system communications capacity, therefore
there is no need to spend extra money to reduce the data transmission demand
while paying a lot more for local signal processing.
48
6.2 Data Transmission
We recommend that the wireline data transmission be used for the following reasons:
1. Wireline method is compatible with the current MDOT OTN-2500 system.
2. The current wireless communications methods can not fully support our
audio-detection/video-verification mechanism and the centralized system
architecture. More research still needs be done on how to use the current wireless
technologies to carry video-based traffic signal.
However, wireless communications may still be useful if the existing wireline
communications facilities are not reachable, especially in some remote areas. Because
of the relatively poor transmission quality and limited bandwidth availability on the
current wireless medium, we suggest using decentralized architecture at these
intersections so that the data transmission demand can be significantly reduced.
6.3 Algorithms
We recommend using the overlapping scheme for two main reasons:
1. A severe accident can cause inestimable property and life loss, and can also cause
serious traffic congestion if the accident is not properly handled in time. For that
reason, achieving high detection rate is always a very high priority. The
overlapping scheme clearly provides the highest accident detection rate among
49
all three methods investigated and should be used.
2. As discussed in Section 5.2, even an ordinary laptop can handle the signal
sampling, processing and classification procedure in real-time for a street system
of reasonable size with multiple intersections. The relatively long computation
time associated with the overlapping scheme should not be a concern for
implementation.
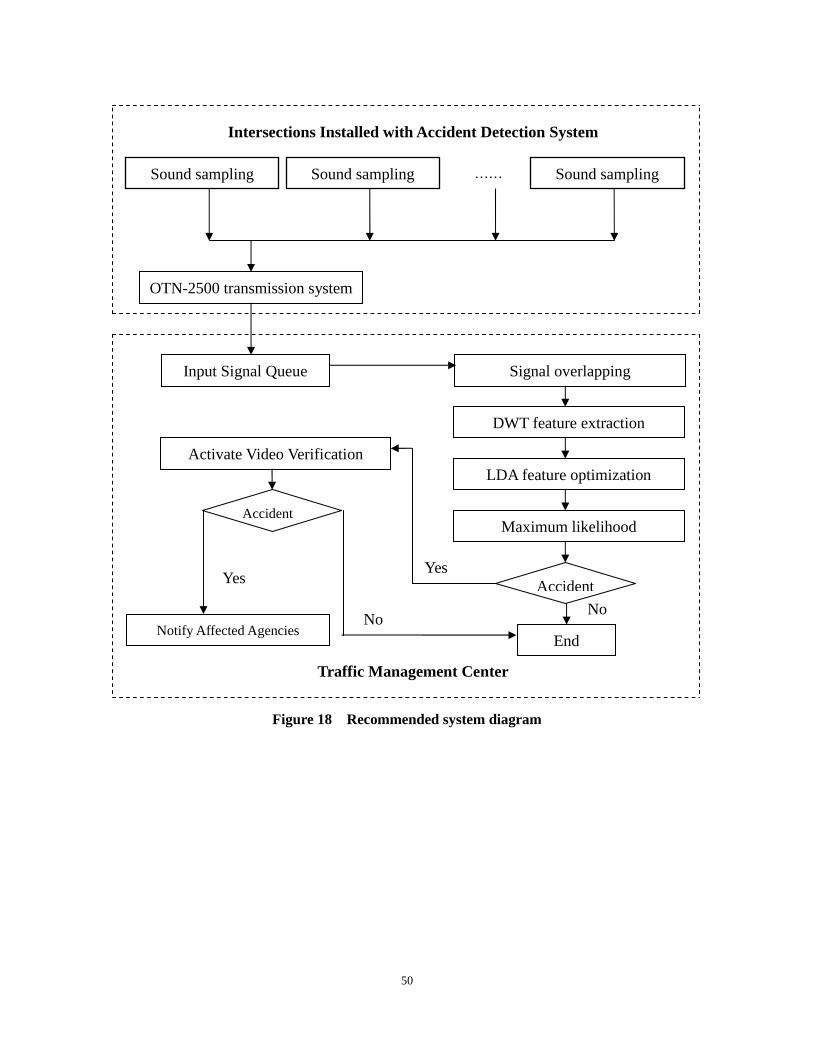
6.4 Summary of Recommended System Configuration
In summary, the recommended system configurations are as follows:
• System Architecture: Centralized Architecture
• Data Transmission Method: Wireline Transmission or more specifically,
Siemens OTN-2500 system
• Algorithm: DWT + Overlapping Scheme
A recommended real-time accident detection system is illustrated in Figure 18.
50
Figure 18 Recommended system diagram
Traffic Management Center
Intersections Installed with Accident Detection System
Sound sampling Sound sampling ……
OTN-2500 transmission system
Signal overlapping
DWT feature extraction
LDA feature optimization
Maximum likelihood
End
Accident
No
Activate Video Verification
Yes
Accident
No
Yes
Sound sampling
Input Signal Queue
Notify Affected Agencies
51
CHAPTER 7. SUMMARY AND FUTURE WORK
7.1 Summary
In this research, we first went through the detection algorithms investigated in the
previous phase of the project and focused our efforts on the major real-time
implementation issues such as detection algorithm selection and improvement, real-time
system performance, system architecture and communications system, and
implementation feasibility.
Two detection algorithm improvements were proposed, namely the lifting scheme
and the overlapping scheme. The lab testing and field testing were performed in real time
and the results were compared with the baseline algorithm from the previous research
phase. Among the three investigated schemes, the overlapping scheme has the highest
detection rate and also the most computation time; the lifting scheme has the lowest
detection rate and the least computation time; and the detection rate and computation
time of the DWT lies between the overlapping scheme and the lifting scheme.
Two system architectures were investigated, which are centralized and decentralized
respectively. We also investigated MDOT’s current OTN-2500 communications system
and various communications methods, including wireline system, 3G/4G cellular system
and 220 Mhz land mobile communications system. The system architecture is closely
linked to the communications method. The centralized system architecture has a higher
52
communications requirement for the communications network than the decentralized
architecture, while the decentralized architecture has a higher requirement for the sensor
installed at intersections than the centralized architecture.
Finally a recommendation was made for the implementation of the Real-Time
Automated Accident Detection System at Intersections. The recommended system
configurations are a Centralized Architecture with Wireline Transmission, with
DWT+Overlapping Scheme as the signal feature extraction method.
7.2 Future Work
This research provides a preliminary study of the implementation feasibility of a
Real-Time Accident Detection System at Intersections. In order to move the project into
the implementation phase, there is still much work that needs to be accomplished.
1. Software development and integration: We need to design a software package
to integrate the detection algorithms and interface with traffic management
control center software and communications data flow. The package should be
user friendly and open to future updates and changes.
2. Communications network design: Although we have accomplished a
preliminary study of the communications system and made our recommendation,
there is still lot of work ahead, such as the network topology design,

53
communications algorithms design, and communications quality and reliability
analysis.
3. Implementation cost estimation: Even though we envision the system as an
inexpensive one there is still a lot of work left in order to assess the
implementation cost of a system of certain size. The cost will largely depend
upon the cost of component integration and communications.
4. Implementation testing: The implementation testing will help us collect data on
how the detection algorithm and communications network work together.
Specifications such as the detailed hardware components and installation
requirements are all essential to the success of a large-scale system
implementation and need to be investigated. One example would be to determine
the type of weather-proof microphone and its optimal placement location.
54
REFERENCES [1] Zhang Y, R. Hu, L.M. Bruce, N. Balraj, and S. Yu (2004). “Development of Real-Time
Automated Accident Detection System at Intersections”. Presented at the Annual Conference of the Transportation Research Board, Washington D.C..
[2] Zhang Y, and L.M. Bruce (2004). “Automated Accident Detection at Intersections”. Research Report FHWA/MS-DOT-RD-04-150, Mississippi Transportation Research Center, Starkville, MS
[3] Bruce, L.M., N. Balraj, Y. Zhang, and S. Yu (2003). “Automated Accident Detection in Intersections via Digital Audio Signal Processing”. Transportation Research Review, Journal of the Transportation Research Board
[4] Wim Sweldens and Peter Schroder. “Building your own wavelets at home”. http://cm.bell-labs.com/who/wim/papers/athome.pdf. Accessed on Aug 8, 200
[5] Zeng Jianfen, Ma Zhengming (2001). “Lifting scheme and Image coding: Average Interpolating Image Coding”. International Symposium on Signal processing and its Applications(ISSPA), Kuala Lampur, Malaysia, 13-16 August