Embed Size (px)
Citation preview
Mississippi Transportation Research CenterResearch Center
EFFECT OF END-POINT COMPACTION ON SUPERPAVE
HOT MIX ASPHALT (HMA) MIX DESIGNS
REPORT NO. FHWA/MS-DOT-RD-03-145
Prepared by Dr. Thomas D. White and Dr. M. Shane Buchanan
Mississippi State University Department of Civil Engineering
Construction Materials Research Center (CMRC)
January 9, 2004
Mississippi Transportation
U.S. Department of Transportation Federal Highway Administration
Mississippi Department of Transportation
i
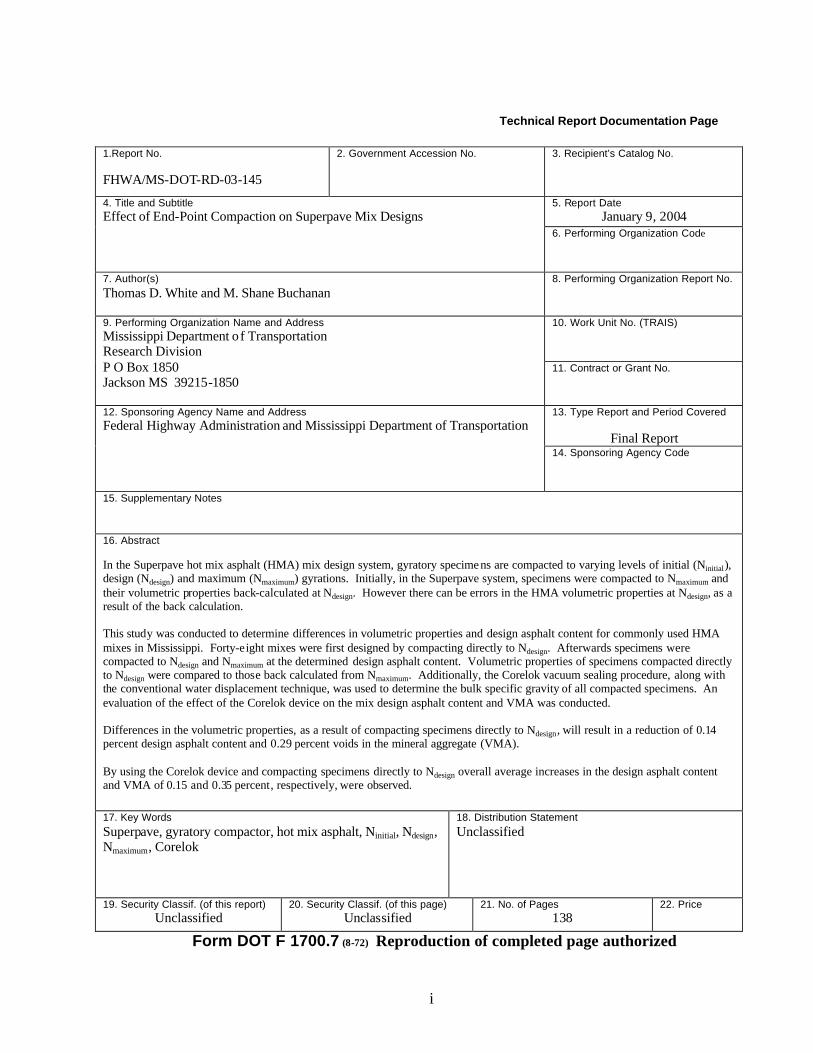
Technical Report Documentation Page
1.Report No. FHWA/MS-DOT-RD-03-145
2. Government Accession No.
3. Recipient’s Catalog No.
5. Report Date
January 9, 2004 4. Title and Subtitle Effect of End-Point Compaction on Superpave Mix Designs
6. Performing Organization Code
7. Author(s) Thomas D. White and M. Shane Buchanan
8. Performing Organization Report No.
10. Work Unit No. (TRAIS)
9. Performing Organization Name and Address Mississippi Department of Transportation Research Division P O Box 1850 Jackson MS 39215-1850
11. Contract or Grant No.
13. Type Report and Period Covered
Final Report
12. Sponsoring Agency Name and Address Federal Highway Administration and Mississippi Department of Transportation
14. Sponsoring Agency Code
15. Supplementary Notes
16. Abstract In the Superpave hot mix asphalt (HMA) mix design system, gyratory specime ns are compacted to varying levels of initial (Ninitial), design (Ndesign) and maximum (Nmaximum) gyrations. Initially, in the Superpave system, specimens were compacted to Nmaximum and their volumetric properties back-calculated at Ndesign. However there can be errors in the HMA volumetric properties at Ndesign, as a result of the back calculation. This study was conducted to determine differences in volumetric properties and design asphalt content for commonly used HMA mixes in Mississippi. Forty-eight mixes were first designed by compacting directly to Ndesign. Afterwards specimens were compacted to Ndesign and Nmaximum at the determined design asphalt content. Volumetric properties of specimens compacted directly to Ndesign were compared to those back calculated from Nmaximum. Additionally, the Corelok vacuum sealing procedure, along with the conventional water displacement technique, was used to determine the bulk specific gravity of all compacted specimens. An evaluation of the effect of the Corelok device on the mix design asphalt content and VMA was conducted. Differences in the volumetric properties, as a result of compacting specimens directly to Ndesign, will result in a reduction of 0.14 percent design asphalt content and 0.29 percent voids in the mineral aggregate (VMA). By using the Corelok device and compacting specimens directly to Ndesign overall average increases in the design asphalt content and VMA of 0.15 and 0.35 percent, respectively, were observed. 17. Key Words Superpave, gyratory compactor, hot mix asphalt, Ninitial, Ndesign, Nmaximum, Corelok
18. Distribution Statement Unclassified
19. Security Classif. (of this report) Unclassified
20. Security Classif. (of this page) Unclassified
21. No. of Pages 138
22. Price
Form DOT F 1700.7 (8-72) Reproduction of completed page authorized
ii
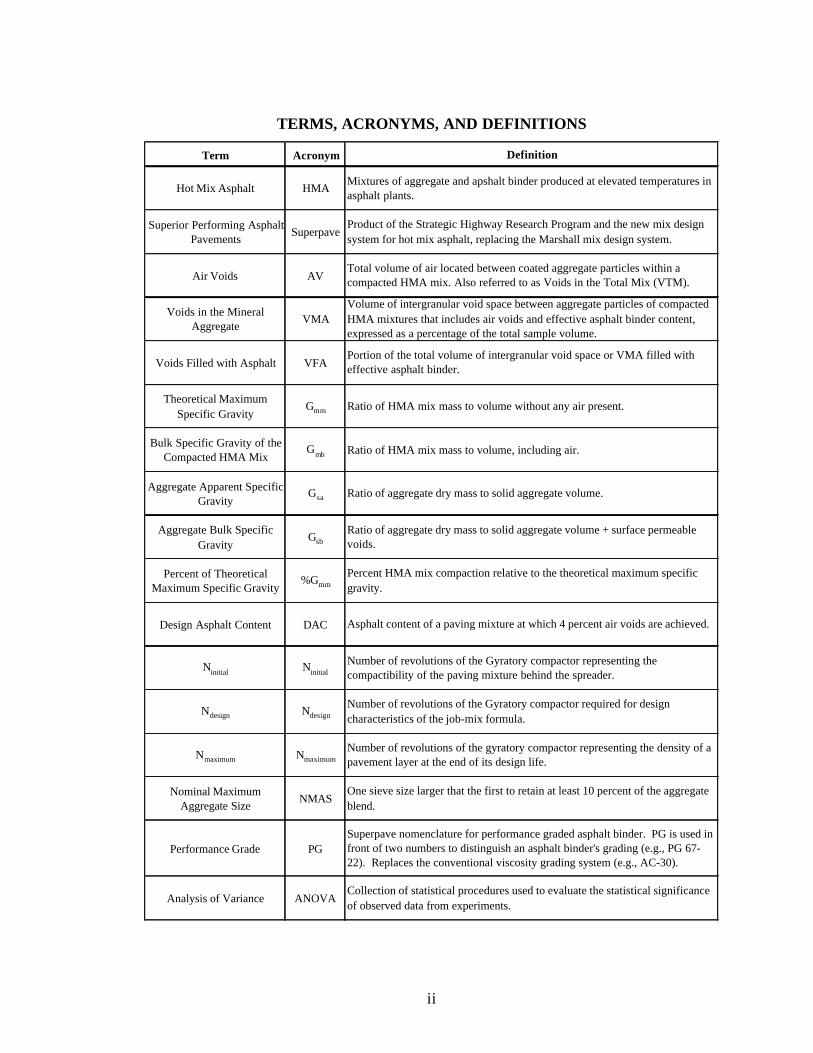
TERMS, ACRONYMS, AND DEFINITIONS
Term Acronym
Hot Mix Asphalt HMA
Superior Performing Asphalt Pavements
Superpave
Air Voids AV
Voids in the Mineral Aggregate
VMA
Voids Filled with Asphalt VFA
Theoretical Maximum Specific Gravity
Gmm
Bulk Specific Gravity of the Compacted HMA Mix
Gmb
Aggregate Apparent Specific Gravity
Gsa
Aggregate Bulk Specific Gravity
Gsb
Percent of Theoretical Maximum Specific Gravity
%Gmm
Design Asphalt Content DAC
Ninitial Ninitial
Ndesign Ndesign
Nmaximum Nmaximum
Nominal Maximum Aggregate Size
NMAS
Performance Grade PG
Analysis of Variance ANOVACollection of statistical procedures used to evaluate the statistical significance of observed data from experiments.
Superpave nomenclature for performance graded asphalt binder. PG is used in front of two numbers to distinguish an asphalt binder's grading (e.g., PG 67-22). Replaces the conventional viscosity grading system (e.g., AC-30).
One sieve size larger that the first to retain at least 10 percent of the aggregate blend.
Portion of the total volume of intergranular void space or VMA filled with effective asphalt binder.
Ratio of HMA mix mass to volume without any air present.
Ratio of HMA mix mass to volume, including air.
Percent HMA mix compaction relative to the theoretical maximum specific gravity.
Asphalt content of a paving mixture at which 4 percent air voids are achieved.
Number of revolutions of the Gyratory compactor representing the compactibility of the paving mixture behind the spreader.
Number of revolutions of the Gyratory compactor required for design characteristics of the job-mix formula.
Number of revolutions of the gyratory compactor representing the density of a pavement layer at the end of its design life.
Product of the Strategic Highway Research Program and the new mix design system for hot mix asphalt, replacing the Marshall mix design system.
Ratio of aggregate dry mass to solid aggregate volume + surface permeable voids.
Ratio of aggregate dry mass to solid aggregate volume.
Definition
Total volume of air located between coated aggregate particles within a compacted HMA mix. Also referred to as Voids in the Total Mix (VTM).
Mixtures of aggregate and apshalt binder produced at elevated temperatures in asphalt plants.
Volume of intergranular void space between aggregate particles of compacted HMA mixtures that includes air voids and effective asphalt binder content, expressed as a percentage of the total sample volume.
iii
TABLE OF CONTENTS
PAGE
Chapter 1 Introduction.........................................................................................................1
1.1 Introduction..............................................................................................................1
1.2 Objectives and Scope...............................................................................................1
Chapter 2 Literature Review................................................................................................2
Chapter 3 Research Test Plan ............................................................................................13
3.1 Research Test Plan.................................................................................................13
Chapter 4 Test Results and Analysis .................................................................................22
4.1 Aggregate Properties..............................................................................................22
4.2 Reasons for Errors in Back Calculated Volumetrics .............................................24
4.3 Comparison of Ndesign Direct Volumetric to Ndesign Back Calculated
Volumetrics............................................................................................................25
4.3.1 Ndesign Density ...............................................................................................25
4.3.1.1 Ndesign Density Statistical Analysis ..................................................34
4.3.2 Voids in the Mineral Aggregate (VMA) ......................................................37
4.3.2.1 VMA Statistical Analysis ................................................................37
4.3.3 Ninitial Density................................................................................................44
4.3.3.1 Ninitial Density Statistical Analysis ....................................................45
4.4 Mix Design Effects ................................................................................................51
4.5 Comparison of Water Displacement and Corelok Gmb Procedures .......................55
4.5.1 Corelok Background .....................................................................................55
4.5.2 Corelok Operation.........................................................................................58
4.5.3 Comparison of Water Displacement and Corelok Gmb for Mix Design
Specimens .....................................................................................................58
4.5.4 Comparison of Water Displacement and Corelok Gmb at Design
Asphalt Content ............................................................................................63
4.5.5 Effect of Gmb Differences on Design Asphalt Content and VMA................69

iv
PAGE
Chapter 5 Conclusions and Recommendations ................................................................74
5.1 Conclusions............................................................................................................74
5.2 Recommendations..................................................................................................75
Chapter 6 References.........................................................................................................77
APPENDIX A....................................................................................................................79
v
LIST OF TABLES
TABLE PAGE
3.1 Research Test Matrix .............................................................................................13
3.2 Stockpile Percentages for Aggregate Blend Gradations ........................................15
3.3 Aggregate Blend Gradations..................................................................................16
3.4 Target Mixing, Curing, and Compaction Temperatures........................................19
4.1 Physical Properties of the Aggregate Blends.........................................................23
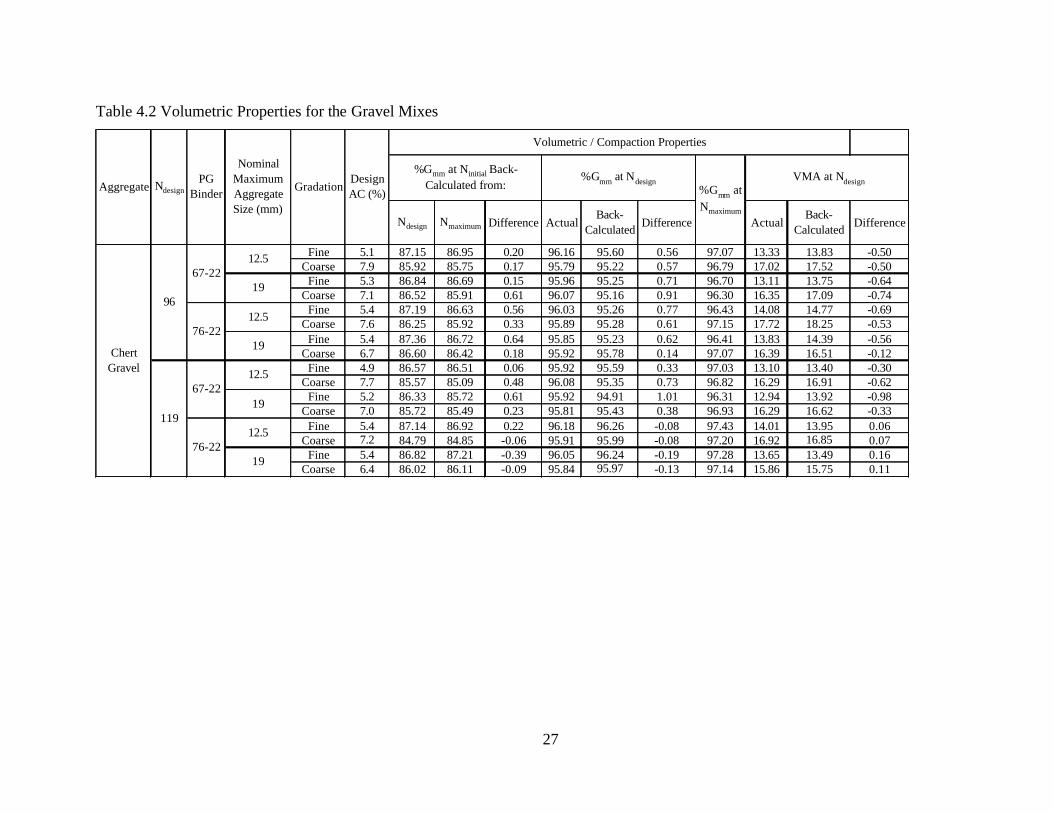
4.2 Volumetric Properties for the Gravel Mixes..........................................................27
4.3 Volumetric Properties for the Sandstone Mixes ....................................................28
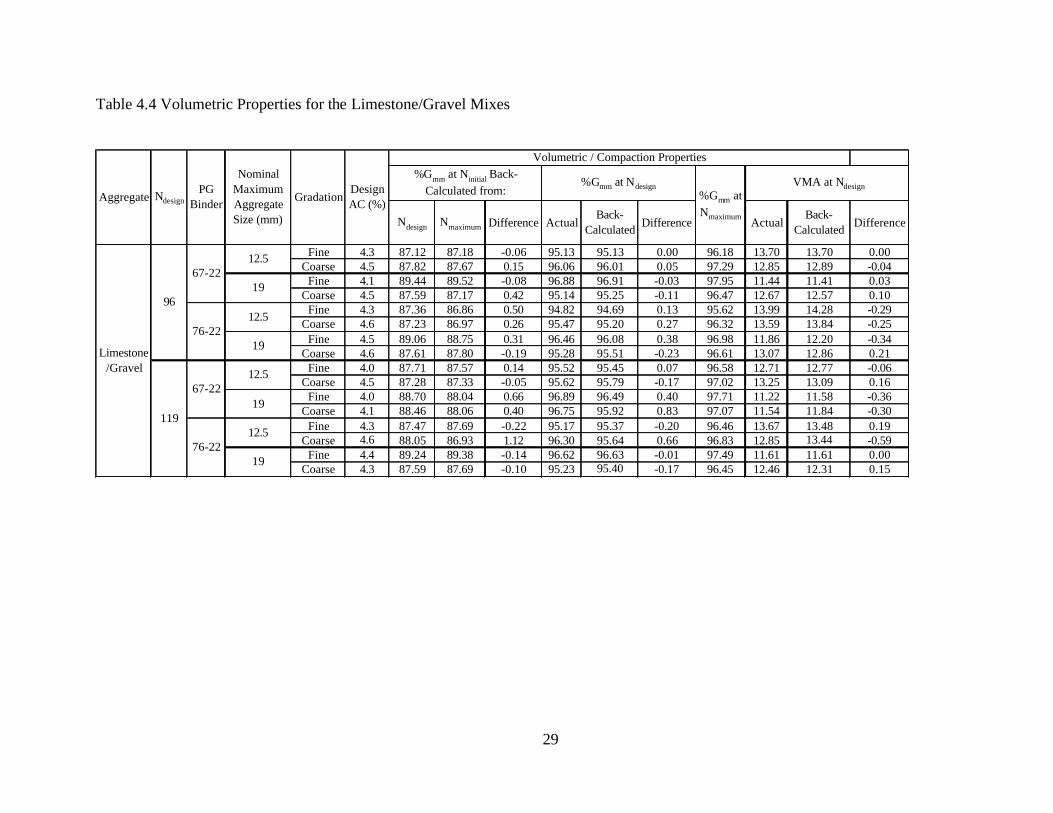
4.4 Volumetric Properties for the Limestone/Gravel Mixes........................................29
4.5 ANOVA Results for Ndesign Density Difference ....................................................35
4.6 Tukey’s Multiple Comparison Test Results ..........................................................36
4.7 ANOVA Results for VMA Difference ..................................................................43
4.8 ANOVA Results for Ninitial Density Difference.....................................................50
4.9 Summary Results for Design Asphalt Content Percent Change ............................51
4.10 Paired t-Test Results for Corelok and Water Displacement Gmb ...........................64
4.11 ANOVA Results for Gmb (Corelok – Water Displacement) ..................................65
4.12 ANOVA Results for Air Voids (Corelok – Water Displacement) ........................66
4.13 ANOVA Results for VMA (Corelok – Water Displacement) ...............................67
4.14 Tukey’s Multiple Comparison Test Results (Corelok – Water Displacement) .....68
4.15 Design Asphalt Content and VMA Change (Corelok – Water Displacement) .....73
A.1 Gyratory Compaction Heights, Gmb and Gmm for Gravel, 12.5 mm NMAS
Fine-Graded, PG 67-22, Ndesign = 96......................................................................80
A.2 Gyratory Compaction Heights, Gmb and Gmm for Gravel, 12.5 mm NMAS
Fine-Graded, PG 76-22, Ndesign = 96......................................................................81
A.3 Gyratory Compaction Heights, Gmb and Gmm for Gravel, 19.0 mm NMAS
Fine-Graded, PG 67-22, Ndesign = 96......................................................................82
A.4 Gyratory Compaction Heights, Gmb and Gmm for Gravel, 19.0 mm NMAS
Fine-Graded, PG 76-22, Ndesign = 96......................................................................83
vi
TABLE PAGE
A.5 Gyratory Compaction Heights, Gmb and Gmm for Gravel, 12.5 mm NMAS
Coarse-Graded, PG 67-22, Ndesign = 96..................................................................84
A.6 Gyratory Compaction Heights, Gmb and Gmm for Gravel, 12.5 mm NMAS
Coarse-Graded, PG 76-22, Ndesign = 96..................................................................85
A.7 Gyratory Compaction Heights, Gmb and Gmm for Gravel, 19.0 mm NMAS
Coarse-Graded, PG 67-22, Ndesign = 96..................................................................86
A.8 Gyratory Compaction Heights, Gmb and Gmm for Gravel, 19.0 mm NMAS
Coarse-Graded, PG 76-22, Ndesign = 96..................................................................87
A.9 Gyratory Compaction Heights, Gmb and Gmm for Gravel, 12.5 mm NMAS
Fine-Graded, PG 67-22, Ndesign = 119....................................................................88
A.10 Gyratory Compaction Heights, Gmb and Gmm for Gravel, 12.5 mm NMAS
Fine-Graded, PG 76-22, Ndesign = 119....................................................................89
A.11 Gyratory Compaction Heights, Gmb and Gmm for Gravel, 19.0 mm NMAS
Fine-Graded, PG 67-22, Ndesign = 119....................................................................90
A.12 Gyratory Compaction Heights, Gmb and Gmm for Gravel, 19.0 mm NMAS
Fine-Graded, PG 76-22, Ndesign = 119....................................................................91
A.13 Gyratory Compaction Heights, Gmb and Gmm for Gravel, 12.5 mm NMAS
Coarse-Graded, PG 67-22, Ndesign = 119................................................................92
A.14 Gyratory Compaction Heights, Gmb and Gmm for Gravel, 12.5 mm NMAS
Coarse-Graded, PG 76-22, Ndesign = 119................................................................93
A.15 Gyratory Compaction Heights, Gmb and Gmm for Gravel, 19.0 mm NMAS
Coarse-Graded, PG 67-22, Ndesign = 119................................................................94
A.16 Gyratory Compaction Heights, Gmb and Gmm for Gravel, 19.0 mm NMAS
Coarse-Graded, PG 76-22, Ndesign = 119................................................................95
A.17 Gyratory Compaction Heights, Gmb and Gmm for Sandstone, 12.5 mm NMAS
Fine-Graded, PG 67-22, Ndesign = 96......................................................................96
A.18 Gyratory Compaction Heights, Gmb and Gmm for Sandstone, 12.5 mm NMAS
Fine-Graded, PG 76-22, Ndesign = 96......................................................................97
vii
TABLE PAGE
A.19 Gyratory Compaction Heights, Gmb and Gmm for Sandstone, 19.0 mm NMAS
Fine-Graded, PG 67-22, Ndesign = 96......................................................................98
A.20 Gyratory Compaction Heights, Gmb and Gmm for Sandstone, 19.0 mm NMAS
Fine-Graded, PG 76-22, Ndesign = 96......................................................................99
A.21 Gyratory Compaction Heights, Gmb and Gmm for Sandstone, 12.5 mm NMAS
Coarse-Graded, PG 67-22, Ndesign = 96................................................................100
A.22 Gyratory Compaction Heights, Gmb and Gmm for Sandstone, 12.5 mm NMAS
Coarse-Graded, PG 76-22, Ndesign = 96................................................................101
A.23 Gyratory Compaction Heights, Gmb and Gmm for Sandstone, 19.0 mm NMAS
Coarse-Graded, PG 67-22, Ndes ign = 96................................................................102
A.24 Gyratory Compaction Heights, Gmb and Gmm for Sandstone, 19.0 mm NMAS
Coarse-Graded, PG 76-22, Ndesign = 96................................................................103
A.25 Gyratory Compaction Heights, Gmb and Gmm for Sandstone, 12.5 mm NMAS
Fine-Graded, PG 67-22, Ndesign = 119..................................................................104
A.26 Gyratory Compaction Heights, Gmb and Gmm for Sandstone, 12.5 mm NMAS
Fine-Graded, PG 76-22, Ndesign = 119..................................................................105
A.27 Gyratory Compaction Heights, Gmb and Gmm for Sandstone, 19.0 mm NMAS
Fine-Graded, PG 67-22, Ndesign = 119..................................................................106
A.28 Gyratory Compaction Heights, Gmb and Gmm for Sandstone, 19.0 mm NMAS
Fine-Graded, PG 76-22, Ndesign = 119..................................................................107
A.29 Gyratory Compaction Heights, Gmb and Gmm for Sandstone, 12.5 mm NMAS
Coarse-Graded, PG 67-22, Ndesign = 119..............................................................108
A.30 Gyratory Compaction Heights, Gmb and Gmm for Sandstone, 12.5 mm NMAS
Coarse-Graded, PG 76-22, Ndesign = 119..............................................................109
A.31 Gyratory Compaction Heights, Gmb and Gmm for Sandstone, 19.0 mm NMAS
Coarse-Graded, PG 67-22, Ndesign = 119..............................................................110
A.32 Gyratory Compaction Heights, Gmb and Gmm for Sandstone, 19.0 mm NMAS
Coarse-Graded, PG 76-22, Ndesign = 119..............................................................111
viii
TABLE PAGE
A.33 Gyratory Compaction Heights, Gmb and Gmm for Limestone/Gravel, 12.5 mm
NMAS Fine-Graded, PG 67-22, Ndesign = 96 .......................................................112
A.34 Gyratory Compaction Heights, Gmb and Gmm for Limestone/Gravel, 12.5 mm
NMAS Fine-Graded, PG 76-22, Ndesign = 96 .......................................................113
A.35 Gyratory Compaction Heights, Gmb and Gmm for Limestone/Gravel, 19.0 mm
NMAS Fine-Graded, PG 67-22, Ndesign = 96 .......................................................114
A.36 Gyratory Compaction Heights, Gmb and Gmm for Limestone/Gravel, 19.0 mm
NMAS Fine-Graded, PG 76-22, Ndesign = 96 .......................................................115
A.37 Gyratory Compaction Heights, Gmb and Gmm for Limestone/Gravel, 12.5 mm
NMAS Coarse-Graded, PG 67-22, Ndesign = 96...................................................116
A.38 Gyratory Compaction Heights, Gmb and Gmm for Limestone/Gravel, 12.5 mm
NMAS Coarse-Graded, PG 76-22, Ndesign = 96...................................................117
A.39 Gyratory Compaction Heights, Gmb and Gmm for Limestone/Gravel, 19.0 mm
NMAS Coarse-Graded, PG 67-22, Ndesign = 96...................................................118
A.40 Gyratory Compaction Heights, Gmb and Gmm for Limestone/Gravel, 19.0 mm
NMAS Coarse-Graded, PG 76-22, Ndesign = 96...................................................119
A.41 Gyratory Compaction Heights, Gmb and Gmm for Limestone/Gravel, 12.5 mm
NMAS Fine-Graded, PG 67-22, Ndesign = 119 .....................................................120
A.42 Gyratory Compaction Heights, Gmb and Gmm for Limestone/Gravel, 12.5 mm
NMAS Fine-Graded, PG 76-22, Ndesign = 119 .....................................................121
A.43 Gyratory Compaction Heights, Gmb and Gmm for Limestone/Gravel, 19.0 mm
NMAS Fine-Graded, PG 67-22, Ndesign = 119 .....................................................122
A.44 Gyratory Compaction Heights, Gmb and Gmm for Limestone/Gravel, 19.0 mm
NMAS Fine-Graded, PG 76-22, Ndesign = 119 .....................................................123
A.45 Gyratory Compaction Heights, Gmb and Gmm for Limestone/Gravel, 12.5 mm
NMAS Coarse-Graded, PG 67-22, Ndesign = 119.................................................124
A.46 Gyratory Compaction Heights, Gmb and Gmm for Limestone/Gravel, 12.5 mm
NMAS Coarse-Graded, PG 76-22, Ndesign = 119.................................................125

ix
TABLE PAGE
A.47 Gyratory Compaction Heights, Gmb and Gmm for Limestone/Gravel, 19.0 mm
NMAS Coarse-Graded, PG 67-22, Ndesign = 119.................................................126
A.48 Gyratory Compaction Heights, Gmb and Gmm for Limestone/Gravel, 19.0 mm
NMAS Coarse-Graded, PG 76-22, Ndesign = 119.................................................127

x
LIST OF FIGURES
FIGURE PAGE
2.1 Ninitial and Nmaximum Relationships from Ndesign ........................................................5
2.2 Typical Superpave Gyratory Compactor Densification Curve................................7
2.3 Error in Air Voids versus Gyrations ......................................................................10
2.4 Relationship of the Correction Factor versus Gyration Level ...............................11
3.1 12.5 mm NMAS Aggregate Blend Gradations ......................................................17
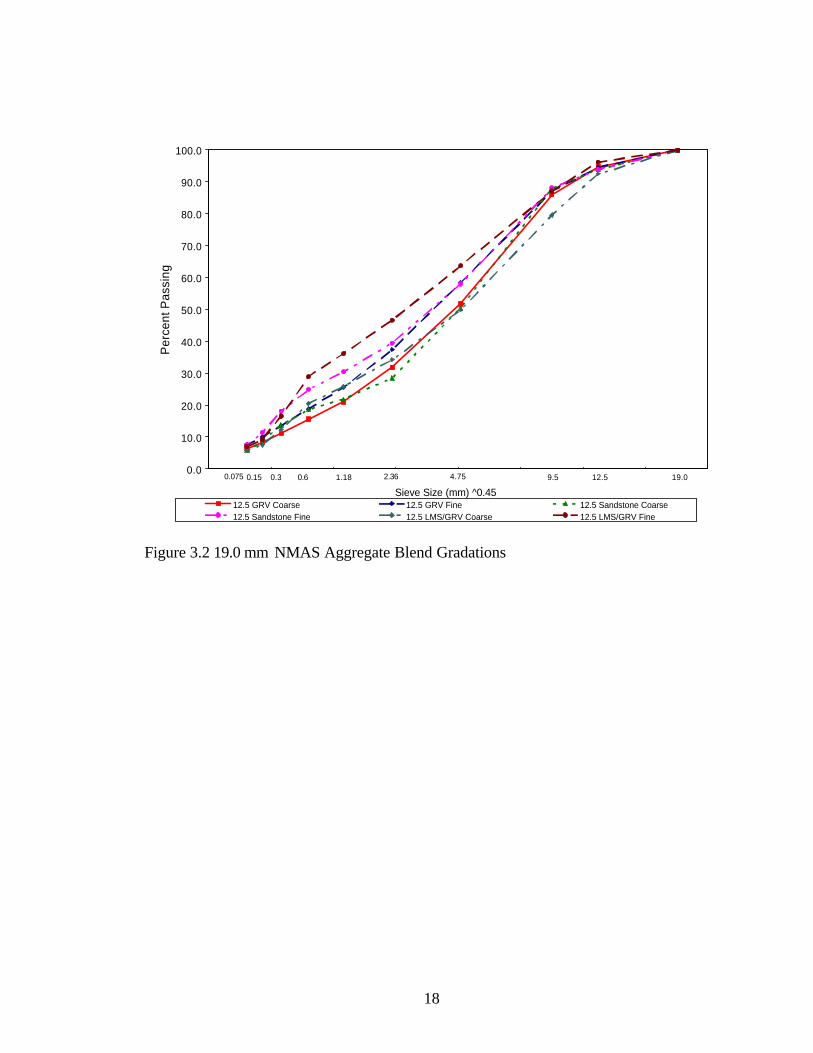
3.2 19.0 mm NMAS Aggregate Blend Gradations ......................................................18
3.3 Project Mixing .......................................................................................................19
3.4 Pine Superpave Gyratory Compactor ....................................................................20
4.1 HMA Specimen with Coarse versus Fine-Gradations Schematic .........................25
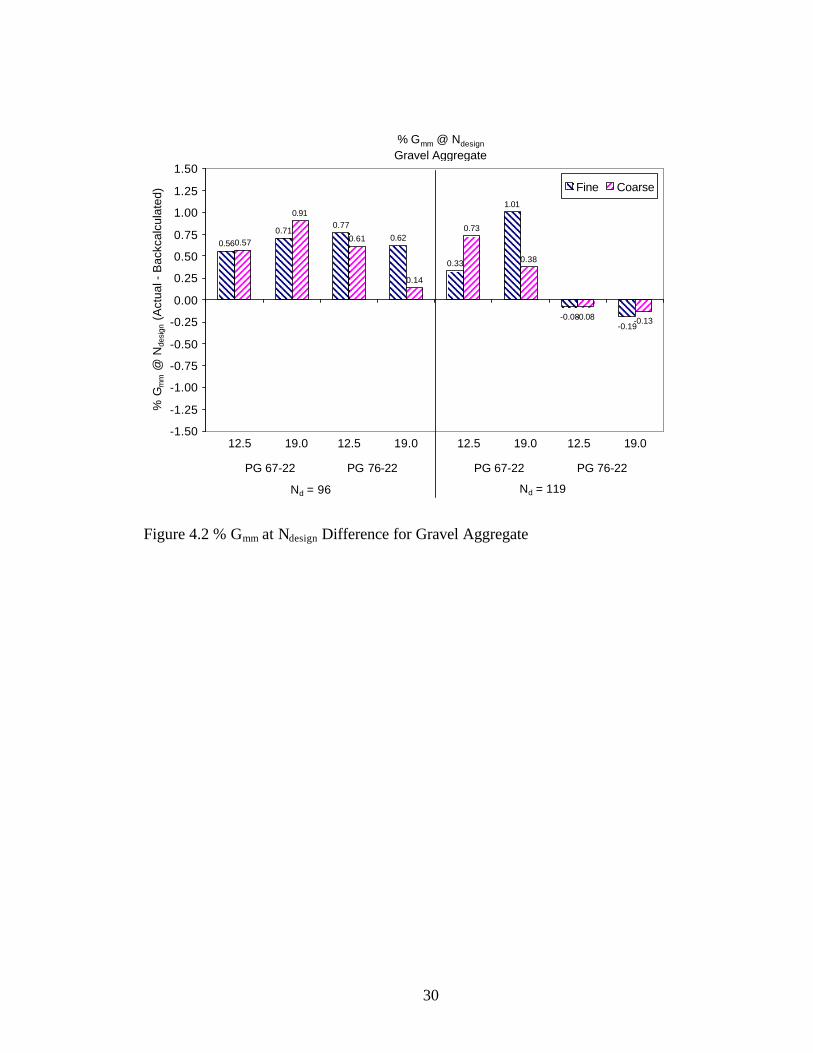
4.2 % Gmm at Ndesign Difference for Gravel Aggregate ................................................30
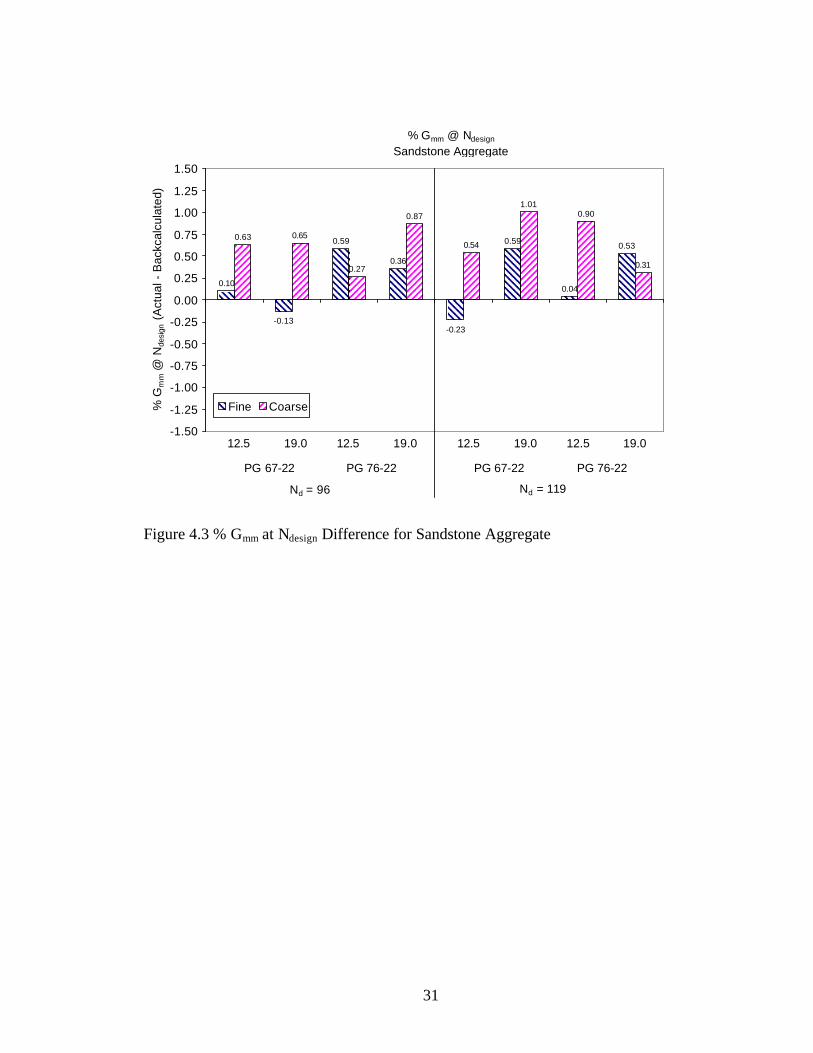
4.3 % Gmm at Ndesign Difference for Sandstone Aggregate ..........................................31
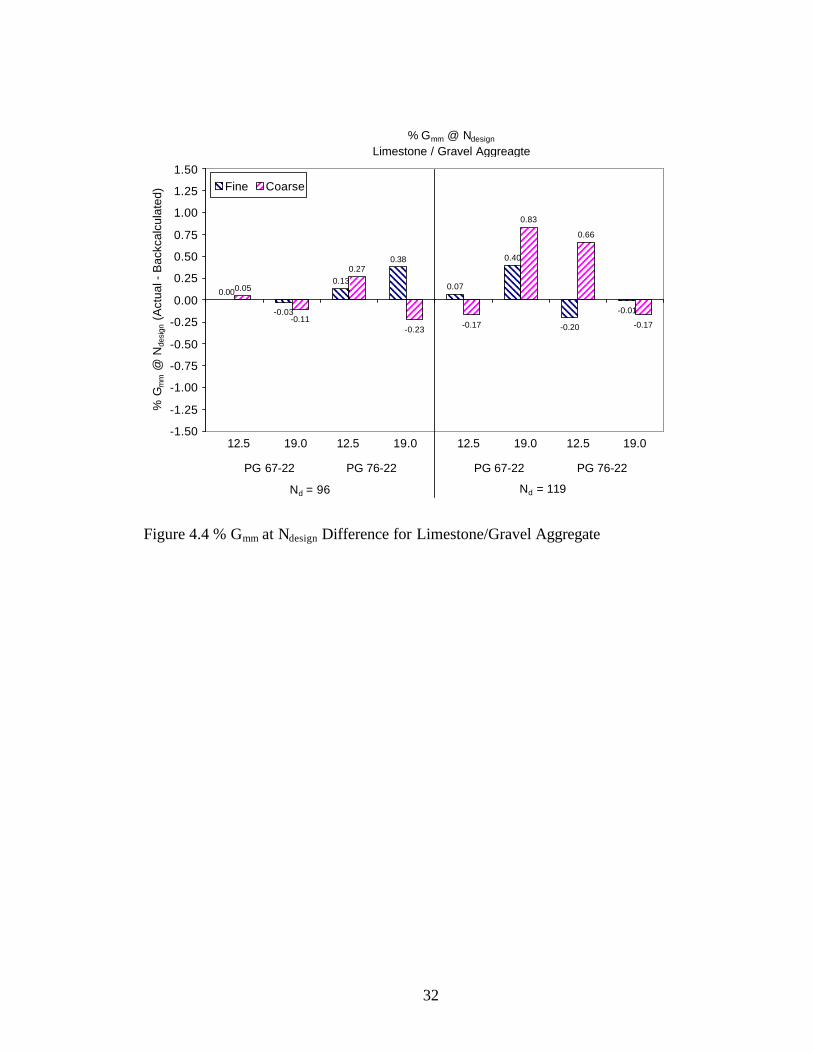
4.4 % Gmm at Ndesign Difference for Limestone/Gravel Aggregate ..............................32
4.5 % Gmm at Ndesign (Back Calculated versus Direct) .................................................33
4.6 VMA Difference for Gravel Aggregate .................................................................39
4.7 VMA Difference for Sandstone Aggregate ...........................................................40
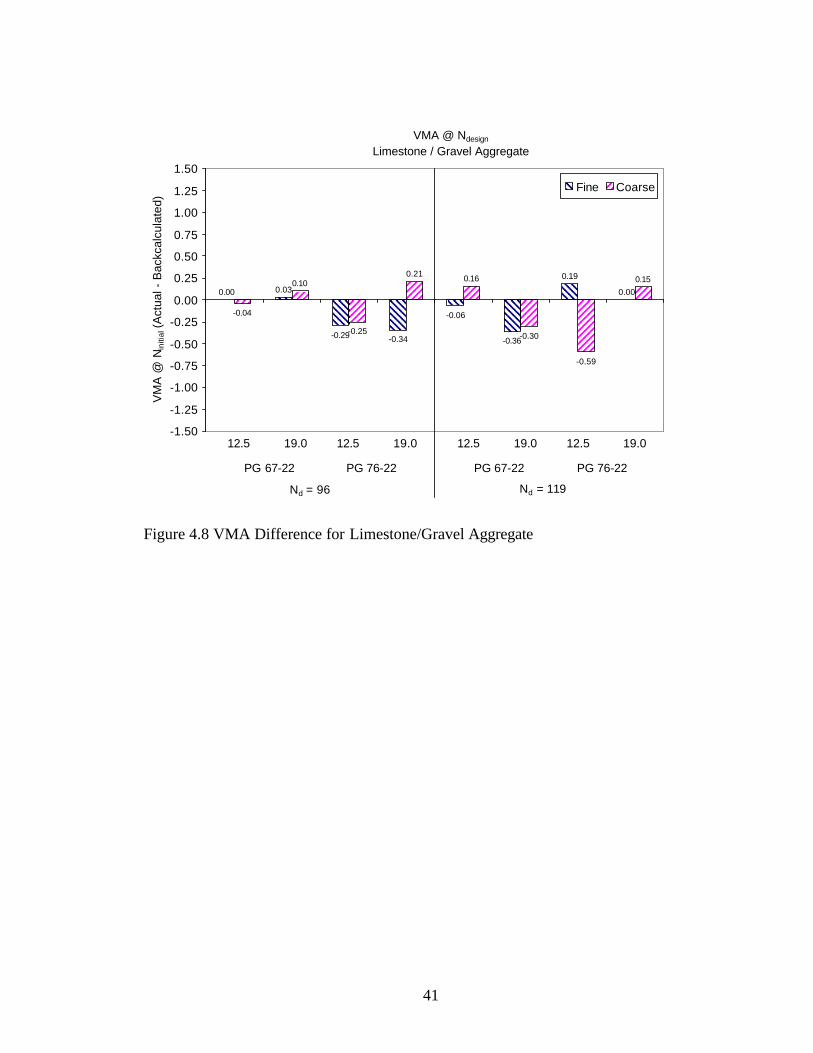
4.8 VMA Difference for Limestone/Gravel Aggregate ...............................................41
4.9 VMA (Back Calculated versus Direct) ..................................................................42
4.10 % Gmm at Ninitial Difference for Gravel Aggregate .................................................46
4.11 % Gmm at Ninitial Difference for Sandstone Aggregate ...........................................47
4.12 % Gmm at Ninitial Difference for Limestone/Gravel Aggregate ...............................48
4.13 % Gmm at Ninitial (Back Calculated versus Direct) ..................................................49
4.14 Change in Design Asphalt Content for Gravel Mixes ...........................................52
4.15 Change in Design Asphalt Content for Sandstone Mixes......................................53
4.16 Change in Design Asphalt Content for Limestone/Gravel Mixes .........................54
4.17 Corelok Vacuum Sealing Device...........................................................................57
4.18 Water Displacement versus Corelok Gmb ..............................................................59
4.19 Water Absorption versus Gmb ................................................................................61
xi
FIGURE PAGE
4.20 Air Voids versus Water Absorption.......................................................................62
4.21 Design Asphalt Content Change (Corelok – Water Displacement) for
Gravel Mixes..........................................................................................................70
4.22 Design Asphalt Content Change (Corelok – Water Displacement) for
Sandstone Mixes....................................................................................................71
4.23 Design Asphalt Content Change (Corelok – Water Displacement) for
Limestone/Gravel Mixes........................................................................................72

1
CHAPTER 1 INTRODUCTION
1.1 INTRODUCTION
In the Superpave hot mix asphalt (HMA) mix design system, gyratory specimens
are compacted to varying levels of initial (Ninitial), design (Ndesign) and maximum
(Nmaximum) gyrations. Initially, in the Superpave system, specimens were compacted to
Nmaximum and their volumetric properties back-calculated at Ndesign. However, as a result
of back-calculation, errors in HMA volumetric properties at Ndesign can be present. Of
most concern is the change in air voids and voids in the mineral aggregate (VMA).
Because of these errors, the Mississippi Department of Transportation (MDOT)
recently revised their protocol for Superpave HMA mix designs. The revised protocol
requires specimens to be compacted directly to Ndesign for selecting design asphalt
content.
1.2 OBJECTIVES AND SCOPE
A study has been undertaken targeted at determining the effect on Superpave
design asphalt content resulting from changing end-point compaction for mix designs
from Nmaximum to Ndesign. The laboratory study evaluated various factors including
aggregate type, asphalt binder performance grade, Ndesign level, nominal maximum
aggregate size, and aggregate gradation. Mix designs were conducted at Ndesign as the
end-point of compaction. Additional specimens were compacted to Nmaximum. The
differences in design asphalt contents and other volumetric properties at Ndesign and
Nmaximum were then analyzed.
Corelok vacuum sealing procedures were used to determine the bulk specific
gravity (Gmb) of all compacted specimens in the study. An evaluation of the effect of the
Corelok device on the mix design asphalt content and VMA was also conducted.
Results of the study provide a basis for evaluating changes in design asphalt
content for the range of aggregate and asphalt combinations used throughout Mississippi.
2
CHAPTER 2 LITERATURE REVIEW
A literature review was conducted and is discussed as a part of this report.
Literature was reviewed that pertained to development of the Superpave gyratory
compaction procedure (development of Ndesign, Ninitial, and Nmaximum) and past evaluations
of the effect of end point compaction.
The experimental approach, results, and conclusions from the initial Ndesign
experiment are provided by Blackenship et al (1). The Ndesign experiment was undertaken
to determine the number of gyrations (Ndesign) required to represent various traffic levels
in different geographical regions and climates. In accomplishing this task two gyration
levels were evaluated. One level was Nconstruction, which represented the initial laydown
compaction level, Cconstruction, and the other level was Ndesign, which represented the
compaction in the wheel path under applied traffic, Cdesign. For the experiment the value
of Cconstruction was unknown for many of the pavements and was assumed to be 92 percent
of Gmm. In the original experiment 27 pavement sites with 54 mixtures were to be
evaluated. The sites would include three climates (hot, warm, and cool), three traffic
levels (low, medium, and high), and two pavement layers (upper and lower). However, it
was later decided to evaluate only pavements which had been in service for over 12
years. As a result, the number of pavements in the study was reduced to 18, with 15
being available for final evaluation. An assumption was made that all the mixtures were
designed to have 3 to 5 percent air voids in the laboratory and in-place air voids of 7 to 9
percent immediately after construction
The aged asphalt was extracted from 305 mm cores taken from the various
pavements. Subsequently, the aggregate was re-mixed with an unaged AC-20 asphalt
cement. Prior to compaction the mixes were aged for 4 hours at 135°C. They were then
compacted with 230 gyrations using the Strategic Highway Research Program (SHRP)
gyratory compactor. Mixtures with 19.0 mm and less nominal maximum aggregate sizes
were prepared using a 100 mm compaction mold. Mixtures with greater than 19.0 mm
nominal maximum aggregate sixes were compacted in a 150 mm mold. All mixtures
evaluated in the study had a fine gradation.
Analysis of test results was used to select Ndesign for a desired traffic level and an
average 7-day high temperature. The authors suggested that the results and conclusions
3
from the experiment were acceptable but more research was needed to increase the
precision of Ndesign.
Cominsky et al. (2) provided the background and an overview of the Superpave
mix design system as it was developed. Specifically, they provide a detailed description
of how the Superpave gyratory compactor was selected for use in mix design and quality
control. After considerable research and effort, SHRP researchers elected to use a
gyratory compactor with operating protocols very similar to the French gyratory
compactor. The final protocol specified a rotational speed of 30 rpm, a gyration angle of
1.25 degrees, a vertical pressure of 600 kPa, and a target final sample compaction height
of 115 mm.
A discussion is also provided by Cominsky et al. (2) on how the gyratory
compaction parameters of Ninitial and Nmaximum were established. Initially, in the
Superpave procedure, Ninitial and Nmaximum were referred to as N89 and N98, respectively.
As mentioned previously, the Superpave gyratory compaction procedure was modeled, in
part, after the French gyratory compaction protocol. Wherein, N89 is set at 10 gyrations;
at which the compacted specimen density must be less than 89 percent of the maximum
theoretical specific gravity. The value of N89 does not change based upon the selected
level of Ndesign. The SHRP researchers felt that the level of N89 or Ninitial should be a
function of Ndesign and should increase as Ndesign increases. This would yield a more
stable mixture for higher temperatures and traffic levels.
The N98 or Nmaximum was established to represent a maximum allowable density
using the Superpave gyratory compactor. Researchers felt that a mix that compacts to
greater than 98 percent of the maximum theoretical specific gravity in the laboratory
would be prone to excessive densification or rutting in the field.
From results of the initial Ndesign experiment (SHRP-A001, Task F), a relationship
between Ninitial and Nmaximu m was established. Figure 2.1 illustrates the procedure used by
the researchers for one mix from Arizona. Aggregate recovered from cores was re-
mixed with an asphalt cement equivalent to the original asphalt cement and compacted to
approximately 275 gyrations in the Superpave gyratory compactor. A plot of percent
Gmm versus the log of gyrations provides the densification curve for the mixture. The
densification curve is also referred to as the Aas-recovered@ curve on the plot. The point
4
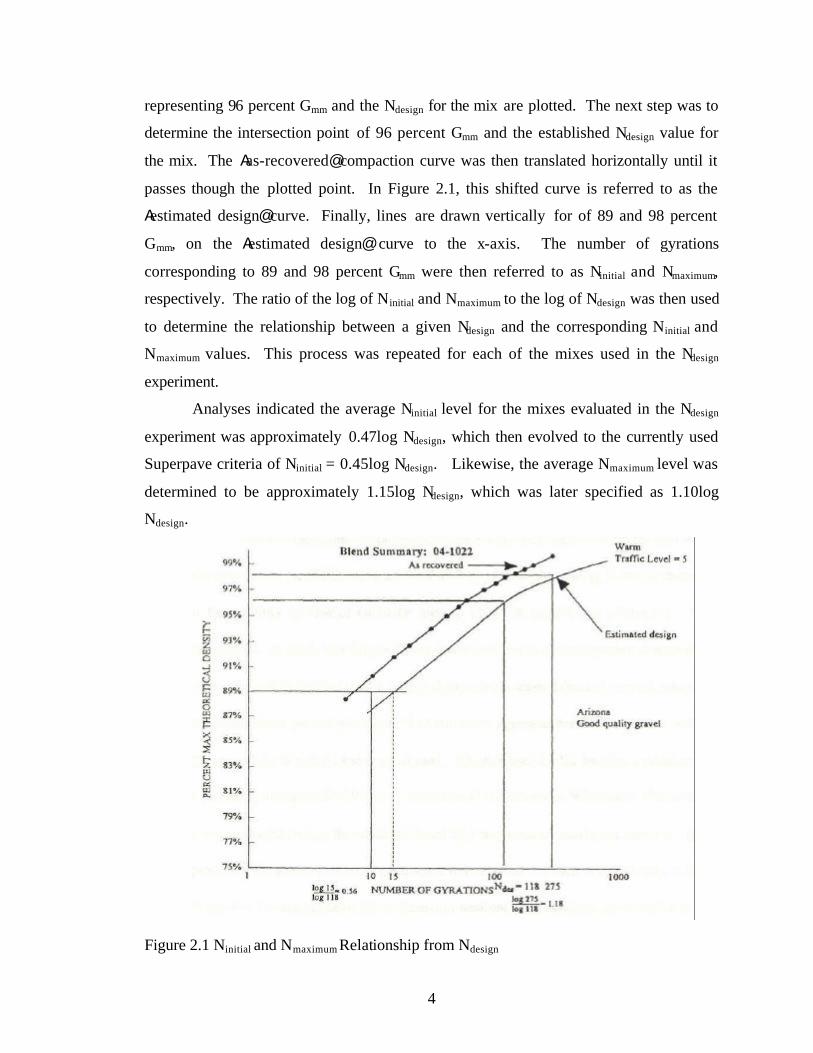
representing 96 percent Gmm and the Ndesign for the mix are plotted. The next step was to
determine the intersection point of 96 percent Gmm and the established Ndesign value for
the mix. The Aas-recovered@ compaction curve was then translated horizontally until it
passes though the plotted point. In Figure 2.1, this shifted curve is referred to as the
Aestimated design@ curve. Finally, lines are drawn vertically for of 89 and 98 percent
Gmm, on the Aestimated design@ curve to the x-axis. The number of gyrations
corresponding to 89 and 98 percent Gmm were then referred to as Ninitial and Nmaximum,
respectively. The ratio of the log of Ninitial and Nmaximum to the log of Ndesign was then used
to determine the relationship between a given Ndesign and the corresponding Ninitial and
Nmaximum values. This process was repeated for each of the mixes used in the Ndesign
experiment.
Analyses indicated the average Ninitial level for the mixes evaluated in the Ndesign
experiment was approximately 0.47log Ndesign, which then evolved to the currently used
Superpave criteria of Ninitial = 0.45log Ndesign. Likewise, the average Nmaximum level was
determined to be approximately 1.15log Ndesign, which was later specified as 1.10log
Ndesign.
Figure 2.1 Ninitial and Nmaximum Relationship from Ndesign
6
In another study by Cominsky et al. (3), a description of the operational
parameters of the Superpave Gyratory Compactor is provided. In the Superpave gyratory
compaction procedure, the density at three specific points, Ninitial, Ndesign, and Nmaximum, is
determined as the specimen is being compacted. Selection of Ndesign level depends on the
design traffic level (ESALs) and the design seven day maximum air temperature for the
project. The values of Ninitial and Nmaximum are then determined depending upon the
selected Ndesign level through the following equations:
designinitial NN log45.0log = Equation 2.1
designimum NN log10.1log max = Equation 2.2
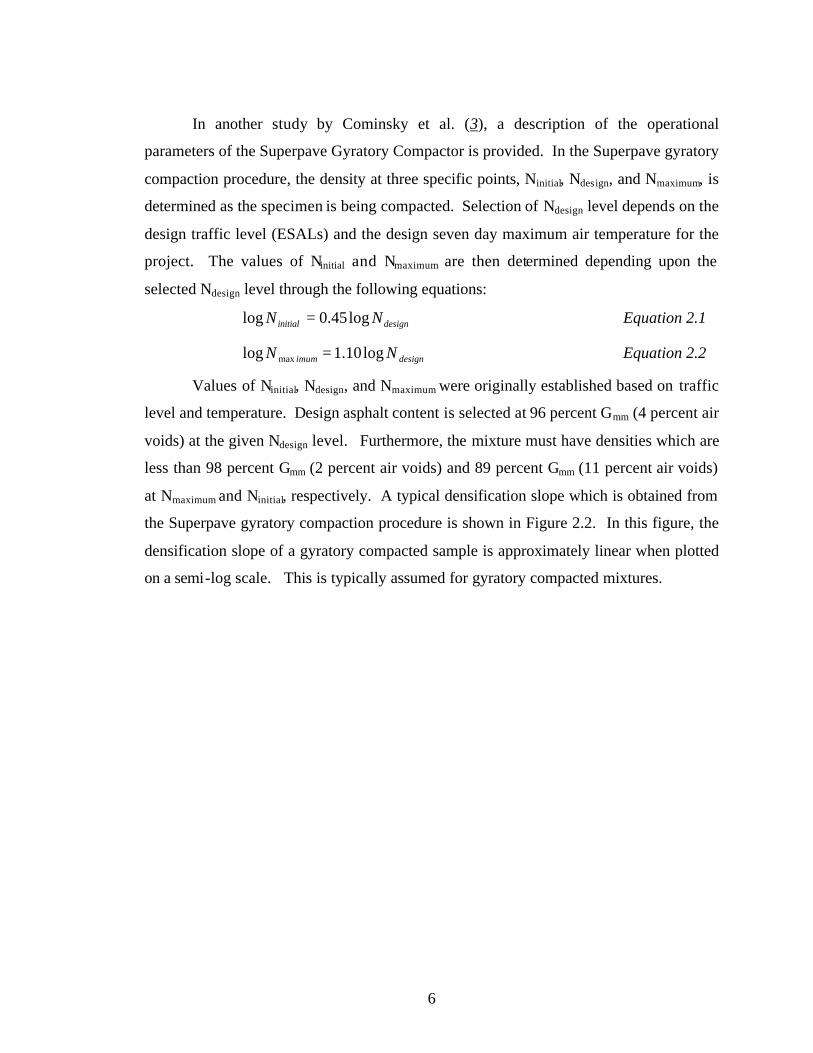
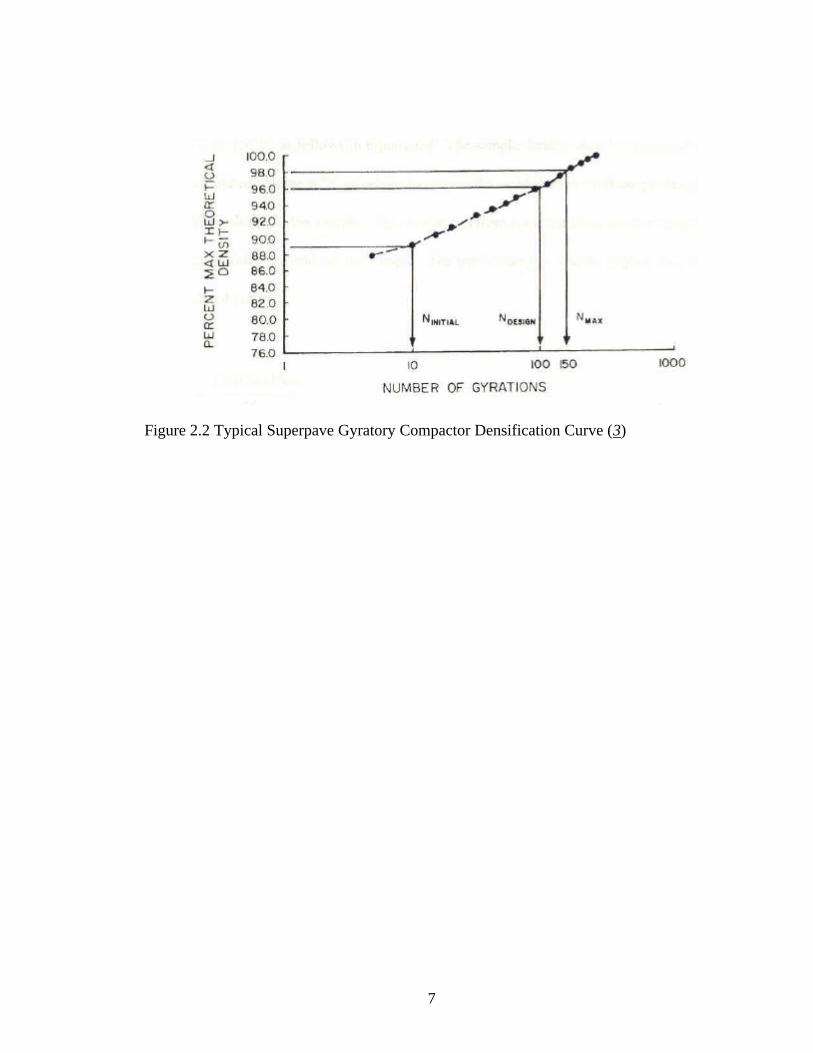
Values of Ninitial, Ndesign, and Nmaximum were originally established based on traffic
level and temperature. Design asphalt content is selected at 96 percent Gmm (4 percent air
voids) at the given Ndesign level. Furthermore, the mixture must have densities which are
less than 98 percent Gmm (2 percent air voids) and 89 percent Gmm (11 percent air voids)
at Nmaximum and Ninitial, respectively. A typical densification slope which is obtained from
the Superpave gyratory compaction procedure is shown in Figure 2.2. In this figure, the
densification slope of a gyratory compacted sample is approximately linear when plotted
on a semi-log scale. This is typically assumed for gyratory compacted mixtures.
7
Figure 2.2 Typical Superpave Gyratory Compactor Densification Curve (3)
8
Originally, in the Superpave procedure, all specimens were compacted to Nmaximum
and their densities at Ndesign and Ninitial determined through a back-calculation procedure.
The procedure consists of first calculating an uncorrected density of the sample at a given
gyration level as follows:
100*
=mm
mix
mix
ux GVM
C Equation 2.3
Where, Cux = uncorrected sample density at a given gyration level (x), (g/cm3),
Mmix = mass of mix being compacted (g),
Vmix = volume of mix being compacted at (x) gyrations (cm3).
Gmm = theoretical maximum specific gravity of mix
This calculated uncorrected density can in turn be used to calculate the corrected
specimen density as follows in Equation 2.4. The sample density must be corrected
because the calculated volume at Ax@ gyrations based upon the mold diameter and sample
height is not the true volume of the sample. This is due to errors resulting from surface
irregularities or texture along the sides and ends of the sample. The true volume is
usually slightly less than the calculated volume.
mix
mmmbuxx M
VGCC
**= Equation 2.4
where,
Cx = corrected sample density at a given gyration level (x), (g/cm3),
Gmb = measured bulk specific gravity of the sample at Nmaximum,
Vmm = volume of mix at Nmaximum (cm3),
Mmix = mass of mix at (x) gyrations (g)
Vavrik and Carpenter (4) conducted a study to determine the sources of
inaccuracies, in both mix design and quality control testing, as a result of back-
calculation of gyratory specimen density at Ndesign from densities obtained at Nmaximum.
The Superpave system, as originally developed, uses a back-calculation procedure in
9
which specimen density at Ndesign is determined through the use of the specimen height
and a correction factor determined at Nmaximum. This correction factor is distinct for each
mixture designed and will vary with asphalt content, gradation, and compactive effort.
The mixture used in this research was a 19.0 nominal maximum size dense-
graded mixture, with a gradation below the Superpave restricted zone and near the coarse
control points. (Note: Current Superpave specifications do not contain a restricted zone;
however, the restricted zone existed in the original Superpave system). One specimen
was compacted to Ndesign and one was compacted to Nmaximum. Densities of specimens
compacted to Ndesign and densities back-calculated from Nmaximum were compared. The
results showed differences in density between 0.5 and 1.5 percent.
Due to these differences, the state of Illinois developed a method of determining
the densification properties of a mixture based on analyzing all of the gyratory height
data and the densification curve for a given mixture. In the procedure it is stated that the
densification curve for a mixture is taken as linear up to the point of 96 percent of Gmm or
4 percent air voids. The majority of the back-calculation error actually occurs as the void
level drops below 4 percent air voids. The Illinois method utilizes a Alocking point@
concept. This Alocking point@ is referred to as the first of three consecutive gyrations
producing the same specimen height. Generally, the densification rate of the mixture is
nonlinear at any further gyration levels. The Alocking point@ concept was developed by
Illinois to prevent over compaction of their mixes during design. At the locking point of
the mixture compaction is stopped. It is assumed that specimen densities at lower levels
of compaction can be estimated correctly.
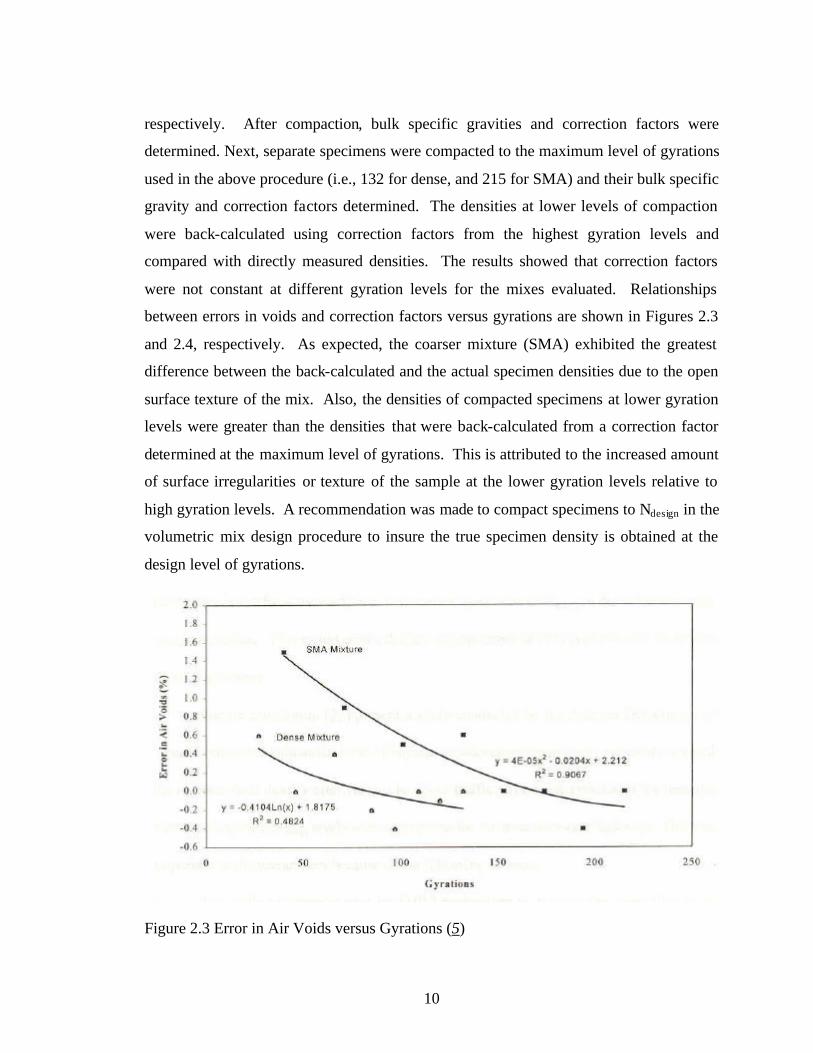
Mallick et al. (5) compared correction factors obtained at different gyration levels
during compaction. As part of the study, a traprock aggregate was used in two very
different gradations: a stone matrix asphalt (SMA) gradation and a conventional well-
graded or dense gradation. A PG 64-22 asphalt binder was used for all mixes. Mixes
were prepared at their respective design asphalt contents and compacted in a Pine SGC at
different gyration levels. The gyration levels used for dense and SMA mixes were 27,
46, 66, 85, 97, 109, 120 and 132; and 40, 71, 101, 132, 153, 174, 194, and 215 gyrations,
10
respectively. After compaction, bulk specific gravities and correction factors were
determined. Next, separate specimens were compacted to the maximum level of gyrations
used in the above procedure (i.e., 132 for dense, and 215 for SMA) and their bulk specific
gravity and correction factors determined. The densities at lower levels of compaction
were back-calculated using correction factors from the highest gyration levels and
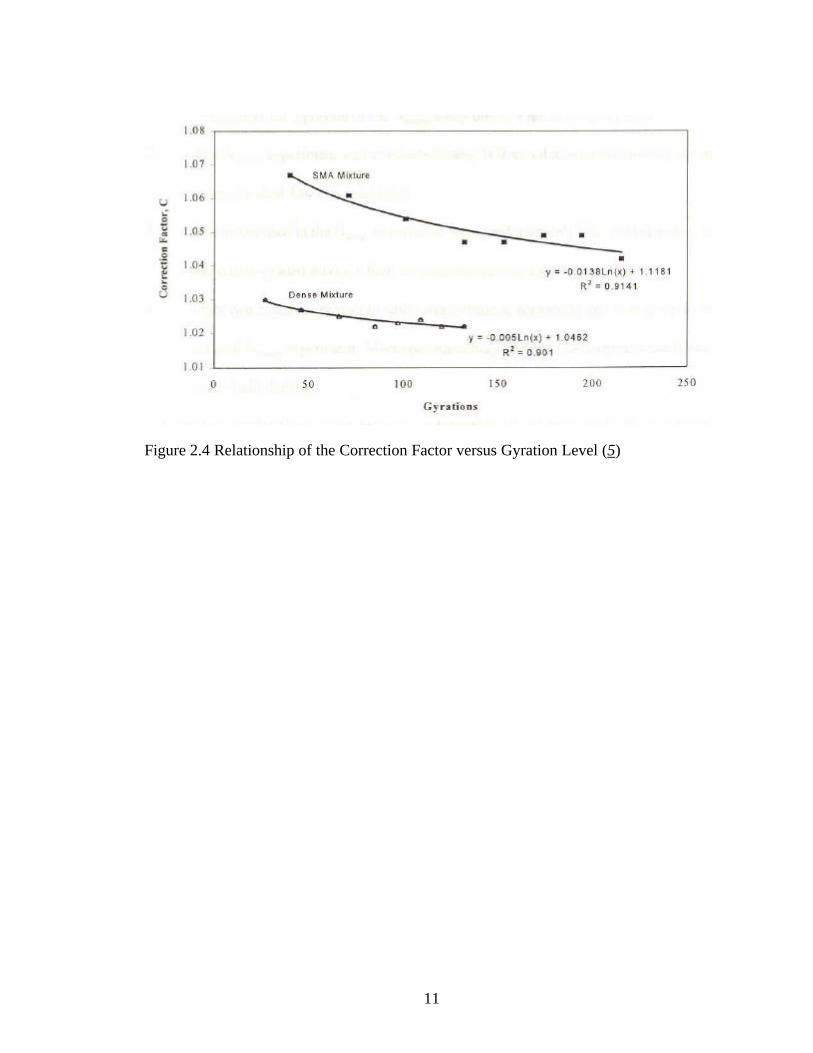
compared with directly measured densities. The results showed that correction factors
were not constant at different gyration levels for the mixes evaluated. Relationships
between errors in voids and correction factors versus gyrations are shown in Figures 2.3
and 2.4, respectively. As expected, the coarser mixture (SMA) exhibited the greatest
difference between the back-calculated and the actual specimen densities due to the open
surface texture of the mix. Also, the densities of compacted specimens at lower gyration
levels were greater than the densities that were back-calculated from a correction factor
determined at the maximum level of gyrations. This is attributed to the increased amount
of surface irregularities or texture of the sample at the lower gyration levels relative to
high gyration levels. A recommendation was made to compact specimens to Ndesign in the
volumetric mix design procedure to insure the true specimen density is obtained at the
design level of gyrations.
Figure 2.3 Error in Air Voids versus Gyrations (5)
11
Figure 2.4 Relationship of the Correction Factor versus Gyration Level (5)
12
Buchanan (6) conducted research on the consolidation of the original Ndesign
compaction matrix and evaluation of the gyratory compaction requirements of Ninitial and
Nmaximum. One specific item of interest was the evaluation of specimen density when
compacted directly to Ndesign and back calculated to Ndesign from Nmaximum. Specimens
from different mixes were compacted directly to Ndesign and their density determined.
Next, specimens were compacted to the corresponding Nmaximum value and their density
back calculated to Ndesign.
The results indicated that errors up to 0.8 percent air voids could result by
compacting specimens to Nmaximum and back calculating specimen density at Ndesign. A
recommendation was made to compact specimens directly to Ndesign so that any error
(positive or negative) in the Ndesign density would be eliminated.
13
CHAPTER 3 RESEARCH TEST PLAN
3.1 RESEARCH TEST PLAN
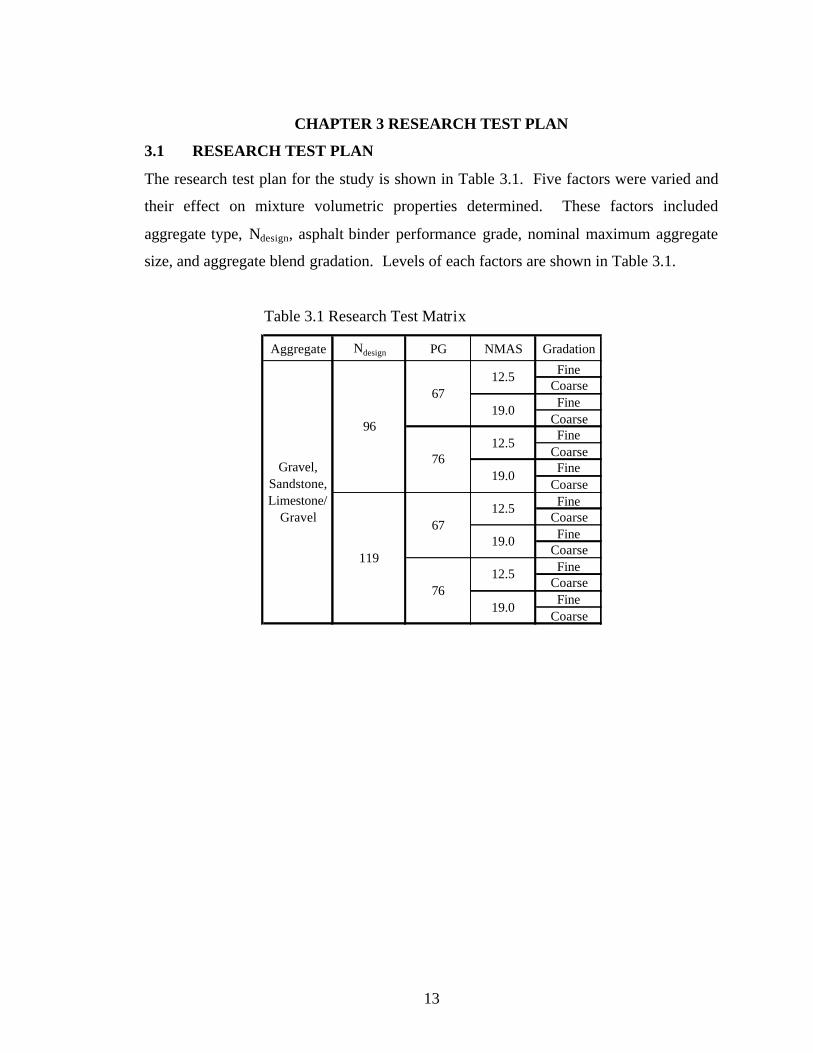
The research test plan for the study is shown in Table 3.1. Five factors were varied and
their effect on mixture volumetric properties determined. These factors included
aggregate type, Ndesign, asphalt binder performance grade, nominal maximum aggregate
size, and aggregate blend gradation. Levels of each factors are shown in Table 3.1.
Table 3.1 Research Test Matrix
Aggregate Ndesign PG NMAS Gradation
FineCoarseFine
CoarseFine
CoarseFine
CoarseFine
CoarseFine
CoarseFine
CoarseFine
Coarse
96
119
Gravel, Sandstone, Limestone/
Gravel
67
76
67
76
12.5
19.0
12.5
19.0
12.5
19.0
12.5
19.0
14
The aggregates used consisted of chert gravel from Columbus, Mississippi,
sandstone from Russelville, Arkansas; and limestone from Birmingham, Alabama.
Additionally, recycled asphalt pavement (RAP) was obtained from Columbus,
Mississippi. One percent hydrated lime was added to all study mixes. Aggregate blends
were developed comprised of predominately gravel, sandstone, and approximately a
50/50 blend of limestone and gravel. For the gravel mixes, 8 to 10 percent recycled
asphalt pavement (RAP) was added. However, due to variability of the RAP, a decision
was made not to use the RAP in the sandstone and limestone/gravel mixes.
Subsequently, the aggregate blends in the study will be referred to in the
remainder of the study as gravel, sandstone, and limestone/gravel for simplicity. For
each of the aggregate types, two aggregate gradations, fine-graded and coarse-graded
Superpave blends, were evaluated. In the original Superpave system, fine and coarse-
graded aggregate blends were distinguished by the restricted zone, with fine and coarse-
graded blends passing above and below the restricted zone, respectively. However, the
restricted zone no longer exists in Superpave specifications. Agencies now typically
specify fine and coarse-graded blends based on blend percentages passing a certain sieve
[generally a smaller sieve size (e.g., 2.36 mm)], with fine-graded blends having a greater
percent passing than coarse-graded blends. In this study, efforts were made to develop
fine and coarse-graded blends for each aggregate type that were distinctly different,
especially between the 2.36 mm and the 0.150 mm sieves. However, due to stockpile
limitations, the difference between fine and coarse-graded blends among the aggregate
types varies.
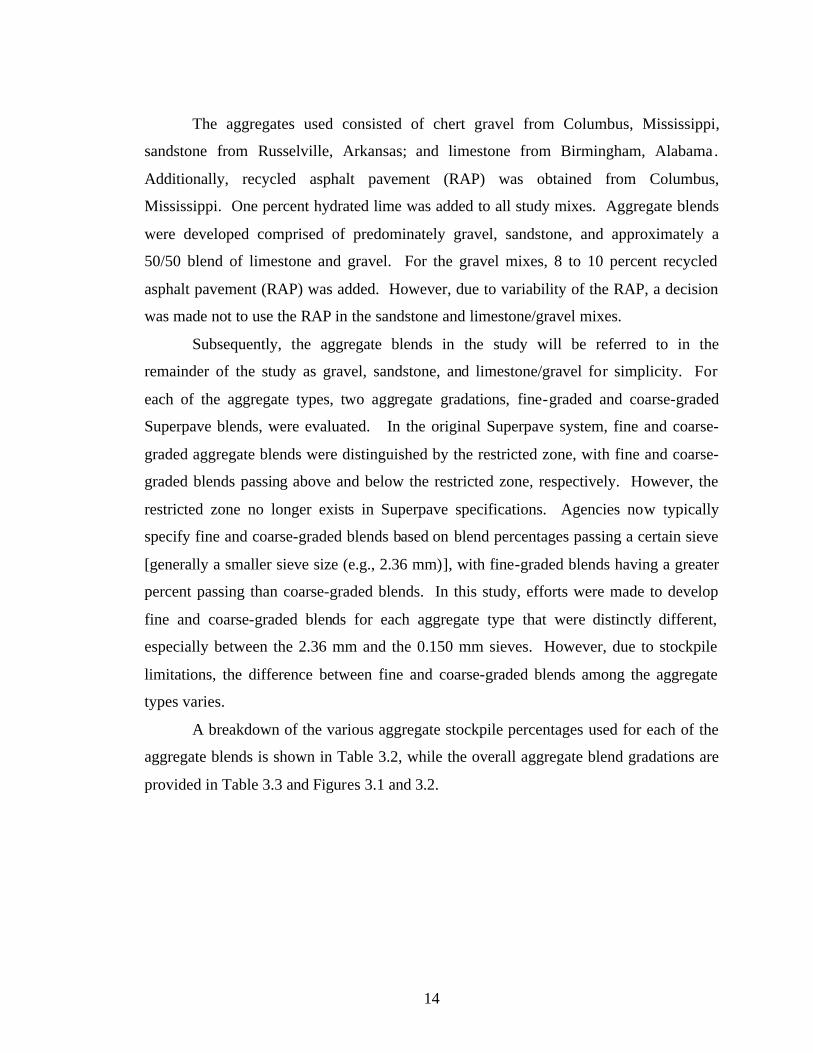
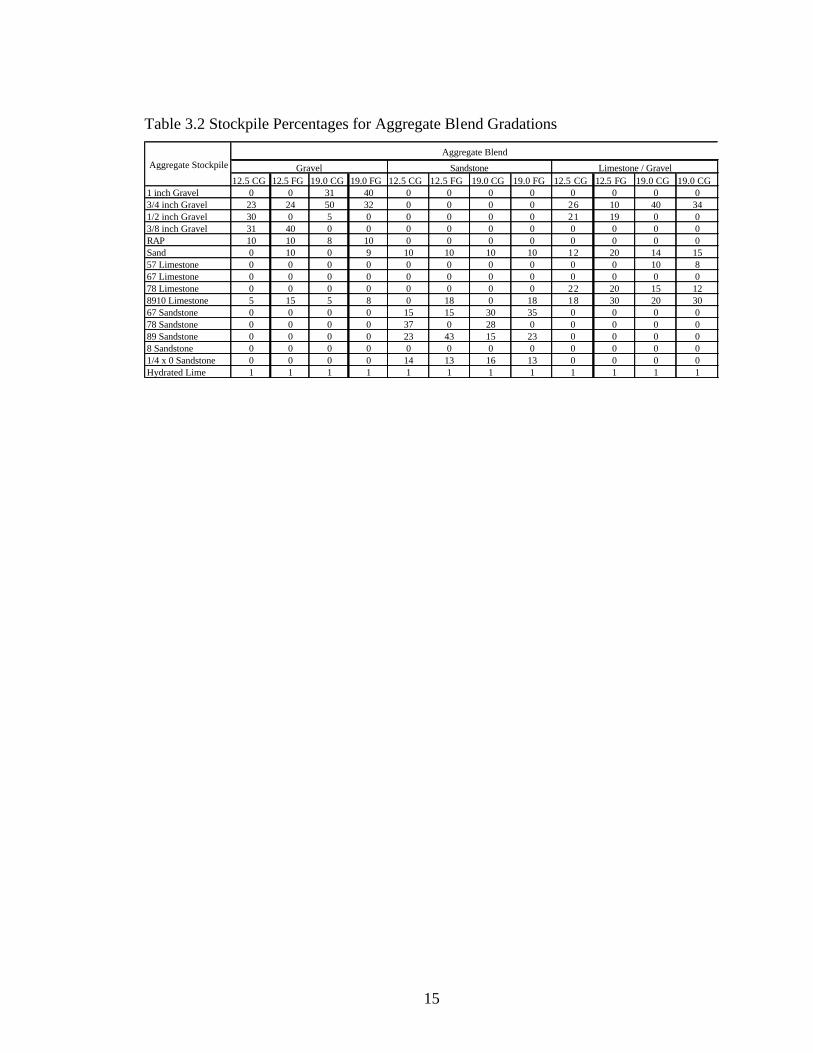
A breakdown of the various aggregate stockpile percentages used for each of the
aggregate blends is shown in Table 3.2, while the overall aggregate blend gradations are
provided in Table 3.3 and Figures 3.1 and 3.2.
15
Table 3.2 Stockpile Percentages for Aggregate Blend Gradations
12.5 CG 12.5 FG 19.0 CG 19.0 FG 12.5 CG 12.5 FG 19.0 CG 19.0 FG 12.5 CG 12.5 FG 19.0 CG 19.0 CG1 inch Gravel 0 0 31 40 0 0 0 0 0 0 0 03/4 inch Gravel 23 24 50 32 0 0 0 0 26 10 40 341/2 inch Gravel 30 0 5 0 0 0 0 0 21 19 0 03/8 inch Gravel 31 40 0 0 0 0 0 0 0 0 0 0RAP 10 10 8 10 0 0 0 0 0 0 0 0Sand 0 10 0 9 10 10 10 10 12 20 14 1557 Limestone 0 0 0 0 0 0 0 0 0 0 10 867 Limestone 0 0 0 0 0 0 0 0 0 0 0 078 Limestone 0 0 0 0 0 0 0 0 22 20 15 128910 Limestone 5 15 5 8 0 18 0 18 18 30 20 3067 Sandstone 0 0 0 0 15 15 30 35 0 0 0 078 Sandstone 0 0 0 0 37 0 28 0 0 0 0 089 Sandstone 0 0 0 0 23 43 15 23 0 0 0 08 Sandstone 0 0 0 0 0 0 0 0 0 0 0 01/4 x 0 Sandstone 0 0 0 0 14 13 16 13 0 0 0 0Hydrated Lime 1 1 1 1 1 1 1 1 1 1 1 1
Aggregate Stockpile Sandstone Limestone / GravelGravel
Aggregate Blend

16
Table 3.3 Study Aggregate Blend Gradations
Fine Coarse Fine Coarse Fine Coarse Fine Coarse Fine Coarse Fine Coarse25 100 100 100 10019 100 100 99 99 100 100 100 100 100 100 98 97
12.5 95 95 89 86 94 94 86 88 96 93 86 849.5 87 86 78 72 88 88 76 79 87 80 75 70
4.75 59 52 51 42 58 51 50 45 64 50 55 462.36 37 32 33 27 40 29 36 27 47 34 40 331.18 26 21 23 19 30 22 28 21 36 26 31 260.6 19 16 17 15 25 19 23 18 29 21 25 210.3 14 11 12 11 18 14 16 14 17 12 15 13
0.15 10 8 9 8 11 9 10 8 9 8 9 80.075 7.7 6.4 6.9 6.1 7.5 5.9 7.1 5.8 7.1 5.9 7.1 5.9
Sieve Size (mm) 12.5 mm 19.0 mm 12.5 mm
SandstonePercent Passing
Gravel12.5 mm 19.0 mm19.0 mm
Limestone / Gravel
17
0.0
10.0
20.0
30.0
40.0
50.0
60.0
70.0
80.0
90.0
100.0
Sieve Size (mm) ^0.45
Per
cent
Pas
sing
12.5 GRV Coarse 12.5 GRV Fine 12.5 Sandstone Coarse12.5 Sandstone Fine 12.5 LMS/GRV Coarse 12.5 LMS/GRV Fine
0.075 9.52.36 12.54.750.3 1.180.15 0.6 19.0
Figure 3.1 12.5mm NMAS Aggregate Blend Gradations
18
0.0
10.0
20.0
30.0
40.0
50.0
60.0
70.0
80.0
90.0
100.0
Sieve Size (mm) ^0.45
Per
cent
Pas
sing
12.5 GRV Coarse 12.5 GRV Fine 12.5 Sandstone Coarse12.5 Sandstone Fine 12.5 LMS/GRV Coarse 12.5 LMS/GRV Fine
0.075 9.52.36 12.54.750.3 1.180.15 0.6 19.0
Figure 3.2 19.0 mm NMAS Aggregate Blend Gradations

19
Superpave mix designs were conducted for each study mix combination in accordance
with MDOT MT-78 (7) protocols. The PG 67-22 and PG 76-22 asphalt binders were
provided by Ergon, Inc. The target mixing and compaction temperatures for the two
asphalt binders are provided in Table 3.4. All mixing was conducted using a bucket
mixing device as shown in Figure 3.3.
Table 3.4 Target Mixing, Curing, and Compaction Temperatures
Mixing Curing Compaction
PG 67-22 155 (310) 152 (305) 146 (295)
PG 76-22 163 (325) 160 (320) 155 (310)
Temperature, C (F)Asphalt Binder
Figure 3.3 Project Mixing

20
A standard procedure was used for preparing the PG 76-22 asphalt binder. Per
Ergon’s recommendations, the asphalt binder was heated to 150°C (300°F) and stirred
continuously using a low shear mixer for 1 hour prior to incorporation with aggregates.
All aggregates in the study were heated to 175°C (345°F) for four hours prior to
mixing. The mixing time varied but was normally approximately 2 to 3 minutes to insure
adequate coating of the aggregate particles. After mixing, specimens were placed in pans
which were placed in an oven set at 5°C (10°F) above the compaction temperature for 1.5
hours for short-term aging.
After short-term aging, specimens were compacted to the specified number of
gyrations in a Pine Superpave Gyratory Compactor (Model AFGC125X), shown in
Figure 3.4. After compaction, the bulk specific gravity of the compacted HMA mix
(Gmb) was determined and the air voids, VMA, VFA, %Gmm at Ninitial determined.
Figure 3.4 Pine Superpave Gyratory Compactor
21
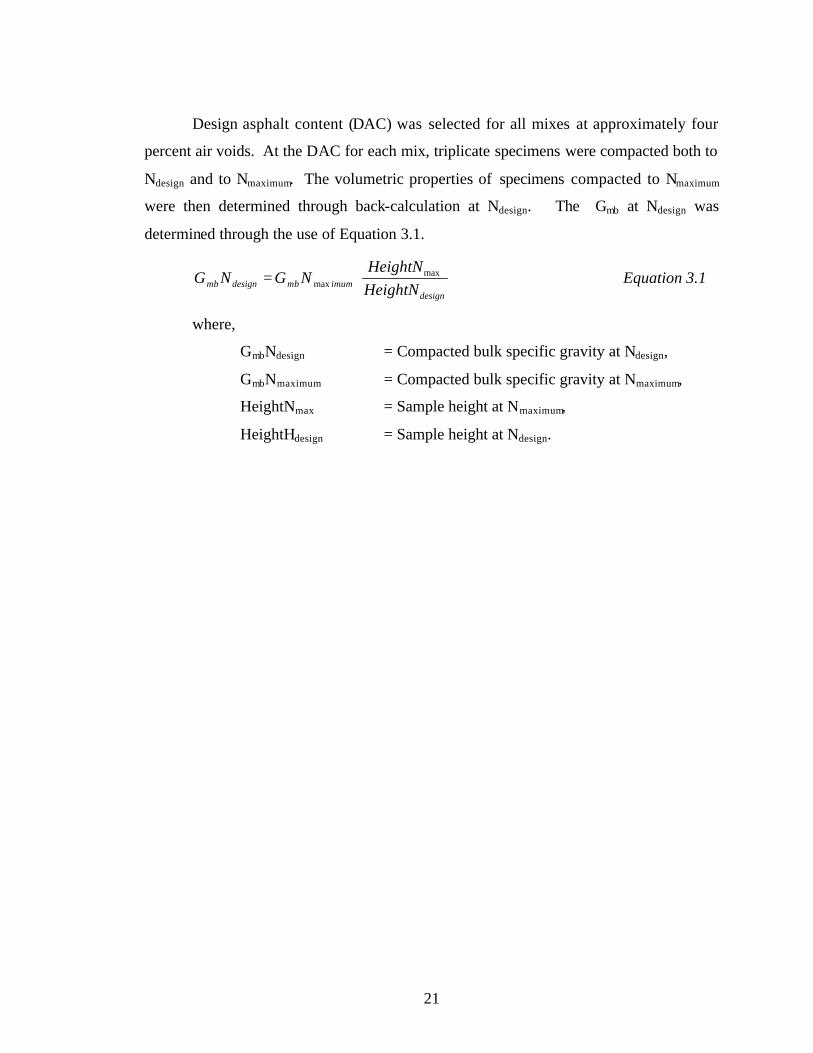
Design asphalt content (DAC) was selected for all mixes at approximately four
percent air voids. At the DAC for each mix, triplicate specimens were compacted both to
Ndesign and to Nmaximum. The volumetric properties of specimens compacted to Nmaximum
were then determined through back-calculation at Ndesign. The Gmb at Ndesign was
determined through the use of Equation 3.1.
=
designimummbdesignmb HeightN
HeightNNGNG max
max Equation 3.1
where,
GmbNdesign = Compacted bulk specific gravity at Ndesign,
GmbNmaximum = Compacted bulk specific gravity at Nmaximum,
HeightNmax = Sample height at Nmaximum,
HeightHdesign = Sample height at Ndesign.

22
CHAPTER 4 TEST RESULTS AND ANALYSIS
4.1 AGGREGATE PROPERTIES
All aggregates selected for evaluation in this study are commonly used for HMA
production in Mississippi. Various physical properties of the coarse and fine aggregates
are provided in Table 4.1. The table shows that the four aggregates selected for
evaluation exhibit a wide range of physical properties, such as specific gravity,
absorption, particle shape, and angularity.
Aggregate absorption will significantly affect the mixture design asphalt content,
along with its volumetric properties after compaction. Aggregate particle shape and
angularity will influence the densification rate and mixture surface texture of the mixture
during compaction and thus the mixture volumetric properties.

23
Table 4.1 Physical Properties of Aggregate Blends
Fine Coarse Fine Coarse Fine Coarse Fine Coarse Fine Coarse Fine CoarseApparent Specific
Gravity, Gsa
2.641 2.652 2.628 2.637 2.670 2.683 2.675 2.678 2.679 2.672 2.675 2.672
Bulk Specific Gravity, Gsb
2.437 2.470 2.430 2.448 2.527 2.557 2.546 2.552 2.595 2.570 2.590 2.574
Absorption (%)
3.17 2.78 3.10 2.92 2.12 1.84 1.89 1.84 1.21 1.48 1.24 1.42
Fractured Faces (%)1 95/90 95/90 95/90 95/90 100/100 100/100 100/100 100/100 98/93 98/93 98/93 98/93
Uncompacted Voids (%)
44.2 44.0 43.9 43.8 48.5 47.4 48.4 47.5 45.6 45.7 45.6 45.5
19.0 mm
Note: 1) 1 or more fractured faces / 2 or more fractured faces
Property 12.5 mm 19.0 mm 12.5 mmGravel Sandstone Limestone / Gravel
19.0 mm 12.5 mm

24
4.2 REASONS FOR ERROR IN BACK CALCULATED VOLUMETRICS
One of the major reasons for there to be differences in volumetrics of specimens
compacted directly to Ndesign as opposed to those back calculated to Ndesign from Nmaximum
is the change in surface texture of a HMA specimen from Ndesign to Nmaximum. During
compaction, surface irregularities, voids, or texture will typically decrease. This decrease
is rapid during initial compaction and then slows toward the end of compaction. The
change in surface texture from Ndesign to Nmaximum can be significant and results in density
differences.
Theoretically, the back calculated density at Ndesign can not be less than the direct
calculated density. In fact, if there is no test variability and the sides of the HMA
specimens are perfectly smooth or if the surface texture is the same at Ndesign and
Nmaximum, the direct and back calculated density should be the same.
Obviously, the compacted specimen surface texture of a given mix will be
dependent upon the aggregates shape and texture, gradation, and size. For example, a
coarse-graded mix would be expected to exhibit a larger density difference at Ndesign than
would a fine-graded mix. As a mix’s surface texture approaches that of a smooth sided
cylinder, the amount of error from the back-calculation procedure is reduced.
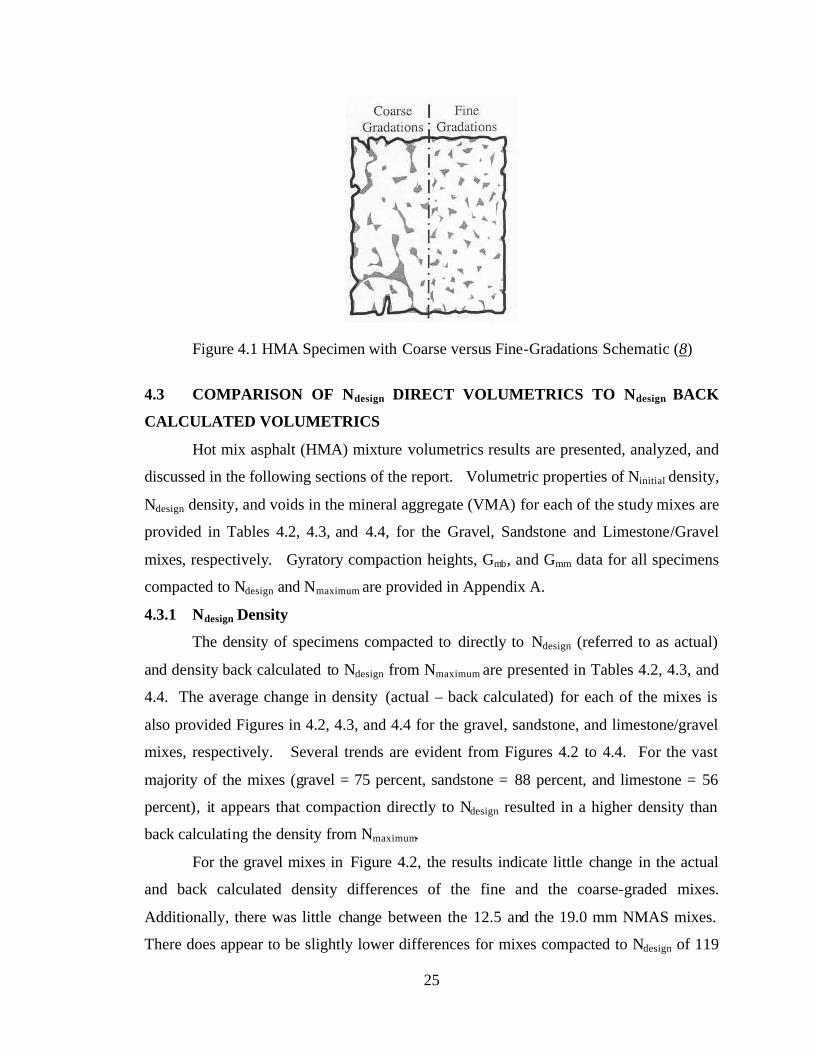
Figure 4.1 illustrates two specimens: one coarse-graded and one fine-graded. It is
evident that the coarse-graded sample has a far greater amount of surface voids than the
fine-graded sample. With more surface texture present there is a greater probability that
the surface texture will change during compaction. This change in surface texture is the
driving force behind the density differences.
25
Figure 4.1 HMA Specimen with Coarse versus Fine-Gradations Schematic (8)
4.3 COMPARISON OF Ndesign DIRECT VOLUMETRICS TO Ndesign BACK
CALCULATED VOLUMETRICS
Hot mix asphalt (HMA) mixture volumetrics results are presented, analyzed, and
discussed in the following sections of the report. Volumetric properties of Ninitial density,
Ndesign density, and voids in the mineral aggregate (VMA) for each of the study mixes are
provided in Tables 4.2, 4.3, and 4.4, for the Gravel, Sandstone and Limestone/Gravel
mixes, respectively. Gyratory compaction heights, Gmb, and Gmm data for all specimens
compacted to Ndesign and Nmaximum are provided in Appendix A.
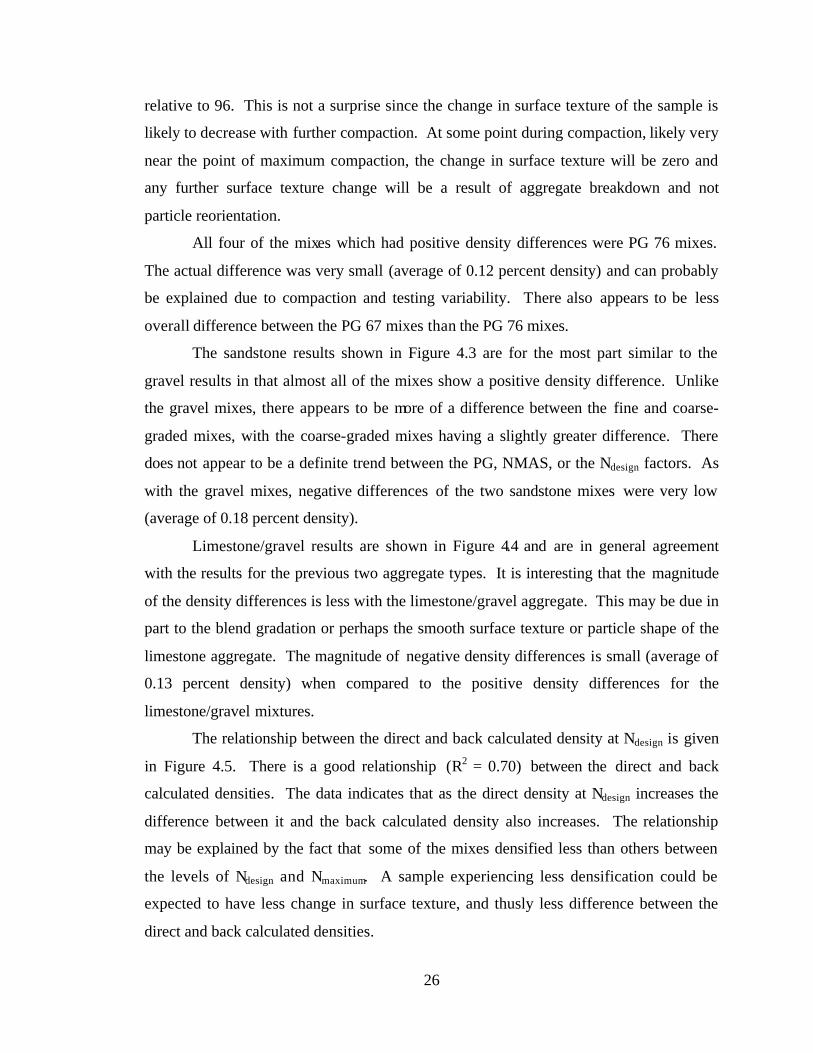
4.3.1 Ndesign Density
The density of specimens compacted to directly to Ndesign (referred to as actual)
and density back calculated to Ndesign from Nmaximum are presented in Tables 4.2, 4.3, and
4.4. The average change in density (actual – back calculated) for each of the mixes is
also provided Figures in 4.2, 4.3, and 4.4 for the gravel, sandstone, and limestone/gravel
mixes, respectively. Several trends are evident from Figures 4.2 to 4.4. For the vast
majority of the mixes (gravel = 75 percent, sandstone = 88 percent, and limestone = 56
percent), it appears that compaction directly to Ndesign resulted in a higher density than
back calculating the density from Nmaximum.
For the gravel mixes in Figure 4.2, the results indicate little change in the actual
and back calculated density differences of the fine and the coarse-graded mixes.
Additionally, there was little change between the 12.5 and the 19.0 mm NMAS mixes.
There does appear to be slightly lower differences for mixes compacted to Ndesign of 119
26
relative to 96. This is not a surprise since the change in surface texture of the sample is
likely to decrease with further compaction. At some point during compaction, likely very
near the point of maximum compaction, the change in surface texture will be zero and
any further surface texture change will be a result of aggregate breakdown and not
particle reorientation.
All four of the mixes which had positive density differences were PG 76 mixes.
The actual difference was very small (average of 0.12 percent density) and can probably
be explained due to compaction and testing variability. There also appears to be less
overall difference between the PG 67 mixes than the PG 76 mixes.
The sandstone results shown in Figure 4.3 are for the most part similar to the
gravel results in that almost all of the mixes show a positive density difference. Unlike
the gravel mixes, there appears to be more of a difference between the fine and coarse-
graded mixes, with the coarse-graded mixes having a slightly greater difference. There
does not appear to be a definite trend between the PG, NMAS, or the Ndesign factors. As
with the gravel mixes, negative differences of the two sandstone mixes were very low
(average of 0.18 percent density).
Limestone/gravel results are shown in Figure 4.4 and are in general agreement
with the results for the previous two aggregate types. It is interesting that the magnitude
of the density differences is less with the limestone/gravel aggregate. This may be due in
part to the blend gradation or perhaps the smooth surface texture or particle shape of the
limestone aggregate. The magnitude of negative density differences is small (average of
0.13 percent density) when compared to the positive density differences for the
limestone/gravel mixtures.
The relationship between the direct and back calculated density at Ndesign is given
in Figure 4.5. There is a good relationship (R2 = 0.70) between the direct and back
calculated densities. The data indicates that as the direct density at Ndesign increases the
difference between it and the back calculated density also increases. The relationship
may be explained by the fact that some of the mixes densified less than others between
the levels of Ndesign and Nmaximum. A sample experiencing less densification could be
expected to have less change in surface texture, and thusly less difference between the
direct and back calculated densities.
27
Table 4.2 Volumetric Properties for the Gravel Mixes
Ndesign Nmaximum Difference ActualBack-
Calculated Difference ActualBack-
Calculated Difference
Fine 5.1 87.15 86.95 0.20 96.16 95.60 0.56 97.07 13.33 13.83 -0.50Coarse 7.9 85.92 85.75 0.17 95.79 95.22 0.57 96.79 17.02 17.52 -0.50
Fine 5.3 86.84 86.69 0.15 95.96 95.25 0.71 96.70 13.11 13.75 -0.64Coarse 7.1 86.52 85.91 0.61 96.07 95.16 0.91 96.30 16.35 17.09 -0.74
Fine 5.4 87.19 86.63 0.56 96.03 95.26 0.77 96.43 14.08 14.77 -0.69Coarse 7.6 86.25 85.92 0.33 95.89 95.28 0.61 97.15 17.72 18.25 -0.53
Fine 5.4 87.36 86.72 0.64 95.85 95.23 0.62 96.41 13.83 14.39 -0.56Coarse 6.7 86.60 86.42 0.18 95.92 95.78 0.14 97.07 16.39 16.51 -0.12
Fine 4.9 86.57 86.51 0.06 95.92 95.59 0.33 97.03 13.10 13.40 -0.30Coarse 7.7 85.57 85.09 0.48 96.08 95.35 0.73 96.82 16.29 16.91 -0.62
Fine 5.2 86.33 85.72 0.61 95.92 94.91 1.01 96.31 12.94 13.92 -0.98Coarse 7.0 85.72 85.49 0.23 95.81 95.43 0.38 96.93 16.29 16.62 -0.33
Fine 5.4 87.14 86.92 0.22 96.18 96.26 -0.08 97.43 14.01 13.95 0.06Coarse 7.2 84.79 84.85 -0.06 95.91 95.99 -0.08 97.20 16.92 16.85 0.07
Fine 5.4 86.82 87.21 -0.39 96.05 96.24 -0.19 97.28 13.65 13.49 0.16Coarse 6.4 86.02 86.11 -0.09 95.84 95.97 -0.13 97.14 15.86 15.75 0.11
19
119
67-2212.5
19
76-2212.5
19
%Gmm at Ndesign VMA at Ndesign%Gmm at Ninitial Back-
Calculated from:
Chert Gravel
96
67-2212.5
19
76-2212.5
Aggregate NdesignPG
Binder
Nominal Maximum Aggregate Size (mm)
GradationDesign AC (%)
Volumetric / Compaction Properties
%Gmm at Nmaximum

28
Table 4.3 Volumetric Properties for the Sandstone Mixes
Ndesign Nmaximum Difference Actual Back-Calculated
Difference Actual Back-Calculated
Difference
Fine 4.6 86.76 86.66 0.10 94.73 94.63 0.10 95.78 13.70 13.78 -0.08Coarse 5.4 86.00 85.22 0.78 96.63 96.00 0.63 97.66 14.41 14.96 -0.55
Fine 4.2 86.29 86.53 -0.24 94.39 94.52 -0.13 95.69 13.12 13.00 0.12Coarse 5.0 86.00 85.37 0.63 96.34 95.69 0.65 97.32 13.78 14.36 -0.58
Fine 5.0 88.10 87.53 0.57 96.04 95.45 0.59 96.52 13.37 13.90 -0.53Coarse 5.3 85.09 84.95 0.14 95.04 94.77 0.27 96.27 15.54 15.78 -0.24
Fine 4.2 87.67 87.45 0.22 95.89 95.53 0.36 96.71 11.86 12.19 -0.33Coarse 5.5 87.11 86.62 0.49 97.20 96.33 0.87 97.78 14.08 14.85 -0.77
Fine 4.3 86.36 86.75 -0.39 94.68 94.91 -0.23 96.04 13.10 12.88 0.22Coarse 5.3 85.80 85.43 0.37 96.95 96.41 0.54 98.06 13.86 14.35 -0.49
Fine 4.1 86.46 85.74 0.72 94.55 93.96 0.59 95.15 12.87 13.41 -0.54Coarse 5.0 86.24 85.37 0.87 96.81 95.80 1.01 97.32 12.67 13.58 -0.91
Fine 4.3 87.05 87.22 -0.17 94.98 94.94 0.04 95.95 12.81 12.84 -0.03Coarse 5.2 85.55 84.87 0.68 96.67 95.77 0.90 97.41 13.94 14.74 -0.80
Fine 4.1 87.95 87.29 0.66 96.19 95.66 0.53 96.87 11.37 11.85 -0.48Coarse 5.2 84.78 84.44 0.34 95.01 94.70 0.31 96.17 15.36 15.63 -0.27
12.5
19
76-2212.5
19
Sandstone
96
67-2212.5
19
76-2212.5
19
119
67-22
GradationDesign AC (%)
Volumetric / Compaction Properties
%Gmm at Nmaximum
%Gmm at Ndesign VMA at Ndesign%Gmm at Ninitial Back-
Calculated from:Aggregate NdesignPG
Binder
Nominal Maximum Aggregate Size (mm)
29
Table 4.4 Volumetric Properties for the Limestone/Gravel Mixes
Ndesign Nmaximum Difference ActualBack-
Calculated Difference ActualBack-
Calculated Difference
Fine 4.3 87.12 87.18 -0.06 95.13 95.13 0.00 96.18 13.70 13.70 0.00Coarse 4.5 87.82 87.67 0.15 96.06 96.01 0.05 97.29 12.85 12.89 -0.04
Fine 4.1 89.44 89.52 -0.08 96.88 96.91 -0.03 97.95 11.44 11.41 0.03Coarse 4.5 87.59 87.17 0.42 95.14 95.25 -0.11 96.47 12.67 12.57 0.10
Fine 4.3 87.36 86.86 0.50 94.82 94.69 0.13 95.62 13.99 14.28 -0.29Coarse 4.6 87.23 86.97 0.26 95.47 95.20 0.27 96.32 13.59 13.84 -0.25
Fine 4.5 89.06 88.75 0.31 96.46 96.08 0.38 96.98 11.86 12.20 -0.34Coarse 4.6 87.61 87.80 -0.19 95.28 95.51 -0.23 96.61 13.07 12.86 0.21
Fine 4.0 87.71 87.57 0.14 95.52 95.45 0.07 96.58 12.71 12.77 -0.06Coarse 4.5 87.28 87.33 -0.05 95.62 95.79 -0.17 97.02 13.25 13.09 0.16
Fine 4.0 88.70 88.04 0.66 96.89 96.49 0.40 97.71 11.22 11.58 -0.36Coarse 4.1 88.46 88.06 0.40 96.75 95.92 0.83 97.07 11.54 11.84 -0.30
Fine 4.3 87.47 87.69 -0.22 95.17 95.37 -0.20 96.46 13.67 13.48 0.19Coarse 4.6 88.05 86.93 1.12 96.30 95.64 0.66 96.83 12.85 13.44 -0.59
Fine 4.4 89.24 89.38 -0.14 96.62 96.63 -0.01 97.49 11.61 11.61 0.00Coarse 4.3 87.59 87.69 -0.10 95.23 95.40 -0.17 96.45 12.46 12.31 0.15
12.5
19
76-2212.5
19
Limestone/Gravel
96
67-2212.5
19
76-2212.5
19
119
67-22
GradationDesign AC (%)
Volumetric / Compaction Properties
%Gmm at Nmaximum
%Gmm at Ndesign VMA at Ndesign%Gmm at Ninitial Back-
Calculated from:Aggregate NdesignPG
Binder
Nominal Maximum Aggregate Size (mm)
30
% Gmm @ Ndesign
Gravel Aggregate
0.56
0.710.77
0.62
0.33
1.01
-0.08-0.19
0.57
0.91
0.61
0.14
0.73
0.38
-0.08 -0.13
-1.50
-1.25
-1.00
-0.75
-0.50
-0.25
0.00
0.25
0.50
0.75
1.00
1.25
1.50%
Gm
m @
Nde
sign
(A
ctua
l - B
ackc
alcu
late
d)
Fine Coarse
PG 67-22 PG 76-22
Nd = 96
12.5 19.0 12.5 19.0
PG 67-22 PG 76-22
Nd = 119
12.5 19.0 12.5 19.0
Figure 4.2 % Gmm at Ndesign Difference for Gravel Aggregate
31
% Gmm @ Ndesign
Sandstone Aggregate
0.10
-0.13
0.59
0.36
-0.23
0.59
0.04
0.530.63 0.65
0.27
0.87
0.54
1.010.90
0.31
-1.50
-1.25
-1.00
-0.75
-0.50
-0.25
0.00
0.25
0.50
0.75
1.00
1.25
1.50%
Gm
m @
Nde
sign
(A
ctua
l - B
ackc
alcu
late
d)
Fine Coarse
PG 67-22 PG 76-22
Nd = 96
12.5 19.0 12.5 19.0
PG 67-22 PG 76-22
Nd = 119
12.5 19.0 12.5 19.0
Figure 4.3 % Gmm at Ndesign Difference for Sandstone Aggregate
32
% Gmm @ Ndesign
Limestone / Gravel Aggreagte
0.00
-0.03
0.13
0.38
0.07
0.40
-0.20
-0.01
0.05
-0.11
0.27
-0.23 -0.17
0.83
0.66
-0.17
-1.50
-1.25
-1.00
-0.75
-0.50
-0.25
0.00
0.25
0.50
0.75
1.00
1.25
1.50%
Gm
m @
Nde
sign
(A
ctua
l - B
ackc
alcu
late
d)
Fine Coarse
PG 67-22 PG 76-22
Nd = 96
12.5 19.0 12.5 19.0
PG 67-22 PG 76-22
Nd = 119
12.5 19.0 12.5 19.0
Figure 4.4 % Gmm at Ndesign Difference for Limestone/Gravel Aggregate

33
% Gmm @ Ndesign
y = 0.7172x + 26.775
R2 = 0.6969
93.50
94.00
94.50
95.00
95.50
96.00
96.50
97.00
97.50
93.50 94.00 94.50 95.00 95.50 96.00 96.50 97.00 97.50
% Gmm @ Ndesign (Direct)
% G
mm
@ N
desi
gn (B
ackc
alcu
late
d)
Line of Equality
Figure 4.5 % Gmm at Ndesign (Back calculated versus Direct)

34
4.3.1.1 Ndesign Density Statistical Analysis
A multi-factor analysis of variance (ANOVA) was used to evaluate the study
data. The response variables were: 1) Ndesign density difference, 2) VMA at Ndesign
difference, and 3) Ninitial density difference (determined by back-calculation from Ndesign
and Nmaximum). All main factors (aggregate, Ndesign, PG, NMAS, and gradation) and their
interactions were analyzed. All statistical analyzes were conducted at a level of
significance of 5 percent using the Statistical Analysis System (SAS) Version 8.2 (9). In
addition to the ANOVA, a Tukey’s multiple comparison test was conducted for each
response variable to determine the effects of the different factors.
ANOVA results for Ndesign density difference are provided in Table 4.5. It is
evident from the analysis results that aggregate type is the most significant of the study
factors. None of the other factors alone were determined to be significant, although
gradation was close at a P-value of 0.081. Two-way interactions involving aggregate
were significant with the exception of the aggregate*NMAS interaction. Other
significant two-way interactions were PG*Ndesign and PG*NMAS. Only three of the 12
three-way interactions were determined to be significant.
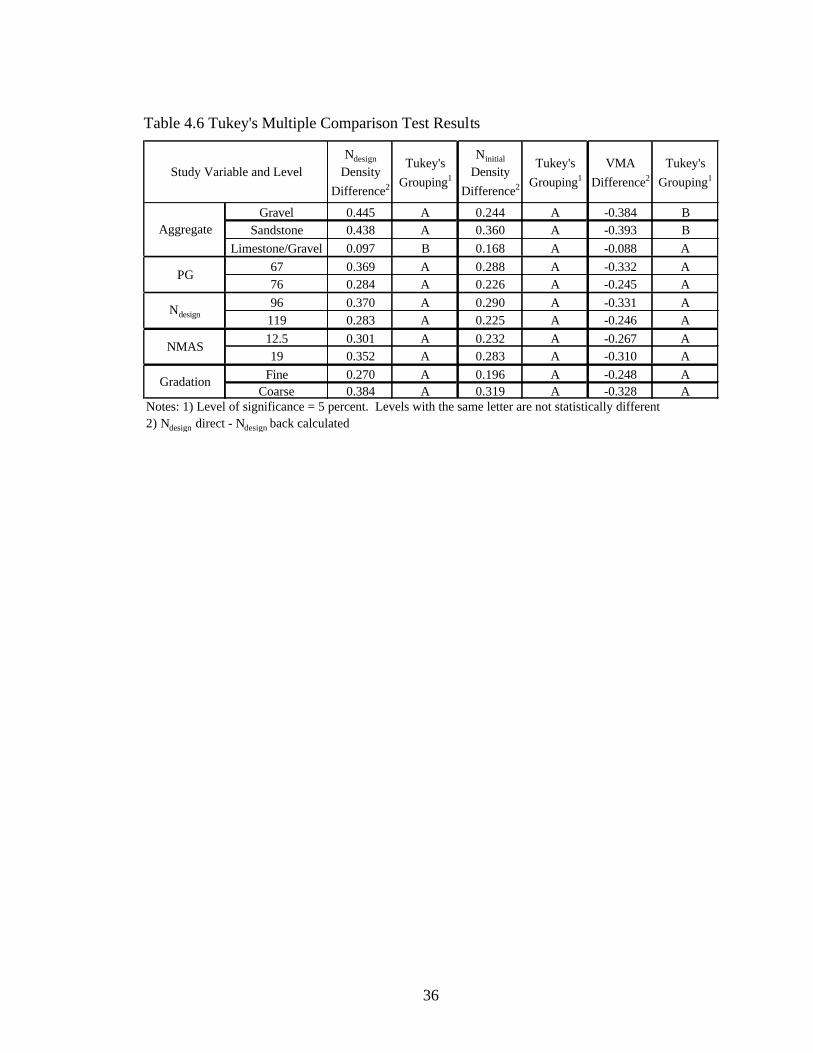
Tukey’s multiple comparison test results for the Ndesign density difference are
provided in Table 4.6. From a review of the results, it is clear that the high significance
of the aggregate factor is a result of the limestone/gravel aggregate mixes having a much
lower density difference than the other two aggregates. As would be expected from the
ANOVA results, there are no statistical differences among the study levels of PG, Ndesign,
NMAS, and gradation.

35
Table 4.5 ANOVA Results for Ndesign Density Difference
SourceDegrees
of Freedom
Mean Squares F-stat
Prob > F-stat
Statistically Significant (Yes/No?)1
Aggregate 2 1.910 12.710 <0.0001 YESPG 1 0.263 1.750 0.189 NONdesign 1 0.269 1.800 0.183 NONMAS 1 0.093 0.620 0.434 NOGradation 1 0.466 3.110 0.081 NOAgg*PG 2 0.948 6.330 0.003 YESAgg*Ndesign 2 0.554 3.700 0.028 YESAgg*NMAS 2 0.152 1.010 0.366 NOAgg*Grad 2 0.865 5.780 0.004 YESPG*Ndesign 1 1.100 7.350 0.008 YESPG*NMAS 1 0.959 6.400 0.013 YESPG*Grad 1 0.169 1.130 0.291 NONdesign*NMAS 1 0.361 2.410 0.124 NONdesign*Grad 1 0.223 1.490 0.225 NONMAS*Grad 1 0.482 3.220 0.076 NOAgg*PG*Ndesign 2 0.055 0.370 0.689 NOAgg*PG*NMAS 2 0.037 0.240 0.784 NOAgg*PG*Grad 2 0.205 1.370 0.259 NOAgg*Ndesign*NMAS 2 0.011 0.070 0.928 NOAgg*Ndesign*Grad 2 0.029 0.190 0.824 NOAgg*NMAS*Grad 2 0.065 0.440 0.648 NOPG*Ndesign*NMAS 1 0.328 2.190 0.142 NOPG*Ndesign*Grad 1 0.827 5.520 0.021 YESPG*NMAS*Grad 1 0.056 0.380 0.541 NONdesign*NMAS*Grad 1 0.662 4.430 0.031 YESAgg*PG*Ndesign*NMAS 2 0.402 2.690 0.073 NOAgg*PG*Ndesign*Grad 2 0.060 0.400 0.670 NOAgg*Ndesign*NMAS*Grad 2 0.294 1.970 0.145 NOAgg*PG*NMAS*Grad 2 0.540 3.610 0.031 YESPG*Ndesign*NMAS*Grad 1 0.282 1.880 0.158 NOAgg*PG*Ndesign*NMAS*Grad 2 0.002 0.020 0.903 NOModel 47 0.336 2.720 <0.0001 YESError 96 0.149Note: 1) Conducted at a level of significance of 5 percent.
36
Table 4.6 Tukey's Multiple Comparison Test Results
Ndesign
Density Difference2
Tukey's Grouping1
Ninitial
Density Difference2
Tukey's Grouping1
VMA Difference2
Tukey's Grouping1
Gravel 0.445 A 0.244 A -0.384 BSandstone 0.438 A 0.360 A -0.393 B
Limestone/Gravel 0.097 B 0.168 A -0.088 A67 0.369 A 0.288 A -0.332 A76 0.284 A 0.226 A -0.245 A96 0.370 A 0.290 A -0.331 A119 0.283 A 0.225 A -0.246 A12.5 0.301 A 0.232 A -0.267 A19 0.352 A 0.283 A -0.310 A
Fine 0.270 A 0.196 A -0.248 ACoarse 0.384 A 0.319 A -0.328 A
2) Ndesign direct - Ndesign back calculated
Gradation
Notes: 1) Level of significance = 5 percent. Levels with the same letter are not statistically different
Ndesign
NMAS
Aggregate
Study Variable and Level
PG
37
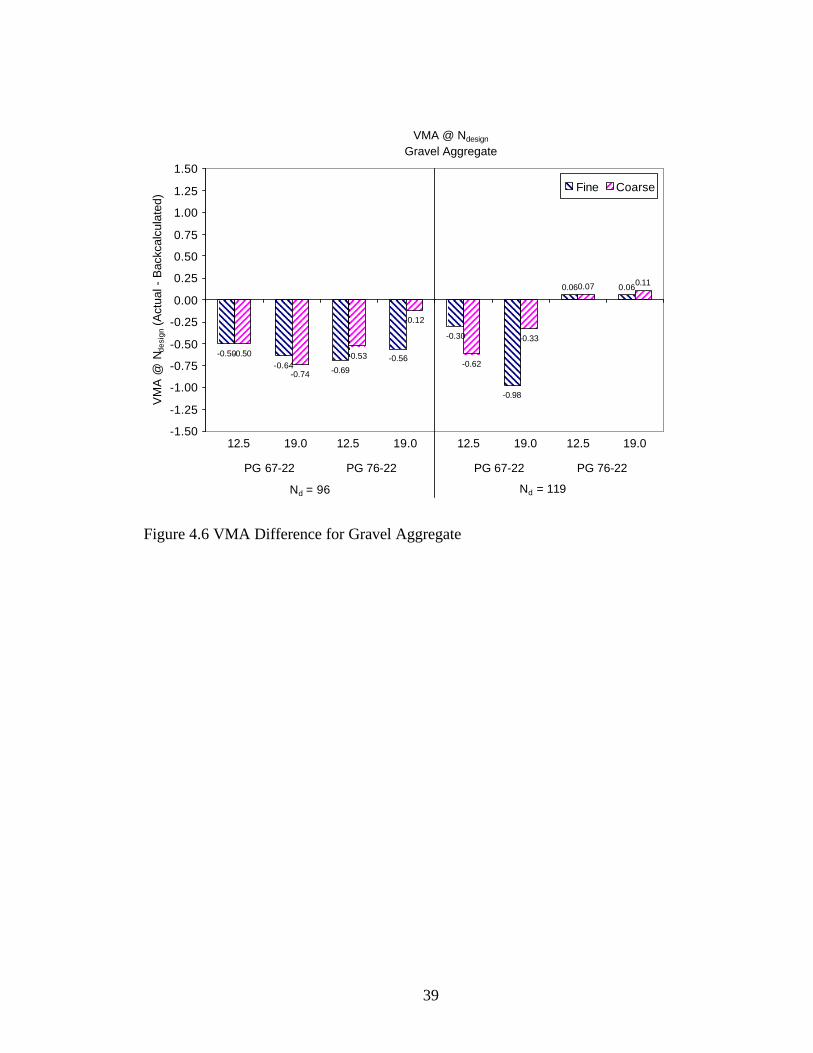
4.3.2 Voids in Mineral Aggregate (VMA)
Also of interest is the change in the voids in the mineral aggregate (VMA) of
specimens compacted to Ndesign and those back calculated from Nmaximum. VMA is
directly influenced by the change in the specimen Gmb value, as shown in the following
VMA equation.
100**
100
−=
GsbGmbPs
VMA Equation 4.1
where,
VMA = Voids in the mineral aggregate,
Ps = Percent stone or aggregate in the mix,
Gmb = Bulk specific gravity of the compacted mix,
Gsb = Bulk specific gravity of the aggregate blend.
If a mix has a density at Ndesign direct that is greater than the density at Ndesign back
calculated, the Gmb will obviously be higher. In the VMA equation a higher Gmb will
produce a lower VMA value. Therefore, the relationship between VMA from specimens
compacted directly to Ndesign and those back calculated from Nmaximum should follow the
same trend as those for the Ndesign density analysis section.
Figures 4.6 through 4.8 illustrate the VMA differences for the gravel, sandstone,
and limestone/gravel aggregate blends, respectively. From each of the figures, it is clear
that the VMA trends are similar to those for the Ndesign density. Figure 4.9 illustrates the
excellent relationship between the VMA at Ndesign direct and the VMA at Ndesign through
back calculation from Nmaximum. The regression line is almost parallel (slope = 1.026
compared to 1.000) to the line of equality. There exists a bias in the data, with the back
calculated VMA being slightly higher than the direct calculated VMA.
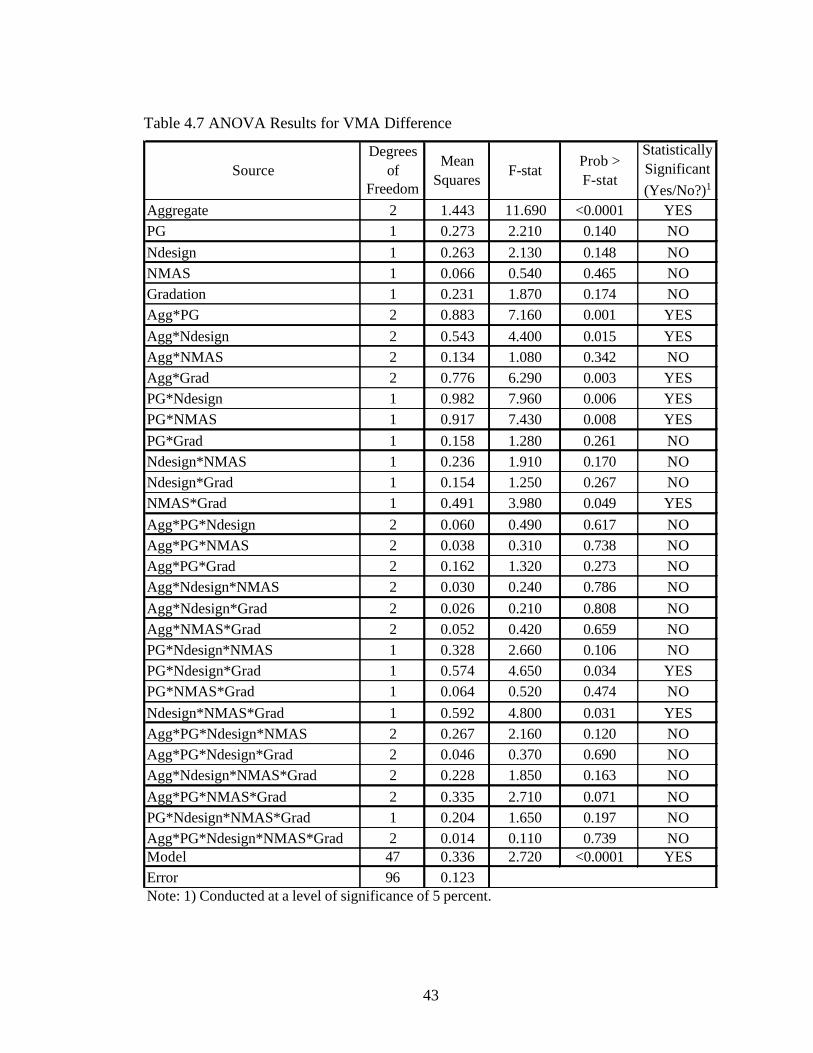
4.3.2.1 VMA Statistical Analysis
The results of the VMA ANOVA are provided in Table 4.7. As expected the
results agree well with those for the Ndesign density. The only exception is the
significance of the two-way interaction of NMAS and gradation being significant, and the
non-significance of the four-way interaction, AGG*PG*NMAS*GRAD.

38
Tukey’s comparison results, shown in Table 4.6, indicate that the VMA
differences for the limestone/gravel aggregate mixes are statistically different that those
for the gravel and sandstone aggregate mixes. There were no statistical differences found
between the project levels of PG, Ndesign, NMAS, or gradation.
39
VMA @ Ndesign
Gravel Aggregate
-0.50-0.64 -0.69
-0.56
-0.30
-0.98
0.06 0.06
-0.50
-0.74
-0.53
-0.12
-0.62
-0.33
0.07 0.11
-1.50
-1.25
-1.00
-0.75
-0.50
-0.25
0.00
0.25
0.50
0.75
1.00
1.25
1.50V
MA
@ N
desi
gn (
Act
ual -
Bac
kcal
cula
ted)
Fine Coarse
PG 67-22 PG 76-22
Nd = 96
12.5 19.0 12.5 19.0
PG 67-22 PG 76-22
Nd = 119
12.5 19.0 12.5 19.0
Figure 4.6 VMA Difference for Gravel Aggregate

40
VMA @ Ndesign
Sandstone Aggregate
-0.08
0.12
-0.53
-0.33
0.22
-0.54
-0.03
-0.48-0.55 -0.58
-0.24
-0.77
-0.49
-0.91-0.80
-0.27
-1.50
-1.25
-1.00
-0.75
-0.50
-0.25
0.00
0.25
0.50
0.75
1.00
1.25
1.50%
Gm
m @
Nin
itial (
Act
ual -
Bac
kcal
cula
ted)
Fine Coarse
PG 67-22 PG 76-22
Nd = 96
12.5 19.0 12.5 19.0
PG 67-22 PG 76-22
Nd = 119
12.5 19.0 12.5 19.0
Figure 4.7 VMA Difference for Sandstone Aggregate
41
VMA @ Ndesign
Limestone / Gravel Aggregate
0.00 0.03
-0.29 -0.34
-0.06
-0.36
0.19
0.00
-0.04
0.10
-0.25
0.21 0.16
-0.30
-0.59
0.15
-1.50
-1.25
-1.00
-0.75
-0.50
-0.25
0.00
0.25
0.50
0.75
1.00
1.25
1.50V
MA
@ N
initi
al (
Act
ual -
Bac
kcal
cula
ted)
Fine Coarse
PG 67-22 PG 76-22
Nd = 96
12.5 19.0 12.5 19.0
PG 67-22 PG 76-22
Nd = 119
12.5 19.0 12.5 19.0
Figure 4.8 VMA Difference for Limestone/Gravel Aggregate

42
VMA @ Ndesign
y = 1.0257x - 0.0669R
2 = 0.9609
11.00
12.00
13.00
14.00
15.00
16.00
17.00
18.00
19.00
11.00 12.00 13.00 14.00 15.00 16.00 17.00 18.00 19.00
VMA @ Ndesign (Direct)
VM
A @
Nde
sign
(B
ackc
alcu
late
d)
Line of Equality
Figure 4.9 VMA (Back calculated versus Direct)
43
Table 4.7 ANOVA Results for VMA Difference
SourceDegrees
of Freedom
Mean Squares
F-statProb > F-stat
Statistically Significant (Yes/No?)1
Aggregate 2 1.443 11.690 <0.0001 YESPG 1 0.273 2.210 0.140 NONdesign 1 0.263 2.130 0.148 NONMAS 1 0.066 0.540 0.465 NOGradation 1 0.231 1.870 0.174 NOAgg*PG 2 0.883 7.160 0.001 YESAgg*Ndesign 2 0.543 4.400 0.015 YESAgg*NMAS 2 0.134 1.080 0.342 NOAgg*Grad 2 0.776 6.290 0.003 YESPG*Ndesign 1 0.982 7.960 0.006 YESPG*NMAS 1 0.917 7.430 0.008 YESPG*Grad 1 0.158 1.280 0.261 NONdesign*NMAS 1 0.236 1.910 0.170 NONdesign*Grad 1 0.154 1.250 0.267 NONMAS*Grad 1 0.491 3.980 0.049 YESAgg*PG*Ndesign 2 0.060 0.490 0.617 NOAgg*PG*NMAS 2 0.038 0.310 0.738 NOAgg*PG*Grad 2 0.162 1.320 0.273 NOAgg*Ndesign*NMAS 2 0.030 0.240 0.786 NOAgg*Ndesign*Grad 2 0.026 0.210 0.808 NOAgg*NMAS*Grad 2 0.052 0.420 0.659 NOPG*Ndesign*NMAS 1 0.328 2.660 0.106 NOPG*Ndesign*Grad 1 0.574 4.650 0.034 YESPG*NMAS*Grad 1 0.064 0.520 0.474 NONdesign*NMAS*Grad 1 0.592 4.800 0.031 YESAgg*PG*Ndesign*NMAS 2 0.267 2.160 0.120 NOAgg*PG*Ndesign*Grad 2 0.046 0.370 0.690 NOAgg*Ndesign*NMAS*Grad 2 0.228 1.850 0.163 NOAgg*PG*NMAS*Grad 2 0.335 2.710 0.071 NOPG*Ndesign*NMAS*Grad 1 0.204 1.650 0.197 NOAgg*PG*Ndesign*NMAS*Grad 2 0.014 0.110 0.739 NOModel 47 0.336 2.720 <0.0001 YESError 96 0.123Note: 1) Conducted at a level of significance of 5 percent.
44
4.3.3 Ninitial Density
The only valid method of determining density at Ninitial is to terminate compaction
at Ninitial and determine the bulk specific gravity. However, this is not practical due to
time and problems with the low mix stability at that low of a compaction level.
Current protocols involve back calculation Ninitial density from Nmaximum. Back
calculation would be required even if Ndesign is the terminal compaction effort. It is
important to understand the magnitude of differences in Ninitial density as a result of back
calculation from Ndesign relative to Nmaximum because specifications currently in place limit
the amount of specimen densification which can occur at the Ninitial gyration level.
The Ndesign density of specimens compacted to Ndesign and those back calculated
from Nmaximum are presented in Tables 4.2, 4.3, and 4.4. The average change in density
for each of the mixes is also provided Figures in 4.10, 4.11, and 4.12 for the gravel,
sandstone, and the limestone/gravel mixes, respectively.
Trends for each of the aggregates are generally similar to those for the Ndesign
densities. For the gravel, sandstone, and limestone/gravel aggregate mixes approximately
88 percent, 82 percent, and 56 percent of the mixes had a density at Ninitial when back
calculated from Ndesign that was higher than that back calculated from Nmaximum. The
reason for this once again involves the change in sample surface texture during
compaction.
From Figure 4.10, almost all mixes show a positive density difference (i.e., Ninitial
density from Ndesign direct greater than the Ninitia l density back calculated from Nmaximum).
Any differences between fine and coarse-graded mixes are not clearly evident. As with
the Ndesign density, there was little observed difference between 12.5 and 19.0 mm NMAS
mixes, and a slightly lower difference for mixes compacted to the Ndesign of 119 relative
to 96. The two mixes having a small positive density difference (average of 0.08 percent
density) were PG 76 mixes.
The sandstone aggregate results, shown in Figure 4.11, are very similar to the
gravel results in that almost all of the mixes show a positive density difference. There
does not seem to be a distinguishable trend between any of the study factors. The
45
average of the three mixes which had negative density differences was again very low
(average of 0.32 percent).
Limestone/gravel results are shown in Figure 4.12 and agree with the results from
the previous two aggregate types. As with the Ndesign density results, the magnitude of the
density differences is generally less with the limestone/gravel aggregate. The mixes with
negative density differences are once again very small in magnitude (average of 0.12
percent density) when compared to the positive difference mixes.
Figure 4.13 shows the relationship between the density at Ninitial back calculated
from Nmaximum versus that back calculated from Ndesign. The regression line is parallel
(slope = 1.011) and slightly offset to the line of equality. The results indicate that the
Ninitial density back calculated from Nmaximum is slightly less than the Ninitial density back
calculated from Ndesign.
4.3.3.1 Ninitial Density Statistical Analysis
The ANOVA results for Ninitial density differences are provided in Table 4.8.
From Table 4.8, it appears that none of the study factors are statistically significant.
However, the two-way interactions of PG*Ndesign and PG*NMAS and the three-way
interactions of PG*Ndesign*Grad and Ndesign*NMAS*Grad are significant.
Tukey’s multiple comparison test results for the Ninitial density difference are
provided in Table 4.6. While the ANOVA results showed there to be a slight significant
difference in the project data (P-value of 0.0495 at a level of significance of 0.05), the
results of the Tukey’s analysis do not indicate any significant difference between the
overall study factors of aggregate, PG, Ndesign, NMAS, and gradation.
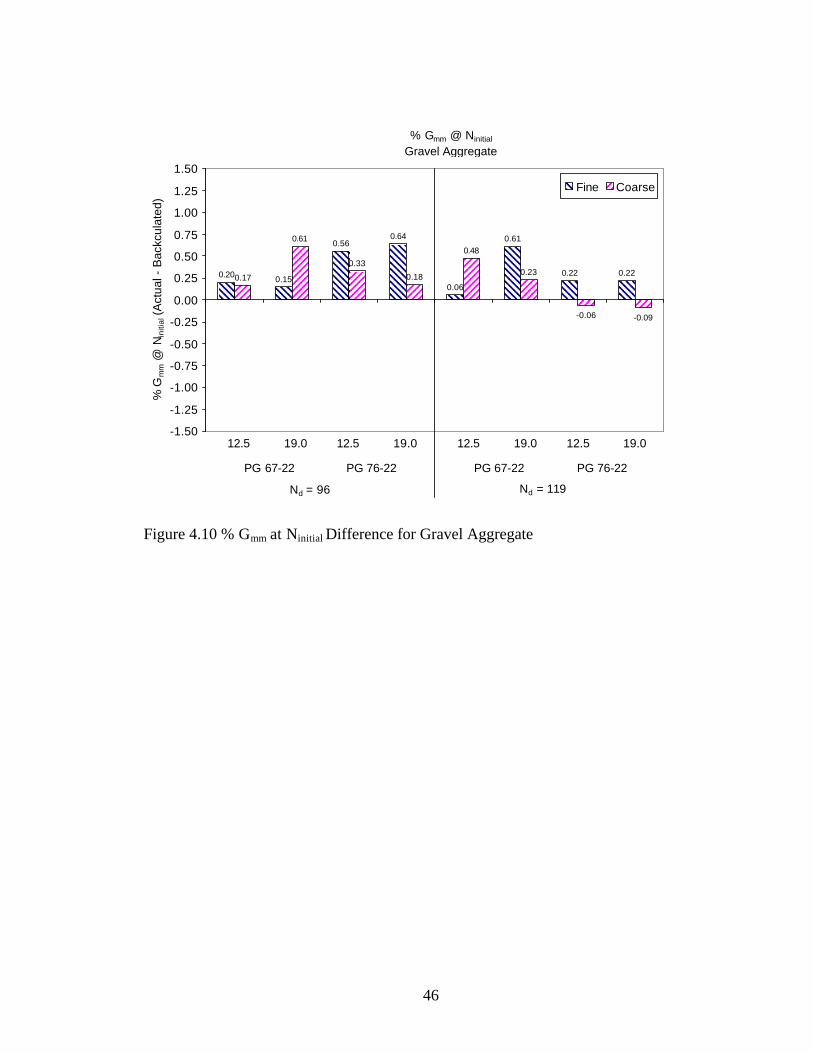
46
% Gmm @ Ninitial
Gravel Aggregate
0.20 0.15
0.560.64
0.06
0.61
0.22 0.220.17
0.61
0.33
0.18
0.48
0.23
-0.06 -0.09
-1.50
-1.25
-1.00
-0.75
-0.50
-0.25
0.00
0.25
0.50
0.75
1.00
1.25
1.50%
Gm
m @
Nin
itial (
Act
ual -
Bac
kcul
ated
)
Fine Coarse
PG 67-22 PG 76-22
Nd = 96
12.5 19.0 12.5 19.0
PG 67-22 PG 76-22
Nd = 119
12.5 19.0 12.5 19.0
Figure 4.10 % Gmm at Ninitial Difference for Gravel Aggregate
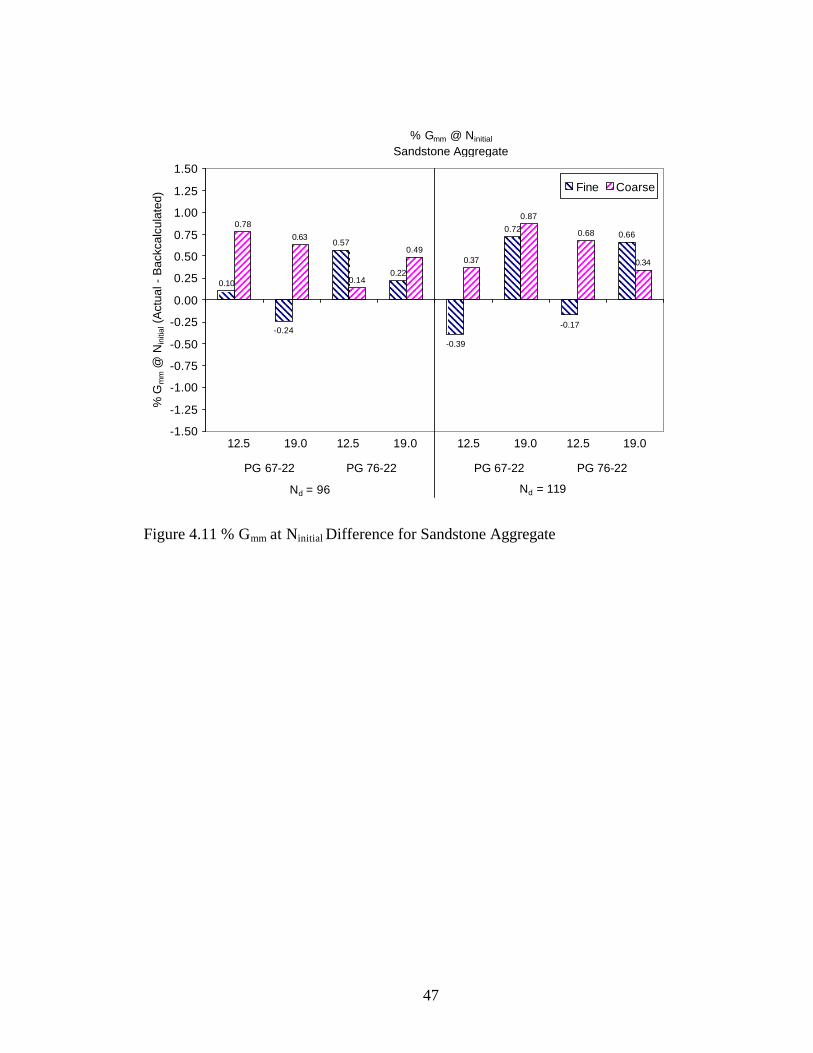
47
% Gmm @ Ninitial
Sandstone Aggregate
0.10
-0.24
0.57
0.22
-0.39
0.72
-0.17
0.660.78
0.63
0.14
0.490.37
0.87
0.68
0.34
-1.50
-1.25
-1.00
-0.75
-0.50
-0.25
0.00
0.25
0.50
0.75
1.00
1.25
1.50%
Gm
m @
Nin
itial (
Act
ual -
Bac
kcal
cula
ted)
Fine Coarse
PG 67-22 PG 76-22
Nd = 96
12.5 19.0 12.5 19.0
PG 67-22 PG 76-22
Nd = 119
12.5 19.0 12.5 19.0
Figure 4.11 % Gmm at Ninitial Difference for Sandstone Aggregate

48
% Gmm @ Ninitial
Limestone / Gravel Aggregate
-0.06 -0.08
0.50
0.31
0.14
0.66
-0.22-0.14
0.15
0.42
0.26
-0.19-0.05
0.40
1.12
-0.10
-1.50
-1.25
-1.00
-0.75
-0.50
-0.25
0.00
0.25
0.50
0.75
1.00
1.25
1.50%
Gm
m @
Nin
itial (
Act
ual -
Bac
kcul
ated
)
Fine Coarse
PG 67-22 PG 76-22
Nd = 96
12.5 19.0 12.5 19.0
PG 67-22 PG 76-22
Nd = 119
12.5 19.0 12.5 19.0
Figure 4.12 % Gmm at Ninitial Difference for Limestone/Gravel Aggregate

49
% Gmm @ Ninitial
y = 1.0107x - 1.1965R
2 = 0.9079
83.50
84.50
85.50
86.50
87.50
88.50
89.50
90.50
83.50 84.50 85.50 86.50 87.50 88.50 89.50 90.50
% Gmm @ Ninitial (Direct)
% G
mm @
Nin
itial (
Bac
kcal
cula
ted)
Line of Equality
Figure 4.13 % Gmm at Ninitial (Back calculated versus Direct)
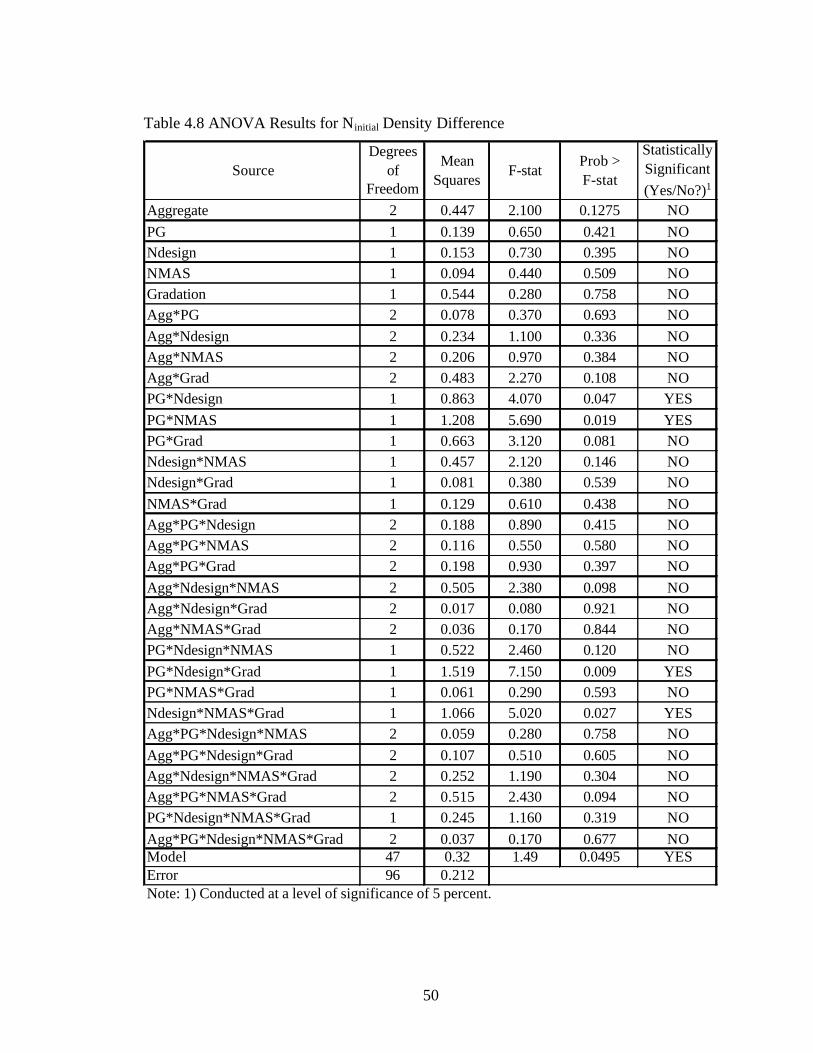
50
Table 4.8 ANOVA Results for Ninitial Density Difference
SourceDegrees
of Freedom
Mean Squares
F-statProb > F-stat
Statistically Significant (Yes/No?)1
Aggregate 2 0.447 2.100 0.1275 NOPG 1 0.139 0.650 0.421 NONdesign 1 0.153 0.730 0.395 NONMAS 1 0.094 0.440 0.509 NOGradation 1 0.544 0.280 0.758 NOAgg*PG 2 0.078 0.370 0.693 NOAgg*Ndesign 2 0.234 1.100 0.336 NOAgg*NMAS 2 0.206 0.970 0.384 NOAgg*Grad 2 0.483 2.270 0.108 NOPG*Ndesign 1 0.863 4.070 0.047 YESPG*NMAS 1 1.208 5.690 0.019 YESPG*Grad 1 0.663 3.120 0.081 NONdesign*NMAS 1 0.457 2.120 0.146 NONdesign*Grad 1 0.081 0.380 0.539 NONMAS*Grad 1 0.129 0.610 0.438 NOAgg*PG*Ndesign 2 0.188 0.890 0.415 NOAgg*PG*NMAS 2 0.116 0.550 0.580 NOAgg*PG*Grad 2 0.198 0.930 0.397 NOAgg*Ndesign*NMAS 2 0.505 2.380 0.098 NOAgg*Ndesign*Grad 2 0.017 0.080 0.921 NOAgg*NMAS*Grad 2 0.036 0.170 0.844 NOPG*Ndesign*NMAS 1 0.522 2.460 0.120 NOPG*Ndesign*Grad 1 1.519 7.150 0.009 YESPG*NMAS*Grad 1 0.061 0.290 0.593 NONdesign*NMAS*Grad 1 1.066 5.020 0.027 YESAgg*PG*Ndesign*NMAS 2 0.059 0.280 0.758 NOAgg*PG*Ndesign*Grad 2 0.107 0.510 0.605 NOAgg*Ndesign*NMAS*Grad 2 0.252 1.190 0.304 NOAgg*PG*NMAS*Grad 2 0.515 2.430 0.094 NOPG*Ndesign*NMAS*Grad 1 0.245 1.160 0.319 NOAgg*PG*Ndesign*NMAS*Grad 2 0.037 0.170 0.677 NOModel 47 0.32 1.49 0.0495 YESError 96 0.212Note: 1) Conducted at a level of significance of 5 percent.
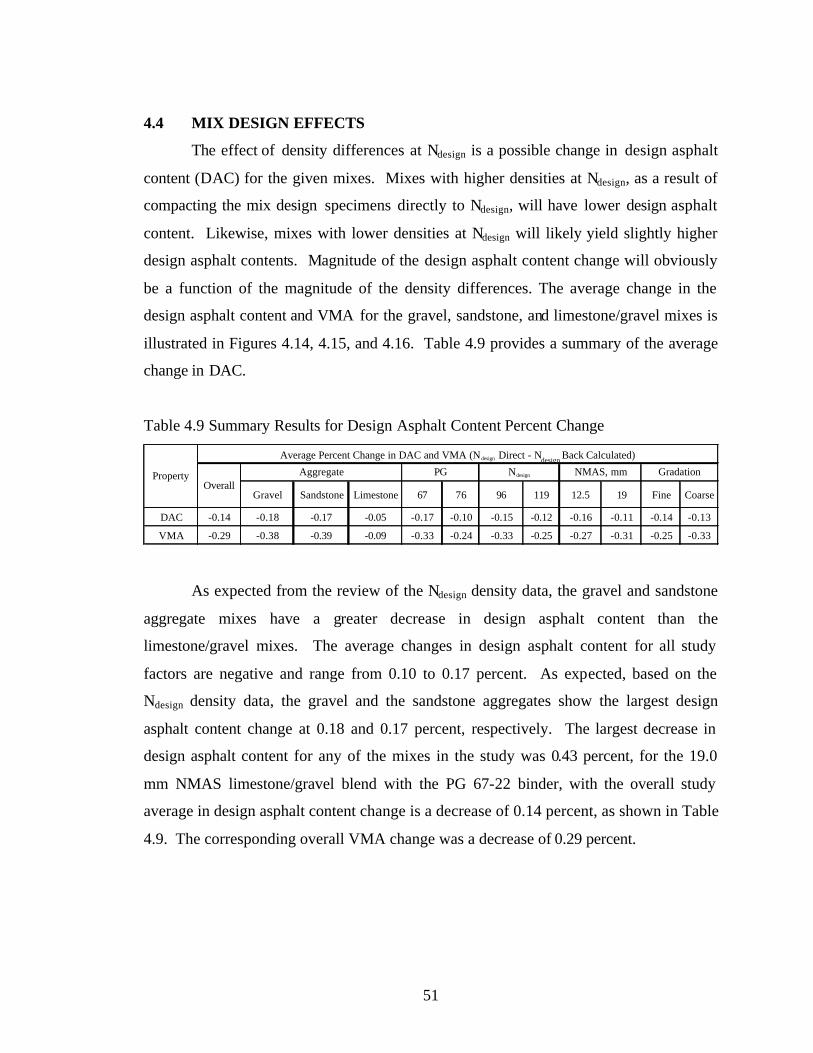
51
4.4 MIX DESIGN EFFECTS
The effect of density differences at Ndesign is a possible change in design asphalt
content (DAC) for the given mixes. Mixes with higher densities at Ndesign, as a result of
compacting the mix design specimens directly to Ndesign, will have lower design asphalt
content. Likewise, mixes with lower densities at Ndesign will likely yield slightly higher
design asphalt contents. Magnitude of the design asphalt content change will obviously
be a function of the magnitude of the density differences. The average change in the
design asphalt content and VMA for the gravel, sandstone, and limestone/gravel mixes is
illustrated in Figures 4.14, 4.15, and 4.16. Table 4.9 provides a summary of the average
change in DAC.
Table 4.9 Summary Results for Design Asphalt Content Percent Change
Gravel Sandstone Limestone 67 76 96 119 12.5 19 Fine Coarse
DAC -0.14 -0.18 -0.17 -0.05 -0.17 -0.10 -0.15 -0.12 -0.16 -0.11 -0.14 -0.13
VMA -0.29 -0.38 -0.39 -0.09 -0.33 -0.24 -0.33 -0.25 -0.27 -0.31 -0.25 -0.33
Ndesign NMAS, mm Gradation
Average Percent Change in DAC and VMA (Ndesign Direct - Ndesign Back Calculated)
Aggregate PGPropertyOverall
As expected from the review of the Ndesign density data, the gravel and sandstone
aggregate mixes have a greater decrease in design asphalt content than the
limestone/gravel mixes. The average changes in design asphalt content for all study
factors are negative and range from 0.10 to 0.17 percent. As expected, based on the
Ndesign density data, the gravel and the sandstone aggregates show the largest design
asphalt content change at 0.18 and 0.17 percent, respectively. The largest decrease in
design asphalt content for any of the mixes in the study was 0.43 percent, for the 19.0
mm NMAS limestone/gravel blend with the PG 67-22 binder, with the overall study
average in design asphalt content change is a decrease of 0.14 percent, as shown in Table
4.9. The corresponding overall VMA change was a decrease of 0.29 percent.
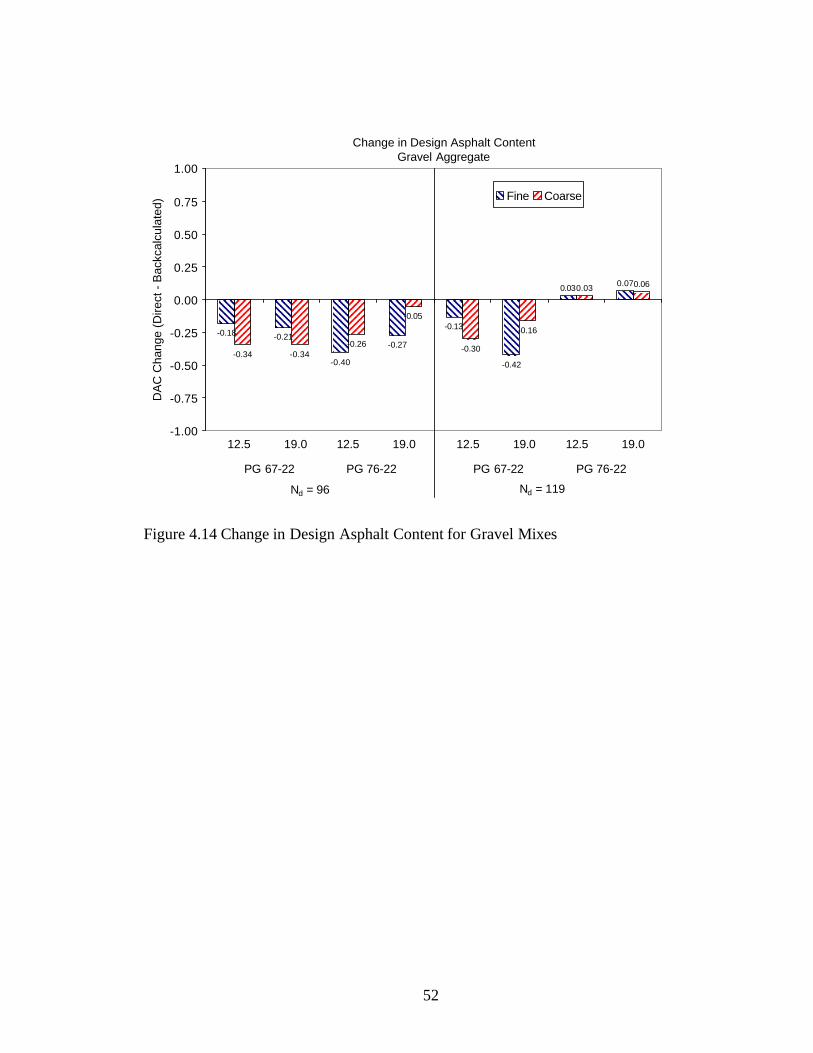
52
Change in Design Asphalt ContentGravel Aggregate
-0.18 -0.21
-0.40
-0.27
-0.13
-0.42
0.03 0.07
-0.34 -0.34-0.26
-0.05
-0.30
-0.16
0.03 0.06
-1.00
-0.75
-0.50
-0.25
0.00
0.25
0.50
0.75
1.00D
AC
Cha
nge
(Dire
ct -
Bac
kcal
cula
ted)
Fine Coarse
PG 67-22 PG 76-22
Nd = 96
12.5 19.0 12.5 19.0
PG 67-22 PG 76-22
Nd = 119
12.5 19.0 12.5 19.0
Figure 4.14 Change in Design Asphalt Content for Gravel Mixes
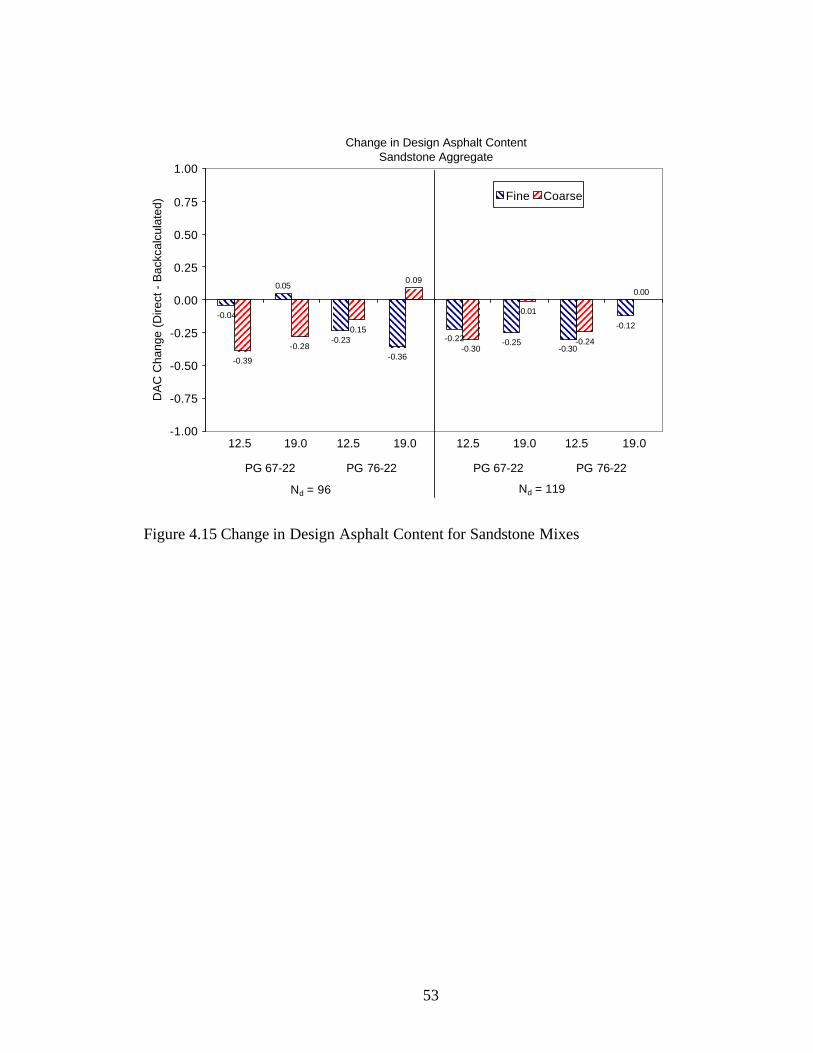
53
Change in Design Asphalt ContentSandstone Aggregate
-0.04
0.05
-0.23
-0.36
-0.22 -0.25-0.30
-0.12
-0.39
-0.28
-0.15
0.09
-0.30
-0.01
-0.24
0.00
-1.00
-0.75
-0.50
-0.25
0.00
0.25
0.50
0.75
1.00D
AC
Cha
nge
(Dire
ct -
Bac
kcal
cula
ted)
Fine Coarse
PG 67-22 PG 76-22
Nd = 96
12.5 19.0 12.5 19.0
PG 67-22 PG 76-22
Nd = 119
12.5 19.0 12.5 19.0
Figure 4.15 Change in Design Asphalt Content for Sandstone Mixes
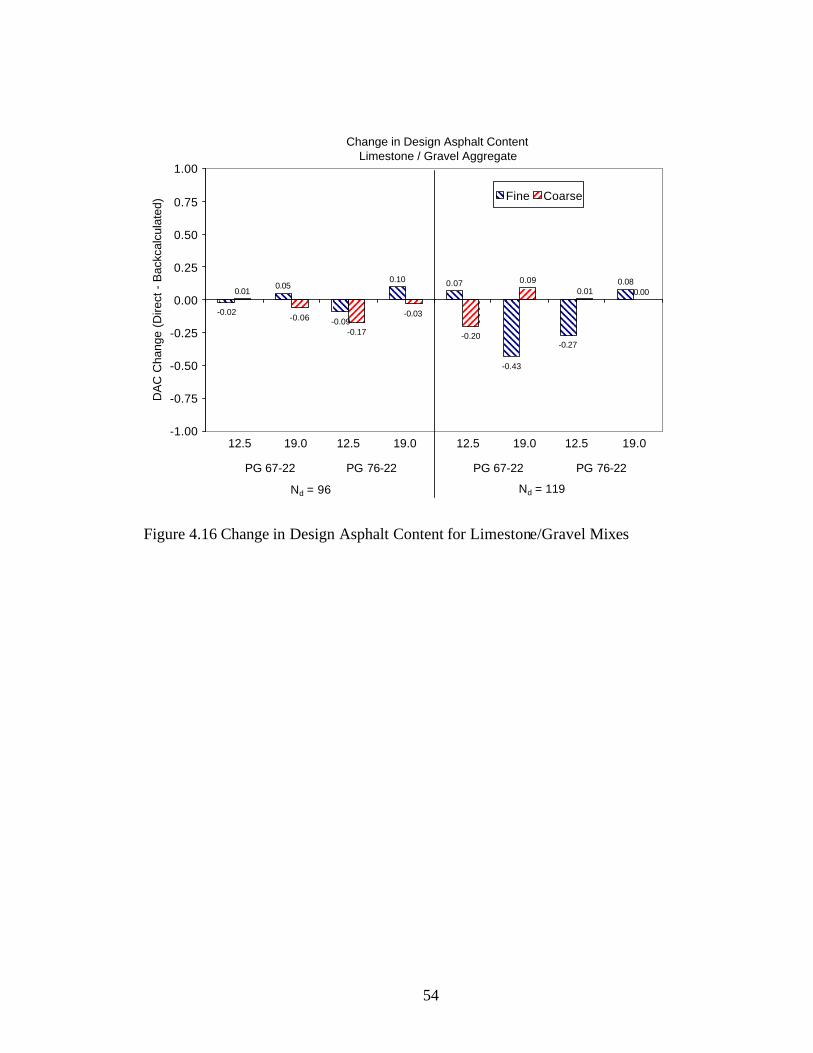
54
Change in Design Asphalt ContentLimestone / Gravel Aggregate
-0.02
0.05
-0.09
0.10 0.07
-0.43
-0.27
0.080.01
-0.06
-0.17
-0.03
-0.20
0.090.01 0.00
-1.00
-0.75
-0.50
-0.25
0.00
0.25
0.50
0.75
1.00D
AC
Cha
nge
(Dire
ct -
Bac
kcal
cula
ted)
Fine Coarse
PG 67-22 PG 76-22
Nd = 96
12.5 19.0 12.5 19.0
PG 67-22 PG 76-22
Nd = 119
12.5 19.0 12.5 19.0
Figure 4.16 Change in Design Asphalt Content for Limestone/Gravel Mixes
55
4.5 COMPARISON OF WATER DISPLACEMENT AND CORELOK GMB
PROCEDURES
The Corelok vacuum sealing device was used to determine the Gmb of all
compacted specimens (mix design and design asphalt content specimens). Corelok
testing was conducted in response to observed variability in mix design results, especially
for coarse-graded mixes. In the following sections of the report, background information
on the Corelok procedure and discussions of Gmb differences between water displacement
and Corelok vacuum sealing procedures and resulting changes in volumetric properties
and optimum asphalt contents for the study mix designs will be presented.
4.5.1 Corelok Background
For many years, Gmb measurement has been accomplished by weighing
compacted specimens in air and water, commonly referred to as water displacement. The
test procedures for water displacement are provided in AASHTO T-166 (10) or ASTM
D2726 (11). Both procedures consist of first weighing dry compacted specimens in air,
then obtaining a submerged mass after the specimen has been placed in a water bath for 3
to 5 minutes, and finally weighing the specimen in a saturated surface-dry (SSD)
condition. In these procedures, specimen volume is determined, through Archimedes
principle, as the difference between SSD and submerged masses. The Gmb is obtained by
dividing the specimen dry mass by the determined volume, multiplied by the density of
water.
In water displacement test procedures, water absorption during testing is
calculated and must be less than 2.0 percent. Water absorption is calculated by dividing
the difference between SSD and dry specimen masses by the difference between SSD and
submerged specimen masses. If water absorption exceeds 2.0 percent, an alternate
method of Gmb evaluation (i.e., parafilm coated specimens) must be utilized. Water
displacement procedures yield accurate Gmb for most conventional dense-graded mixes.
However, with the advent of coarser, open-graded gradations, such as open-graded
friction courses (OGFC), stone matrix asphalt (SMA), and coarse-graded Superpave
mixes; research (8, 12) has shown errors in Gmb measurement using water displacement
methods, even when water absorption levels are less than 2.0 percent.
56
With compacted HMA mixes, the internal air voids occur between coated
aggregate particles. However, with coarser, more open-graded mixes, these voids are
larger and tend to be interconnected, leading to errors when using the water displacement
method. Water readily permeates these interconnected larger voids during testing.
Penetrating water reduces the calculated sample void volume, leading to a Gmb value that
is too high, and therefore, calculated air voids that are too low.
In the past several years, vacuum sealing technology, using the Corelok device, as
shown in Figure 4.17, has been used by a number of researchers and transportation
agencies to determine HMA Gmb. ASTM D6752 “Standard Test Method for Bulk
Specific Gravity and Density of Compacted Bituminous Mixtures Using Automatic
Vacuum Sealing Method” (13) has recently been approved outlining the Gmb
determination procedure with the Corelok device.
Buchanan (12) concluded the Corelok procedure can determine Gmb more
accurately than conventional methods such as water displacement, parafilm, and
dimensional analysis (i.e., mass / volume). There should be no instance where a Corelok
Gmb is greater than a water displacement Gmb. As the specimen’s air voids and surface
texture decreases, results of Corelok and water displacement procedures should approach
the same value.
Crouch et al (14) reported the Corelok procedure to be a widely applicable
method of Gmb determination. Results from a recent round robin study (8) conducted by
the National Center for Asphalt Technology (NCAT) showed the Corelok procedure to be
a viable method for determining the Gmb of HMA mixes. It was further stated that the
Corelok procedure provided a more accurate measure of Gmb, especially for mixes with
high water absorption levels during water displacement procedures. The study (8)
recommended determining Gmb with the Corelok procedure for coarse-graded mixes
when water absorption levels exceed 0.4 percent. It was recommended that water
displacement be used for fine graded specimens with water absorptions less than 2.0
percent, which is how current specifications (T166 and D2726) are written. The report
goes on to recommend that since a significant portion of the coarse-graded mix design
specimens will likely exceed the 0.4 percent water absorption level, the Corelok method

57
Figure 4.17 Corelok Vacuum Sealing Device

58
should be used for design and quality control testing of coarse-graded mixes. This
recommendation was based on approximately 41 percent of coarse-graded mixes having
water absorption levels exceeding 2 percent when evaluated at an Ndesign of 100 gyrations.
4.5.2 Corelok Operation
Determining Gmb using the Corelok procedure is described in the following steps
(15).
1. Use the plastic specimen bag predetermined nominal density or determine the
density using a standard aluminum reference cylinder provided.
2. Place the compacted HMA specimen (either core or laboratory compacted
specimen) into the bag.
3. Place the bag and specimen inside the Corelok vacuum chamber.
4. Close the vacuum chamber door at which time the vacuum pump will start and
evacuate the chamber to 760 mm (30 in) Hg.
5. In approximately two minutes, the chamber door will automatically open with the
specimen completely sealed within the bag and ready for water displacement
testing. User should insure that the bag seal is secure prior to going to step 6.
6. Perform water displacement method testing of the sealed specimen according to
either AASHTO or ASTM standards. Correct the results for the bag density and
the displaced bag volume as suggested by ASTM D1188 (16).
4.5.3 Comparison of Water Displacement and Corelok Gmb for Mix Design
Specimens
Relationships between water displacement and Corelok determined Gmb values for
fine and coarse-graded mix design specimens are illustrated in Figure 4.18. Both fine and
coarse-graded specimens have excellent relationships between Corelok and water
displacement Gmb (R2 = 0.97 and 0.98, respectively). The Corelok procedure yields
consistently lower Gmb values (higher air voids). Figure 4.18 shows coarse-graded mixes
to have a slightly larger difference than fine-graded mixes. This agrees with

59
Coarsey = 0.9854x + 0.0534
R2 = 0.9762
Finey = 1.001x + 0.0114
R2 = 0.9697
2.050
2.100
2.150
2.200
2.250
2.300
2.350
2.400
2.450
2.050 2.100 2.150 2.200 2.250 2.300 2.350 2.400 2.450
Corelok Gmb
Wat
er D
ispl
acem
ent G
mb
Fine Coarse
Line of Equality
Figure 4.18 Water Displacement vs Corelok Gmb
60
past research (8,12) that showed coarse-graded mixes have larger differences than fine-
graded mixes.
Only 6 of the 534 (1.1 percent) mi x design specimens had a Corelok Gmb greater
than the water displacement Gmb, with the differences, in each case, being very small and
likely due to testing variability. The average Gmb difference for fine and coarse-graded
mixes were 0.0133 and 0.0197, respectively. This corresponds to air void changes of
0.53 and 0.80 percent.
The relationship between water absorption and Gmb values for the two procedures
is shown in Figure 4.19. Both relationships are marginal (R2 = 0.39 for water
displacement and R2 = 0.43 for Corelok), but the difference between the two methods
decreases slightly as Gmb increases and water absorption decreases. This is expected
since water absorption is related to the specimen’s internal air void structure. Higher
water absorptions result in more water entering the specimen’s during water displacement
testing which reduces the specimen volume and yields a Gmb value that is too high.
These results also agree closely with results from NCAT’s study (8).
To evaluate NCAT’s recommendation (8) on mix design (fine and coarse)
specimens, relationships between air voids, as determined with the Corelok and water
displacement procedures, and water absorption were developed and are provided in
Figure 4.20. Separate relationships were established for fine and coarse-graded mixes.
Results indicate fair correlation (R2 from 0.64 to 0.71) between air voids and water
absorption for each data set. The data also shows the expected larger air void difference
between Corelok and water displacement procedures for coarse-graded mixes, relative to
fine-graded mixes. The NCAT recommended using the Corelok procedure for coarse-
graded mixes with water absorption levels greater than 0.4 percent. From Figure 4.20, it
appears that the 0.4 percent absorption level is near where the air void differences
increase. Using the recommended 0.4 percent water absorption criteria for coarse-graded
mixes, approximately 48.5 percent of coarse-graded specimens had water absorption
levels greater than 0.4 percent. This is in good agreement with the 41 percent value
reported by the NCAT study (8). This emphasizes the need
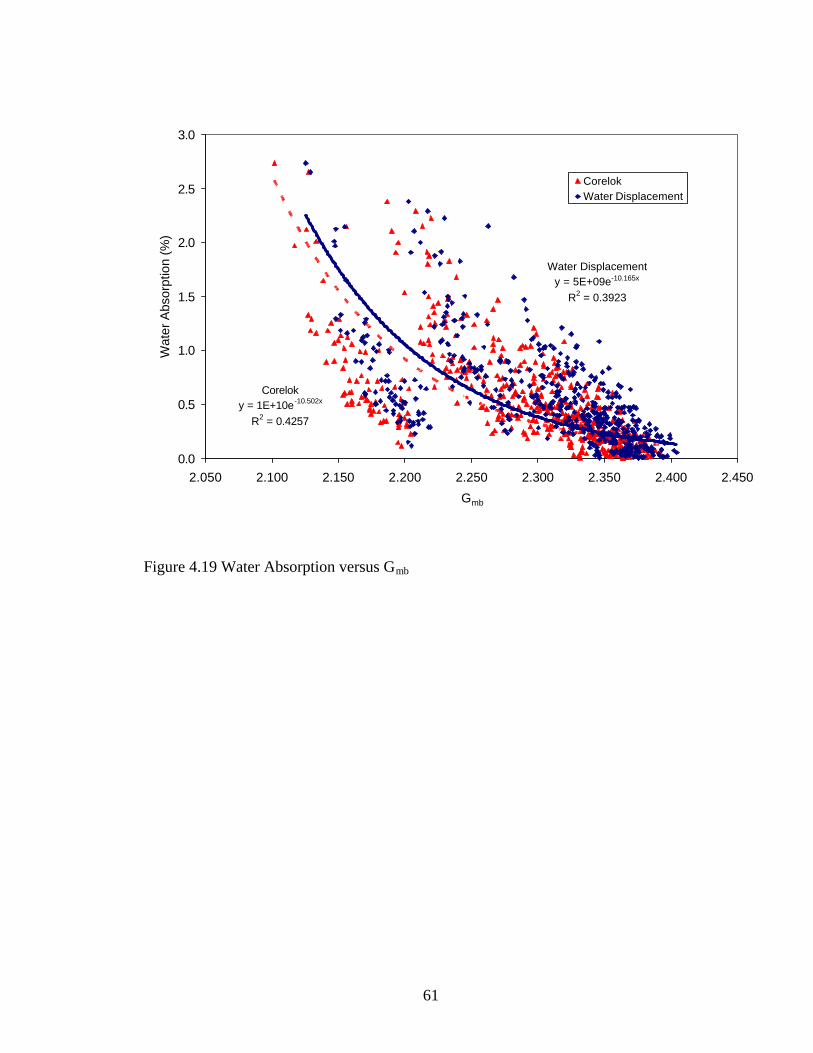
61
Coreloky = 1E+10e-10.502x
R2 = 0.4257
Water Displacementy = 5E+09e-10.165x
R2 = 0.3923
0.0
0.5
1.0
1.5
2.0
2.5
3.0
2.050 2.100 2.150 2.200 2.250 2.300 2.350 2.400 2.450
Gmb
Wat
er A
bsor
ptio
n (%
) CorelokWater Displacement
Figure 4.19 Water Absorption versus Gmb
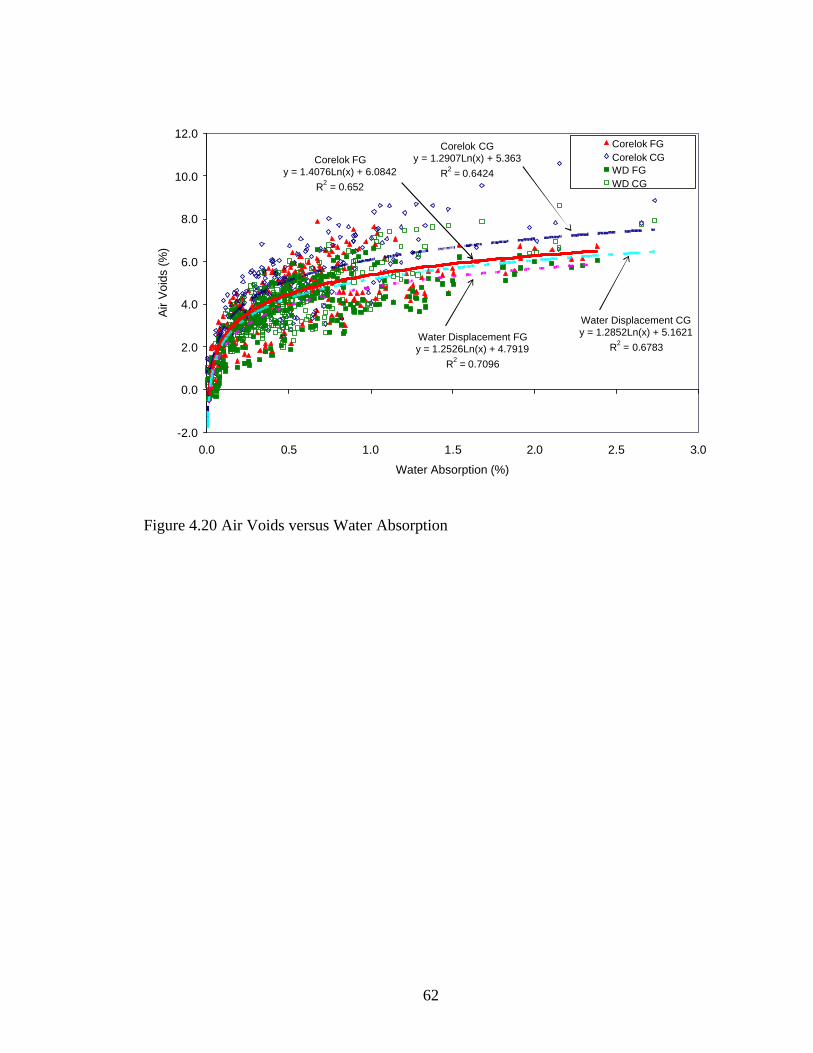
62
Corelok FGy = 1.4076Ln(x) + 6.0842
R2 = 0.652
Corelok CGy = 1.2907Ln(x) + 5.363
R2 = 0.6424
Water Displacement FGy = 1.2526Ln(x) + 4.7919
R2 = 0.7096
Water Displacement CGy = 1.2852Ln(x) + 5.1621
R2 = 0.6783
-2.0
0.0
2.0
4.0
6.0
8.0
10.0
12.0
0.0 0.5 1.0 1.5 2.0 2.5 3.0
Water Absorption (%)
Air
Voi
ds (
%)
Corelok FGCorelok CGWD FGWD CG
Figure 4.20 Air Voids versus Water Absorption
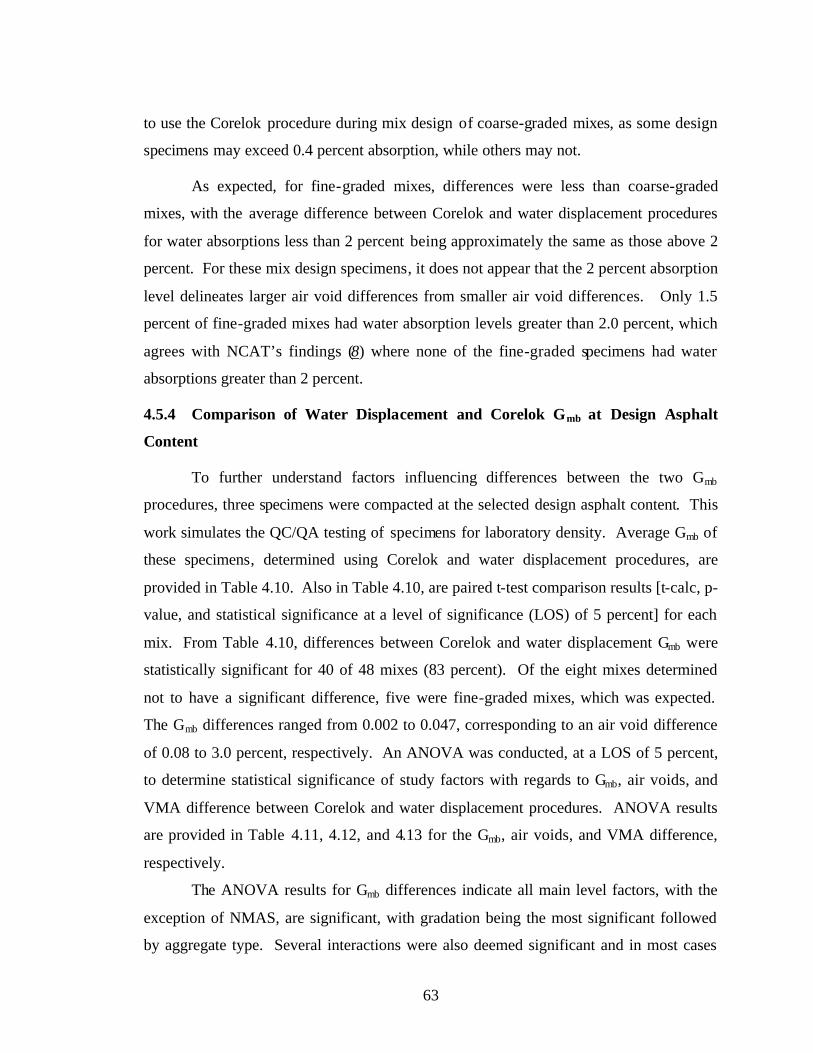
63
to use the Corelok procedure during mix design of coarse-graded mixes, as some design
specimens may exceed 0.4 percent absorption, while others may not.
As expected, for fine-graded mixes, differences were less than coarse-graded
mixes, with the average difference between Corelok and water displacement procedures
for water absorptions less than 2 percent being approximately the same as those above 2
percent. For these mix design specimens, it does not appear that the 2 percent absorption
level delineates larger air void differences from smaller air void differences. Only 1.5
percent of fine-graded mixes had water absorption levels greater than 2.0 percent, which
agrees with NCAT’s findings (8) where none of the fine-graded specimens had water
absorptions greater than 2 percent.
4.5.4 Comparison of Water Displacement and Corelok Gmb at Design Asphalt
Content
To further understand factors influencing differences between the two Gmb
procedures, three specimens were compacted at the selected design asphalt content. This
work simulates the QC/QA testing of specimens for laboratory density. Average Gmb of
these specimens, determined using Corelok and water displacement procedures, are
provided in Table 4.10. Also in Table 4.10, are paired t-test comparison results [t-calc, p-
value, and statistical significance at a level of significance (LOS) of 5 percent] for each
mix. From Table 4.10, differences between Corelok and water displacement Gmb were
statistically significant for 40 of 48 mixes (83 percent). Of the eight mixes determined
not to have a significant difference, five were fine-graded mixes, which was expected.
The Gmb differences ranged from 0.002 to 0.047, corresponding to an air void difference
of 0.08 to 3.0 percent, respectively. An ANOVA was conducted, at a LOS of 5 percent,
to determine statistical significance of study factors with regards to Gmb, air voids, and
VMA difference between Corelok and water displacement procedures. ANOVA results
are provided in Table 4.11, 4.12, and 4.13 for the Gmb, air voids, and VMA difference,
respectively.
The ANOVA results for Gmb differences indicate all main level factors, with the
exception of NMAS, are significant, with gradation being the most significant followed
by aggregate type. Several interactions were also deemed significant and in most cases

64
Table 4.10 Paired t-Tests Results for Corelok and Water Displacement Gmb
Corelok Water Displacement Difference1
Gravel 96 67 12.5 Fine 2.247 2.256 -0.009 22.72 0.00190 YESGravel 96 67 12.5 Coarse 2.183 2.194 -0.011 8.76 0.01270 NOGravel 96 67 19.0 Fine 2.232 2.244 -0.012 19.54 0.00260 YESGravel 96 67 19.0 Coarse 2.169 2.189 -0.020 71.06 0.00002 YESGravel 96 76 12.5 Fine 2.235 2.242 -0.007 2.14 0.16570 NOGravel 96 76 12.5 Coarse 2.154 2.170 -0.016 33.43 0.00089 YESGravel 96 76 19.0 Fine 2.215 2.230 -0.015 75.63 0.00017 YESGravel 96 76 19.0 Coarse 2.160 2.177 -0.017 5.91 0.02720 YESGravel 119 67 12.5 Fine 2.249 2.256 -0.007 54.17 0.00034 YESGravel 119 67 12.5 Coarse 2.196 2.207 -0.011 9.19 0.01160 YESGravel 119 67 19.0 Fine 2.235 2.246 -0.011 16.39 0.00369 YESGravel 119 67 19.0 Coarse 2.167 2.187 -0.020 22.49 0.00197 YESGravel 119 76 12.5 Fine 2.239 2.245 -0.006 1.63 0.24400 NOGravel 119 76 12.5 Coarse 2.164 2.182 -0.018 7.57 0.01698 YESGravel 119 76 19.0 Fine 2.221 2.234 -0.013 4.98 0.03800 YESGravel 119 76 19.0 Coarse 2.165 2.184 -0.019 27.36 0.00130 YES
Sandstone 96 67 12.5 Fine 2.314 2.325 -0.011 7.66 0.01670 YESSandstone 96 67 12.5 Coarse 2.336 2.347 -0.011 5.40 0.03250 YESSandstone 96 67 19.0 Fine 2.321 2.334 -0.013 4.58 0.04440 YESSandstone 96 67 19.0 Coarse 2.336 2.351 -0.015 13.34 0.00557 YESSandstone 96 76 12.5 Fine 2.318 2.337 -0.019 4.80 0.04070 YESSandstone 96 76 12.5 Coarse 2.280 2.314 -0.034 12.48 0.00635 YESSandstone 96 76 19.0 Fine 2.356 2.368 -0.012 5.19 0.03520 YESSandstone 96 76 19.0 Coarse 2.340 2.355 -0.015 4.62 0.04380 YESSandstone 119 67 12.5 Fine 2.325 2.334 -0.009 11.04 0.00809 YESSandstone 119 67 12.5 Coarse 2.280 2.314 -0.034 12.48 0.00636 YESSandstone 119 67 19.0 Fine 2.325 2.339 -0.014 5.99 0.02676 YESSandstone 119 67 19.0 Coarse 2.353 2.373 -0.020 2.99 0.09580 YESSandstone 119 76 12.5 Fine 2.327 2.341 -0.014 24.27 0.00169 YESSandstone 119 76 12.5 Coarse 2.342 2.356 -0.014 31.29 0.00100 YESSandstone 119 76 19.0 Fine 2.351 2.379 -0.028 4.92 0.03897 YESSandstone 119 76 19.0 Coarse 2.284 2.312 -0.028 4.68 0.04273 YESLimestone 96 67 12.5 Fine 2.304 2.306 -0.002 1.94 0.19210 NOLimestone 96 67 12.5 Coarse 2.279 2.306 -0.027 7.49 0.01730 YESLimestone 96 67 19.0 Fine 2.342 2.357 -0.015 23.55 0.00179 YESLimestone 96 67 19.0 Coarse 2.288 2.320 -0.032 28.50 0.00122 YESLimestone 96 76 12.5 Fine 2.283 2.298 -0.015 5.53 0.03117 YESLimestone 96 76 12.5 Coarse 2.259 2.288 -0.029 5.00 0.03770 YESLimestone 96 76 19.0 Fine 2.339 2.355 -0.016 8.25 0.01437 YESLimestone 96 76 19.0 Coarse 2.289 2.320 -0.031 28.50 0.00122 YESLimestone 119 67 12.5 Fine 2.307 2.325 -0.018 3.66 0.06720 NOLimestone 119 67 12.5 Coarse 2.273 2.296 -0.023 15.34 0.00422 YESLimestone 119 67 19.0 Fine 2.343 2.360 -0.017 15.51 0.00413 YESLimestone 119 67 19.0 Coarse 2.352 2.373 -0.021 2.99 0.09580 NOLimestone 119 76 12.5 Fine 2.282 2.307 -0.025 3.14 0.08790 NOLimestone 119 76 12.5 Coarse 2.309 2.356 -0.047 4.72 0.04200 YESLimestone 119 76 19.0 Fine 2.343 2.359 -0.016 15.25 0.00427 YESLimestone 119 76 19.0 Coarse 2.303 2.329 -0.026 4.01 0.05680 NO
Gradation
Notes: 1) Corelok - Water Displacement; 2) Level of Significance = 5 percent
Aggregate Ndesign PG NMAS t-calc p-value Significant?2
Gmb
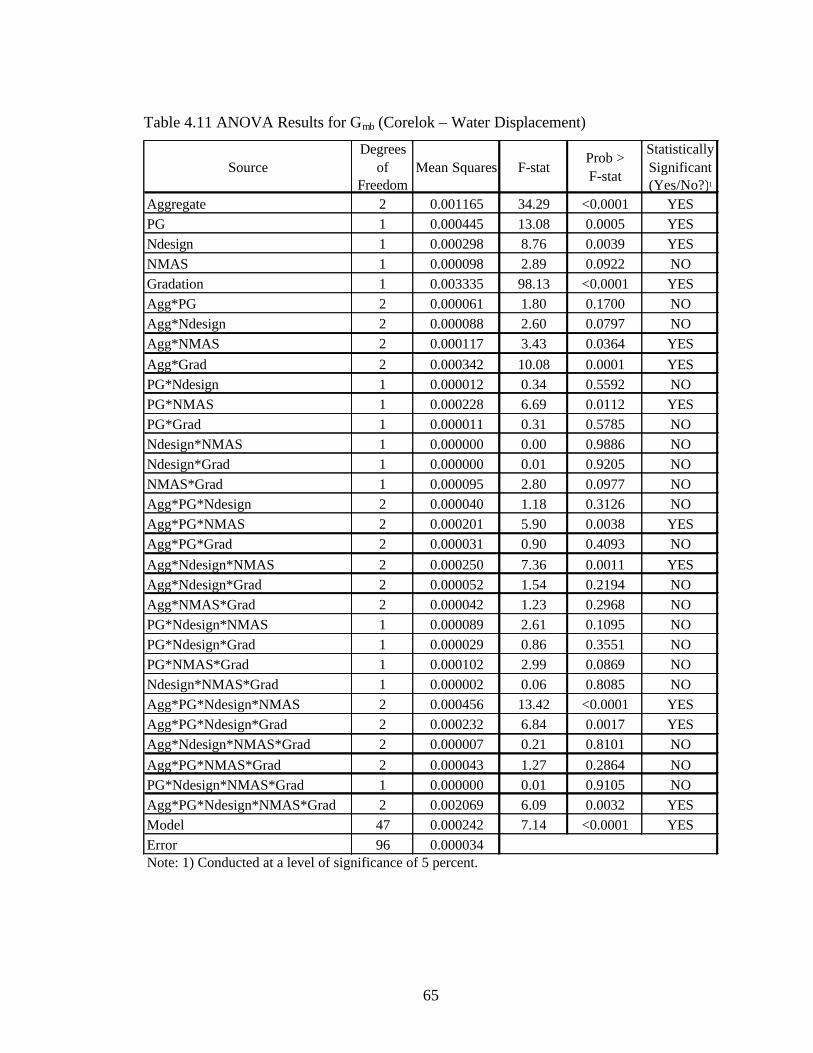
65
Table 4.11 ANOVA Results for Gmb (Corelok – Water Displacement)
SourceDegrees
of Freedom
Mean Squares F-statProb > F-stat
Statistically Significant (Yes/No?)1
Aggregate 2 0.001165 34.29 <0.0001 YESPG 1 0.000445 13.08 0.0005 YESNdesign 1 0.000298 8.76 0.0039 YESNMAS 1 0.000098 2.89 0.0922 NOGradation 1 0.003335 98.13 <0.0001 YESAgg*PG 2 0.000061 1.80 0.1700 NOAgg*Ndesign 2 0.000088 2.60 0.0797 NOAgg*NMAS 2 0.000117 3.43 0.0364 YESAgg*Grad 2 0.000342 10.08 0.0001 YESPG*Ndesign 1 0.000012 0.34 0.5592 NOPG*NMAS 1 0.000228 6.69 0.0112 YESPG*Grad 1 0.000011 0.31 0.5785 NONdesign*NMAS 1 0.000000 0.00 0.9886 NONdesign*Grad 1 0.000000 0.01 0.9205 NONMAS*Grad 1 0.000095 2.80 0.0977 NOAgg*PG*Ndesign 2 0.000040 1.18 0.3126 NOAgg*PG*NMAS 2 0.000201 5.90 0.0038 YESAgg*PG*Grad 2 0.000031 0.90 0.4093 NOAgg*Ndesign*NMAS 2 0.000250 7.36 0.0011 YESAgg*Ndesign*Grad 2 0.000052 1.54 0.2194 NOAgg*NMAS*Grad 2 0.000042 1.23 0.2968 NOPG*Ndesign*NMAS 1 0.000089 2.61 0.1095 NOPG*Ndesign*Grad 1 0.000029 0.86 0.3551 NOPG*NMAS*Grad 1 0.000102 2.99 0.0869 NONdesign*NMAS*Grad 1 0.000002 0.06 0.8085 NOAgg*PG*Ndesign*NMAS 2 0.000456 13.42 <0.0001 YESAgg*PG*Ndesign*Grad 2 0.000232 6.84 0.0017 YESAgg*Ndesign*NMAS*Grad 2 0.000007 0.21 0.8101 NOAgg*PG*NMAS*Grad 2 0.000043 1.27 0.2864 NOPG*Ndesign*NMAS*Grad 1 0.000000 0.01 0.9105 NOAgg*PG*Ndesign*NMAS*Grad 2 0.002069 6.09 0.0032 YESModel 47 0.000242 7.14 <0.0001 YESError 96 0.000034Note: 1) Conducted at a level of significance of 5 percent.

66
Table 4.12 ANOVA Results for Air Voids (Corelok – Water Displacement)
SourceDegrees
of Freedom
Mean Squares F-stat
Prob > F-stat
Statistically Significant (Yes/No?)1
Aggregate 2 1.8850 35.26 <0.0001 YESPG 1 0.7158 13.39 0.0004 YESNdesign 1 0.4851 9.07 0.0033 YESNMAS 1 0.1692 3.16 0.0784 NOGradation 1 5.3400 100.00 <0.0001 YESAgg*PG 2 0.0960 1.80 0.1715 NOAgg*Ndesign 2 0.1420 2.66 0.0753 NOAgg*NMAS 2 0.1894 3.54 0.0328 YESAgg*Grad 2 0.5422 10.14 0.0001 YESPG*Ndesign 1 0.0250 0.47 0.4949 NOPG*NMAS 1 0.3610 6.75 0.0108 NOPG*Grad 1 0.0165 0.31 0.5795 NONdesign*NMAS 1 0.0000 0.00 0.9858 NONdesign*Grad 1 0.0004 0.01 0.9360 NONMAS*Grad 1 0.1490 2.79 0.0983 NOAgg*PG*Ndesign 2 0.0650 1.22 0.2998 NOAgg*PG*NMAS 2 0.3160 5.91 0.0038 YESAgg*PG*Grad 2 0.0465 0.87 0.4223 NOAgg*Ndesign*NMAS 2 0.4230 7.92 0.0007 YESAgg*Ndesign*Grad 2 0.0866 1.62 0.2032 NOAgg*NMAS*Grad 2 0.0695 1.30 0.2773 NOPG*Ndesign*NMAS 1 0.1490 5.91 0.0038 YESPG*Ndesign*Grad 1 0.0480 0.91 0.3438 NOPG*NMAS*Grad 1 0.1467 2.74 0.1009 NONdesign*NMAS*Grad 1 0.0039 0.07 0.7873 NOAgg*PG*Ndesign*NMAS 2 0.7350 13.74 <0.0001 YESAgg*PG*Ndesign*Grad 2 0.3830 7.16 0.0013 YESAgg*Ndesign*NMAS*Grad 2 0.0109 0.20 0.8154 NOAgg*PG*NMAS*Grad 2 0.0714 1.34 0.2679 NOPG*Ndesign*NMAS*Grad 1 0.0004 0.01 0.9340 NOAgg*PG*Ndesign*NMAS*Grad 2 0.3339 6.24 0.0028 YESModel 47 0.3917 7.33 <0.0001 YESError 96 0.0534Note: 1) Conducted at a level of significance of 5 percent.

67
Table 4.13 ANOVA Results for VMA (Corelok – Water Displacement)
SourceDegrees
of Freedom
Mean Squares F-stat
Prob > F-stat
Statistically Significant (Yes/No?)1
Aggregate 2 1.4580 35.26 <0.0001 YESPG 1 0.5539 13.39 0.0004 YESNdesign 1 0.3750 9.07 0.0033 YESNMAS 1 0.1309 3.16 0.0784 NOGradation 1 4.1374 100.00 <0.0001 YESAgg*PG 2 0.0740 1.80 0.1715 NOAgg*Ndesign 2 0.1099 2.66 0.0753 NOAgg*NMAS 2 0.1465 3.54 0.0328 YESAgg*Grad 2 0.4196 10.14 0.0001 YESPG*Ndesign 1 0.0194 0.47 0.4949 NOPG*NMAS 1 0.2794 6.75 0.0108 YESPG*Grad 1 0.0128 0.31 0.5795 NONdesign*NMAS 1 0.0000 0.00 0.9858 NONdesign*Grad 1 0.0003 0.01 0.9360 NONMAS*Grad 1 0.1153 2.79 0.0013 YESAgg*PG*Ndesign 2 0.0505 1.22 0.2998 NOAgg*PG*NMAS 2 0.2443 5.91 0.0038 YESAgg*PG*Grad 2 0.0360 0.87 0.4223 NOAgg*Ndesign*NMAS 2 0.3277 7.92 0.0007 YESAgg*Ndesign*Grad 2 0.0670 1.62 0.2032 NOAgg*NMAS*Grad 2 0.0538 1.30 0.2773 NOPG*Ndesign*NMAS 1 0.1155 2.79 0.0980 NOPG*Ndesign*Grad 1 0.0374 0.91 0.3438 NOPG*NMAS*Grad 1 0.1135 2.74 0.1009 NONdesign*NMAS*Grad 1 0.0030 0.07 0.7873 NOAgg*PG*Ndesign*NMAS 2 0.5686 13.74 <0.0001 YESAgg*PG*Ndesign*Grad 2 0.2964 7.16 0.0013 YESAgg*Ndesign*NMAS*Grad 2 0.0085 0.20 0.8154 NOAgg*PG*NMAS*Grad 2 0.0553 1.34 0.2679 NOPG*Ndesign*NMAS*Grad 1 0.0003 0.01 0.9340 NOAgg*PG*Ndesign*NMAS*Grad 2 0.2580 6.24 0.0028 YESModel 47 0.3030 7.33 <0.0001 YESError 96 0.0414Note: 1) Conducted at a level of significance of 5 percent.
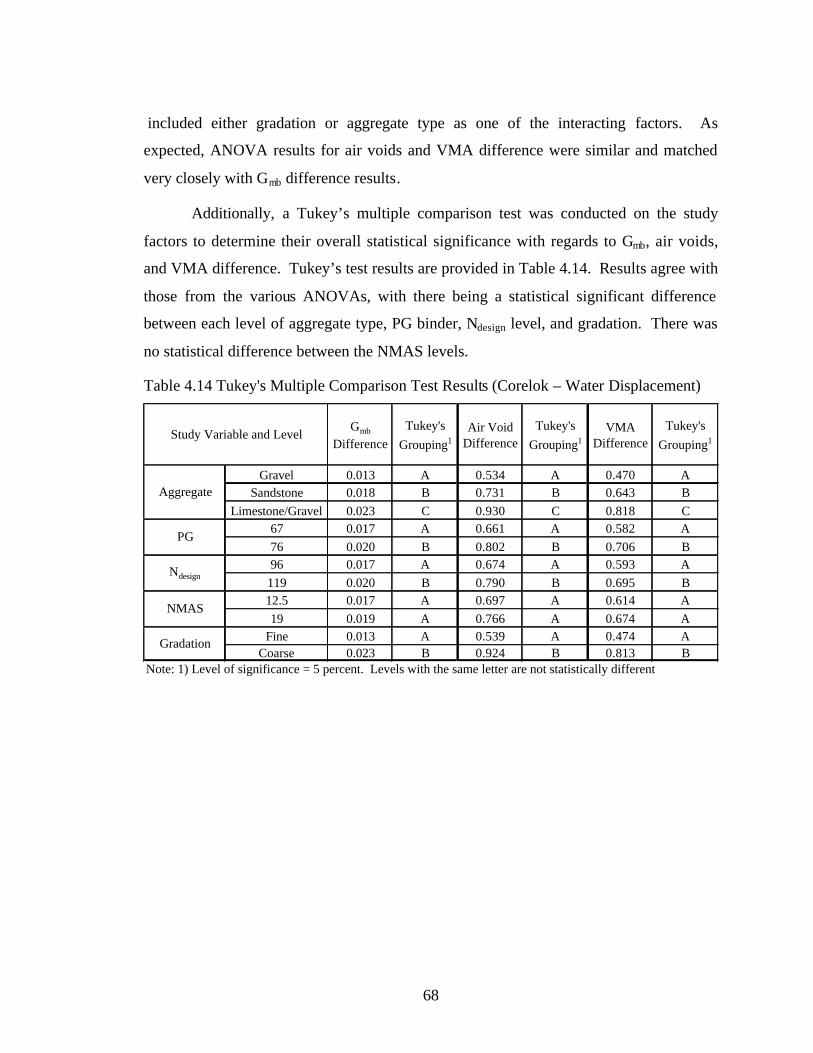
68
included either gradation or aggregate type as one of the interacting factors. As
expected, ANOVA results for air voids and VMA difference were similar and matched
very closely with Gmb difference results.
Additionally, a Tukey’s multiple comparison test was conducted on the study
factors to determine their overall statistical significance with regards to Gmb, air voids,
and VMA difference. Tukey’s test results are provided in Table 4.14. Results agree with
those from the various ANOVAs, with there being a statistical significant difference
between each level of aggregate type, PG binder, Ndesign level, and gradation. There was
no statistical difference between the NMAS levels.
Table 4.14 Tukey's Multiple Comparison Test Results (Corelok – Water Displacement)
Gmb
DifferenceTukey's
Grouping1Air Void
DifferenceTukey's
Grouping1VMA
DifferenceTukey's
Grouping1
Gravel 0.013 A 0.534 A 0.470 ASandstone 0.018 B 0.731 B 0.643 B
Limestone/Gravel 0.023 C 0.930 C 0.818 C67 0.017 A 0.661 A 0.582 A76 0.020 B 0.802 B 0.706 B96 0.017 A 0.674 A 0.593 A119 0.020 B 0.790 B 0.695 B12.5 0.017 A 0.697 A 0.614 A19 0.019 A 0.766 A 0.674 A
Fine 0.013 A 0.539 A 0.474 ACoarse 0.023 B 0.924 B 0.813 B
Aggregate
Study Variable and Level
PG
Gradation
Note: 1) Level of significance = 5 percent. Levels with the same letter are not statistically different
Ndesign
NMAS
69
4.5.5 Effect of Gmb Differences on Design Asphalt Content and VMA
The most important aspect of using the Corelok procedure for Gmb determination
during mix design is a change in design asphalt content. If the Corelok procedure
provides slightly lower Gmb values than water displacement methods, design asphalt
contents should be slightly higher. Design asphalt content changes for gravel, sandstone,
and limestone/gravel mixes are provided in Figures 4.21, 4.22, and 4.23, respectively.
For all mixes, design asphalt contents increased slightly when using the Corelok
procedure, with the increase ranging from 0.01 to 0.51 percent.
A summary of the change in design asphalt contents for each overall study factor
is provided in Table 4.15. Overall, there was a 0.29 percent change in design asphalt
content. As expected from the ANOVA and Tukeys results, the largest differences in
design asphalt content occurred within levels of aggregate type and gradation.
Limestone/gravel and sandstone aggregate mixes had overall DAC differences of
approximately 0.3 percent. Coarse-graded mixes had average DAC changes of 0.35
percent, compared to fine-graded mixes at 0.23 percent DAC change. Average DAC
changes between levels of PG, Ndesign, and NMAS, in all cases, ranged from 0.28 to 0.30
percent. VMA changes are also shown in Table 4.15 and range from 0.47 to 0.82
percent, with an overall average of 0.64 percent.
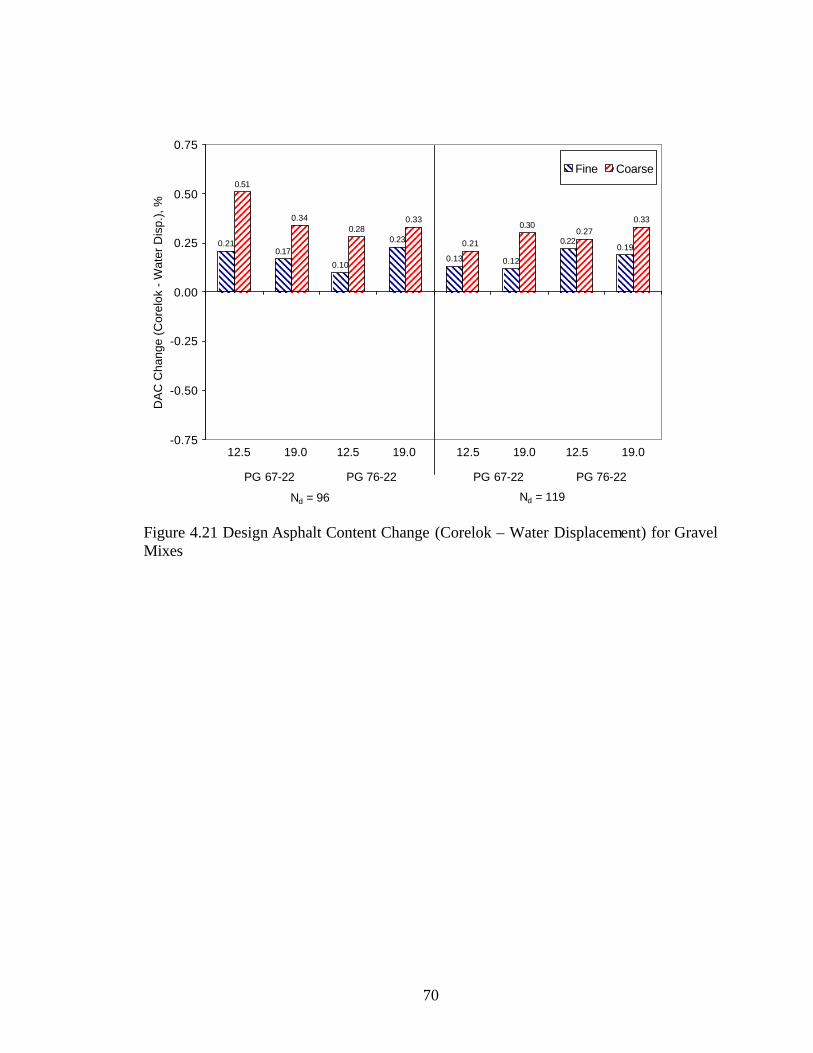
70
0.210.17
0.10
0.23
0.13 0.12
0.220.19
0.51
0.340.28
0.33
0.21
0.300.27
0.33
-0.75
-0.50
-0.25
0.00
0.25
0.50
0.75D
AC
Cha
nge
(Cor
elok
- W
ater
Dis
p.),
%
Fine Coarse
PG 67-22 PG 76-22
Nd = 96
12.5 19.0 12.5 19.0
PG 67-22 PG 76-22
Nd = 119
12.5 19.0 12.5 19.0
Figure 4.21 Design Asphalt Content Change (Corelok – Water Displacement) for Gravel Mixes

71
0.14
0.01
0.27
0.35
0.25
0.44
0.330.360.36
0.29 0.29
0.36
0.45 0.47
0.250.29
-0.75
-0.50
-0.25
0.00
0.25
0.50
0.75
DA
C C
hang
e (C
orel
ok -
Wat
er D
isp.
), %
Fine Coarse
PG 67-22 PG 76-22
Nd = 96
12.5 19.0 12.5 19.0
PG 67-22 PG 76-22
Nd = 119
12.5 19.0 12.5 19.0
Figure 4.22 Design Asphalt Content Change (Corelok – Water Displacement) for Sandstone Mixes
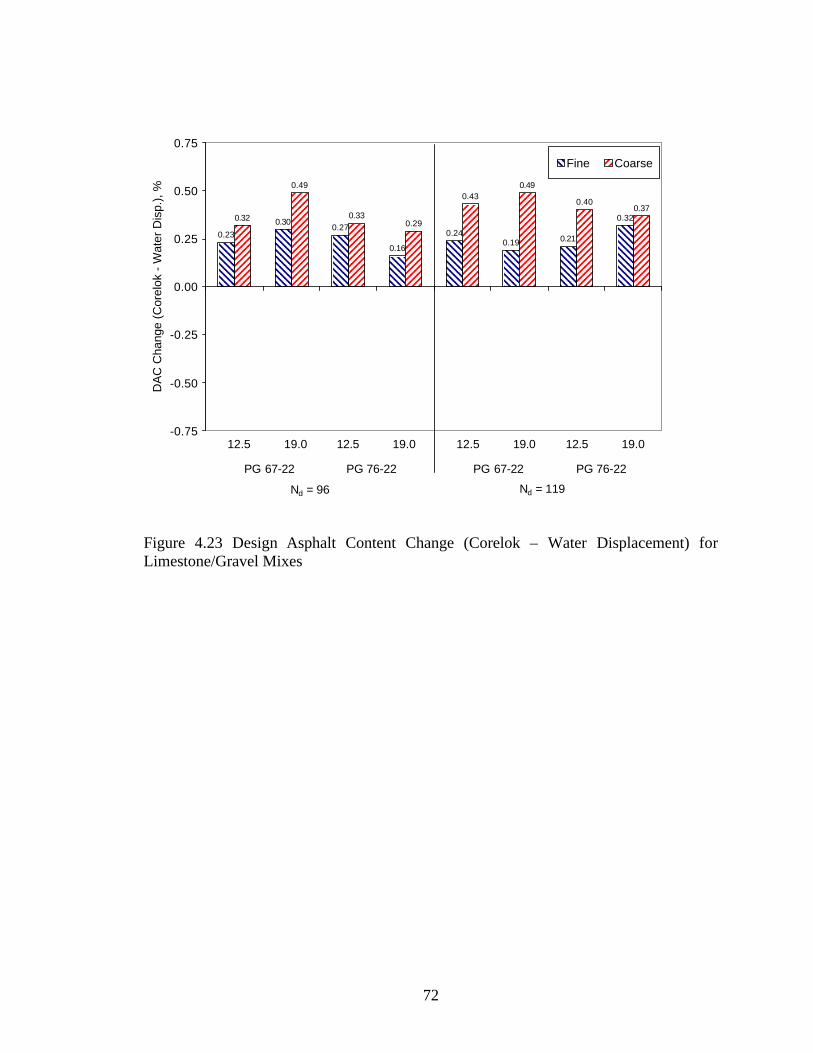
72
0.23
0.300.27
0.16
0.240.19 0.21
0.320.32
0.49
0.330.29
0.430.49
0.400.37
-0.75
-0.50
-0.25
0.00
0.25
0.50
0.75D
AC
Cha
nge
(Cor
elok
- W
ater
Dis
p.),
%Fine Coarse
PG 67-22 PG 76-22
Nd = 96
12.5 19.0 12.5 19.0
PG 67-22 PG 76-22
Nd = 119
12.5 19.0 12.5 19.0
Figure 4.23 Design Asphalt Content Change (Corelok – Water Displacement) for Limestone/Gravel Mixes

73
Table 4.15 Design Asphalt Content and VMA Change (Corelok – Water Displacement)
Gravel Sandstone Limestone 67 76 96 119 12.5 19 Fine Coarse
DAC 0.29 0.25 0.32 0.31 0.30 0.28 0.28 0.30 0.28 0.30 0.23 0.35
VMA 0.64 0.47 0.64 0.82 0.58 0.71 0.59 0.69 0.61 0.67 0.47 0.81
AggregateProperty
Average Percent Change in DAC and VMA (Corelok - Water Displacement)
PG Ndesign NMAS, mm GradationOverall
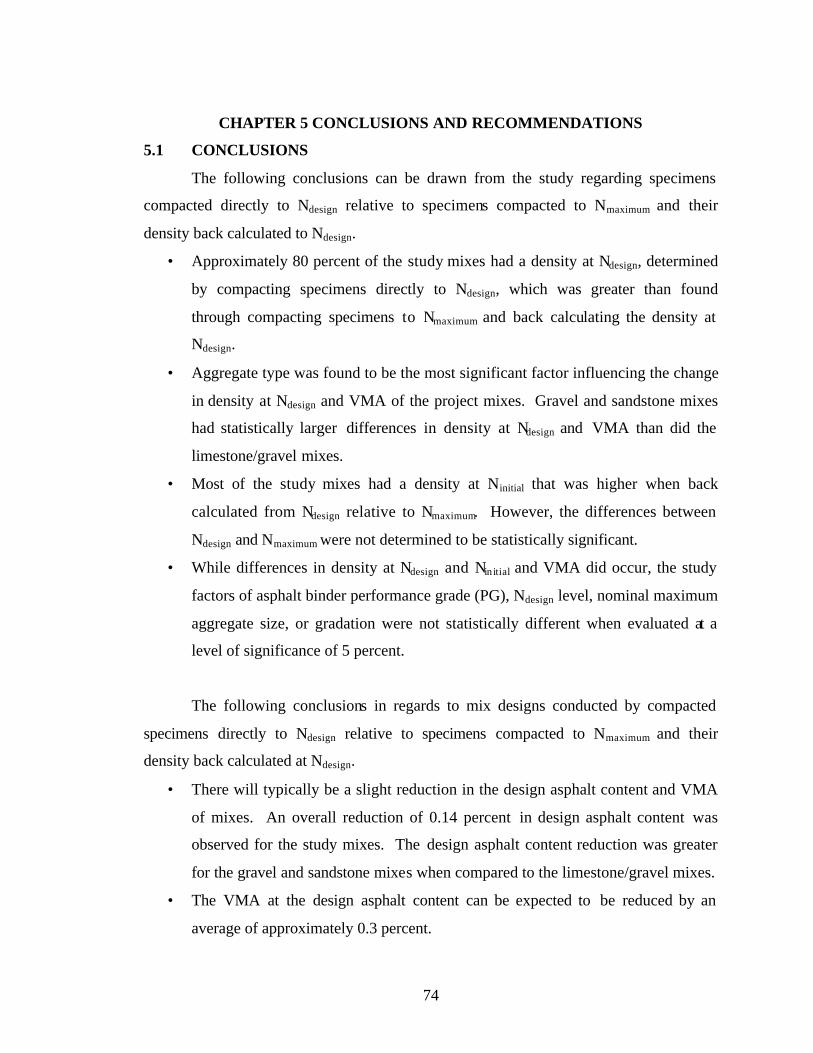
74
CHAPTER 5 CONCLUSIONS AND RECOMMENDATIONS
5.1 CONCLUSIONS
The following conclusions can be drawn from the study regarding specimens
compacted directly to Ndesign relative to specimens compacted to Nmaximum and their
density back calculated to Ndesign.
• Approximately 80 percent of the study mixes had a density at Ndesign, determined
by compacting specimens directly to Ndesign, which was greater than found
through compacting specimens to Nmaximum and back calculating the density at
Ndesign.
• Aggregate type was found to be the most significant factor influencing the change
in density at Ndesign and VMA of the project mixes. Gravel and sandstone mixes
had statistically larger differences in density at Ndesign and VMA than did the
limestone/gravel mixes.
• Most of the study mixes had a density at Ninitial that was higher when back
calculated from Ndesign relative to Nmaximum. However, the differences between
Ndesign and Nmaximum were not determined to be statistically significant.
• While differences in density at Ndesign and Nin itial and VMA did occur, the study
factors of asphalt binder performance grade (PG), Ndesign level, nominal maximum
aggregate size, or gradation were not statistically different when evaluated at a
level of significance of 5 percent.
The following conclusions in regards to mix designs conducted by compacted
specimens directly to Ndesign relative to specimens compacted to Nmaximum and their
density back calculated at Ndesign.
• There will typically be a slight reduction in the design asphalt content and VMA
of mixes. An overall reduction of 0.14 percent in design asphalt content was
observed for the study mixes. The design asphalt content reduction was greater
for the gravel and sandstone mixes when compared to the limestone/gravel mixes.
• The VMA at the design asphalt content can be expected to be reduced by an
average of approximately 0.3 percent.
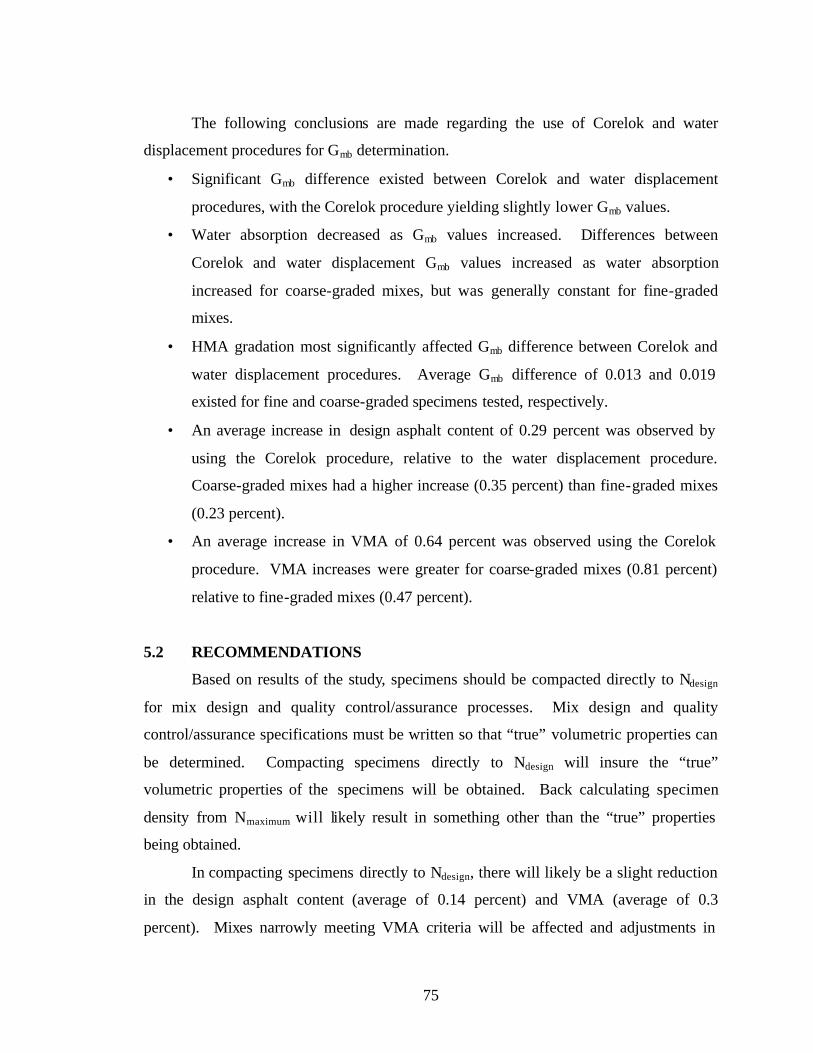
75
The following conclusions are made regarding the use of Corelok and water
displacement procedures for Gmb determination.
• Significant Gmb difference existed between Corelok and water displacement
procedures, with the Corelok procedure yielding slightly lower Gmb values.
• Water absorption decreased as Gmb values increased. Differences between
Corelok and water displacement Gmb values increased as water absorption
increased for coarse-graded mixes, but was generally constant for fine-graded
mixes.
• HMA gradation most significantly affected Gmb difference between Corelok and
water displacement procedures. Average Gmb difference of 0.013 and 0.019
existed for fine and coarse-graded specimens tested, respectively.
• An average increase in design asphalt content of 0.29 percent was observed by
using the Corelok procedure, relative to the water displacement procedure.
Coarse-graded mixes had a higher increase (0.35 percent) than fine-graded mixes
(0.23 percent).
• An average increase in VMA of 0.64 percent was observed using the Corelok
procedure. VMA increases were greater for coarse-graded mixes (0.81 percent)
relative to fine-graded mixes (0.47 percent).
5.2 RECOMMENDATIONS
Based on results of the study, specimens should be compacted directly to Ndesign
for mix design and quality control/assurance processes. Mix design and quality
control/assurance specifications must be written so that “true” volumetric properties can
be determined. Compacting specimens directly to Ndesign will insure the “true”
volumetric properties of the specimens will be obtained. Back calculating specimen
density from Nmaximum will likely result in something other than the “true” properties
being obtained.
In compacting specimens directly to Ndesign, there will likely be a slight reduction
in the design asphalt content (average of 0.14 percent) and VMA (average of 0.3
percent). Mixes narrowly meeting VMA criteria will be affected and adjustments in
76
aggregate type of gradation may be needed to bring them into compliance. The slight
reduction in asphalt content may have a minor effect on field compaction.
During mix design and quality control/assurance testing of HMA mixes, the
Corelok device should be utilized to more accurately determine specimen Gmb. By using
the Corelok device and compacting specimens directly to Ndesign overall average increases
in the design asphalt content and VMA of 0.15 and 0.35 percent, respectively, were
observed.
77
CHAPTER 6 REFERENCES
1. Blackenship, P.B., Mahboub, K. C., and Huber, G. A., ARational Method of
Laboratory Compaction of Hot-Mix Asphalt.@ Transportation Research Record 1454, TRB, National Research Council, Washington D.C., (1994), pp. 144-153.
2. Cominsky, R., Leahy, R. B., and Harrigan, E. T., ALevel One Mix Design:
Materials Selection, Compaction, and Conditioning.@ Strategic Highway Research Program Report No. A-408, National Research Council, Washington, D.C., 1994.
3. Cominsky, R.., Huber, G. A., Kennedy, T. W. and Anderson, R. M. AThe
Superpave Mix Design Manual for New Construction and Overlays.@ Strategic Highway Research Program, Report SHRP A-407, National Research Council, Washington, D.C.,1994.
4. Vavrik, W. R., and Carpenter, S. H., ACalculating Voids at a Specified Number of
Gyrations in the SUPERPAVE Gyratory Compactor.@ Transportation Research Record 1630, TRB, National Research Council, Washington, D.C., (1998), 117-125.
5. Mallick, R. B, Buchanan, M. S., Brown E. R. and Huner, M. H., AEvaluation of
Superpave Gyratory Compaction of Hot Mix Asphalt.@ Transportation Research Record 1630, TRB, National Research Council, Washington, D.C., (1998), 111-119.
6. Buchanan, Michael, S. “Evaluation of the Superpave Gyratory Compaction
Procedure.” Ph. D. Dissertation, Auburn University, December 1999. 7. Mississippi Department of Transportation Standard Operating Procedure No.
TMD-11-78-00-000: Volumetric Mix Design of Hot Mix Asphalt Mixtures Using the Superpave Gyratory Compactor, November 1, 2000.
8. Cooley, Allen, Prowell, Brian D., Cooley, Allen, Hainin, M. R., Buchanan, M.
Shane, and Harrington, J., “Bulk Specific Gravity Round-Robin Using the Corelok Vacuum Sealing Device.” NCAT Report No. 02-11, National Center for Asphalt Technology, November 2002.
9. Statistical Analysis Software (SAS), Version 8.12, SAS Institute, Inc. 10. AASHTO. (2001). “Bulk Specific Gravity of Compacted Bituminous Mixtures
Using Saturated Surface-Dry Specimens.”, T166, Washington, D.C.
78
11. ASTM. (2000). “Standard Test Method for Bulk Specific Gravity and Density of Non-Absorptive Compacted Bituminous Mixtures.”, D2726, West Conshohocken, Pennsylvania.
12. Buchanan, M.S., An Evaluation of Selected Methods to Determine the Bulk
Specific Gravity of Compacted Hot Mix Asphalt (HMA) Mixes., Association of Asphalt Paving Technologists (AAPT), Volume 69, 1999, pp. 608 - 634.
13. ASTM. (2002). "Standard Test Method for Bulk Specific Gravity and Density of
Compacted Bituminous Mixtures Using Automatic Vacuum Sealing Method", ASTM D6752, West Conshohocken, Pennsylvania.
14. Crouch, L. K., Copeland, A. R., Walker, C. T., Maxwell, R. A., Duncan, G. M.,
Goodwin, W. A., Badoe, D. A., and Leimer, H. W., Effect of Superpave Gyratory Compactor Type on Compacted Hot Mix Asphalt (HMA) Density. Transportation Research Record 1813, TRB, National Research Council, Washington, D.C., 2002, pp. 39 - 46.
15. Instrotek, Incorporated, Corelok Vacuum Sealing Device Operation
Manual, Raleigh, North Carolina, 2002.
16. ASTM. (2002). "Standard Test Method for Bulk Specific Gravity and Density of Compacted Bituminous Mixtures Using Coated Samples", ASTM D1188, West Conshohocken, Pennsylvania.

79
APPENDIX A
INDIVIDUAL SPECIMEN DATA:
GYRATORY COMPACTION HEIGHT,
GMB and GMM
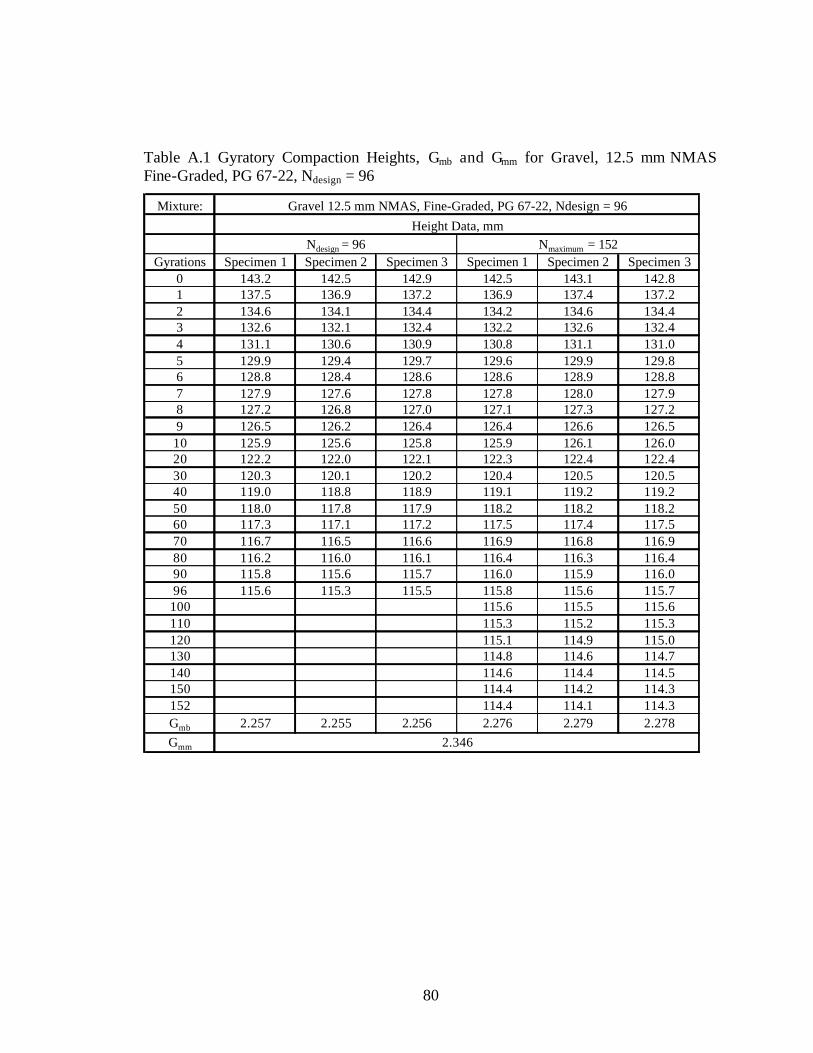
80
Table A.1 Gyratory Compaction Heights, Gmb and Gmm for Gravel, 12.5 mm NMAS Fine-Graded, PG 67-22, Ndesign = 96
Mixture:
Gyrations Specimen 1 Specimen 2 Specimen 3 Specimen 1 Specimen 2 Specimen 30 143.2 142.5 142.9 142.5 143.1 142.81 137.5 136.9 137.2 136.9 137.4 137.22 134.6 134.1 134.4 134.2 134.6 134.43 132.6 132.1 132.4 132.2 132.6 132.44 131.1 130.6 130.9 130.8 131.1 131.05 129.9 129.4 129.7 129.6 129.9 129.86 128.8 128.4 128.6 128.6 128.9 128.87 127.9 127.6 127.8 127.8 128.0 127.98 127.2 126.8 127.0 127.1 127.3 127.29 126.5 126.2 126.4 126.4 126.6 126.510 125.9 125.6 125.8 125.9 126.1 126.020 122.2 122.0 122.1 122.3 122.4 122.430 120.3 120.1 120.2 120.4 120.5 120.540 119.0 118.8 118.9 119.1 119.2 119.250 118.0 117.8 117.9 118.2 118.2 118.260 117.3 117.1 117.2 117.5 117.4 117.570 116.7 116.5 116.6 116.9 116.8 116.980 116.2 116.0 116.1 116.4 116.3 116.490 115.8 115.6 115.7 116.0 115.9 116.096 115.6 115.3 115.5 115.8 115.6 115.7100 115.6 115.5 115.6110 115.3 115.2 115.3120 115.1 114.9 115.0130 114.8 114.6 114.7140 114.6 114.4 114.5150 114.4 114.2 114.3152 114.4 114.1 114.3Gmb 2.257 2.255 2.256 2.276 2.279 2.278Gmm 2.346
Ndesign = 96 Nmaximum = 152
Gravel 12.5 mm NMAS, Fine-Graded, PG 67-22, Ndesign = 96Height Data, mm
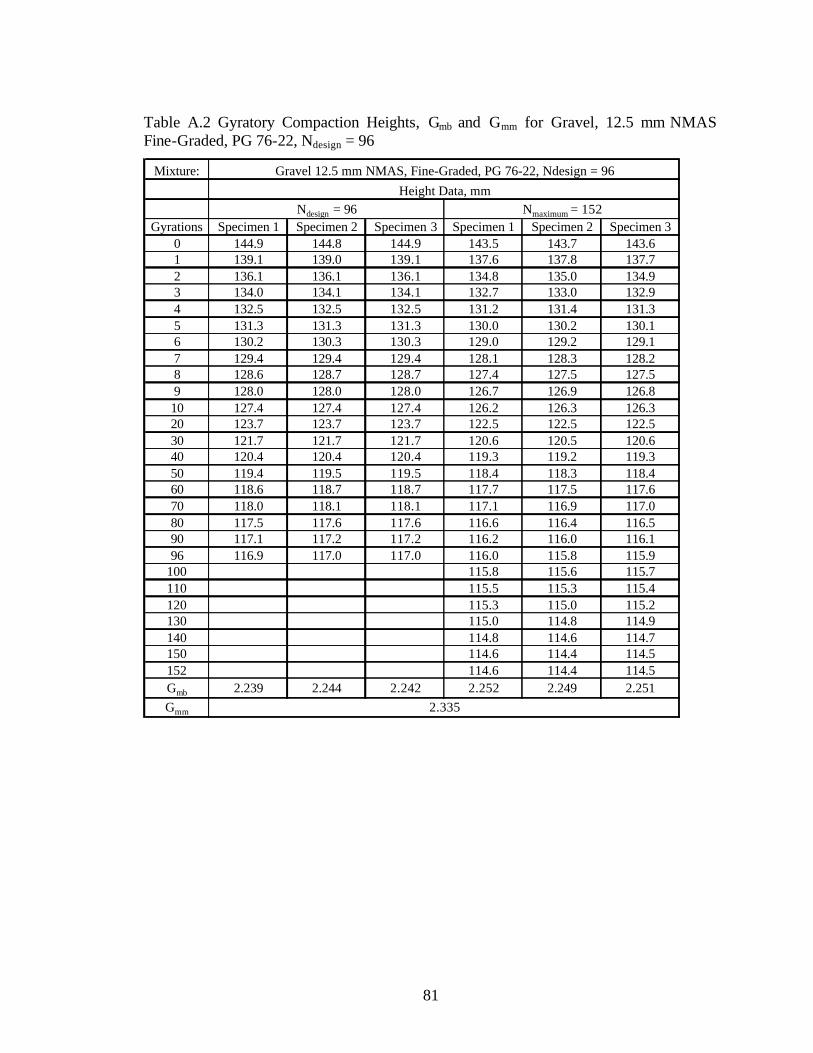
81
Table A.2 Gyratory Compaction Heights, Gmb and Gmm for Gravel, 12.5 mm NMAS Fine-Graded, PG 76-22, Ndesign = 96
Mixture:
Gyrations Specimen 1 Specimen 2 Specimen 3 Specimen 1 Specimen 2 Specimen 30 144.9 144.8 144.9 143.5 143.7 143.61 139.1 139.0 139.1 137.6 137.8 137.72 136.1 136.1 136.1 134.8 135.0 134.93 134.0 134.1 134.1 132.7 133.0 132.94 132.5 132.5 132.5 131.2 131.4 131.35 131.3 131.3 131.3 130.0 130.2 130.16 130.2 130.3 130.3 129.0 129.2 129.17 129.4 129.4 129.4 128.1 128.3 128.28 128.6 128.7 128.7 127.4 127.5 127.59 128.0 128.0 128.0 126.7 126.9 126.810 127.4 127.4 127.4 126.2 126.3 126.320 123.7 123.7 123.7 122.5 122.5 122.530 121.7 121.7 121.7 120.6 120.5 120.640 120.4 120.4 120.4 119.3 119.2 119.350 119.4 119.5 119.5 118.4 118.3 118.460 118.6 118.7 118.7 117.7 117.5 117.670 118.0 118.1 118.1 117.1 116.9 117.080 117.5 117.6 117.6 116.6 116.4 116.590 117.1 117.2 117.2 116.2 116.0 116.196 116.9 117.0 117.0 116.0 115.8 115.9
100 115.8 115.6 115.7110 115.5 115.3 115.4120 115.3 115.0 115.2130 115.0 114.8 114.9140 114.8 114.6 114.7150 114.6 114.4 114.5152 114.6 114.4 114.5Gmb 2.239 2.244 2.242 2.252 2.249 2.251Gmm 2.335
Gravel 12.5 mm NMAS, Fine-Graded, PG 76-22, Ndesign = 96Height Data, mm
Ndesign = 96 Nmaximum = 152
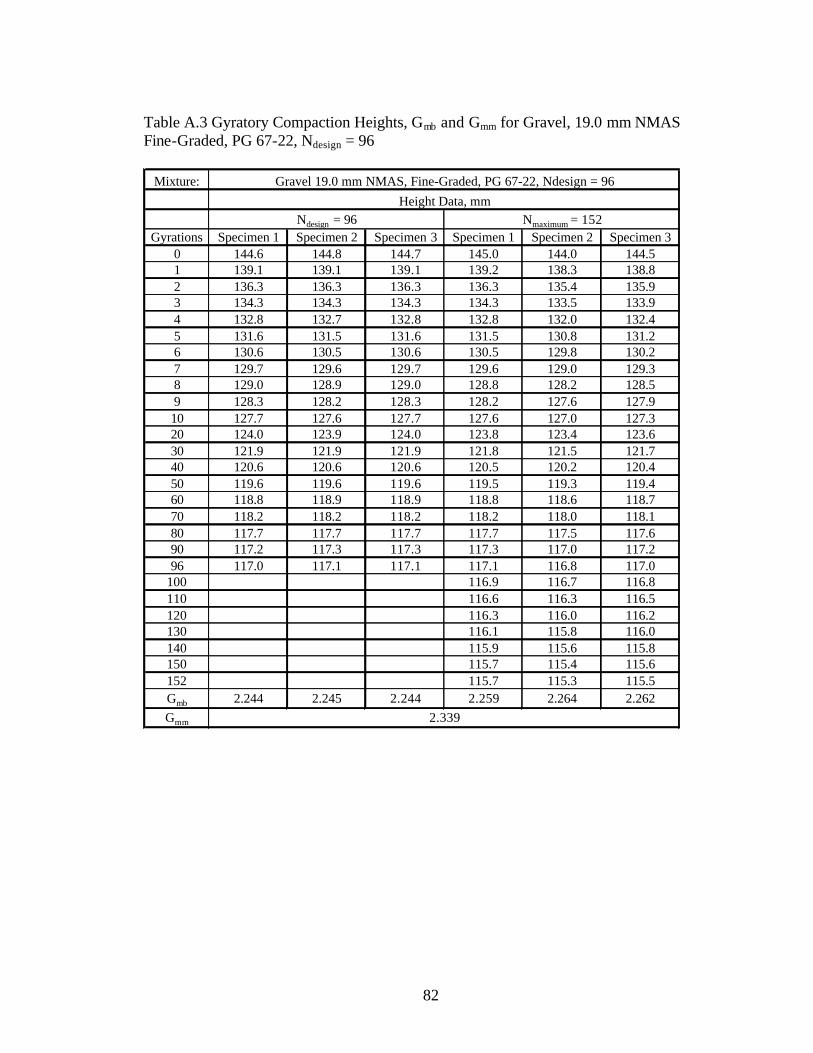
82
Table A.3 Gyratory Compaction Heights, Gmb and Gmm for Gravel, 19.0 mm NMAS Fine-Graded, PG 67-22, Ndesign = 96
Mixture:
Gyrations Specimen 1 Specimen 2 Specimen 3 Specimen 1 Specimen 2 Specimen 30 144.6 144.8 144.7 145.0 144.0 144.51 139.1 139.1 139.1 139.2 138.3 138.82 136.3 136.3 136.3 136.3 135.4 135.93 134.3 134.3 134.3 134.3 133.5 133.94 132.8 132.7 132.8 132.8 132.0 132.45 131.6 131.5 131.6 131.5 130.8 131.26 130.6 130.5 130.6 130.5 129.8 130.27 129.7 129.6 129.7 129.6 129.0 129.38 129.0 128.9 129.0 128.8 128.2 128.59 128.3 128.2 128.3 128.2 127.6 127.910 127.7 127.6 127.7 127.6 127.0 127.320 124.0 123.9 124.0 123.8 123.4 123.630 121.9 121.9 121.9 121.8 121.5 121.740 120.6 120.6 120.6 120.5 120.2 120.450 119.6 119.6 119.6 119.5 119.3 119.460 118.8 118.9 118.9 118.8 118.6 118.770 118.2 118.2 118.2 118.2 118.0 118.180 117.7 117.7 117.7 117.7 117.5 117.690 117.2 117.3 117.3 117.3 117.0 117.296 117.0 117.1 117.1 117.1 116.8 117.0
100 116.9 116.7 116.8110 116.6 116.3 116.5120 116.3 116.0 116.2130 116.1 115.8 116.0140 115.9 115.6 115.8150 115.7 115.4 115.6152 115.7 115.3 115.5Gmb 2.244 2.245 2.244 2.259 2.264 2.262Gmm 2.339
Gravel 19.0 mm NMAS, Fine-Graded, PG 67-22, Ndesign = 96Height Data, mm
Ndesign = 96 Nmaximum = 152
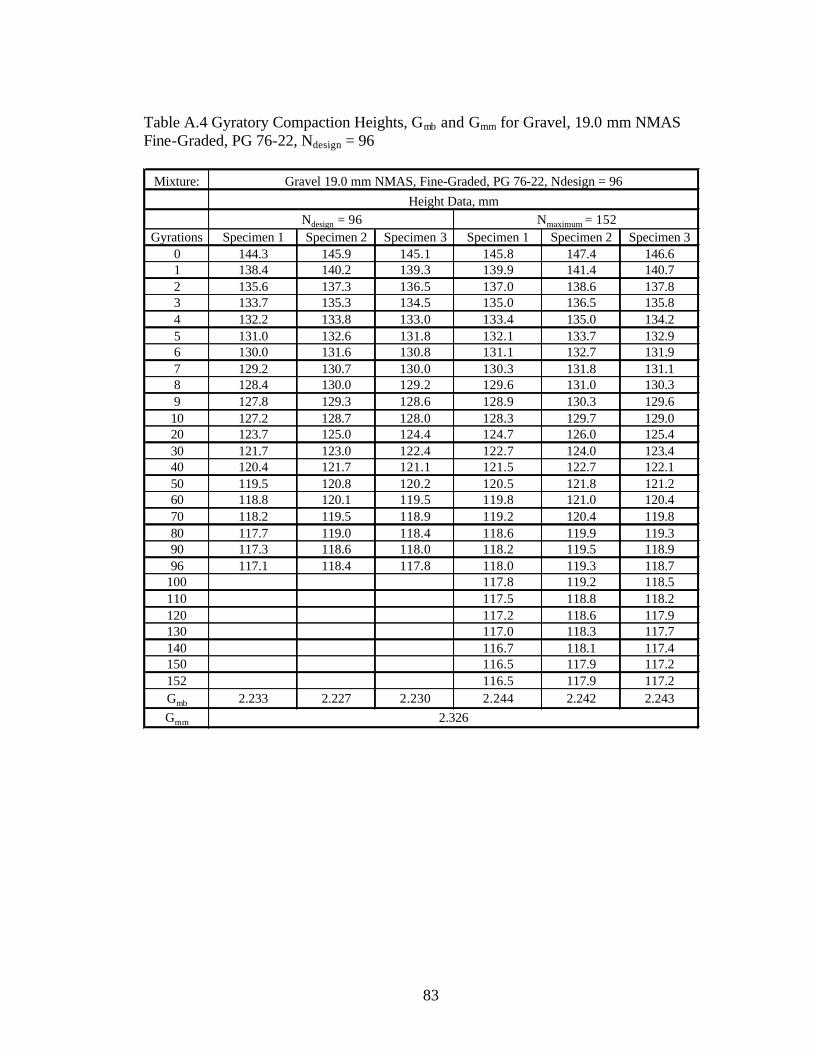
83
Table A.4 Gyratory Compaction Heights, Gmb and Gmm for Gravel, 19.0 mm NMAS Fine-Graded, PG 76-22, Ndesign = 96
Mixture:
Gyrations Specimen 1 Specimen 2 Specimen 3 Specimen 1 Specimen 2 Specimen 30 144.3 145.9 145.1 145.8 147.4 146.61 138.4 140.2 139.3 139.9 141.4 140.72 135.6 137.3 136.5 137.0 138.6 137.83 133.7 135.3 134.5 135.0 136.5 135.84 132.2 133.8 133.0 133.4 135.0 134.25 131.0 132.6 131.8 132.1 133.7 132.96 130.0 131.6 130.8 131.1 132.7 131.97 129.2 130.7 130.0 130.3 131.8 131.18 128.4 130.0 129.2 129.6 131.0 130.39 127.8 129.3 128.6 128.9 130.3 129.610 127.2 128.7 128.0 128.3 129.7 129.020 123.7 125.0 124.4 124.7 126.0 125.430 121.7 123.0 122.4 122.7 124.0 123.440 120.4 121.7 121.1 121.5 122.7 122.150 119.5 120.8 120.2 120.5 121.8 121.260 118.8 120.1 119.5 119.8 121.0 120.470 118.2 119.5 118.9 119.2 120.4 119.880 117.7 119.0 118.4 118.6 119.9 119.390 117.3 118.6 118.0 118.2 119.5 118.996 117.1 118.4 117.8 118.0 119.3 118.7
100 117.8 119.2 118.5110 117.5 118.8 118.2120 117.2 118.6 117.9130 117.0 118.3 117.7140 116.7 118.1 117.4150 116.5 117.9 117.2152 116.5 117.9 117.2Gmb 2.233 2.227 2.230 2.244 2.242 2.243Gmm 2.326
Gravel 19.0 mm NMAS, Fine-Graded, PG 76-22, Ndesign = 96Height Data, mm
Ndesign = 96 Nmaximum = 152

84
Table A.5 Gyratory Compaction Heights, Gmb and Gmm for Gravel, 12.5 mm NMAS Coarse-Graded, PG 67-22, Ndesign = 96
Mixture:
Gyrations Specimen 1 Specimen 2 Specimen 3 Specimen 1 Specimen 2 Specimen 30 146.6 146.4 146.3 147.3 146.1 146.71 140.8 140.6 140.4 141.4 140.5 141.02 137.8 137.6 137.4 138.4 137.7 138.13 135.6 135.5 135.3 136.2 135.6 135.94 134.0 133.9 133.6 134.6 134.0 134.35 132.6 132.6 132.3 133.3 132.7 133.06 131.5 131.5 131.2 132.2 131.6 131.97 130.5 130.5 130.2 131.3 130.7 131.08 129.7 129.7 129.4 130.5 130.0 130.39 129.0 129.0 128.6 129.8 129.3 129.610 128.3 128.3 128.0 129.1 128.6 128.920 124.1 124.2 123.8 125.1 124.6 124.930 121.9 121.9 121.6 122.9 122.4 122.740 120.4 120.4 120.2 121.4 121.0 121.250 119.3 119.3 119.1 120.3 119.9 120.160 118.5 118.5 118.3 119.4 119.1 119.370 117.8 117.8 117.7 118.7 118.4 118.680 117.3 117.3 117.1 118.2 117.8 118.090 116.8 116.8 116.7 117.7 117.4 117.696 116.6 116.6 116.5 117.5 117.1 117.3
100 117.3 117.0 117.2110 117.0 116.6 116.8120 116.7 116.3 116.5130 116.4 116.0 116.2140 116.2 115.8 116.0150 115.9 115.5 115.7152 115.9 115.5 115.7Gmb 2.194 2.197 2.196 2.218 2.219 2.218Gmm 2.292
Gravel 12.5 mm NMAS, Coarse-Graded, PG 67-22, Ndesign = 96Height Data, mm
Ndesign = 96 Nmaximum = 152
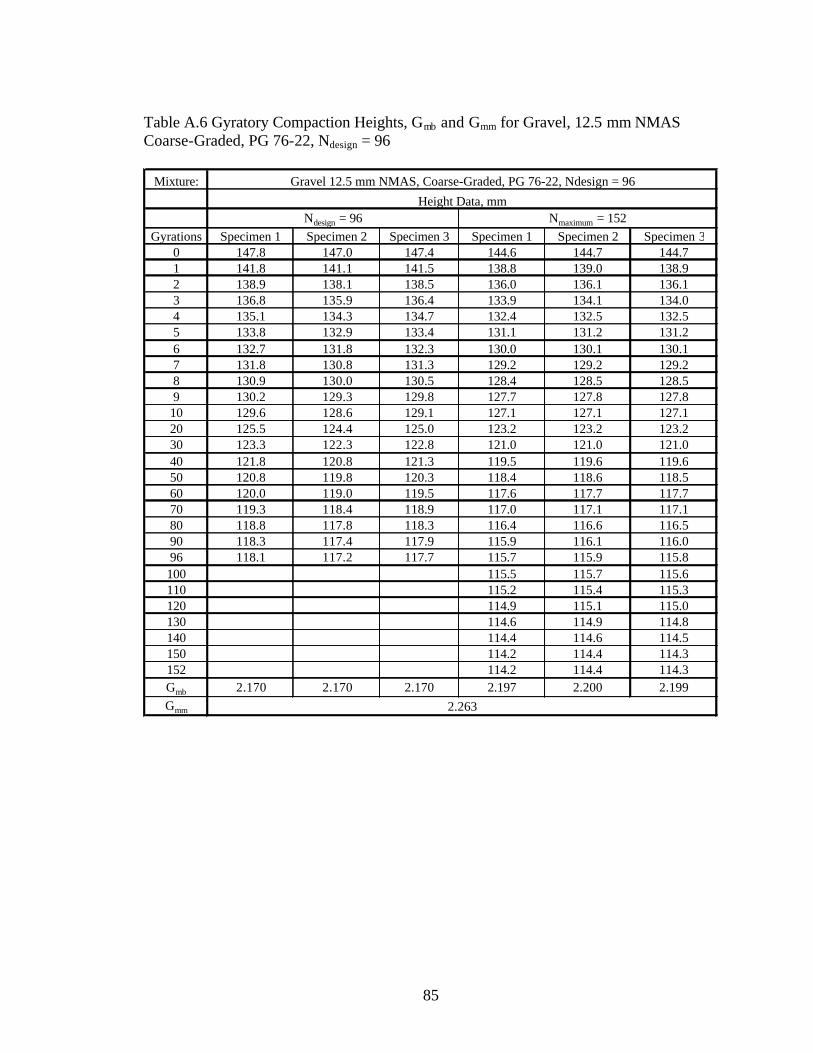
85
Table A.6 Gyratory Compaction Heights, Gmb and Gmm for Gravel, 12.5 mm NMAS Coarse-Graded, PG 76-22, Ndesign = 96
Mixture:
Gyrations Specimen 1 Specimen 2 Specimen 3 Specimen 1 Specimen 2 Specimen 30 147.8 147.0 147.4 144.6 144.7 144.71 141.8 141.1 141.5 138.8 139.0 138.92 138.9 138.1 138.5 136.0 136.1 136.13 136.8 135.9 136.4 133.9 134.1 134.04 135.1 134.3 134.7 132.4 132.5 132.55 133.8 132.9 133.4 131.1 131.2 131.26 132.7 131.8 132.3 130.0 130.1 130.17 131.8 130.8 131.3 129.2 129.2 129.28 130.9 130.0 130.5 128.4 128.5 128.59 130.2 129.3 129.8 127.7 127.8 127.810 129.6 128.6 129.1 127.1 127.1 127.120 125.5 124.4 125.0 123.2 123.2 123.230 123.3 122.3 122.8 121.0 121.0 121.040 121.8 120.8 121.3 119.5 119.6 119.650 120.8 119.8 120.3 118.4 118.6 118.560 120.0 119.0 119.5 117.6 117.7 117.770 119.3 118.4 118.9 117.0 117.1 117.180 118.8 117.8 118.3 116.4 116.6 116.590 118.3 117.4 117.9 115.9 116.1 116.096 118.1 117.2 117.7 115.7 115.9 115.8100 115.5 115.7 115.6110 115.2 115.4 115.3120 114.9 115.1 115.0130 114.6 114.9 114.8140 114.4 114.6 114.5150 114.2 114.4 114.3152 114.2 114.4 114.3Gmb 2.170 2.170 2.170 2.197 2.200 2.199Gmm 2.263
Gravel 12.5 mm NMAS, Coarse-Graded, PG 76-22, Ndesign = 96
Height Data, mmNdesign = 96 Nmaximum = 152
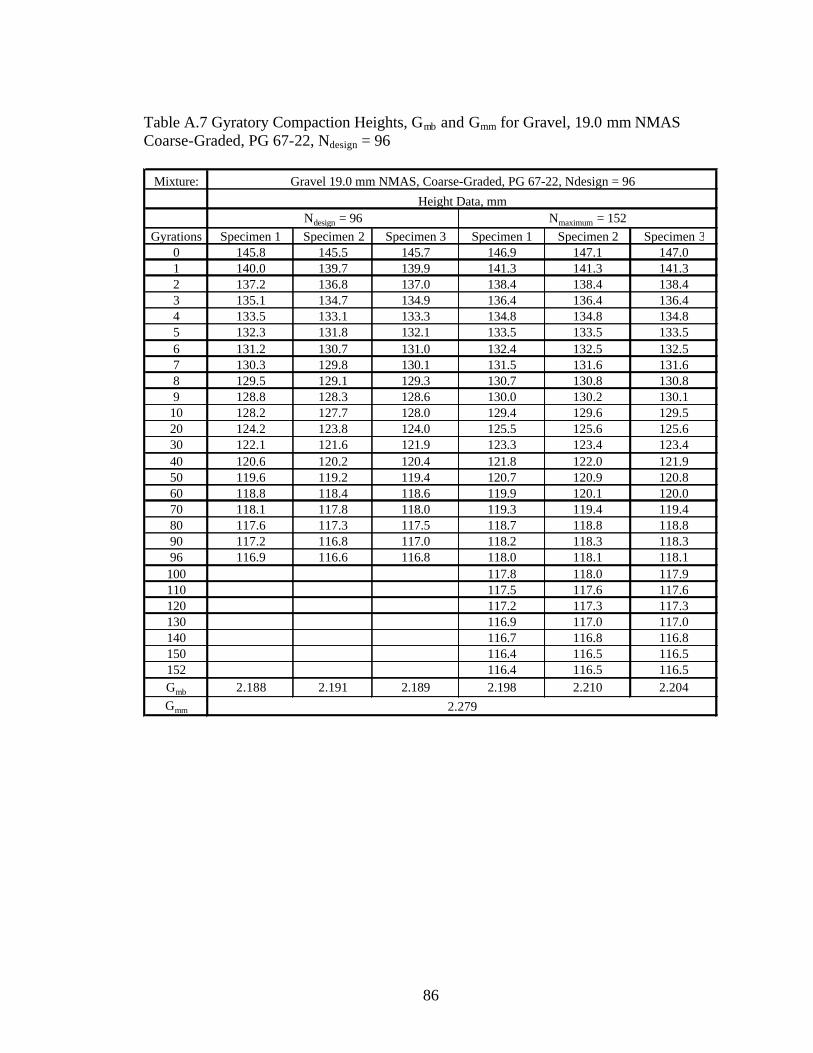
86
Table A.7 Gyratory Compaction Heights, Gmb and Gmm for Gravel, 19.0 mm NMAS Coarse-Graded, PG 67-22, Ndesign = 96
Mixture:
Gyrations Specimen 1 Specimen 2 Specimen 3 Specimen 1 Specimen 2 Specimen 30 145.8 145.5 145.7 146.9 147.1 147.01 140.0 139.7 139.9 141.3 141.3 141.32 137.2 136.8 137.0 138.4 138.4 138.43 135.1 134.7 134.9 136.4 136.4 136.44 133.5 133.1 133.3 134.8 134.8 134.85 132.3 131.8 132.1 133.5 133.5 133.56 131.2 130.7 131.0 132.4 132.5 132.57 130.3 129.8 130.1 131.5 131.6 131.68 129.5 129.1 129.3 130.7 130.8 130.89 128.8 128.3 128.6 130.0 130.2 130.110 128.2 127.7 128.0 129.4 129.6 129.520 124.2 123.8 124.0 125.5 125.6 125.630 122.1 121.6 121.9 123.3 123.4 123.440 120.6 120.2 120.4 121.8 122.0 121.950 119.6 119.2 119.4 120.7 120.9 120.860 118.8 118.4 118.6 119.9 120.1 120.070 118.1 117.8 118.0 119.3 119.4 119.480 117.6 117.3 117.5 118.7 118.8 118.890 117.2 116.8 117.0 118.2 118.3 118.396 116.9 116.6 116.8 118.0 118.1 118.1100 117.8 118.0 117.9110 117.5 117.6 117.6120 117.2 117.3 117.3130 116.9 117.0 117.0140 116.7 116.8 116.8150 116.4 116.5 116.5152 116.4 116.5 116.5Gmb 2.188 2.191 2.189 2.198 2.210 2.204Gmm 2.279
Gravel 19.0 mm NMAS, Coarse-Graded, PG 67-22, Ndesign = 96
Height Data, mmNdesign = 96 Nmaximum = 152

87
Table A.8 Gyratory Compaction Heights, Gmb and Gmm for Gravel, 19.0 mm NMAS Coarse-Graded, PG 76-22, Ndesign = 96
Mixture:
Gyrations Specimen 1 Specimen 2 Specimen 3 Specimen 1 Specimen 2 Specimen 30 145.9 146.4 146.2 146.4 145.0 145.71 140.0 140.6 140.3 140.5 139.3 139.92 137.0 137.6 137.3 137.5 136.5 137.03 135.0 135.5 135.3 135.4 134.6 135.04 133.4 134.0 133.7 133.7 133.1 133.45 132.2 132.7 132.5 132.4 131.8 132.16 131.1 131.6 131.4 131.3 130.8 131.17 130.2 130.7 130.5 130.4 129.9 130.28 129.4 129.9 129.7 129.6 129.2 129.49 128.7 129.2 129.0 128.9 128.5 128.710 128.1 128.6 128.4 128.3 127.9 128.120 124.2 124.4 124.3 124.3 124.0 124.230 122.0 122.2 122.1 122.1 121.8 122.040 120.6 120.7 120.7 120.6 120.4 120.550 119.6 119.7 119.7 119.6 119.4 119.560 118.8 118.9 118.9 118.8 118.5 118.770 118.2 118.2 118.2 118.1 117.9 118.080 117.6 117.7 117.7 117.6 117.3 117.590 117.2 117.3 117.3 117.1 116.9 117.096 117.0 117.1 117.1 116.9 116.6 116.8
100 116.7 116.5 116.6110 116.4 116.1 116.3120 116.1 115.8 116.0130 115.8 115.6 115.7140 115.6 115.3 115.5150 115.3 115.1 115.2152 115.3 115.1 115.2Gmb 2.179 2.176 2.178 2.200 2.208 2.204Gmm 2.270
Gravel 19.0 mm NMAS, Coarse-Graded, PG 76-22, Ndesign = 96Height Data, mm
Ndesign = 96 Nmaximum = 152
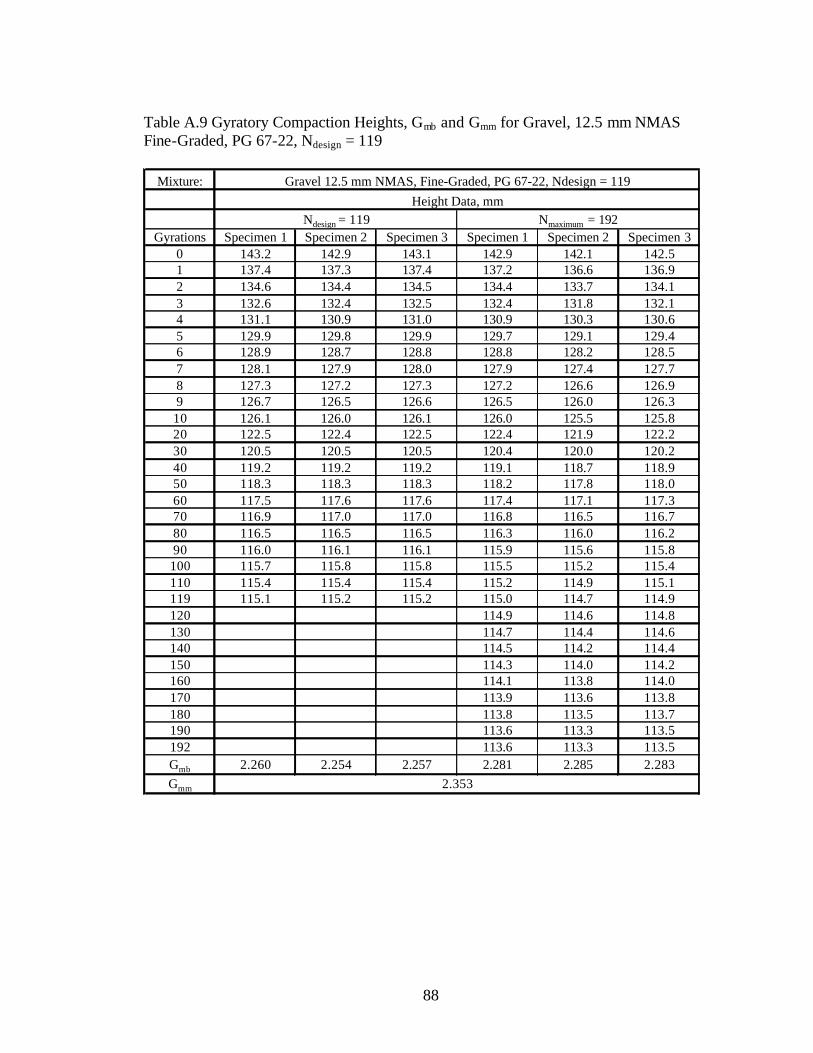
88
Table A.9 Gyratory Compaction Heights, Gmb and Gmm for Gravel, 12.5 mm NMAS Fine-Graded, PG 67-22, Ndesign = 119
Mixture:
Gyrations Specimen 1 Specimen 2 Specimen 3 Specimen 1 Specimen 2 Specimen 30 143.2 142.9 143.1 142.9 142.1 142.51 137.4 137.3 137.4 137.2 136.6 136.92 134.6 134.4 134.5 134.4 133.7 134.13 132.6 132.4 132.5 132.4 131.8 132.14 131.1 130.9 131.0 130.9 130.3 130.65 129.9 129.8 129.9 129.7 129.1 129.46 128.9 128.7 128.8 128.8 128.2 128.57 128.1 127.9 128.0 127.9 127.4 127.78 127.3 127.2 127.3 127.2 126.6 126.99 126.7 126.5 126.6 126.5 126.0 126.310 126.1 126.0 126.1 126.0 125.5 125.820 122.5 122.4 122.5 122.4 121.9 122.230 120.5 120.5 120.5 120.4 120.0 120.240 119.2 119.2 119.2 119.1 118.7 118.950 118.3 118.3 118.3 118.2 117.8 118.060 117.5 117.6 117.6 117.4 117.1 117.370 116.9 117.0 117.0 116.8 116.5 116.780 116.5 116.5 116.5 116.3 116.0 116.290 116.0 116.1 116.1 115.9 115.6 115.8100 115.7 115.8 115.8 115.5 115.2 115.4110 115.4 115.4 115.4 115.2 114.9 115.1119 115.1 115.2 115.2 115.0 114.7 114.9120 114.9 114.6 114.8130 114.7 114.4 114.6140 114.5 114.2 114.4150 114.3 114.0 114.2160 114.1 113.8 114.0170 113.9 113.6 113.8180 113.8 113.5 113.7190 113.6 113.3 113.5192 113.6 113.3 113.5Gmb 2.260 2.254 2.257 2.281 2.285 2.283Gmm 2.353
Ndesign = 119 Nmaximum = 192
Gravel 12.5 mm NMAS, Fine-Graded, PG 67-22, Ndesign = 119Height Data, mm

89
Table A.10 Gyratory Compaction Heights, Gmb and Gmm for Gravel, 12.5 mm NMAS Fine-Graded, PG 76-22, Ndesign = 119
Mixture:
Gyrations Specimen 1 Specimen 2 Specimen 3 Specimen 1 Specimen 2 Specimen 30 144.7 145.0 144.9 144.5 145.5 145.01 138.8 139.1 139.0 138.7 139.6 139.22 136.0 136.3 136.2 135.9 136.7 136.33 134.0 134.2 134.1 133.9 134.7 134.34 132.4 132.7 132.6 132.4 133.1 132.85 131.2 131.4 131.3 131.2 131.8 131.56 130.2 130.4 130.3 130.1 130.8 130.57 129.3 129.5 129.4 129.3 129.9 129.68 128.5 128.8 128.7 128.5 129.2 128.99 127.9 128.1 128.0 127.9 128.5 128.210 127.3 127.5 127.4 127.3 127.9 127.620 123.6 123.8 123.7 123.6 124.2 123.930 121.6 121.7 121.7 121.6 122.2 121.940 120.3 120.4 120.4 120.3 120.8 120.650 119.3 119.4 119.4 119.3 119.9 119.660 118.5 118.7 118.6 118.6 119.1 118.970 117.9 118.1 118.0 118.0 118.5 118.380 117.4 117.6 117.5 117.4 118.0 117.790 117.0 117.1 117.1 117.0 117.6 117.3
100 116.6 116.8 116.7 116.6 117.2 116.9110 116.3 116.4 116.4 116.3 116.9 116.6119 116.1 116.2 116.2 116.1 116.6 116.4120 116.0 116.6 116.3130 115.8 116.3 116.1140 115.6 116.1 115.9150 115.4 115.9 115.7160 115.2 115.7 115.5170 115.0 115.5 115.3180 114.9 115.4 115.2190 114.7 115.2 115.0192 114.7 115.2 115.0Gmb 2.244 2.247 2.245 2.277 2.272 2.274Gmm
Gravel 12.5 mm NMAS, Fine-Graded, PG 76-22, Ndesign = 119Height Data, mm
Ndesign = 119 Nmaximum = 192
2.334
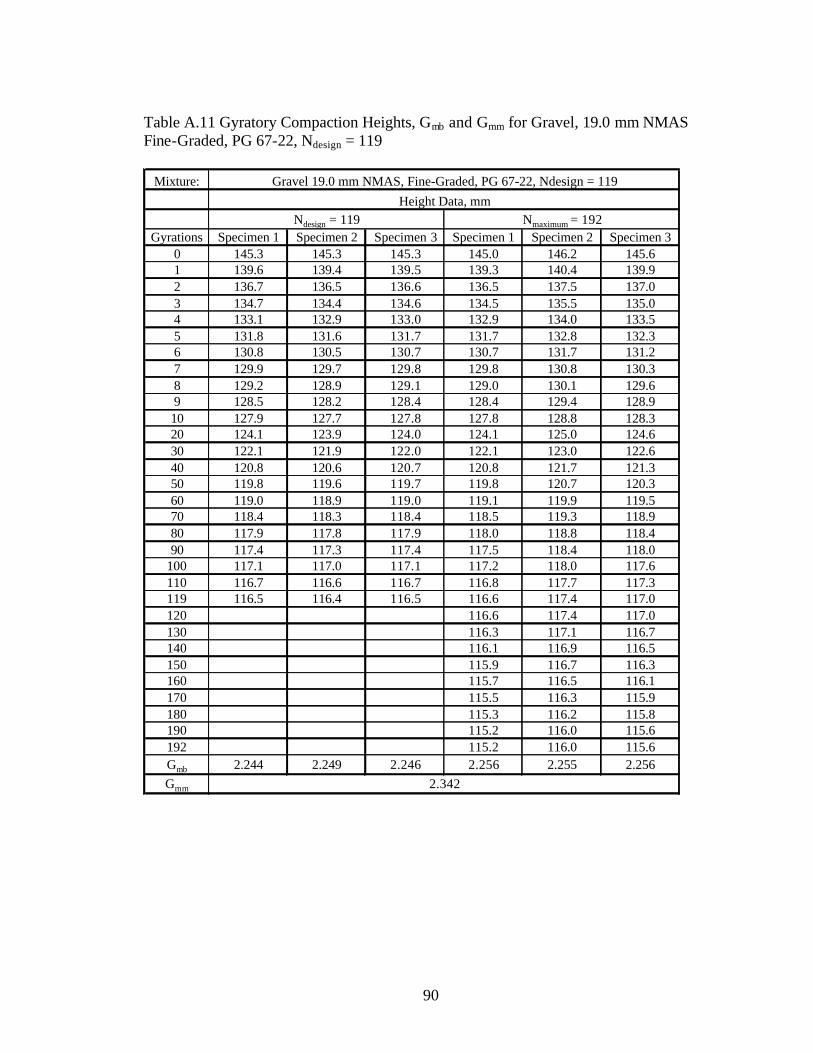
90
Table A.11 Gyratory Compaction Heights, Gmb and Gmm for Gravel, 19.0 mm NMAS Fine-Graded, PG 67-22, Ndesign = 119
Mixture:
Gyrations Specimen 1 Specimen 2 Specimen 3 Specimen 1 Specimen 2 Specimen 30 145.3 145.3 145.3 145.0 146.2 145.61 139.6 139.4 139.5 139.3 140.4 139.92 136.7 136.5 136.6 136.5 137.5 137.03 134.7 134.4 134.6 134.5 135.5 135.04 133.1 132.9 133.0 132.9 134.0 133.55 131.8 131.6 131.7 131.7 132.8 132.36 130.8 130.5 130.7 130.7 131.7 131.27 129.9 129.7 129.8 129.8 130.8 130.38 129.2 128.9 129.1 129.0 130.1 129.69 128.5 128.2 128.4 128.4 129.4 128.910 127.9 127.7 127.8 127.8 128.8 128.320 124.1 123.9 124.0 124.1 125.0 124.630 122.1 121.9 122.0 122.1 123.0 122.640 120.8 120.6 120.7 120.8 121.7 121.350 119.8 119.6 119.7 119.8 120.7 120.360 119.0 118.9 119.0 119.1 119.9 119.570 118.4 118.3 118.4 118.5 119.3 118.980 117.9 117.8 117.9 118.0 118.8 118.490 117.4 117.3 117.4 117.5 118.4 118.0
100 117.1 117.0 117.1 117.2 118.0 117.6110 116.7 116.6 116.7 116.8 117.7 117.3119 116.5 116.4 116.5 116.6 117.4 117.0120 116.6 117.4 117.0130 116.3 117.1 116.7140 116.1 116.9 116.5150 115.9 116.7 116.3160 115.7 116.5 116.1170 115.5 116.3 115.9180 115.3 116.2 115.8190 115.2 116.0 115.6192 115.2 116.0 115.6Gmb 2.244 2.249 2.246 2.256 2.255 2.256Gmm
Gravel 19.0 mm NMAS, Fine-Graded, PG 67-22, Ndesign = 119Height Data, mm
Ndesign = 119 Nmaximum = 192
2.342

91
Table A.12 Gyratory Compaction Heights, Gmb and Gmm for Gravel, 19.0 mm NMAS Fine-Graded, PG 76-22, Ndesign = 119
Mixture:
Gyrations Specimen 1 Specimen 2 Specimen 3 Specimen 1 Specimen 2 Specimen 30 146.6 145.8 146.2 144.6 145.4 145.01 140.9 140.0 140.5 138.8 139.5 139.22 138.0 137.1 137.6 136.0 136.6 136.33 136.0 135.1 135.6 134.0 134.5 134.34 134.4 133.5 134.0 132.4 133.0 132.75 133.1 132.3 132.7 131.2 131.8 131.56 132.1 131.3 131.7 130.2 130.8 130.57 131.2 130.4 130.8 129.3 130.0 129.78 130.5 129.6 130.1 128.6 129.2 128.99 129.8 129.0 129.4 127.9 128.6 128.310 129.2 128.4 128.8 127.4 128.0 127.720 125.5 124.6 125.1 123.7 124.4 124.130 123.5 122.6 123.1 121.8 122.4 122.140 122.2 121.2 121.7 120.5 121.2 120.950 121.2 120.3 120.8 119.6 120.2 119.960 120.5 119.5 120.0 118.8 119.5 119.270 119.9 118.9 119.4 118.3 118.9 118.680 119.4 118.4 118.9 117.8 118.4 118.190 119.0 118.0 118.5 117.4 118.0 117.7
100 118.6 117.6 118.1 117.0 117.7 117.4110 118.3 117.3 117.8 116.7 117.3 117.0119 118.0 117.1 117.6 116.5 117.1 116.8120 116.5 117.1 116.8130 116.2 116.8 116.5140 116.0 116.6 116.3150 115.8 116.4 116.1160 115.7 116.2 116.0170 115.5 116.1 115.8180 115.4 115.9 115.7190 115.3 115.8 115.6192 115.3 115.8 115.6Gmb 2.232 2.237 2.234 2.265 2.261 2.263Gmm
Gravel 19.0 mm NMAS, Fine-Graded, PG 76-22, Ndesign = 119Height Data, mm
Ndesign = 119 Nmaximum = 192
2.326

92
Table A.13 Gyratory Compaction Heights, Gmb and Gmm for Gravel, 12.5 mm NMAS Coarse-Graded, PG 67-22, Ndesign = 119
Mixture:
Gyrations Specimen 1 Specimen 2 Specimen 3 Specimen 1 Specimen 2 Specimen 30 145.3 147.1 144.9 145.9 145.6 146.01 139.5 141.2 139.2 140.2 139.8 140.22 136.6 138.3 136.2 137.3 136.9 137.13 134.4 136.0 134.1 135.2 134.8 134.94 132.8 134.3 132.5 133.6 133.2 133.35 131.4 133.0 131.2 132.3 131.9 131.96 130.3 131.8 130.1 131.2 130.8 130.87 129.3 130.9 129.2 130.2 129.9 129.98 128.5 130.0 128.3 129.4 129.0 129.09 127.8 129.3 127.6 128.7 128.3 128.310 127.1 128.6 127.0 128.1 127.7 127.620 122.9 124.4 122.9 123.9 123.6 123.530 120.7 122.1 120.7 121.6 121.4 121.340 119.2 120.6 119.2 120.1 120.0 119.850 118.1 119.5 118.2 119.0 119.0 118.860 117.3 118.7 117.4 118.2 118.2 117.970 116.6 118.0 116.7 117.5 117.5 117.380 116.1 117.5 116.1 116.9 117.0 116.790 115.6 117.0 115.7 116.4 116.5 116.3
100 115.2 116.6 115.3 116.0 116.1 115.9110 114.9 116.3 115.0 115.7 115.8 115.5119 114.6 116.0 114.7 115.4 115.5 115.2120 115.4 115.5 115.2130 115.1 115.2 114.9140 114.9 115.0 114.7150 114.6 114.7 114.5160 114.4 114.5 114.3170 114.3 114.3 114.1180 114.1 114.2 114.0190 113.9 114.0 113.8192 113.9 114.0 113.8Gmb 2.210 2.207 2.209 2.225 2.227 2.226Gmm
Gravel 12.5 mm NMAS, Coarse-Graded, PG 67-22, Ndesign = 119Height Data, mm
Ndesign = 119 Nmaximum = 192
2.299

93
Table A.14 Gyratory Compaction Heights, Gmb and Gmm for Gravel, 12.5 mm NMAS Coarse-Graded, PG 76-22, Ndesign = 119
Mixture:
Gyrations Specimen 1 Specimen 2 Specimen 3 Specimen 1 Specimen 2 Specimen 30 148.1 146.6 147.4 146.9 145.6 146.31 142.3 140.8 141.6 140.9 139.9 140.42 139.3 137.8 138.6 137.8 137.0 137.43 137.1 135.6 136.4 135.7 135.0 135.44 135.5 134.1 134.8 134.0 133.4 133.75 134.2 132.8 133.5 132.7 132.1 132.46 133.0 131.7 132.4 131.6 131.1 131.47 132.0 130.7 131.4 130.7 130.2 130.58 131.2 129.9 130.6 129.9 129.4 129.79 130.5 129.2 129.9 129.2 128.7 129.010 129.9 128.6 129.3 128.5 128.1 128.320 125.7 124.5 125.1 124.5 124.0 124.330 123.5 122.4 123.0 122.3 121.8 122.140 122.1 120.9 121.5 120.9 120.3 120.650 121.0 119.8 120.4 119.8 119.3 119.660 120.2 119.0 119.6 119.0 118.5 118.870 119.6 118.4 119.0 118.4 117.8 118.180 119.1 117.8 118.5 117.8 117.3 117.690 118.6 117.4 118.0 117.4 116.8 117.1100 118.2 117.0 117.6 117.0 116.4 116.7110 117.9 116.7 117.3 116.7 116.1 116.4119 117.6 116.4 117.0 116.4 115.8 116.1120 116.4 115.8 116.1130 116.1 115.5 115.8140 115.9 115.3 115.6150 115.6 115.1 115.4160 115.4 114.9 115.2170 115.3 114.7 115.0180 115.1 114.6 114.9190 114.9 114.4 114.7192 114.9 114.4 114.7Gmb 2.178 2.186 2.182 2.214 2.208 2.211Gmm
Gravel 12.5 mm NMAS, Coarse-Graded, PG 76-22, Ndesign = 119
Height Data, mmNdesign = 119 Nmaximum = 192
2.275
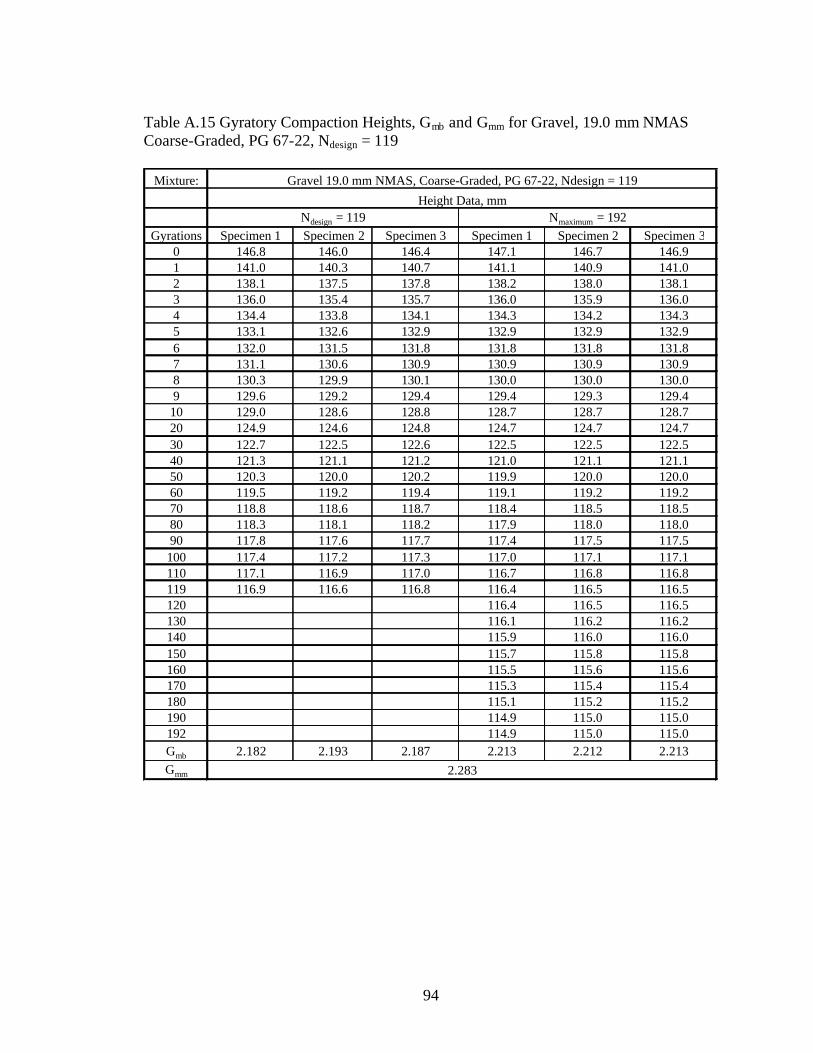
94
Table A.15 Gyratory Compaction Heights, Gmb and Gmm for Gravel, 19.0 mm NMAS Coarse-Graded, PG 67-22, Ndesign = 119
Mixture:
Gyrations Specimen 1 Specimen 2 Specimen 3 Specimen 1 Specimen 2 Specimen 30 146.8 146.0 146.4 147.1 146.7 146.91 141.0 140.3 140.7 141.1 140.9 141.02 138.1 137.5 137.8 138.2 138.0 138.13 136.0 135.4 135.7 136.0 135.9 136.04 134.4 133.8 134.1 134.3 134.2 134.35 133.1 132.6 132.9 132.9 132.9 132.96 132.0 131.5 131.8 131.8 131.8 131.87 131.1 130.6 130.9 130.9 130.9 130.98 130.3 129.9 130.1 130.0 130.0 130.09 129.6 129.2 129.4 129.4 129.3 129.410 129.0 128.6 128.8 128.7 128.7 128.720 124.9 124.6 124.8 124.7 124.7 124.730 122.7 122.5 122.6 122.5 122.5 122.540 121.3 121.1 121.2 121.0 121.1 121.150 120.3 120.0 120.2 119.9 120.0 120.060 119.5 119.2 119.4 119.1 119.2 119.270 118.8 118.6 118.7 118.4 118.5 118.580 118.3 118.1 118.2 117.9 118.0 118.090 117.8 117.6 117.7 117.4 117.5 117.5100 117.4 117.2 117.3 117.0 117.1 117.1110 117.1 116.9 117.0 116.7 116.8 116.8119 116.9 116.6 116.8 116.4 116.5 116.5120 116.4 116.5 116.5130 116.1 116.2 116.2140 115.9 116.0 116.0150 115.7 115.8 115.8160 115.5 115.6 115.6170 115.3 115.4 115.4180 115.1 115.2 115.2190 114.9 115.0 115.0192 114.9 115.0 115.0Gmb 2.182 2.193 2.187 2.213 2.212 2.213Gmm
Gravel 19.0 mm NMAS, Coarse-Graded, PG 67-22, Ndesign = 119
Height Data, mmNdesign = 119 Nmaximum = 192
2.283

95
Table A.16 Gyratory Compaction Heights, Gmb and Gmm for Gravel, 19.0 mm NMAS Coarse-Graded, PG 76-22, Ndesign = 119
Mixture:
Gyrations Specimen 1 Specimen 2 Specimen 3 Specimen 1 Specimen 2 Specimen 30 146.8 144.8 145.8 145.4 146.8 146.11 140.7 139.1 139.9 139.7 140.8 140.32 137.8 136.2 137.0 136.6 137.9 137.33 135.6 134.2 134.9 134.5 135.8 135.24 134.0 132.6 133.3 133.0 134.2 133.65 132.8 131.4 132.1 131.6 132.9 132.36 131.7 130.3 131.0 130.6 131.8 131.27 130.8 129.4 130.1 129.7 130.8 130.38 130.0 128.6 129.3 128.9 130.0 129.59 129.3 127.9 128.6 128.2 129.3 128.810 128.7 127.3 128.0 127.6 128.7 128.220 124.7 123.4 124.1 123.6 124.7 124.230 122.5 121.3 121.9 121.5 122.6 122.140 121.1 119.9 120.5 120.1 121.1 120.650 120.0 118.9 119.5 119.1 120.1 119.660 119.2 118.1 118.7 118.3 119.3 118.870 118.6 117.4 118.0 117.7 118.7 118.280 118.1 116.9 117.5 117.2 118.1 117.790 117.6 116.5 117.1 116.7 117.6 117.2
100 117.2 116.1 116.7 116.3 117.2 116.8110 116.9 115.8 116.4 116.0 116.9 116.5119 116.6 115.5 116.1 115.7 116.6 116.2120 115.7 116.6 116.2130 115.5 116.3 115.9140 115.2 116.1 115.7150 115.0 115.9 115.5160 114.8 115.7 115.3170 114.7 115.5 115.1180 114.5 115.4 115.0190 114.4 115.2 114.8192 114.3 115.2 114.8Gmb 2.180 2.188 2.184 2.216 2.212 2.214Gmm
Gravel 19.0 mm NMAS, Coarse-Graded, PG 76-22, Ndesign = 119Height Data, mm
Ndesign = 119 Nmaximum = 192
2.279
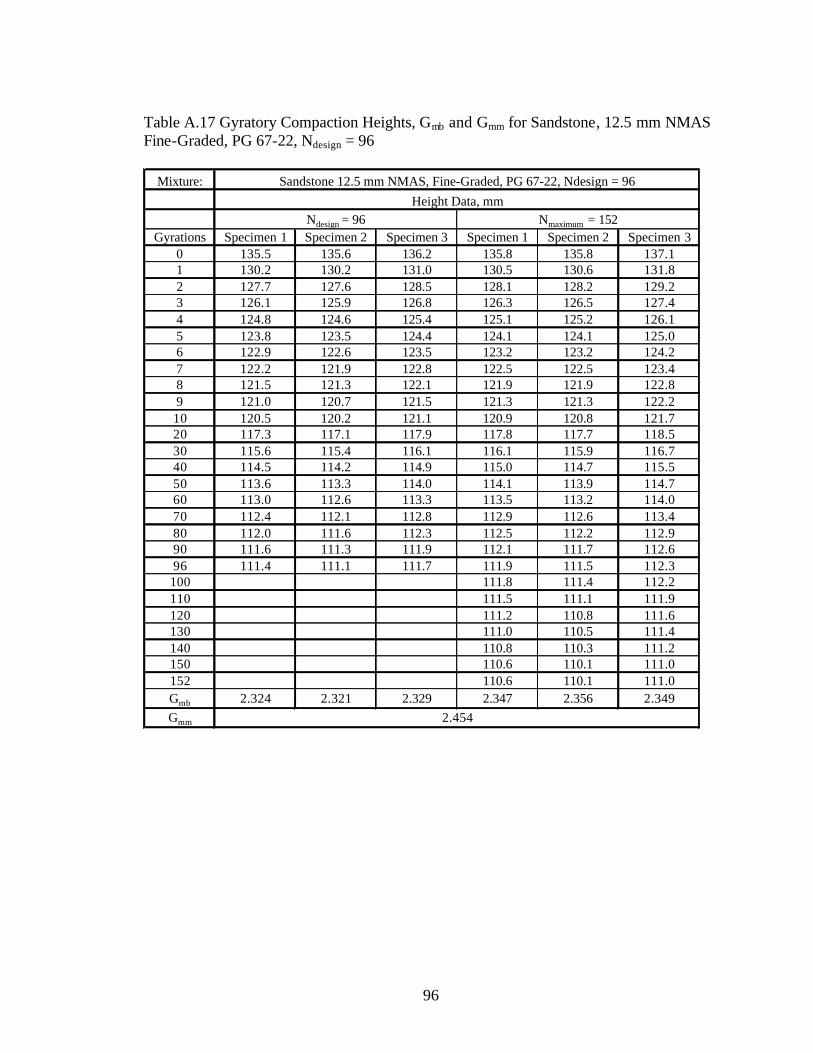
96
Table A.17 Gyratory Compaction Heights, Gmb and Gmm for Sandstone, 12.5 mm NMAS Fine-Graded, PG 67-22, Ndesign = 96
Mixture:
Gyrations Specimen 1 Specimen 2 Specimen 3 Specimen 1 Specimen 2 Specimen 30 135.5 135.6 136.2 135.8 135.8 137.11 130.2 130.2 131.0 130.5 130.6 131.82 127.7 127.6 128.5 128.1 128.2 129.23 126.1 125.9 126.8 126.3 126.5 127.44 124.8 124.6 125.4 125.1 125.2 126.15 123.8 123.5 124.4 124.1 124.1 125.06 122.9 122.6 123.5 123.2 123.2 124.27 122.2 121.9 122.8 122.5 122.5 123.48 121.5 121.3 122.1 121.9 121.9 122.89 121.0 120.7 121.5 121.3 121.3 122.210 120.5 120.2 121.1 120.9 120.8 121.720 117.3 117.1 117.9 117.8 117.7 118.530 115.6 115.4 116.1 116.1 115.9 116.740 114.5 114.2 114.9 115.0 114.7 115.550 113.6 113.3 114.0 114.1 113.9 114.760 113.0 112.6 113.3 113.5 113.2 114.070 112.4 112.1 112.8 112.9 112.6 113.480 112.0 111.6 112.3 112.5 112.2 112.990 111.6 111.3 111.9 112.1 111.7 112.696 111.4 111.1 111.7 111.9 111.5 112.3100 111.8 111.4 112.2110 111.5 111.1 111.9120 111.2 110.8 111.6130 111.0 110.5 111.4140 110.8 110.3 111.2150 110.6 110.1 111.0152 110.6 110.1 111.0Gmb 2.324 2.321 2.329 2.347 2.356 2.349Gmm
Ndesign = 96 Nmaximum = 152
Sandstone 12.5 mm NMAS, Fine-Graded, PG 67-22, Ndesign = 96Height Data, mm
2.454

97
Table A.18 Gyratory Compaction Heights, Gmb and Gmm for Sandstone, 12.5 mm NMAS Fine-Graded, PG 76-22, Ndesign = 96
Mixture:
Gyrations Specimen 1 Specimen 2 Specimen 3 Specimen 1 Specimen 2 Specimen 30 133.8 134.3 138.7 134.1 135.2 136.51 128.4 129.0 133.3 128.9 129.9 131.12 126.0 126.5 130.8 126.5 127.6 128.53 124.3 124.7 129.0 124.8 125.8 126.84 123.1 123.4 127.7 123.5 124.6 125.45 122.0 122.3 126.6 122.4 123.5 124.46 121.2 121.4 125.7 121.6 122.7 123.57 120.5 120.7 124.9 120.8 122.0 122.78 119.8 120.1 124.3 120.2 121.3 122.19 119.3 119.5 123.7 119.7 120.8 121.510 118.8 119.0 123.2 119.2 120.3 121.020 115.7 115.8 119.9 116.0 117.2 117.730 114.0 114.1 118.2 114.3 115.4 116.040 112.8 112.9 117.0 113.2 114.3 114.850 112.0 112.0 116.2 112.4 113.5 113.960 111.4 111.4 115.6 111.8 112.9 113.270 111.0 110.9 115.1 111.3 112.3 112.780 110.6 110.5 114.7 110.8 111.9 112.390 110.2 110.1 114.4 110.5 111.6 111.996 110.0 110.0 114.2 110.3 111.4 111.7
100 110.2 111.3 111.6110 109.9 111.0 111.3120 109.7 110.8 111.1130 109.4 110.5 110.9140 109.3 110.4 110.7150 109.1 110.2 110.5152 109.1 110.1 110.5Gmb 2.347 2.338 2.346 2.349 2.365 2.352Gmm
Sandstone12.5 mm NMAS, Fine-Graded, PG 76-22, Ndesign = 96Height Data, mm
Ndesign = 96 Nmaximum = 152
2.440
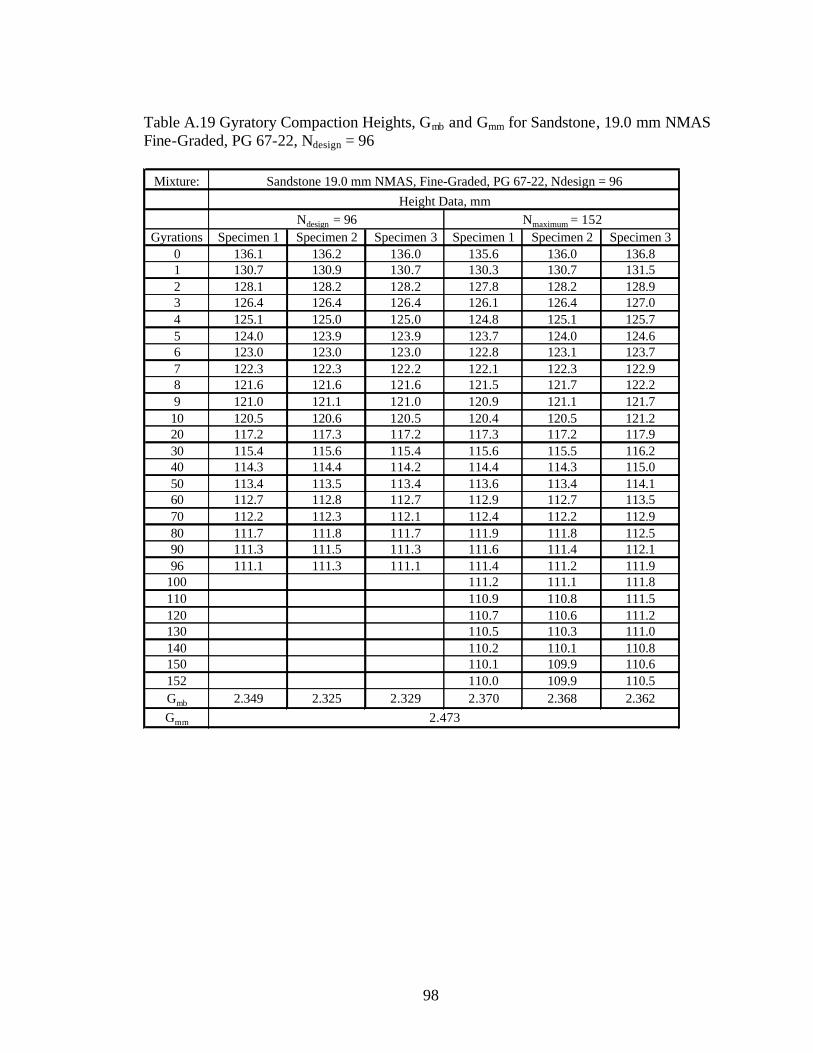
98
Table A.19 Gyratory Compaction Heights, Gmb and Gmm for Sandstone, 19.0 mm NMAS Fine-Graded, PG 67-22, Ndesign = 96
Mixture:
Gyrations Specimen 1 Specimen 2 Specimen 3 Specimen 1 Specimen 2 Specimen 30 136.1 136.2 136.0 135.6 136.0 136.81 130.7 130.9 130.7 130.3 130.7 131.52 128.1 128.2 128.2 127.8 128.2 128.93 126.4 126.4 126.4 126.1 126.4 127.04 125.1 125.0 125.0 124.8 125.1 125.75 124.0 123.9 123.9 123.7 124.0 124.66 123.0 123.0 123.0 122.8 123.1 123.77 122.3 122.3 122.2 122.1 122.3 122.98 121.6 121.6 121.6 121.5 121.7 122.29 121.0 121.1 121.0 120.9 121.1 121.710 120.5 120.6 120.5 120.4 120.5 121.220 117.2 117.3 117.2 117.3 117.2 117.930 115.4 115.6 115.4 115.6 115.5 116.240 114.3 114.4 114.2 114.4 114.3 115.050 113.4 113.5 113.4 113.6 113.4 114.160 112.7 112.8 112.7 112.9 112.7 113.570 112.2 112.3 112.1 112.4 112.2 112.980 111.7 111.8 111.7 111.9 111.8 112.590 111.3 111.5 111.3 111.6 111.4 112.196 111.1 111.3 111.1 111.4 111.2 111.9
100 111.2 111.1 111.8110 110.9 110.8 111.5120 110.7 110.6 111.2130 110.5 110.3 111.0140 110.2 110.1 110.8150 110.1 109.9 110.6152 110.0 109.9 110.5Gmb 2.349 2.325 2.329 2.370 2.368 2.362Gmm
Sandstone 19.0 mm NMAS, Fine-Graded, PG 67-22, Ndesign = 96Height Data, mm
Ndesign = 96 Nmaximum = 152
2.473
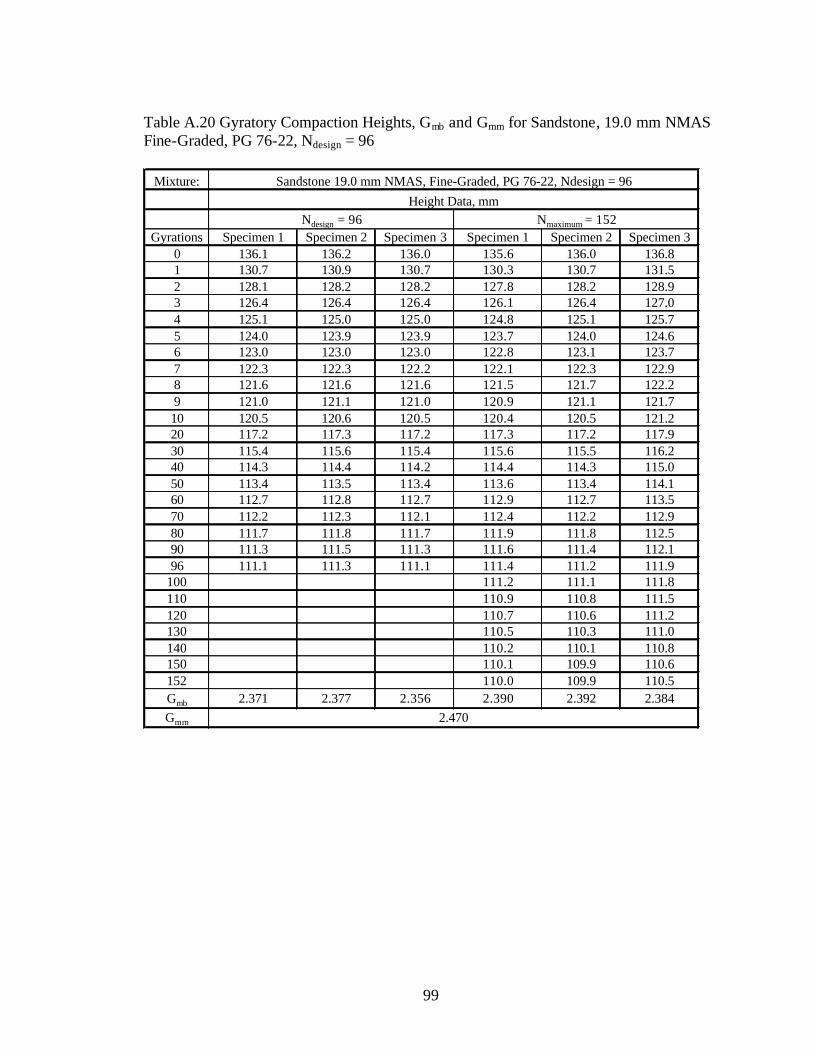
99
Table A.20 Gyratory Compaction Heights, Gmb and Gmm for Sandstone, 19.0 mm NMAS Fine-Graded, PG 76-22, Ndesign = 96
Mixture:
Gyrations Specimen 1 Specimen 2 Specimen 3 Specimen 1 Specimen 2 Specimen 30 136.1 136.2 136.0 135.6 136.0 136.81 130.7 130.9 130.7 130.3 130.7 131.52 128.1 128.2 128.2 127.8 128.2 128.93 126.4 126.4 126.4 126.1 126.4 127.04 125.1 125.0 125.0 124.8 125.1 125.75 124.0 123.9 123.9 123.7 124.0 124.66 123.0 123.0 123.0 122.8 123.1 123.77 122.3 122.3 122.2 122.1 122.3 122.98 121.6 121.6 121.6 121.5 121.7 122.29 121.0 121.1 121.0 120.9 121.1 121.710 120.5 120.6 120.5 120.4 120.5 121.220 117.2 117.3 117.2 117.3 117.2 117.930 115.4 115.6 115.4 115.6 115.5 116.240 114.3 114.4 114.2 114.4 114.3 115.050 113.4 113.5 113.4 113.6 113.4 114.160 112.7 112.8 112.7 112.9 112.7 113.570 112.2 112.3 112.1 112.4 112.2 112.980 111.7 111.8 111.7 111.9 111.8 112.590 111.3 111.5 111.3 111.6 111.4 112.196 111.1 111.3 111.1 111.4 111.2 111.9
100 111.2 111.1 111.8110 110.9 110.8 111.5120 110.7 110.6 111.2130 110.5 110.3 111.0140 110.2 110.1 110.8150 110.1 109.9 110.6152 110.0 109.9 110.5Gmb 2.371 2.377 2.356 2.390 2.392 2.384Gmm
Sandstone 19.0 mm NMAS, Fine-Graded, PG 76-22, Ndesign = 96Height Data, mm
Ndesign = 96 Nmaximum = 152
2.470

100
Table A.21 Gyratory Compaction Heights, Gmb and Gmm for Sandstone, 12.5 mm NMAS Coarse-Graded, PG 67-22, Ndesign = 96
Mixture:
Gyrations Specimen 1 Specimen 2 Specimen 3 Specimen 1 Specimen 2 Specimen 30 141.3 141.6 135.6 142.4 142.6 141.41 135.6 135.7 133.1 136.8 137.0 135.82 132.6 132.8 131.2 133.9 133.9 132.83 130.5 130.7 129.7 132.0 131.8 130.74 128.9 129.0 128.5 130.4 130.3 129.15 127.5 127.7 127.5 129.1 129.0 127.86 126.4 126.6 126.6 128.0 127.9 126.77 125.4 125.6 125.9 127.1 126.9 125.88 124.6 124.8 125.1 126.3 126.1 125.09 123.9 124.0 124.5 125.6 125.3 124.210 123.2 123.4 124.0 124.9 124.7 123.620 118.8 119.1 120.1 120.8 120.3 119.430 116.4 116.6 117.8 118.4 117.9 117.140 114.8 115.0 116.2 116.8 116.2 115.550 113.6 113.8 115.0 115.6 115.0 114.360 112.6 112.9 114.1 114.6 114.0 113.370 111.8 112.2 113.4 113.9 113.2 112.580 111.2 111.6 112.8 113.2 112.5 111.990 110.6 111.0 112.2 112.7 111.9 111.396 110.4 110.8 112.0 112.4 111.6 111.0
100 112.2 111.4 110.8110 111.8 111.0 110.4120 111.4 110.6 110.0130 111.1 110.3 109.7140 110.8 110.0 109.4150 110.5 109.7 109.1152 110.5 109.7 109.1Gmb 2.357 2.347 2.341 2.368 2.377 2.375Gmm
Sandstone 12.5 mm NMAS, Coarse-Graded, PG 67-22, Ndesign = 96Height Data, mm
Ndesign = 96 Nmaximum = 152
2.430

101
Table A.22 Gyratory Compaction Heights, Gmb and Gmm for Sandstone, 12.5 mm NMAS Coarse-Graded, PG 76-22, Ndesign = 96
Mixture:
Gyrations Specimen 1 Specimen 2 Specimen 3 Specimen 1 Specimen 2 Specimen 30 140.1 140.4 137.8 144.3 141.1 140.81 134.4 134.8 132.2 138.7 135.6 135.12 131.6 132.1 129.5 135.9 132.9 132.33 129.7 130.1 127.6 133.9 131.0 130.34 128.2 128.7 126.1 132.4 129.5 128.85 127.0 127.4 124.9 131.2 128.3 127.66 126.0 126.4 123.9 130.2 127.4 126.67 125.2 125.5 123.0 129.3 126.5 125.78 124.4 124.8 122.3 128.5 125.8 124.99 123.8 124.1 121.6 127.8 125.1 124.210 123.2 123.5 121.0 127.2 124.5 123.620 119.3 119.5 117.1 123.1 120.6 119.630 117.1 117.3 114.9 120.8 118.4 117.440 115.6 115.7 113.4 119.2 117.0 115.950 114.5 114.6 112.3 118.0 115.9 114.860 113.7 113.7 111.4 117.1 115.0 113.970 113.0 113.0 110.7 116.4 114.3 113.380 112.4 112.4 110.1 115.8 113.7 112.790 111.9 111.9 109.6 115.2 113.2 112.296 111.7 111.6 109.3 114.9 113.0 112.0100 114.7 112.8 111.8110 114.3 112.4 111.5120 114.0 112.1 111.2130 113.6 111.8 110.9140 113.3 111.5 110.6150 113.1 111.3 110.4152 113.0 111.2 110.4Gmb 2.302 2.303 2.338 2.346 2.328 2.360Gmm
Sandstone 12.5 mm NMAS, Coarse-Graded, PG 76-22, Ndesign = 96
Height Data, mmNdesign = 96 Nmaximum = 152
2.435

102
Table A.23 Gyratory Compaction Heights, Gmb and Gmm for Sandstone, 19.0 mm NMAS Coarse-Graded, PG 67-22, Ndesign = 96
Mixture:
Gyrations Specimen 1 Specimen 2 Specimen 3 Specimen 1 Specimen 2 Specimen 30 140.7 140.1 140.8 141.3 141.0 140.31 135.1 134.5 135.2 135.6 135.4 134.82 132.3 131.7 132.4 132.8 132.6 132.03 130.3 129.8 130.5 130.8 130.6 130.14 128.8 128.3 128.9 129.2 129.0 128.55 127.6 127.0 127.7 127.9 127.8 127.36 126.5 125.9 126.7 126.8 126.7 126.37 125.6 125.1 125.8 125.9 125.8 125.48 124.8 124.3 125.0 125.1 125.1 124.69 124.1 123.6 124.3 124.4 124.4 123.910 123.5 122.9 123.6 123.8 123.8 123.320 119.5 118.9 119.6 119.6 119.8 119.330 117.2 116.6 117.3 117.2 117.5 117.040 115.7 115.1 115.7 115.7 115.9 115.550 114.5 113.9 114.6 114.5 114.8 114.460 113.6 113.0 113.6 113.6 113.9 113.470 112.9 112.3 112.9 112.8 113.1 112.780 112.3 111.7 112.2 112.2 112.5 112.190 111.8 111.2 111.7 111.7 111.9 111.696 111.5 111.0 111.4 111.4 111.7 111.3100 111.2 111.5 111.1110 110.8 111.1 110.7120 110.4 110.7 110.4130 110.1 110.4 110.1140 109.8 110.1 109.8150 109.5 109.8 109.6152 109.5 109.8 109.5Gmb 2.346 2.356 2.350 2.383 2.373 2.367Gmm
Sandstone 19.0 mm NMAS, Coarse-Graded, PG 67-22, Ndesign = 96
Height Data, mmNdesign = 96 Nmaximum = 152
2.440
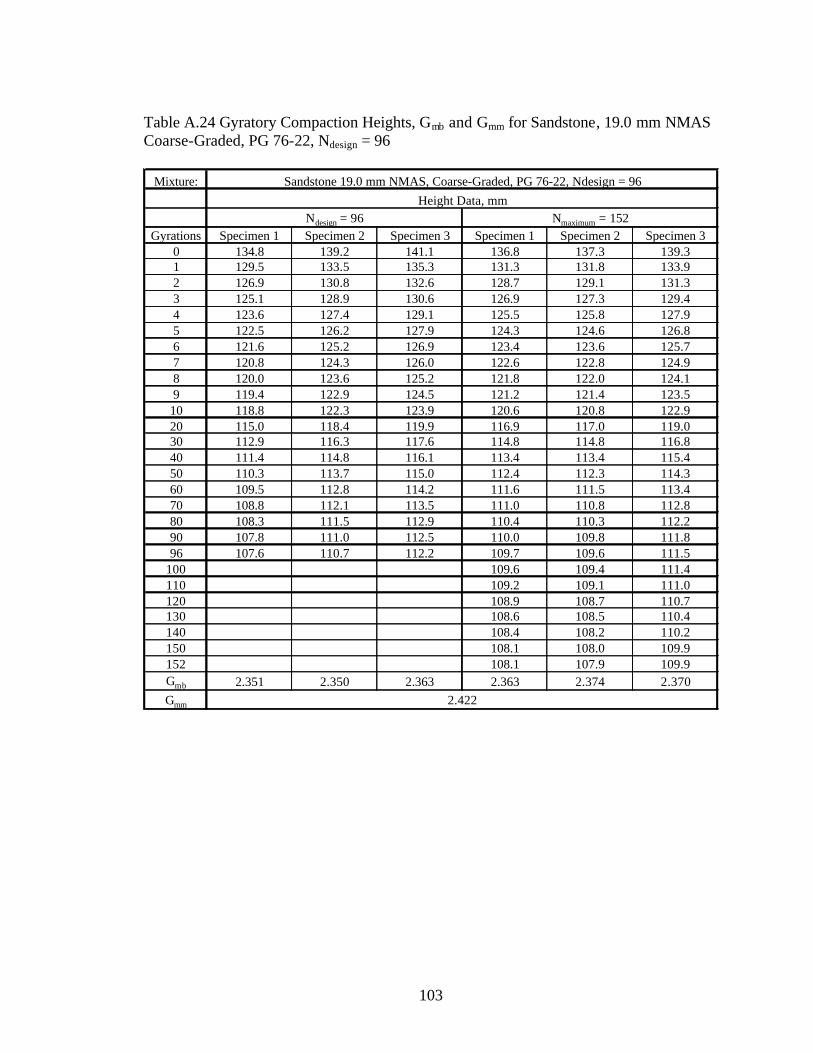
103
Table A.24 Gyratory Compaction Heights, Gmb and Gmm for Sandstone, 19.0 mm NMAS Coarse-Graded, PG 76-22, Ndesign = 96
Mixture:
Gyrations Specimen 1 Specimen 2 Specimen 3 Specimen 1 Specimen 2 Specimen 30 134.8 139.2 141.1 136.8 137.3 139.31 129.5 133.5 135.3 131.3 131.8 133.92 126.9 130.8 132.6 128.7 129.1 131.33 125.1 128.9 130.6 126.9 127.3 129.44 123.6 127.4 129.1 125.5 125.8 127.95 122.5 126.2 127.9 124.3 124.6 126.86 121.6 125.2 126.9 123.4 123.6 125.77 120.8 124.3 126.0 122.6 122.8 124.98 120.0 123.6 125.2 121.8 122.0 124.19 119.4 122.9 124.5 121.2 121.4 123.510 118.8 122.3 123.9 120.6 120.8 122.920 115.0 118.4 119.9 116.9 117.0 119.030 112.9 116.3 117.6 114.8 114.8 116.840 111.4 114.8 116.1 113.4 113.4 115.450 110.3 113.7 115.0 112.4 112.3 114.360 109.5 112.8 114.2 111.6 111.5 113.470 108.8 112.1 113.5 111.0 110.8 112.880 108.3 111.5 112.9 110.4 110.3 112.290 107.8 111.0 112.5 110.0 109.8 111.896 107.6 110.7 112.2 109.7 109.6 111.5
100 109.6 109.4 111.4110 109.2 109.1 111.0120 108.9 108.7 110.7130 108.6 108.5 110.4140 108.4 108.2 110.2150 108.1 108.0 109.9152 108.1 107.9 109.9Gmb 2.351 2.350 2.363 2.363 2.374 2.370Gmm
Sandstone 19.0 mm NMAS, Coarse-Graded, PG 76-22, Ndesign = 96Height Data, mm
Ndesign = 96 Nmaximum = 152
2.422
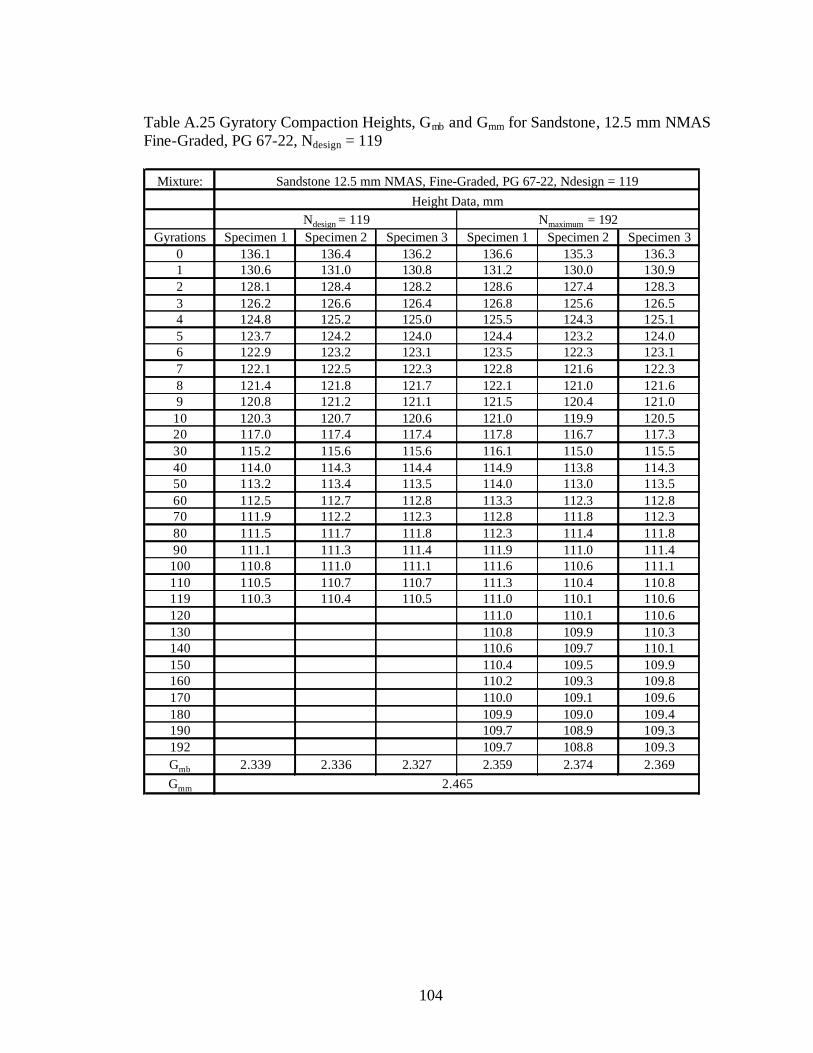
104
Table A.25 Gyratory Compaction Heights, Gmb and Gmm for Sandstone, 12.5 mm NMAS Fine-Graded, PG 67-22, Ndesign = 119
Mixture:
Gyrations Specimen 1 Specimen 2 Specimen 3 Specimen 1 Specimen 2 Specimen 30 136.1 136.4 136.2 136.6 135.3 136.31 130.6 131.0 130.8 131.2 130.0 130.92 128.1 128.4 128.2 128.6 127.4 128.33 126.2 126.6 126.4 126.8 125.6 126.54 124.8 125.2 125.0 125.5 124.3 125.15 123.7 124.2 124.0 124.4 123.2 124.06 122.9 123.2 123.1 123.5 122.3 123.17 122.1 122.5 122.3 122.8 121.6 122.38 121.4 121.8 121.7 122.1 121.0 121.69 120.8 121.2 121.1 121.5 120.4 121.010 120.3 120.7 120.6 121.0 119.9 120.520 117.0 117.4 117.4 117.8 116.7 117.330 115.2 115.6 115.6 116.1 115.0 115.540 114.0 114.3 114.4 114.9 113.8 114.350 113.2 113.4 113.5 114.0 113.0 113.560 112.5 112.7 112.8 113.3 112.3 112.870 111.9 112.2 112.3 112.8 111.8 112.380 111.5 111.7 111.8 112.3 111.4 111.890 111.1 111.3 111.4 111.9 111.0 111.4100 110.8 111.0 111.1 111.6 110.6 111.1110 110.5 110.7 110.7 111.3 110.4 110.8119 110.3 110.4 110.5 111.0 110.1 110.6120 111.0 110.1 110.6130 110.8 109.9 110.3140 110.6 109.7 110.1150 110.4 109.5 109.9160 110.2 109.3 109.8170 110.0 109.1 109.6180 109.9 109.0 109.4190 109.7 108.9 109.3192 109.7 108.8 109.3Gmb 2.339 2.336 2.327 2.359 2.374 2.369Gmm
Ndesign = 119 Nmaximum = 192
Sandstone 12.5 mm NMAS, Fine-Graded, PG 67-22, Ndesign = 119Height Data, mm
2.465

105
Table A.26 Gyratory Compaction Heights, Gmb and Gmm for Sandstone, 12.5 mm NMAS Fine-Graded, PG 76-22, Ndesign = 119
Mixture:
Gyrations Specimen 1 Specimen 2 Specimen 3 Specimen 1 Specimen 2 Specimen 30 135.1 135.6 137.1 135.6 135.5 135.51 129.9 130.3 131.8 130.5 130.4 130.32 127.5 127.8 129.4 128.1 127.9 127.83 125.7 126.1 127.7 126.4 126.2 126.14 124.4 124.7 126.4 125.2 124.9 124.85 123.4 123.7 125.4 124.2 123.9 123.86 122.6 122.8 124.5 123.3 123.0 123.07 121.8 122.1 123.8 122.6 122.3 122.28 121.2 121.5 123.1 122.0 121.7 121.69 120.7 120.9 122.6 121.5 121.2 121.110 120.2 120.4 122.1 121.0 120.7 120.620 117.1 117.2 118.9 118.0 117.6 117.530 115.3 115.5 117.2 116.3 115.9 115.740 114.2 114.3 116.0 115.2 114.8 114.650 113.4 113.5 115.2 114.4 114.0 113.860 112.7 112.8 114.5 113.8 113.4 113.170 112.2 112.3 114.0 113.2 113.0 112.680 111.8 111.9 113.5 112.8 112.6 112.290 111.4 111.6 113.2 112.5 112.2 111.8
100 111.1 111.3 112.8 112.2 111.9 111.5110 110.8 111.0 112.6 111.9 111.7 111.2119 110.6 110.8 112.4 111.7 111.5 111.0120 111.7 111.5 111.0130 111.5 111.3 110.8140 111.3 111.1 110.6150 111.1 110.9 110.4160 110.9 110.8 110.2170 110.8 110.7 110.1180 110.7 110.5 110.0190 110.5 110.4 109.8192 110.5 110.4 109.8Gmb 2.348 2.334 2.343 2.360 2.374 2.362Gmm 2.465
Sandstone 12.5 mm NMAS, Fine-Graded, PG 76-22, Ndesign = 119Height Data, mm
Ndesign = 119 Nmaximum = 192

106
Table A.27 Gyratory Compaction Heights, Gmb and Gmm for Sandstone, 19.0 mm NMAS Fine-Graded, PG 67-22, Ndesign = 119
Mixture:
Gyrations Specimen 1 Specimen 2 Specimen 3 Specimen 1 Specimen 2 Specimen 30 135.1 136.2 138.2 137.1 137.5 139.21 129.8 130.9 132.9 131.9 132.1 133.82 127.2 128.4 130.3 129.4 129.6 131.33 125.5 126.7 128.6 127.6 127.8 129.54 124.2 125.4 127.3 126.3 126.5 128.15 123.2 124.4 126.2 125.3 125.4 127.16 122.3 123.6 125.4 124.4 124.5 126.27 121.6 122.9 124.6 123.6 123.8 125.48 121.0 122.3 124.0 123.0 123.1 124.79 120.4 121.7 123.4 122.4 122.5 124.210 119.9 121.2 122.9 121.9 122.0 123.720 116.8 118.1 119.6 118.7 118.7 120.430 115.1 116.4 117.8 116.9 116.9 118.640 114.0 115.3 116.6 115.8 115.7 117.450 113.1 114.4 115.7 114.9 114.8 116.460 112.5 113.7 115.0 114.2 114.1 115.770 111.9 113.2 114.4 113.6 113.5 115.180 111.4 112.7 114.0 113.1 113.0 114.690 111.0 112.3 113.6 112.7 112.6 114.2
100 110.7 111.9 113.2 112.4 112.3 113.9110 110.4 111.6 112.9 112.1 111.9 113.5119 110.1 111.4 112.7 111.8 111.7 113.3120 111.8 111.7 113.3130 111.6 111.4 113.0140 111.3 111.2 112.8150 111.1 111.0 112.6160 111.0 110.8 112.4170 110.8 110.6 112.2180 110.6 110.4 112.1190 110.5 110.3 111.9192 110.4 110.3 111.9Gmb 2.342 2.340 2.333 2.360 2.353 2.346Gmm 2.473
Sandstone 19.0 mm NMAS, Fine-Graded, PG 67-22, Ndesign = 119Height Data, mm
Ndesign = 119 Nmaximum = 192

107
Table A.28 Gyratory Compaction Heights, Gmb and Gmm for Sandstone, 19.0 mm NMAS Fine-Graded, PG 76-22, Ndesign = 119
Mixture:
Gyrations Specimen 1 Specimen 2 Specimen 3 Specimen 1 Specimen 2 Specimen 30 135.1 136.2 138.2 137.1 137.5 139.21 129.8 130.9 132.9 131.9 132.1 133.82 127.2 128.4 130.3 129.4 129.6 131.33 125.5 126.7 128.6 127.6 127.8 129.54 124.2 125.4 127.3 126.3 126.5 128.15 123.2 124.4 126.2 125.3 125.4 127.16 122.3 123.6 125.4 124.4 124.5 126.27 121.6 122.9 124.6 123.6 123.8 125.48 121.0 122.3 124.0 123.0 123.1 124.79 120.4 121.7 123.4 122.4 122.5 124.210 119.9 121.2 122.9 121.9 122.0 123.720 116.8 118.1 119.6 118.7 118.7 120.430 115.1 116.4 117.8 116.9 116.9 118.640 114.0 115.3 116.6 115.8 115.7 117.450 113.1 114.4 115.7 114.9 114.8 116.460 112.5 113.7 115.0 114.2 114.1 115.770 111.9 113.2 114.4 113.6 113.5 115.180 111.4 112.7 114.0 113.1 113.0 114.690 111.0 112.3 113.6 112.7 112.6 114.2
100 110.7 111.9 113.2 112.4 112.3 113.9110 110.4 111.6 112.9 112.1 111.9 113.5119 110.1 111.4 112.7 111.8 111.7 113.3120 111.8 111.7 113.3130 111.6 111.4 113.0140 111.3 111.2 112.8150 111.1 111.0 112.6160 111.0 110.8 112.4170 110.8 110.6 112.2180 110.6 110.4 112.1190 110.5 110.3 111.9192 110.4 110.3 111.9Gmb 2.376 2.385 2.376 2.400 2.389 2.399Gmm 2.473
Sandstone 19.0 mm NMAS, Fine-Graded, PG 76-22, Ndesign = 119Height Data, mm
Ndesign = 119 Nmaximum = 192
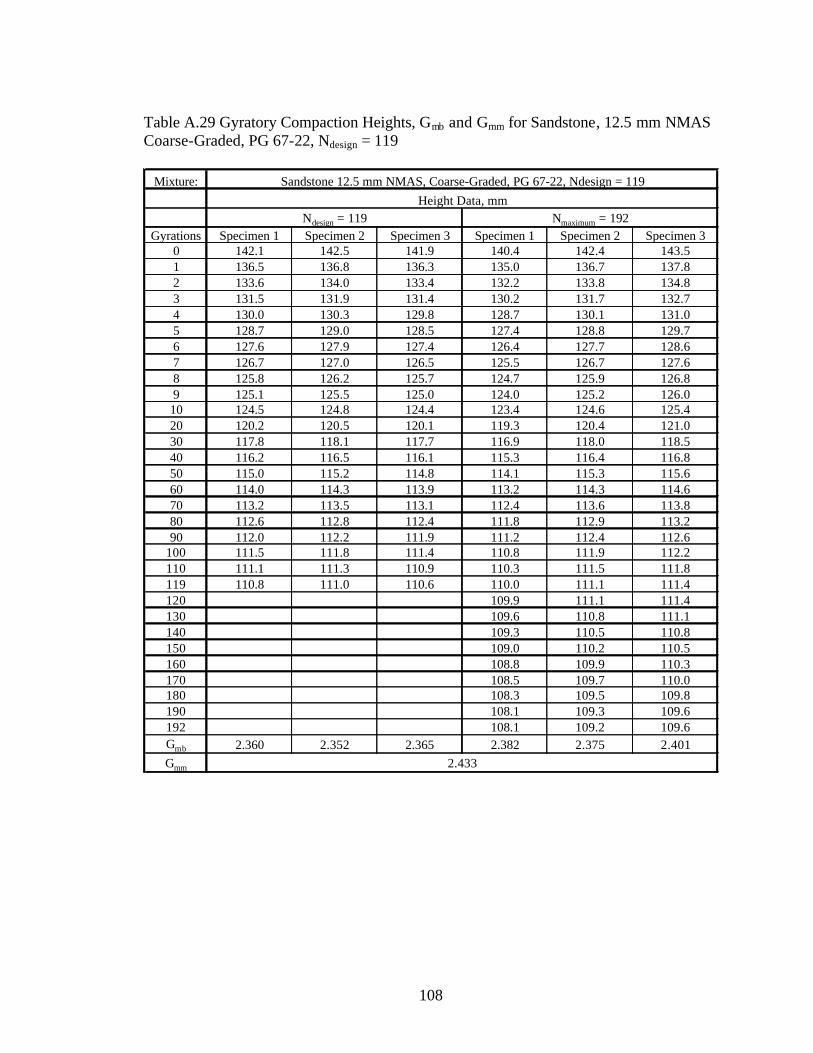
108
Table A.29 Gyratory Compaction Heights, Gmb and Gmm for Sandstone, 12.5 mm NMAS Coarse-Graded, PG 67-22, Ndesign = 119
Mixture:
Gyrations Specimen 1 Specimen 2 Specimen 3 Specimen 1 Specimen 2 Specimen 30 142.1 142.5 141.9 140.4 142.4 143.51 136.5 136.8 136.3 135.0 136.7 137.82 133.6 134.0 133.4 132.2 133.8 134.83 131.5 131.9 131.4 130.2 131.7 132.74 130.0 130.3 129.8 128.7 130.1 131.05 128.7 129.0 128.5 127.4 128.8 129.76 127.6 127.9 127.4 126.4 127.7 128.67 126.7 127.0 126.5 125.5 126.7 127.68 125.8 126.2 125.7 124.7 125.9 126.89 125.1 125.5 125.0 124.0 125.2 126.010 124.5 124.8 124.4 123.4 124.6 125.420 120.2 120.5 120.1 119.3 120.4 121.030 117.8 118.1 117.7 116.9 118.0 118.540 116.2 116.5 116.1 115.3 116.4 116.850 115.0 115.2 114.8 114.1 115.3 115.660 114.0 114.3 113.9 113.2 114.3 114.670 113.2 113.5 113.1 112.4 113.6 113.880 112.6 112.8 112.4 111.8 112.9 113.290 112.0 112.2 111.9 111.2 112.4 112.6
100 111.5 111.8 111.4 110.8 111.9 112.2110 111.1 111.3 110.9 110.3 111.5 111.8119 110.8 111.0 110.6 110.0 111.1 111.4120 109.9 111.1 111.4130 109.6 110.8 111.1140 109.3 110.5 110.8150 109.0 110.2 110.5160 108.8 109.9 110.3170 108.5 109.7 110.0180 108.3 109.5 109.8190 108.1 109.3 109.6192 108.1 109.2 109.6Gmb 2.360 2.352 2.365 2.382 2.375 2.401Gmm 2.433
Sandstone 12.5 mm NMAS, Coarse-Graded, PG 67-22, Ndesign = 119Height Data, mm
Ndesign = 119 Nmaximum = 192
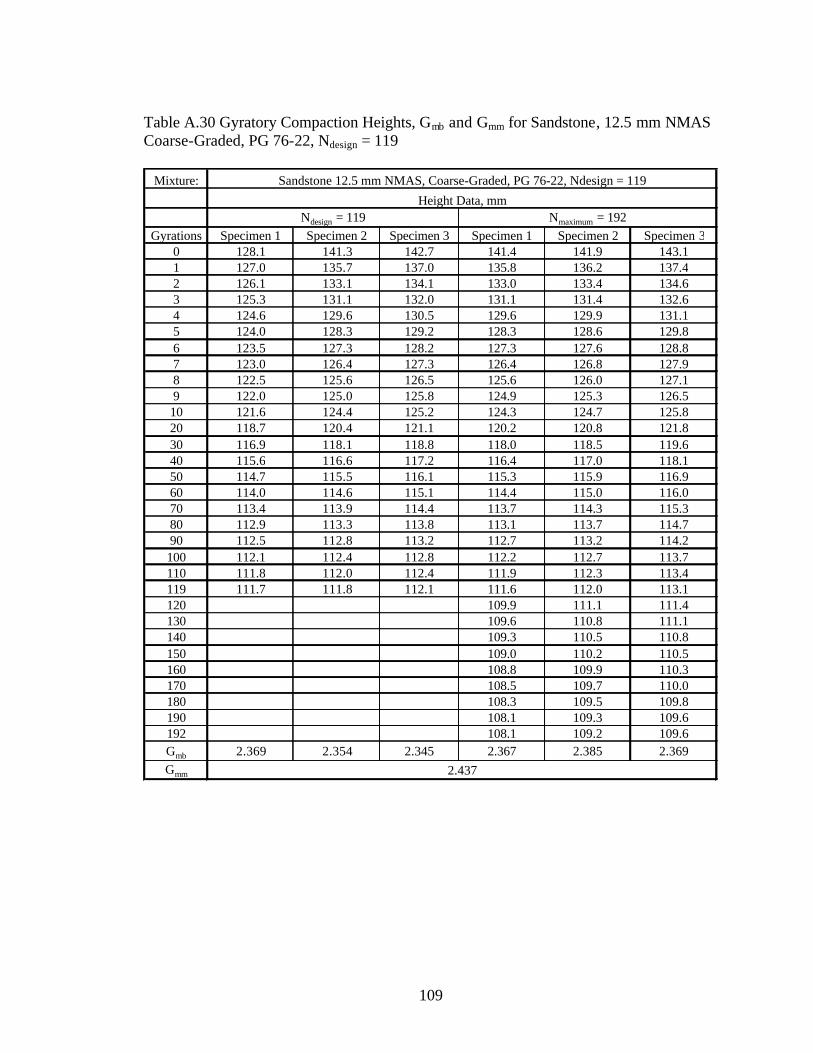
109
Table A.30 Gyratory Compaction Heights, Gmb and Gmm for Sandstone, 12.5 mm NMAS Coarse-Graded, PG 76-22, Ndesign = 119
Mixture:
Gyrations Specimen 1 Specimen 2 Specimen 3 Specimen 1 Specimen 2 Specimen 30 128.1 141.3 142.7 141.4 141.9 143.11 127.0 135.7 137.0 135.8 136.2 137.42 126.1 133.1 134.1 133.0 133.4 134.63 125.3 131.1 132.0 131.1 131.4 132.64 124.6 129.6 130.5 129.6 129.9 131.15 124.0 128.3 129.2 128.3 128.6 129.86 123.5 127.3 128.2 127.3 127.6 128.87 123.0 126.4 127.3 126.4 126.8 127.98 122.5 125.6 126.5 125.6 126.0 127.19 122.0 125.0 125.8 124.9 125.3 126.510 121.6 124.4 125.2 124.3 124.7 125.820 118.7 120.4 121.1 120.2 120.8 121.830 116.9 118.1 118.8 118.0 118.5 119.640 115.6 116.6 117.2 116.4 117.0 118.150 114.7 115.5 116.1 115.3 115.9 116.960 114.0 114.6 115.1 114.4 115.0 116.070 113.4 113.9 114.4 113.7 114.3 115.380 112.9 113.3 113.8 113.1 113.7 114.790 112.5 112.8 113.2 112.7 113.2 114.2100 112.1 112.4 112.8 112.2 112.7 113.7110 111.8 112.0 112.4 111.9 112.3 113.4119 111.7 111.8 112.1 111.6 112.0 113.1120 109.9 111.1 111.4130 109.6 110.8 111.1140 109.3 110.5 110.8150 109.0 110.2 110.5160 108.8 109.9 110.3170 108.5 109.7 110.0180 108.3 109.5 109.8190 108.1 109.3 109.6192 108.1 109.2 109.6Gmb 2.369 2.354 2.345 2.367 2.385 2.369Gmm 2.437
Sandstone 12.5 mm NMAS, Coarse-Graded, PG 76-22, Ndesign = 119
Height Data, mmNdesign = 119 Nmaximum = 192
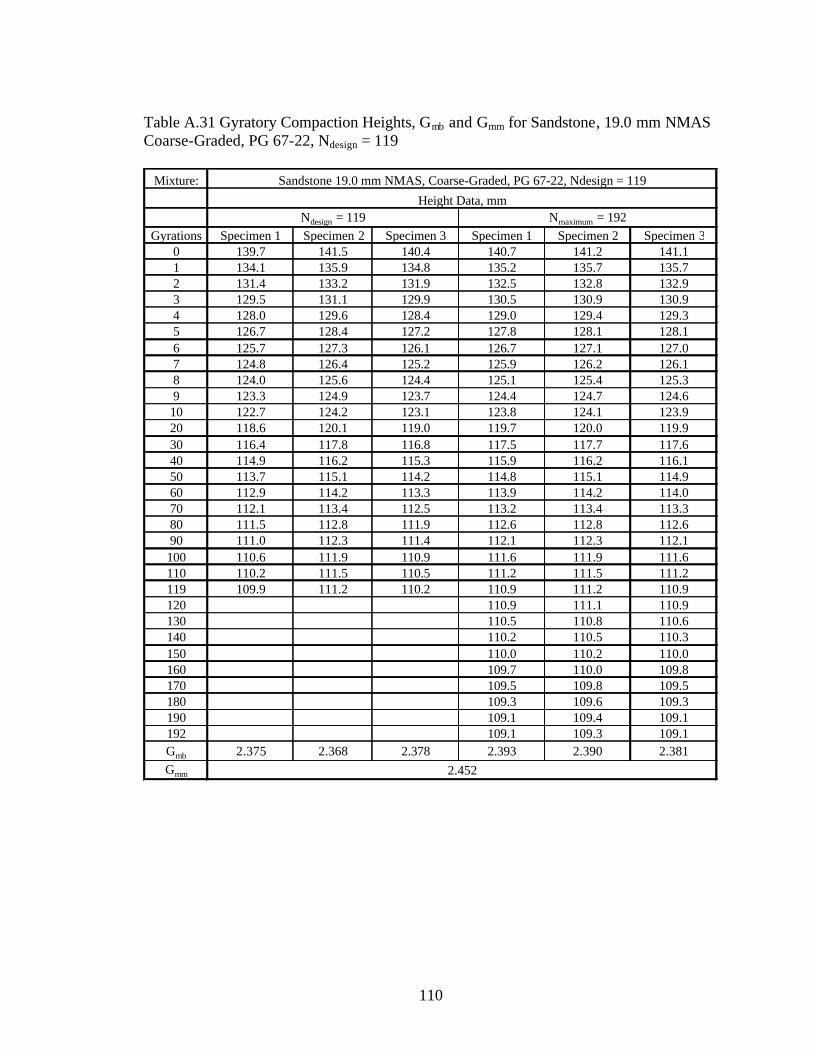
110
Table A.31 Gyratory Compaction Heights, Gmb and Gmm for Sandstone, 19.0 mm NMAS Coarse-Graded, PG 67-22, Ndesign = 119
Mixture:
Gyrations Specimen 1 Specimen 2 Specimen 3 Specimen 1 Specimen 2 Specimen 30 139.7 141.5 140.4 140.7 141.2 141.11 134.1 135.9 134.8 135.2 135.7 135.72 131.4 133.2 131.9 132.5 132.8 132.93 129.5 131.1 129.9 130.5 130.9 130.94 128.0 129.6 128.4 129.0 129.4 129.35 126.7 128.4 127.2 127.8 128.1 128.16 125.7 127.3 126.1 126.7 127.1 127.07 124.8 126.4 125.2 125.9 126.2 126.18 124.0 125.6 124.4 125.1 125.4 125.39 123.3 124.9 123.7 124.4 124.7 124.610 122.7 124.2 123.1 123.8 124.1 123.920 118.6 120.1 119.0 119.7 120.0 119.930 116.4 117.8 116.8 117.5 117.7 117.640 114.9 116.2 115.3 115.9 116.2 116.150 113.7 115.1 114.2 114.8 115.1 114.960 112.9 114.2 113.3 113.9 114.2 114.070 112.1 113.4 112.5 113.2 113.4 113.380 111.5 112.8 111.9 112.6 112.8 112.690 111.0 112.3 111.4 112.1 112.3 112.1100 110.6 111.9 110.9 111.6 111.9 111.6110 110.2 111.5 110.5 111.2 111.5 111.2119 109.9 111.2 110.2 110.9 111.2 110.9120 110.9 111.1 110.9130 110.5 110.8 110.6140 110.2 110.5 110.3150 110.0 110.2 110.0160 109.7 110.0 109.8170 109.5 109.8 109.5180 109.3 109.6 109.3190 109.1 109.4 109.1192 109.1 109.3 109.1Gmb 2.375 2.368 2.378 2.393 2.390 2.381Gmm 2.452
Sandstone 19.0 mm NMAS, Coarse-Graded, PG 67-22, Ndesign = 119
Height Data, mmNdesign = 119 Nmaximum = 192
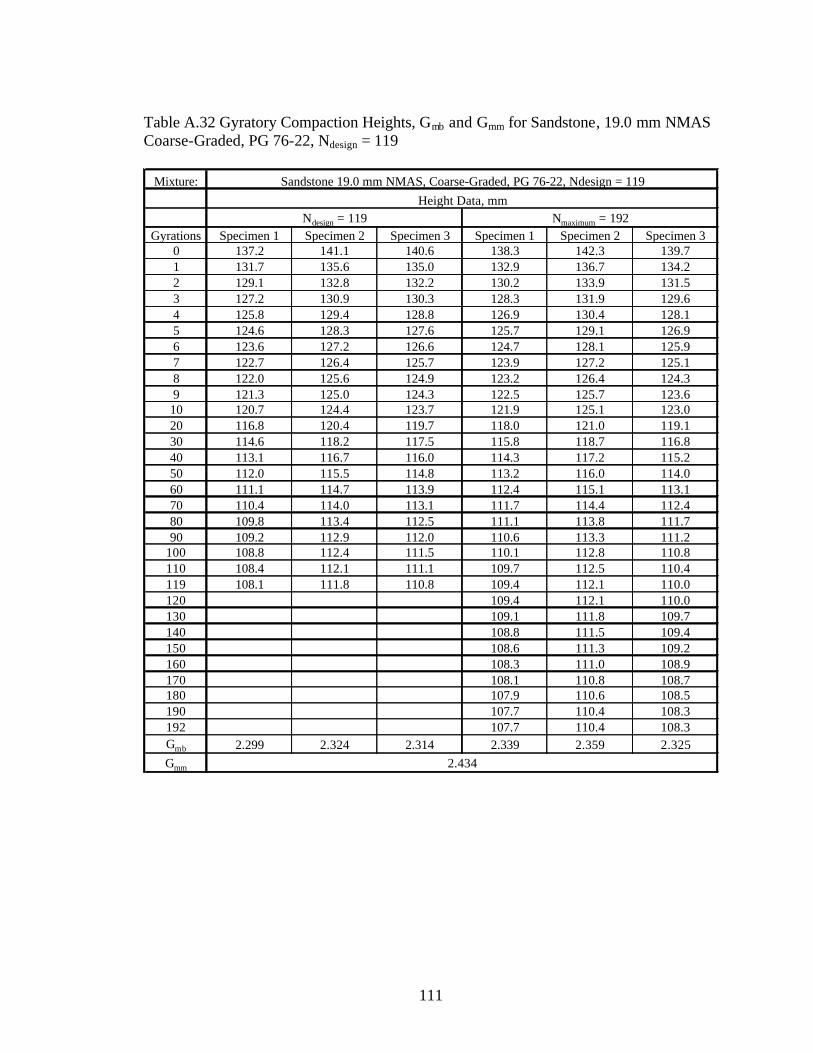
111
Table A.32 Gyratory Compaction Heights, Gmb and Gmm for Sandstone, 19.0 mm NMAS Coarse-Graded, PG 76-22, Ndesign = 119
Mixture:
Gyrations Specimen 1 Specimen 2 Specimen 3 Specimen 1 Specimen 2 Specimen 30 137.2 141.1 140.6 138.3 142.3 139.71 131.7 135.6 135.0 132.9 136.7 134.22 129.1 132.8 132.2 130.2 133.9 131.53 127.2 130.9 130.3 128.3 131.9 129.64 125.8 129.4 128.8 126.9 130.4 128.15 124.6 128.3 127.6 125.7 129.1 126.96 123.6 127.2 126.6 124.7 128.1 125.97 122.7 126.4 125.7 123.9 127.2 125.18 122.0 125.6 124.9 123.2 126.4 124.39 121.3 125.0 124.3 122.5 125.7 123.610 120.7 124.4 123.7 121.9 125.1 123.020 116.8 120.4 119.7 118.0 121.0 119.130 114.6 118.2 117.5 115.8 118.7 116.840 113.1 116.7 116.0 114.3 117.2 115.250 112.0 115.5 114.8 113.2 116.0 114.060 111.1 114.7 113.9 112.4 115.1 113.170 110.4 114.0 113.1 111.7 114.4 112.480 109.8 113.4 112.5 111.1 113.8 111.790 109.2 112.9 112.0 110.6 113.3 111.2
100 108.8 112.4 111.5 110.1 112.8 110.8110 108.4 112.1 111.1 109.7 112.5 110.4119 108.1 111.8 110.8 109.4 112.1 110.0120 109.4 112.1 110.0130 109.1 111.8 109.7140 108.8 111.5 109.4150 108.6 111.3 109.2160 108.3 111.0 108.9170 108.1 110.8 108.7180 107.9 110.6 108.5190 107.7 110.4 108.3192 107.7 110.4 108.3Gmb 2.299 2.324 2.314 2.339 2.359 2.325Gmm 2.434
Sandstone 19.0 mm NMAS, Coarse-Graded, PG 76-22, Ndesign = 119Height Data, mm
Ndesign = 119 Nmaximum = 192
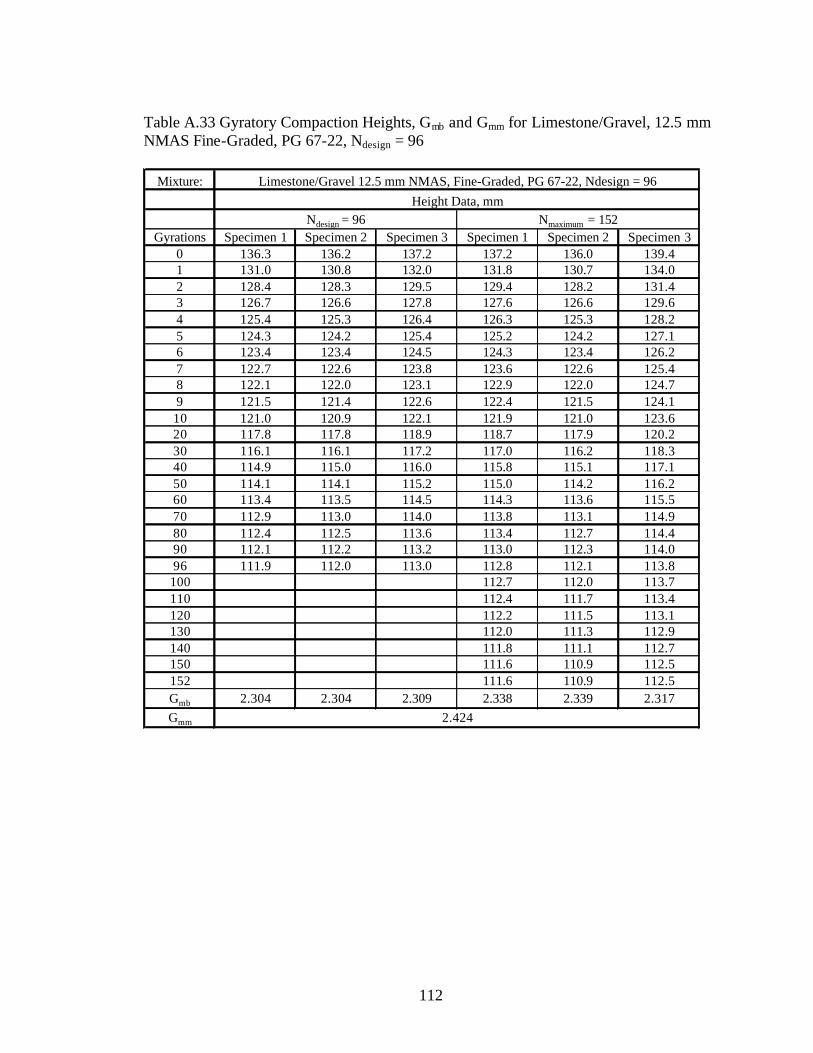
112
Table A.33 Gyratory Compaction Heights, Gmb and Gmm for Limestone/Gravel, 12.5 mm NMAS Fine-Graded, PG 67-22, Ndesign = 96
Mixture:
Gyrations Specimen 1 Specimen 2 Specimen 3 Specimen 1 Specimen 2 Specimen 30 136.3 136.2 137.2 137.2 136.0 139.41 131.0 130.8 132.0 131.8 130.7 134.02 128.4 128.3 129.5 129.4 128.2 131.43 126.7 126.6 127.8 127.6 126.6 129.64 125.4 125.3 126.4 126.3 125.3 128.25 124.3 124.2 125.4 125.2 124.2 127.16 123.4 123.4 124.5 124.3 123.4 126.27 122.7 122.6 123.8 123.6 122.6 125.48 122.1 122.0 123.1 122.9 122.0 124.79 121.5 121.4 122.6 122.4 121.5 124.110 121.0 120.9 122.1 121.9 121.0 123.620 117.8 117.8 118.9 118.7 117.9 120.230 116.1 116.1 117.2 117.0 116.2 118.340 114.9 115.0 116.0 115.8 115.1 117.150 114.1 114.1 115.2 115.0 114.2 116.260 113.4 113.5 114.5 114.3 113.6 115.570 112.9 113.0 114.0 113.8 113.1 114.980 112.4 112.5 113.6 113.4 112.7 114.490 112.1 112.2 113.2 113.0 112.3 114.096 111.9 112.0 113.0 112.8 112.1 113.8100 112.7 112.0 113.7110 112.4 111.7 113.4120 112.2 111.5 113.1130 112.0 111.3 112.9140 111.8 111.1 112.7150 111.6 110.9 112.5152 111.6 110.9 112.5Gmb 2.304 2.304 2.309 2.338 2.339 2.317Gmm 2.424
Ndesign = 96 Nmaximum = 152
Limestone/Gravel 12.5 mm NMAS, Fine-Graded, PG 67-22, Ndesign = 96Height Data, mm
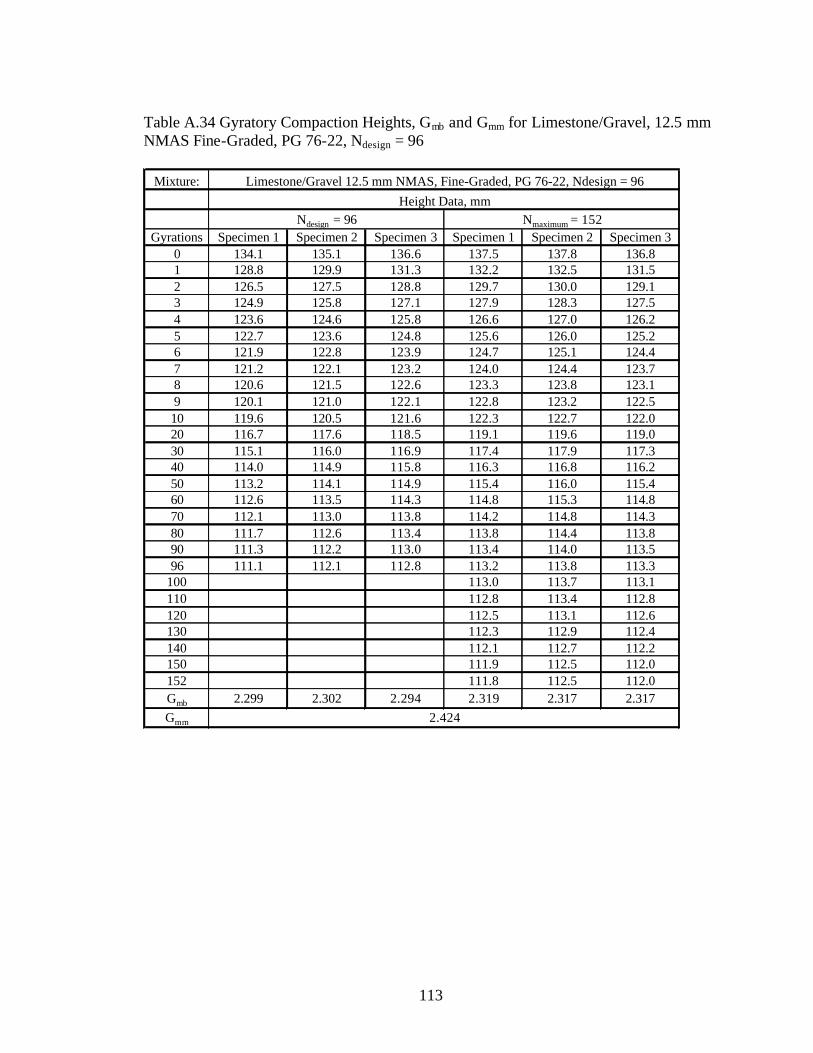
113
Table A.34 Gyratory Compaction Heights, Gmb and Gmm for Limestone/Gravel, 12.5 mm NMAS Fine-Graded, PG 76-22, Ndesign = 96
Mixture:
Gyrations Specimen 1 Specimen 2 Specimen 3 Specimen 1 Specimen 2 Specimen 30 134.1 135.1 136.6 137.5 137.8 136.81 128.8 129.9 131.3 132.2 132.5 131.52 126.5 127.5 128.8 129.7 130.0 129.13 124.9 125.8 127.1 127.9 128.3 127.54 123.6 124.6 125.8 126.6 127.0 126.25 122.7 123.6 124.8 125.6 126.0 125.26 121.9 122.8 123.9 124.7 125.1 124.47 121.2 122.1 123.2 124.0 124.4 123.78 120.6 121.5 122.6 123.3 123.8 123.19 120.1 121.0 122.1 122.8 123.2 122.510 119.6 120.5 121.6 122.3 122.7 122.020 116.7 117.6 118.5 119.1 119.6 119.030 115.1 116.0 116.9 117.4 117.9 117.340 114.0 114.9 115.8 116.3 116.8 116.250 113.2 114.1 114.9 115.4 116.0 115.460 112.6 113.5 114.3 114.8 115.3 114.870 112.1 113.0 113.8 114.2 114.8 114.380 111.7 112.6 113.4 113.8 114.4 113.890 111.3 112.2 113.0 113.4 114.0 113.596 111.1 112.1 112.8 113.2 113.8 113.3
100 113.0 113.7 113.1110 112.8 113.4 112.8120 112.5 113.1 112.6130 112.3 112.9 112.4140 112.1 112.7 112.2150 111.9 112.5 112.0152 111.8 112.5 112.0Gmb 2.299 2.302 2.294 2.319 2.317 2.317Gmm 2.424
Limestone/Gravel 12.5 mm NMAS, Fine-Graded, PG 76-22, Ndesign = 96Height Data, mm
Ndesign = 96 Nmaximum = 152
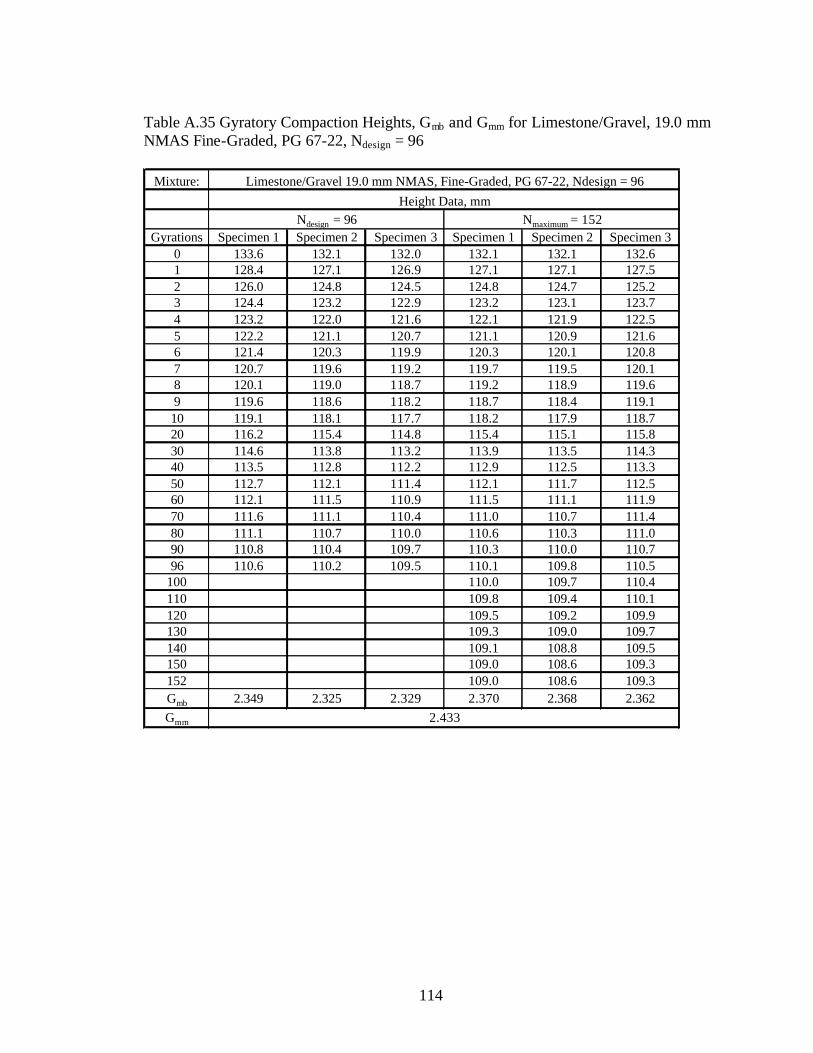
114
Table A.35 Gyratory Compaction Heights, Gmb and Gmm for Limestone/Gravel, 19.0 mm NMAS Fine-Graded, PG 67-22, Ndesign = 96
Mixture:
Gyrations Specimen 1 Specimen 2 Specimen 3 Specimen 1 Specimen 2 Specimen 30 133.6 132.1 132.0 132.1 132.1 132.61 128.4 127.1 126.9 127.1 127.1 127.52 126.0 124.8 124.5 124.8 124.7 125.23 124.4 123.2 122.9 123.2 123.1 123.74 123.2 122.0 121.6 122.1 121.9 122.55 122.2 121.1 120.7 121.1 120.9 121.66 121.4 120.3 119.9 120.3 120.1 120.87 120.7 119.6 119.2 119.7 119.5 120.18 120.1 119.0 118.7 119.2 118.9 119.69 119.6 118.6 118.2 118.7 118.4 119.110 119.1 118.1 117.7 118.2 117.9 118.720 116.2 115.4 114.8 115.4 115.1 115.830 114.6 113.8 113.2 113.9 113.5 114.340 113.5 112.8 112.2 112.9 112.5 113.350 112.7 112.1 111.4 112.1 111.7 112.560 112.1 111.5 110.9 111.5 111.1 111.970 111.6 111.1 110.4 111.0 110.7 111.480 111.1 110.7 110.0 110.6 110.3 111.090 110.8 110.4 109.7 110.3 110.0 110.796 110.6 110.2 109.5 110.1 109.8 110.5
100 110.0 109.7 110.4110 109.8 109.4 110.1120 109.5 109.2 109.9130 109.3 109.0 109.7140 109.1 108.8 109.5150 109.0 108.6 109.3152 109.0 108.6 109.3Gmb 2.349 2.325 2.329 2.370 2.368 2.362Gmm 2.433
Limestone/Gravel 19.0 mm NMAS, Fine-Graded, PG 67-22, Ndesign = 96Height Data, mm
Ndesign = 96 Nmaximum = 152
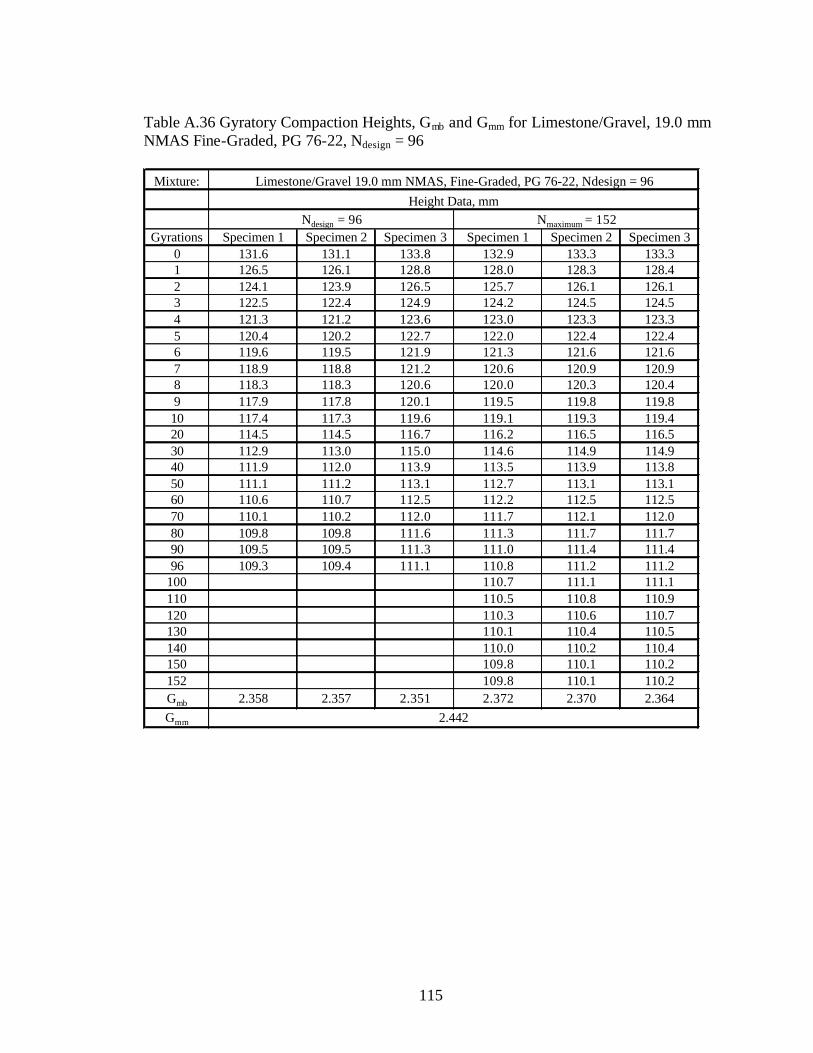
115
Table A.36 Gyratory Compaction Heights, Gmb and Gmm for Limestone/Gravel, 19.0 mm NMAS Fine-Graded, PG 76-22, Ndesign = 96
Mixture:
Gyrations Specimen 1 Specimen 2 Specimen 3 Specimen 1 Specimen 2 Specimen 30 131.6 131.1 133.8 132.9 133.3 133.31 126.5 126.1 128.8 128.0 128.3 128.42 124.1 123.9 126.5 125.7 126.1 126.13 122.5 122.4 124.9 124.2 124.5 124.54 121.3 121.2 123.6 123.0 123.3 123.35 120.4 120.2 122.7 122.0 122.4 122.46 119.6 119.5 121.9 121.3 121.6 121.67 118.9 118.8 121.2 120.6 120.9 120.98 118.3 118.3 120.6 120.0 120.3 120.49 117.9 117.8 120.1 119.5 119.8 119.810 117.4 117.3 119.6 119.1 119.3 119.420 114.5 114.5 116.7 116.2 116.5 116.530 112.9 113.0 115.0 114.6 114.9 114.940 111.9 112.0 113.9 113.5 113.9 113.850 111.1 111.2 113.1 112.7 113.1 113.160 110.6 110.7 112.5 112.2 112.5 112.570 110.1 110.2 112.0 111.7 112.1 112.080 109.8 109.8 111.6 111.3 111.7 111.790 109.5 109.5 111.3 111.0 111.4 111.496 109.3 109.4 111.1 110.8 111.2 111.2
100 110.7 111.1 111.1110 110.5 110.8 110.9120 110.3 110.6 110.7130 110.1 110.4 110.5140 110.0 110.2 110.4150 109.8 110.1 110.2152 109.8 110.1 110.2Gmb 2.358 2.357 2.351 2.372 2.370 2.364Gmm 2.442
Limestone/Gravel 19.0 mm NMAS, Fine-Graded, PG 76-22, Ndesign = 96Height Data, mm
Ndesign = 96 Nmaximum = 152

116
Table A.37 Gyratory Compaction Heights, Gmb and Gmm for Limestone/Gravel, 12.5 mm NMAS Coarse-Graded, PG 67-22, Ndesign = 96
Mixture:
Gyrations Specimen 1 Specimen 2 Specimen 3 Specimen 1 Specimen 2 Specimen 30 133.6 132.1 132.0 132.1 132.1 132.61 128.4 127.1 126.9 127.1 127.1 127.52 126.0 124.8 124.5 124.8 124.7 125.23 124.4 123.2 122.9 123.2 123.1 123.74 123.2 122.0 121.6 122.1 121.9 122.55 122.2 121.1 120.7 121.1 120.9 121.66 121.4 120.3 119.9 120.3 120.1 120.87 120.7 119.6 119.2 119.7 119.5 120.18 120.1 119.0 118.7 119.2 118.9 119.69 119.6 118.6 118.2 118.7 118.4 119.110 119.1 118.1 117.7 118.2 117.9 118.720 116.2 115.4 114.8 115.4 115.1 115.830 114.6 113.8 113.2 113.9 113.5 114.340 113.5 112.8 112.2 112.9 112.5 113.350 112.7 112.1 111.4 112.1 111.7 112.560 112.1 111.5 110.9 111.5 111.1 111.970 111.6 111.1 110.4 111.0 110.7 111.480 111.1 110.7 110.0 110.6 110.3 111.090 110.8 110.4 109.7 110.3 110.0 110.796 110.6 110.2 109.5 110.1 109.8 110.5
100 110.0 109.7 110.4110 109.8 109.4 110.1120 109.5 109.2 109.9130 109.3 109.0 109.7140 109.1 108.8 109.5150 109.0 108.6 109.3152 109.0 108.6 109.3Gmb 2.306 2.312 2.300 2.335 2.329 2.342Gmm 2.401
Limestone/Gravel 12.5 mm NMAS, Coarse-Graded, PG 67-22, Ndesign = 96Height Data, mm
Ndesign = 96 Nmaximum = 152
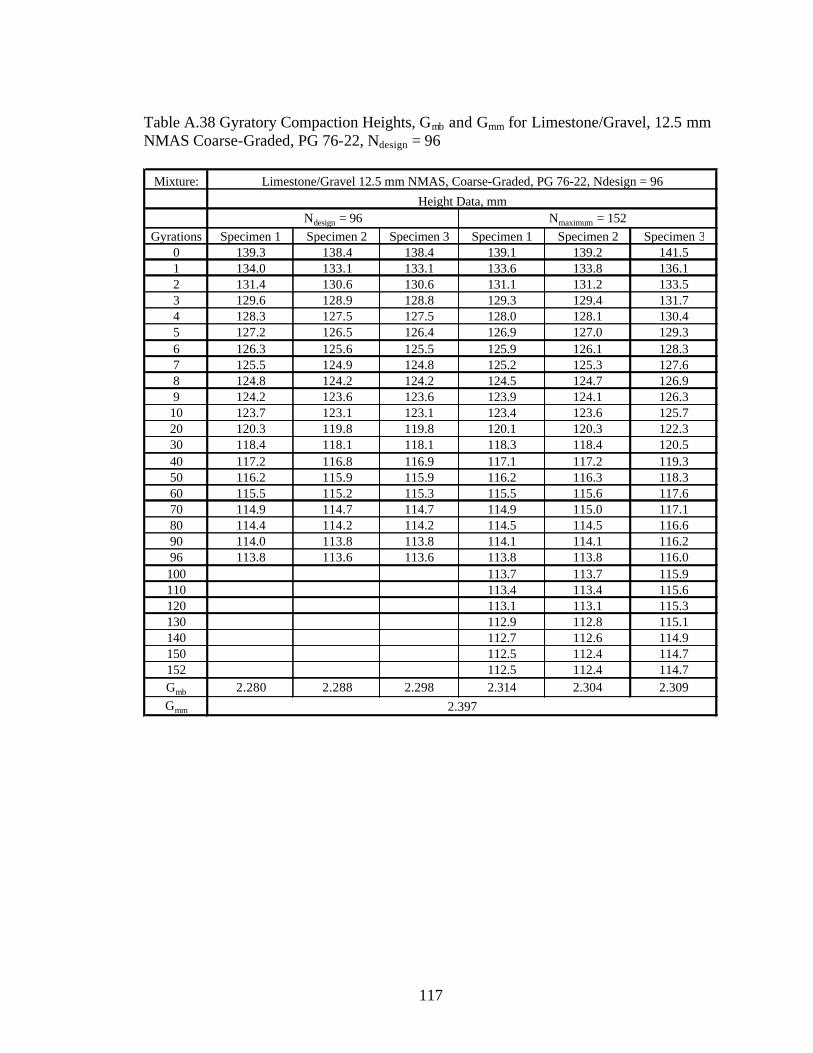
117
Table A.38 Gyratory Compaction Heights, Gmb and Gmm for Limestone/Gravel, 12.5 mm NMAS Coarse-Graded, PG 76-22, Ndesign = 96
Mixture:
Gyrations Specimen 1 Specimen 2 Specimen 3 Specimen 1 Specimen 2 Specimen 30 139.3 138.4 138.4 139.1 139.2 141.51 134.0 133.1 133.1 133.6 133.8 136.12 131.4 130.6 130.6 131.1 131.2 133.53 129.6 128.9 128.8 129.3 129.4 131.74 128.3 127.5 127.5 128.0 128.1 130.45 127.2 126.5 126.4 126.9 127.0 129.36 126.3 125.6 125.5 125.9 126.1 128.37 125.5 124.9 124.8 125.2 125.3 127.68 124.8 124.2 124.2 124.5 124.7 126.99 124.2 123.6 123.6 123.9 124.1 126.310 123.7 123.1 123.1 123.4 123.6 125.720 120.3 119.8 119.8 120.1 120.3 122.330 118.4 118.1 118.1 118.3 118.4 120.540 117.2 116.8 116.9 117.1 117.2 119.350 116.2 115.9 115.9 116.2 116.3 118.360 115.5 115.2 115.3 115.5 115.6 117.670 114.9 114.7 114.7 114.9 115.0 117.180 114.4 114.2 114.2 114.5 114.5 116.690 114.0 113.8 113.8 114.1 114.1 116.296 113.8 113.6 113.6 113.8 113.8 116.0100 113.7 113.7 115.9110 113.4 113.4 115.6120 113.1 113.1 115.3130 112.9 112.8 115.1140 112.7 112.6 114.9150 112.5 112.4 114.7152 112.5 112.4 114.7Gmb 2.280 2.288 2.298 2.314 2.304 2.309Gmm 2.397
Limestone/Gravel 12.5 mm NMAS, Coarse-Graded, PG 76-22, Ndesign = 96
Height Data, mmNdesign = 96 Nmaximum = 152

118
Table A.39 Gyratory Compaction Heights, Gmb and Gmm for Limestone/Gravel, 19.0 mm NMAS Coarse-Graded, PG 67-22, Ndesign = 96
Mixture:
Gyrations Specimen 1 Specimen 2 Specimen 3 Specimen 1 Specimen 2 Specimen 30 124.7 136.8 137.6 138.0 137.5 138.01 124.0 131.5 132.3 132.7 132.1 132.92 123.4 129.1 129.8 130.3 129.7 130.43 122.9 127.4 128.1 128.5 128.0 128.74 122.5 126.2 126.8 127.2 126.7 127.55 122.1 125.1 125.8 126.2 125.7 126.46 121.7 124.2 124.9 125.3 124.8 125.57 121.3 123.5 124.2 124.5 124.1 124.88 121.0 122.9 123.5 123.9 123.5 124.19 120.7 122.3 123.0 123.3 122.9 123.610 120.4 121.8 122.4 122.8 122.4 123.020 118.3 118.5 119.1 119.5 119.1 119.830 116.9 116.7 117.3 117.7 117.4 118.040 116.0 115.5 116.1 116.5 116.2 116.850 115.2 114.6 115.1 115.6 115.4 115.960 114.7 113.9 114.4 114.9 114.7 115.270 114.2 113.3 113.9 114.4 114.2 114.680 113.8 112.8 113.4 113.9 113.7 114.290 113.5 112.4 113.0 113.5 113.3 113.896 113.3 112.2 112.7 113.3 113.1 113.6100 113.2 112.9 113.4110 112.9 112.6 113.1120 112.6 112.3 112.9130 112.4 112.1 112.6140 112.1 111.8 112.4150 111.9 111.6 112.2152 111.9 111.6 112.2Gmb 2.314 2.329 2.316 2.355 2.351 2.350Gmm 2.438
Limestone/Gravel 19.0 mm NMAS, Coarse-Graded, PG 67-22, Ndesign = 96
Height Data, mmNdesign = 96 Nmaximum = 152
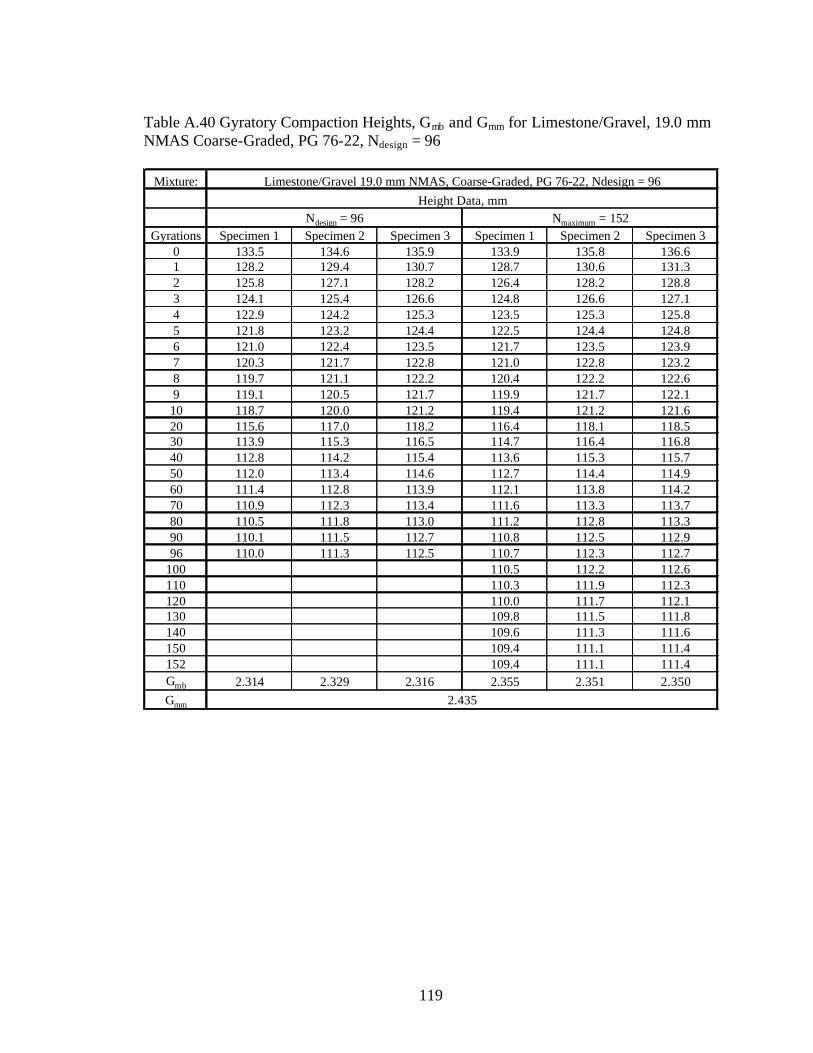
119
Table A.40 Gyratory Compaction Heights, Gmb and Gmm for Limestone/Gravel, 19.0 mm NMAS Coarse-Graded, PG 76-22, Ndesign = 96
Mixture:
Gyrations Specimen 1 Specimen 2 Specimen 3 Specimen 1 Specimen 2 Specimen 30 133.5 134.6 135.9 133.9 135.8 136.61 128.2 129.4 130.7 128.7 130.6 131.32 125.8 127.1 128.2 126.4 128.2 128.83 124.1 125.4 126.6 124.8 126.6 127.14 122.9 124.2 125.3 123.5 125.3 125.85 121.8 123.2 124.4 122.5 124.4 124.86 121.0 122.4 123.5 121.7 123.5 123.97 120.3 121.7 122.8 121.0 122.8 123.28 119.7 121.1 122.2 120.4 122.2 122.69 119.1 120.5 121.7 119.9 121.7 122.110 118.7 120.0 121.2 119.4 121.2 121.620 115.6 117.0 118.2 116.4 118.1 118.530 113.9 115.3 116.5 114.7 116.4 116.840 112.8 114.2 115.4 113.6 115.3 115.750 112.0 113.4 114.6 112.7 114.4 114.960 111.4 112.8 113.9 112.1 113.8 114.270 110.9 112.3 113.4 111.6 113.3 113.780 110.5 111.8 113.0 111.2 112.8 113.390 110.1 111.5 112.7 110.8 112.5 112.996 110.0 111.3 112.5 110.7 112.3 112.7
100 110.5 112.2 112.6110 110.3 111.9 112.3120 110.0 111.7 112.1130 109.8 111.5 111.8140 109.6 111.3 111.6150 109.4 111.1 111.4152 109.4 111.1 111.4Gmb 2.314 2.329 2.316 2.355 2.351 2.350Gmm 2.435
Limestone/Gravel 19.0 mm NMAS, Coarse-Graded, PG 76-22, Ndesign = 96Height Data, mm
Ndesign = 96 Nmaximum = 152
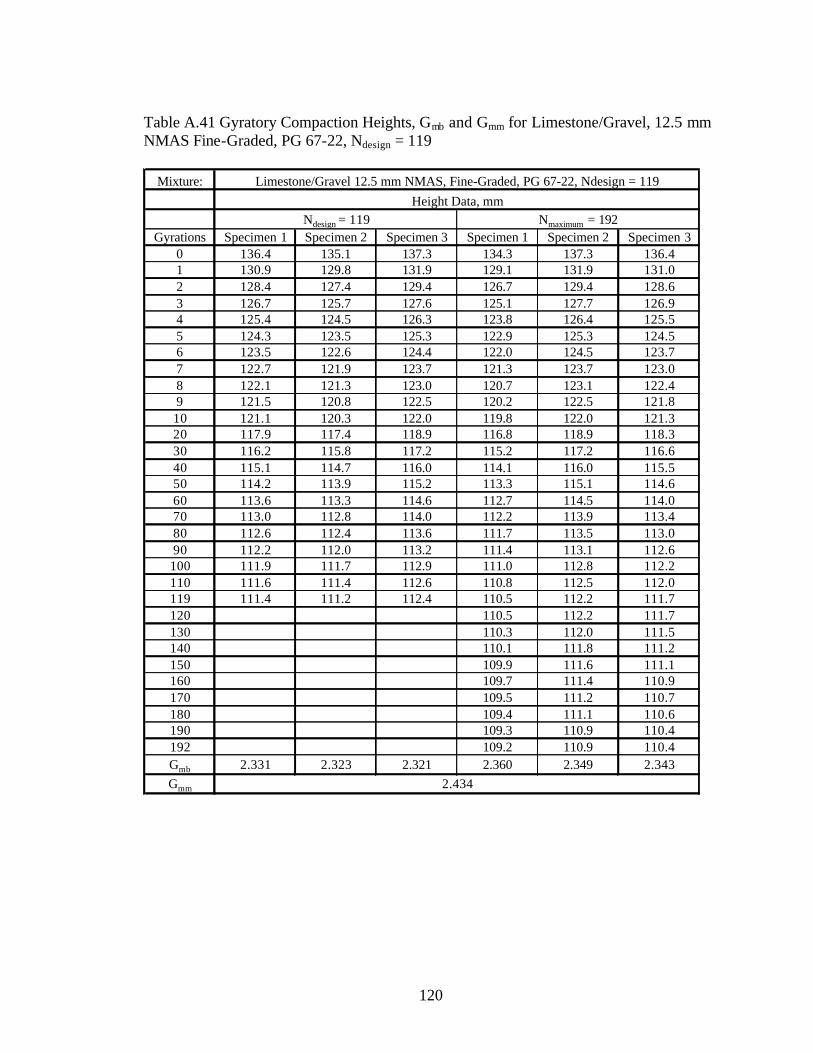
120
Table A.41 Gyratory Compaction Heights, Gmb and Gmm for Limestone/Gravel, 12.5 mm NMAS Fine-Graded, PG 67-22, Ndesign = 119
Mixture:
Gyrations Specimen 1 Specimen 2 Specimen 3 Specimen 1 Specimen 2 Specimen 30 136.4 135.1 137.3 134.3 137.3 136.41 130.9 129.8 131.9 129.1 131.9 131.02 128.4 127.4 129.4 126.7 129.4 128.63 126.7 125.7 127.6 125.1 127.7 126.94 125.4 124.5 126.3 123.8 126.4 125.55 124.3 123.5 125.3 122.9 125.3 124.56 123.5 122.6 124.4 122.0 124.5 123.77 122.7 121.9 123.7 121.3 123.7 123.08 122.1 121.3 123.0 120.7 123.1 122.49 121.5 120.8 122.5 120.2 122.5 121.810 121.1 120.3 122.0 119.8 122.0 121.320 117.9 117.4 118.9 116.8 118.9 118.330 116.2 115.8 117.2 115.2 117.2 116.640 115.1 114.7 116.0 114.1 116.0 115.550 114.2 113.9 115.2 113.3 115.1 114.660 113.6 113.3 114.6 112.7 114.5 114.070 113.0 112.8 114.0 112.2 113.9 113.480 112.6 112.4 113.6 111.7 113.5 113.090 112.2 112.0 113.2 111.4 113.1 112.6100 111.9 111.7 112.9 111.0 112.8 112.2110 111.6 111.4 112.6 110.8 112.5 112.0119 111.4 111.2 112.4 110.5 112.2 111.7120 110.5 112.2 111.7130 110.3 112.0 111.5140 110.1 111.8 111.2150 109.9 111.6 111.1160 109.7 111.4 110.9170 109.5 111.2 110.7180 109.4 111.1 110.6190 109.3 110.9 110.4192 109.2 110.9 110.4Gmb 2.331 2.323 2.321 2.360 2.349 2.343Gmm 2.434
Ndesign = 119 Nmaximum = 192
Limestone/Gravel 12.5 mm NMAS, Fine-Graded, PG 67-22, Ndesign = 119Height Data, mm
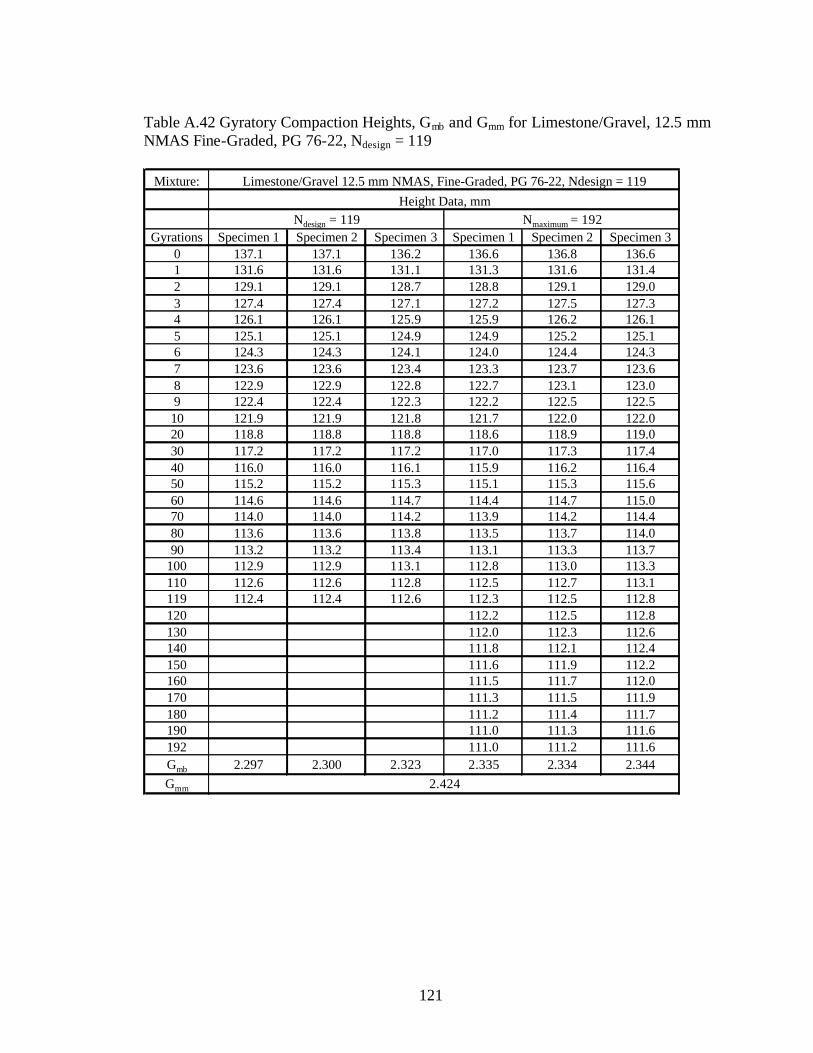
121
Table A.42 Gyratory Compaction Heights, Gmb and Gmm for Limestone/Gravel, 12.5 mm NMAS Fine-Graded, PG 76-22, Ndesign = 119
Mixture:
Gyrations Specimen 1 Specimen 2 Specimen 3 Specimen 1 Specimen 2 Specimen 30 137.1 137.1 136.2 136.6 136.8 136.61 131.6 131.6 131.1 131.3 131.6 131.42 129.1 129.1 128.7 128.8 129.1 129.03 127.4 127.4 127.1 127.2 127.5 127.34 126.1 126.1 125.9 125.9 126.2 126.15 125.1 125.1 124.9 124.9 125.2 125.16 124.3 124.3 124.1 124.0 124.4 124.37 123.6 123.6 123.4 123.3 123.7 123.68 122.9 122.9 122.8 122.7 123.1 123.09 122.4 122.4 122.3 122.2 122.5 122.510 121.9 121.9 121.8 121.7 122.0 122.020 118.8 118.8 118.8 118.6 118.9 119.030 117.2 117.2 117.2 117.0 117.3 117.440 116.0 116.0 116.1 115.9 116.2 116.450 115.2 115.2 115.3 115.1 115.3 115.660 114.6 114.6 114.7 114.4 114.7 115.070 114.0 114.0 114.2 113.9 114.2 114.480 113.6 113.6 113.8 113.5 113.7 114.090 113.2 113.2 113.4 113.1 113.3 113.7
100 112.9 112.9 113.1 112.8 113.0 113.3110 112.6 112.6 112.8 112.5 112.7 113.1119 112.4 112.4 112.6 112.3 112.5 112.8120 112.2 112.5 112.8130 112.0 112.3 112.6140 111.8 112.1 112.4150 111.6 111.9 112.2160 111.5 111.7 112.0170 111.3 111.5 111.9180 111.2 111.4 111.7190 111.0 111.3 111.6192 111.0 111.2 111.6Gmb 2.297 2.300 2.323 2.335 2.334 2.344Gmm
Limestone/Gravel 12.5 mm NMAS, Fine-Graded, PG 76-22, Ndesign = 119Height Data, mm
Ndesign = 119 Nmaximum = 192
2.424

122
Table A.43 Gyratory Compaction Heights, Gmb and Gmm for Limestone/Gravel, 19.0 mm NMAS Fine-Graded, PG 67-22, Ndesign = 119
Mixture:
Gyrations Specimen 1 Specimen 2 Specimen 3 Specimen 1 Specimen 2 Specimen 30 135.1 136.2 138.2 137.1 137.5 139.21 129.8 130.9 132.9 131.9 132.1 133.82 127.2 128.4 130.3 129.4 129.6 131.33 125.5 126.7 128.6 127.6 127.8 129.54 124.2 125.4 127.3 126.3 126.5 128.15 123.2 124.4 126.2 125.3 125.4 127.16 122.3 123.6 125.4 124.4 124.5 126.27 121.6 122.9 124.6 123.6 123.8 125.48 121.0 122.3 124.0 123.0 123.1 124.79 120.4 121.7 123.4 122.4 122.5 124.210 119.9 121.2 122.9 121.9 122.0 123.720 116.8 118.1 119.6 118.7 118.7 120.430 115.1 116.4 117.8 116.9 116.9 118.640 114.0 115.3 116.6 115.8 115.7 117.450 113.1 114.4 115.7 114.9 114.8 116.460 112.5 113.7 115.0 114.2 114.1 115.770 111.9 113.2 114.4 113.6 113.5 115.180 111.4 112.7 114.0 113.1 113.0 114.690 111.0 112.3 113.6 112.7 112.6 114.2
100 110.7 111.9 113.2 112.4 112.3 113.9110 110.4 111.6 112.9 112.1 111.9 113.5119 110.1 111.4 112.7 111.8 111.7 113.3120 111.8 111.7 113.3130 111.6 111.4 113.0140 111.3 111.2 112.8150 111.1 111.0 112.6160 111.0 110.8 112.4170 110.8 110.6 112.2180 110.6 110.4 112.1190 110.5 110.3 111.9192 110.4 110.3 111.9Gmb 2.359 2.364 2.357 2.378 2.382 2.380Gmm
Limestone/Gravel 19.0 mm NMAS, Fine-Graded, PG 67-22, Ndesign = 119Height Data, mm
Ndesign = 119 Nmaximum = 192
2.426
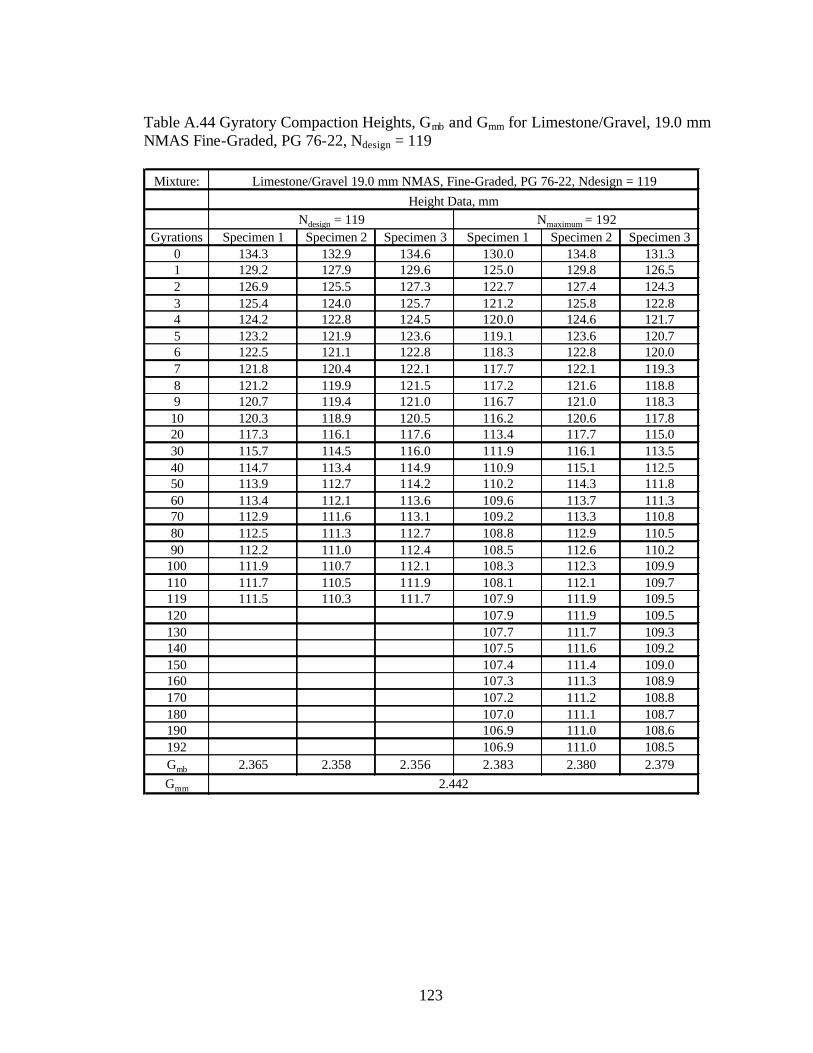
123
Table A.44 Gyratory Compaction Heights, Gmb and Gmm for Limestone/Gravel, 19.0 mm NMAS Fine-Graded, PG 76-22, Ndesign = 119
Mixture:
Gyrations Specimen 1 Specimen 2 Specimen 3 Specimen 1 Specimen 2 Specimen 30 134.3 132.9 134.6 130.0 134.8 131.31 129.2 127.9 129.6 125.0 129.8 126.52 126.9 125.5 127.3 122.7 127.4 124.33 125.4 124.0 125.7 121.2 125.8 122.84 124.2 122.8 124.5 120.0 124.6 121.75 123.2 121.9 123.6 119.1 123.6 120.76 122.5 121.1 122.8 118.3 122.8 120.07 121.8 120.4 122.1 117.7 122.1 119.38 121.2 119.9 121.5 117.2 121.6 118.89 120.7 119.4 121.0 116.7 121.0 118.310 120.3 118.9 120.5 116.2 120.6 117.820 117.3 116.1 117.6 113.4 117.7 115.030 115.7 114.5 116.0 111.9 116.1 113.540 114.7 113.4 114.9 110.9 115.1 112.550 113.9 112.7 114.2 110.2 114.3 111.860 113.4 112.1 113.6 109.6 113.7 111.370 112.9 111.6 113.1 109.2 113.3 110.880 112.5 111.3 112.7 108.8 112.9 110.590 112.2 111.0 112.4 108.5 112.6 110.2
100 111.9 110.7 112.1 108.3 112.3 109.9110 111.7 110.5 111.9 108.1 112.1 109.7119 111.5 110.3 111.7 107.9 111.9 109.5120 107.9 111.9 109.5130 107.7 111.7 109.3140 107.5 111.6 109.2150 107.4 111.4 109.0160 107.3 111.3 108.9170 107.2 111.2 108.8180 107.0 111.1 108.7190 106.9 111.0 108.6192 106.9 111.0 108.5Gmb 2.365 2.358 2.356 2.383 2.380 2.379Gmm
Limestone/Gravel 19.0 mm NMAS, Fine-Graded, PG 76-22, Ndesign = 119Height Data, mm
Ndesign = 119 Nmaximum = 192
2.442

124
Table A.45 Gyratory Compaction Heights, Gmb and Gmm for Limestone/Gravel, 12.5 mm NMAS Coarse-Graded, PG 67-22, Ndesign = 119
Mixture:
Gyrations Specimen 1 Specimen 2 Specimen 3 Specimen 1 Specimen 2 Specimen 30 139.1 140.3 140.7 139.5 139.7 140.61 133.6 134.7 135.3 134.1 134.2 135.32 131.1 132.2 132.7 131.6 131.6 132.83 129.3 130.5 130.9 129.8 129.9 131.04 128.0 129.2 129.5 128.4 128.5 129.75 126.9 128.1 128.4 127.3 127.4 128.66 126.0 127.3 127.5 126.4 126.5 127.77 125.3 126.5 126.7 125.6 125.8 126.98 124.6 125.9 126.0 125.0 125.1 126.29 124.0 125.3 125.4 124.4 124.5 125.710 123.5 124.8 124.9 123.9 124.0 125.120 120.2 121.5 121.6 120.5 120.7 121.830 118.4 119.7 119.8 118.6 118.9 120.040 117.2 118.5 118.6 117.3 117.6 118.750 116.3 117.5 117.7 116.4 116.7 117.860 115.6 116.8 116.9 115.7 116.0 117.170 115.0 116.2 116.4 115.1 115.4 116.580 114.5 115.7 115.9 114.5 114.9 116.190 114.1 115.3 115.5 114.1 114.5 115.6
100 113.7 114.9 115.1 113.7 114.1 115.3110 113.4 114.6 114.8 113.4 113.8 115.0119 113.2 114.3 114.5 113.2 113.6 114.7120 113.1 113.5 114.7130 112.9 113.3 114.4140 112.6 113.1 114.2150 112.4 112.8 114.0160 112.2 112.7 113.8170 112.1 112.5 113.6180 111.9 112.3 113.4190 111.7 112.2 113.3192 111.7 112.2 113.3Gmb 2.295 2.294 2.297 2.327 2.335 2.326Gmm
Limestone/Gravel 12.5 mm NMAS, Coarse-Graded, PG 67-22, Ndesign = 119Height Data, mm
Ndesign = 119 Nmaximum = 192
2.401

125
Table A.46 Gyratory Compaction Heights, Gmb and Gmm for Limestone/Gravel, 12.5 mm NMAS Coarse-Graded, PG 76-22, Ndesign = 119
Mixture:
Gyrations Specimen 1 Specimen 2 Specimen 3 Specimen 1 Specimen 2 Specimen 30 140.1 138.4 140.9 140.0 136.4 139.91 134.4 132.7 135.2 134.5 131.0 134.12 131.7 130.0 132.5 131.9 128.6 131.23 129.9 128.2 130.7 130.1 126.9 129.24 128.5 126.9 129.3 128.8 125.6 127.75 127.3 125.8 128.2 127.7 124.6 126.56 126.4 124.9 127.3 126.8 123.7 125.57 125.6 124.1 126.5 126.0 123.0 124.78 125.0 123.4 125.8 125.4 122.4 124.09 124.4 122.9 125.2 124.8 121.8 123.310 123.8 122.3 124.7 124.3 121.3 122.820 120.5 119.1 121.3 121.0 118.2 119.130 118.8 117.4 119.5 119.2 116.5 117.040 117.5 116.2 118.2 118.0 115.3 115.750 116.6 115.4 117.3 117.1 114.4 114.760 115.9 114.7 116.7 116.4 113.7 113.970 115.4 114.1 116.1 115.8 113.2 113.380 114.9 113.7 115.6 115.4 112.7 112.890 114.5 113.3 115.2 114.9 112.3 112.3100 114.2 113.0 114.9 114.6 112.0 111.9110 113.9 112.7 114.6 114.3 111.7 111.6119 113.7 112.5 114.4 114.0 111.5 111.3120 114.0 111.4 111.3130 113.8 111.2 111.0140 113.5 111.0 110.8150 113.3 110.8 110.5160 113.1 110.6 110.3170 113.0 110.4 110.1180 112.8 110.3 110.0190 112.7 110.1 109.8192 112.6 110.1 109.8Gmb 2.315 2.295 2.316 2.312 2.326 2.326Gmm
Limestone/Gravel 12.5 mm NMAS, Coarse-Graded, PG 76-22, Ndesign = 119
Height Data, mmNdesign = 119 Nmaximum = 192
2.437

126
Table A.47 Gyratory Compaction Heights, Gmb and Gmm for Limestone/Gravel, 19.0 mm NMAS Coarse-Graded, PG 67-22, Ndesign = 119
Mixture:
Gyrations Specimen 1 Specimen 2 Specimen 3 Specimen 1 Specimen 2 Specimen 30 134.8 136.7 136.5 134.6 136.6 136.81 129.8 131.3 131.4 129.6 131.3 131.42 127.5 128.9 129.0 127.3 128.9 129.13 125.9 127.3 127.4 125.7 127.3 127.54 124.6 126.0 126.2 124.5 126.1 126.25 123.6 125.0 125.3 123.6 125.1 125.26 122.8 124.2 124.5 122.8 124.3 124.47 122.1 123.5 123.8 122.1 123.6 123.78 121.5 122.9 123.2 121.5 123.0 123.29 121.0 122.4 122.7 121.0 122.4 122.610 120.5 122.0 122.2 120.5 122.0 122.120 117.5 119.0 119.3 117.6 118.9 119.130 115.8 117.3 117.7 116.0 117.2 117.440 114.7 116.1 116.5 114.9 116.0 116.350 113.9 115.3 115.7 114.1 115.1 115.560 113.2 114.6 115.1 113.5 114.4 114.970 112.7 114.1 114.6 113.0 113.8 114.380 112.3 113.7 114.1 112.6 113.4 113.990 111.9 113.3 113.8 112.2 112.9 113.5100 111.6 113.0 113.4 111.9 112.6 113.2110 111.3 112.7 113.1 111.6 112.3 112.9119 111.1 112.5 112.9 111.3 112.0 112.7120 111.3 112.0 112.7130 111.1 111.7 112.5140 110.9 111.5 112.3150 110.7 111.3 112.1160 110.5 111.1 111.9170 110.3 110.9 111.7180 110.2 110.7 111.6190 110.0 110.6 111.4192 110.0 110.6 111.4Gmb 2.342 2.341 2.337 2.371 2.359 2.351Gmm
Limestone/Gravel 19.0 mm NMAS, Coarse-Graded, PG 67-22, Ndesign = 119
Height Data, mmNdesign = 119 Nmaximum = 192
2.431

127
Table A.48 Gyratory Compaction Heights, Gmb and Gmm for Limestone/Gravel, 19.0 mm NMAS Coarse-Graded, PG 76-22, Ndesign = 119
Mixture:
Gyrations Specimen 1 Specimen 2 Specimen 3 Specimen 1 Specimen 2 Specimen 30 135.5 135.8 137.3 136.8 137.2 137.21 130.4 130.7 132.1 131.6 132.0 132.32 128.0 128.3 129.7 129.3 129.5 130.13 126.4 126.7 128.0 127.6 127.8 128.44 125.1 125.4 126.8 126.4 126.6 127.25 124.1 124.4 125.7 125.4 125.6 126.26 123.3 123.6 124.9 124.6 124.7 125.47 122.6 122.8 124.1 123.9 124.0 124.78 121.9 122.2 123.5 123.3 123.4 124.19 121.4 121.7 122.9 122.8 122.9 123.510 120.9 121.2 122.4 122.3 122.4 123.120 117.9 118.3 119.3 119.3 119.2 120.030 116.3 116.7 117.6 117.6 117.5 118.440 115.2 115.7 116.4 116.5 116.4 117.350 114.4 114.9 115.6 115.7 115.6 116.460 113.8 114.3 114.9 115.1 115.0 115.870 113.2 113.8 114.4 114.6 114.4 115.380 112.8 113.3 113.9 114.2 114.0 114.890 112.5 113.0 113.6 113.8 113.6 114.4
100 112.1 112.7 113.3 113.5 113.3 114.1110 111.9 112.4 113.0 113.2 113.1 113.8119 111.6 112.2 112.8 113.0 112.8 113.6120 113.0 112.8 113.5130 112.8 112.6 113.3140 112.6 112.4 113.1150 112.4 112.2 112.9160 112.2 112.1 112.7170 112.1 111.9 112.6180 111.9 111.8 112.4190 111.8 111.6 112.3192 111.8 111.6 112.3Gmb 2.318 2.342 2.327 2.358 2.374 2.344Gmm
Limestone/Gravel 19.0 mm NMAS, Coarse-Graded, PG 76-22, Ndesign = 119Height Data, mm
Ndesign = 119 Nmaximum = 192
2.445