Embed Size (px)
Citation preview

MISCANTHUSPractical Aspects Of Biofuel Development
ETSU B/W2/00618/REPURN 03/1568
ContractorEnergy Power Resources Ltd
Prepared byRobert Newman
SubcontractorsBical Ltd
Anglian StrawIACR - Rothamsted
The work described in this report was carried outunder contract as part of the New & RenewableEnergy Programme, managed by ETSU on behalfof the Department of Trade & Industry. The viewsand judgments expressed in this report are those ofthe contractor and do not necessarily reflect those ofETSU or the Department of Trade & Industry.
Interim Report Published March 2002Final Report Published November 2003© Crown copyright 2003

i
EXECUTIVE SUMMARY
Project Objectives
• To plant and establish an energy crop of Miscanthus• Monitor and record it’s growth• Harvest the straw, bale it and deliver to the power station for a combustion trial.• Undertake a controlled trial and establish the key combustion characteristics.• Evaluate any change in power station performance and IPC compliance with baled
Miscanthus as the fuel.
Background
The government has set an objective for a 10% contribution to UK electricity supplies fromrenewable sources by 2010. It is clear that if the UK is to achieve this then biofuel utilisation willhave to increase substantially. EPR is a leading UK developer of renewable energy projects and isactively seeking to encourage and assist with the development of commercially viable alternativebiofuels. With it's nearby 36MW Biomass Power Station near Ely, EPR could offer the opportunityof a long-term fuel supply contract if Miscanthus could be shown to demonstrate an ability toreplace or supplement straw, without adverse restrictions.
Miscanthus is one of the most researched and most advanced, non-straw, biofuel crops. It has highyield, perennial growth and good disease resistance, although this has not been proven on acommercial scale. As a C4 crop it is considered to be an efficient converter of solar radiation tobiomass energy under the right conditions.
To promote the use of Miscanthus, it was essential that its production, storage, handling andcombustion be demonstrated on a commercial scale. This project has attempted to achieve this. Theintegration of biofuel crops and energy conversion has presented a unique opportunity todemonstrate the benefits of Miscanthus to potential UK growers and a wider international, technicalaudience.
Summary of Work
Work on this project has concentrated on three main areas:
• Modification of EPRL's Elean plant to accept and use miscanthus as a fuel• Miscanthus production, concentrating on planting, growth monitoring and future harvesting of
the Miscanthus fuel.• Combustion trial of baled Miscanthus.
Modifications
Modifications were required at the Elean plant to enable the power station to accept baledmiscanthus as a fuel. The mechanical handling system needed to be modified to ensure theintroduction of miscanthus bales would not damage or restrict the plant.

ii
Two possibilities for introducing miscanthus into the facility were evaluated. Each method wasdesigned and priced as a suitable alternative.
One possibility was to modify the plant allowing it to accept chopped miscanthus. Provision wouldbe made for a covered loading area with a large storage pit with a purpose designed conveyingsystem delivering metered volumes onto the straw feed lines and into the combustion system.
The capital cost to provide this system in its entirety would be close to the original total budget of£1.2m and would require a change to planning permission because of the revised building layoutrequired.
A second possibility assessed the requirements and cost benefits of introducing Miscanthus in baledform into the plant. To achieve satisfactory operation, the design of the entire straw fuel handlingsystem had to be modified to accommodate the physical differences between Miscanthus and cerealstraw, i.e., the material bulk density and its abrasion characteristics. The crane system and feedconveyor design needed to be up rated to accommodate possible 850kg Miscanthus bales.
This design was inherently integrated with the existing plant layout and did not require any planningrevisions.
The capital cost to achieve this modification was £190k.
Both options for plant modification were investigated thoroughly, with the advantages anddisadvantages of each being considered. Several key factors in choosing the most appropriate optionincluded: the efficient use of storage, transport costs, ease of handling, impact on power plant andfiring techniques, impact on control systems and fouling potential and perhaps most importantlyfinancing options.
By moving miscanthus in bales and firing as such into the main bale burners, any combinationbetween 0 and 100% firing of miscanthus could be theoretically achieved. The chopped fuel optionwould be limited to a maximum of 25% due to existing furnace feed design.
The introduction of an independent chopped fuel mechanism would create the need for a muchmore complex control system and flame protection system, obtaining even combustion rates acrossthe furnace could not be guaranteed. With the potential for slagging and fouling any localised hightemperature zone could prove detrimental to plant performance and availability.
The most important point in the selection of the feed system for miscanthus was that of finance.Currently and at the time of consideration it was not possible to obtain clearance from our bank,within the timescale available, for the provision of an extra £1.2 million, unless the market forchopped miscanthus has been established. As establishment of the market is the purpose of thisproject and so this requirement clearly could not be met.
In light of these considerations it was decided that the project would go ahead with the baledsystem. The designs for the chopped system have been retained should the market for choppedmiscanthus change and finance is more readily achievable.

iii
Modifications for the receipt, transport and introduction of baled miscanthus were implementedduring the last part of the Power Station construction.
Production of Miscanthus.
A suitable site for the trial plot was selected close to the Elean Power Station. The field is12hectares in total and had been in continuous wheat production for a number of years. Twohectares of the field was set-aside for the Miscanthus growing trial. The intention was to grow therhizomes for two years, then to harvest and split the rhizomes and replant an area of 7ha, so that atthe end of the 4 year project there would be sufficient miscanthus for the combustion trial at theElean Power Station.
In August 1999 planting of miscanthus was carried out using an adapted muck spreader with adensity at about 2 to 2.5 rhizomes/m2. Conditions at the time of planting were poor, late in theseason with dry weather and followed a recent wheat crop.
By the autumn there was reasonable growth on more established plants but the crop at this time wassparse, plant population was not spread evenly over the area and there were areas where no plantsexisted. A definite need to replant certain areas was identified in Spring 2000 and a new plan forreplanting was produced. It was recognized that reestablishing at this stage meant that it would notbe possible to plant an additional 5 ha in year three using existing rhizome stock, since the rhizomeswould not increase sufficiently in bulk for splitting in one year. It was therefore agreed thatadditional miscanthus plots established under other initiatives would also be harvested to producesufficient material for the combustion trial.
The trial plot was replanted in May 2000 under an improved planting protocol again using anadapted muck spreader. Establishment this time was more successful and much improved over thefirst trial plot. Weed control was better and the plants appeared healthy.
Progress over the late summer and autumn was slow while entering the winter period where plantsurvival rather than growth is of importance, but there was substantial growth over the summer of2001, which continued throughout 2002.
Some valuable lessons have been learnt from this experience of establishing miscanthus at thecommercial scale:
• The problems experienced with the establishment of the first phase of planting hasillustrated that good quality rhizomes, stable soil conditions and appropriate commercialplanting techniques are essential for good establishment. Rhizomes should be young, storedand transported under temperature-controlled conditions and they need to be kept cool toretain their quality. Good establishment is critically important.
• A muck spreader distributed the rhizomes satisfactorily however no other spreader typeswere used and therefore direct comparisons could not be made. A problem noticed at the sitewas that the spreader knocked off some developing shoots and this could have been avoided

iv
if the rhizomes had been less advanced in shoot development at the time of planting. Theplanting method needs to be developed further.
• Plough design and depth control may not have been adequate for the conditions at the site.The late decision to go ahead with planting meant that the soil was prepared quickly, justbefore initial planting, without proper levelling and settling, which probably did notcontribute to successful planting. The plough method used offers a cheap, quick and simplemethod of planting but more experimentation is needed to test the methods to identifyimprovements.
• Weed control measures are particularly important in the early stages of establishment.
• No significant pest or disease problems where identified, however inquisitive grazing byrabbits or hares was a problem in the first year of establishment.
Since the trial plot itself did not provide sufficient miscanthus for the combustion trial; this wasovercome by harvesting miscanthus from other sites in the area around the Elean Power Station.Some harvesting at these other sites was undertaken in October 2001, to provide 32 bales ofmaterial for a bale handling trial.
The material for the combustion trial came from the trial plot at Witcham, which gave a yield of 7.3t/ha and an additional 7 hectares of miscanthus from an ADAS site at Mepal and Anglian Strawsites at Ramsey and Willingham. The crops were 1 to 4 years old with a yield of 3 to 9 t/ha(depending on age). These produced a total of 99 bales of material weighing 53.3 tonnes.
Handling trial
The handling trial took place on the 23rd April 2002 and lasted for approximately 2 hours. The fuelprovided a short-term test on the ability of the power station to take the Miscanthus at the full 100%firing rate. During the test there were no noticeable changes in the plant operating performance.The bales were easily picked up by the crane and easily transported on the conveyor mechanism.
During combustion of the miscanthus the plant did not lose any output, it remained steady,generating 36MW gross power at the turbine and exporting a net electrical power of 33 MW. Theboiler drum pressure and steam flow also remained steady indicating no appreciable differencebetween Miscanthus firing and straw firing.
Combustion trial
The combustion test was undertaken generally in accordance with DIN 1942, a Europe wideaccepted test code, for a continuous period of four hours. This required the supply of over 50 tonnesof baled miscanthus in the fuel barn, which was provided well in advance, ready for use.

v
Assessment of how Miscanthus performed was undertaken by comparison with conventional cerealstraw against the following criteria:
• Ease of handling and conveying• Ease of chopping• Ease of entry into combustion chamber• Furnace temperature profile• Steam and Electricity production rates• Plant Chimney Emissions• Ash collection and removal• Operating stability, and• Sustainability and Availability
Handling results
• Both cereal and Miscanthus, in baled form, handled and conveyed in a similar manner• All baled materials chopped successfully although Miscanthus required a small increase in
torque setting, indicating that it was slightly tougher to chop.
Combustion Test Results
Test results show an electrical export level over 36.5 MW, using between 6 and 6.5% natural gas byenergy, at a boiler efficiency of above 90%, which is quite respectable for a plant of this size. Theaccuracy of measurement was high with less than 0.2% error.
No particular problems were encountered on either bottom ash or fly ash at any stage of the test andperformance was very similar to cereal straw in terms of the key indicators: steam flow steamtemperature, combustion efficiency, cycle efficiency and plant electrical output.
Units Cereal Start Mixed Cereal& Miscanthus
Cereal End
Electrical Export MWe 36.98 36.53 37.00
Boiler Duty MWth 102.84 102.64 102.63
Combustion Efficiency % 99.47 99.38 99.51
Boiler Efficiency Direct Method % 90.62 90.54 90.46
Boiler Efficiency Indirect Method % 90.59 90.40 90.55
Direct Method Error % +0.03 +0.14 -0.09
Cycle Efficiency % 32.59 32.22 32.61
Straw Specific Fuel Consumption kg/kWh 0.753 0.74 0.749

vi
Emissions
Designed with an overall cycle efficiency of +32.5%, the trial achieved around this level. All hourlyemissions were well within limits and the plant was stable and controllable throughout. One shortexcursion occurred shortly after the start of mixed fuel firing as the plant control system settled toaccept the new fuel mix.
Emission Units Cereal StrawMixed Cereal& Miscanthus
Cereal Straw IPC Limits
Particulates mg/Nm3 13.0 19.0 15.2 25
SO2 159.7 146.3 215.0 300CO 112.1 100.0 66.2 250NO 49.1 70.5 83.1 --NO2 3.4 3.3 3.2 --
NOx (as NO2) 70.3 99.4 116.5 300HCl 18.8 24.4 20.5 30
Dioxins ng/m3 ND ND ND 0.5
Lime Consumption kg/h 22.6 65.4 69.6 ---
Sustainability and availability
Due to the limited nature of the test work, covering a one-day trial only, the question of availabilityand sustainability of combustion is more difficult to establish. Given the very similar results andperformance between the mixed straws and cereal straw, one could expect Miscanthus bales toprovide good long-term results and could become a regular contract fuel.
Financial Implications
The cost of Miscanthus to the power station is fairly similar to cereal straw, on a delivered energybasis. Cereal straw being the cheapest normal supply material.
Cereal Miscanthus
Load & Deliver Cost £ / tonne 9.74 9.10£ / GJ 0.72 0.64
Total Cost £ / tonne 30.81 31.20£ / GJ 2.29 2.20
* Total cost excludes any payment to the farmer for non-food crops grown on set aside land

vii
Conclusions
This work has shown that Miscanthus can be successfully grown and harvested, with reasonableyield rates and provides a suitable alternative, similar priced fuel to conventional cereal straw forpower plants such as Elean.
Operation of the Elean Power Station with Miscanthus caused no significant problems andperformance was very similar to conventional cereal straw, providing much the same electricalexport at much the same cycle efficiency.
In conclusion baled Miscanthus straw has sufficiently proven itself to burn efficiently, meet IPClimits and plant output requirements.
Anglian Straw would be happy to contract for Miscanthus in the same way as cereal straw.
1
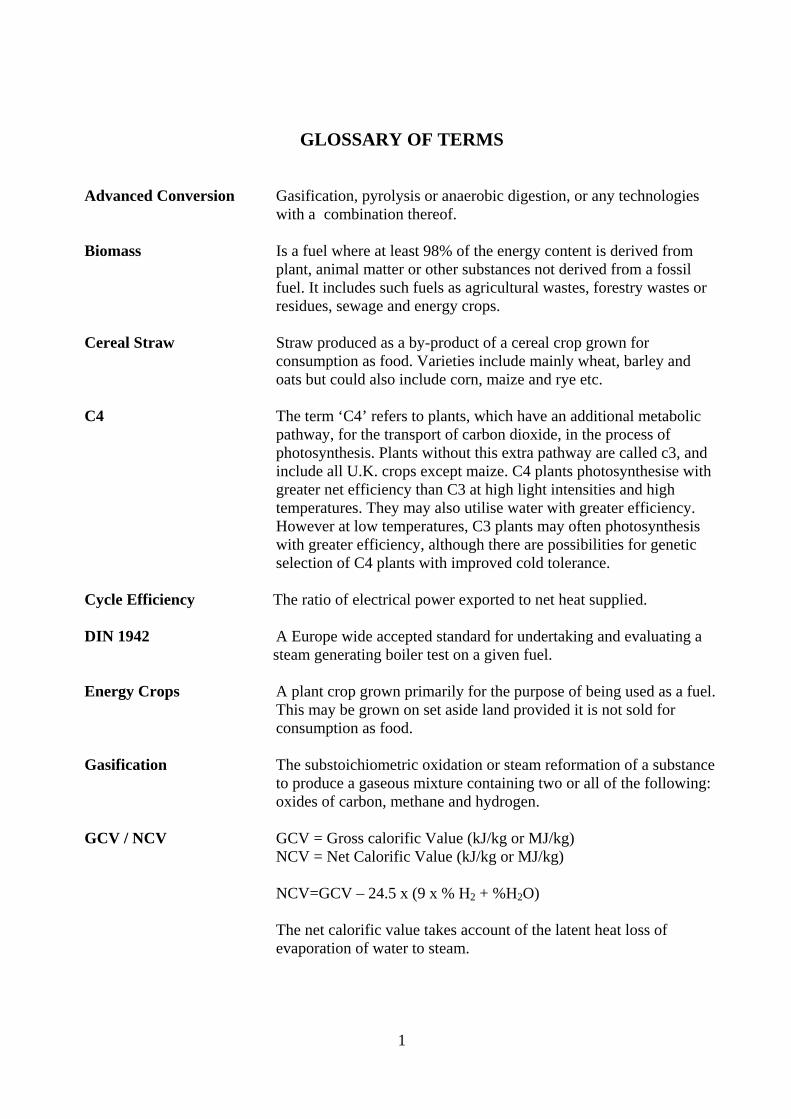
GLOSSARY OF TERMS
Advanced Conversion Gasification, pyrolysis or anaerobic digestion, or any technologieswith a combination thereof.
Biomass Is a fuel where at least 98% of the energy content is derived fromplant, animal matter or other substances not derived from a fossilfuel. It includes such fuels as agricultural wastes, forestry wastes orresidues, sewage and energy crops.
Cereal Straw Straw produced as a by-product of a cereal crop grown forconsumption as food. Varieties include mainly wheat, barley andoats but could also include corn, maize and rye etc.
C4 The term ‘C4’ refers to plants, which have an additional metabolicpathway, for the transport of carbon dioxide, in the process ofphotosynthesis. Plants without this extra pathway are called c3, andinclude all U.K. crops except maize. C4 plants photosynthesise withgreater net efficiency than C3 at high light intensities and hightemperatures. They may also utilise water with greater efficiency.However at low temperatures, C3 plants may often photosynthesiswith greater efficiency, although there are possibilities for geneticselection of C4 plants with improved cold tolerance.
Cycle Efficiency The ratio of electrical power exported to net heat supplied.
DIN 1942 A Europe wide accepted standard for undertaking and evaluating asteam generating boiler test on a given fuel.
Energy Crops A plant crop grown primarily for the purpose of being used as a fuel.This may be grown on set aside land provided it is not sold forconsumption as food.
Gasification The substoichiometric oxidation or steam reformation of a substanceto produce a gaseous mixture containing two or all of the following:oxides of carbon, methane and hydrogen.
GCV / NCV GCV = Gross calorific Value (kJ/kg or MJ/kg)NCV = Net Calorific Value (kJ/kg or MJ/kg)
NCV=GCV – 24.5 x (9 x % H2 + %H2O)
The net calorific value takes account of the latent heat loss ofevaporation of water to steam.

2
GSA This is a ‘Gas Suspension Absorber’ a specific type of acid gascleaning system used at the Elean Power Station. It is capable ofboth dry and semi-dry scrubbing of acid gases (SOx and HCl).
Hay Straw from a non-cereal based product.
Hesston Bale A rectangular shaped bale of any given product having the followingdimensions:Max 1.28 x 1.33 x 2.50 metresMin 1.22 x 1.27 x 2.25 metresDensity 125-145 kg/m3
Loss on Ignition Weight loss of combustible material in an ash sample
MCR Maximum Continuous Rating; this refers to the level of any plantcriteria when operating at full output. e.g., steam flow, fuel flow, airflow etc.
MWe Electrical Energy
MWth Thermal Energy
Photosynthesis Synthesis of organic compounds in green plants from water andcarbon dioxide using energy absorbed from sunlight withchlorophyll.
Pyrolysis The thermal degradation of a substance in the absence of anyoxidizing agent (other than that which forms part of the substanceitself) to produce char and one or both of gas and liquid.
Set Aside Land designated as ‘set-aside’ from food crop cultivation, for whichthe farmer has received an EU subsidy.
Straw Specific Fuel The fuel quantity required to produce 1kW of electricity; kg/kW,Consumption expressed as:
Fuel flow (kg/h)(100-% Nat Gas)/100*Exported kW/h
Where % Natural gas is % of thermal energy supplied
Triticale A common hardy hybrid variety of wheat and rye.
Vegetative Growth of plants by production of leaves, stems and roots prior tothe formation of reproductive organs.

3
CONTENTSPage
EXECUTIVE SUMMARY
Project Objectives .................................................................................................................... i Background.............................................................................................................................. i Summary of Work.................................................................................................................... i Modifications ........................................................................................................................... i Production of Miscanthus ........................................................................................................ iii Combustion Test Results ......................................................................................................... v Conclusions..............................................................................................................................vii
GLOSSARY OF TERMS.......................................................................................................... 1
1.0 What is Miscanthus? ..................................................................................................... 7
2.0 The Elean Power Station ................................................................................................ 10
2.1 The Process ....................................................................................................................... 102.2 Design Plant Performance................................................................................................. 142.3 Impact on Straw Production ............................................................................................. 14
3.0 Power Station Modification ........................................................................................... 15
3.1 Options Considered........................................................................................................... 153.2. Summary of considerations .............................................................................................. 163.3. Consents............................................................................................................................ 183.4. Modifications .................................................................................................................... 18
4.0. Establishment of Miscanthus ......................................................................................... 19
4.1 Site details......................................................................................................................... 194.2. Details of seed and site preparation .................................................................................. 194.3. First Phase of Planting ...................................................................................................... 204.4. First Phase of Miscanthus Establishment and Growth Characteristics............................. 214.5. Second Phase Preparation and planting ............................................................................ 214.6. Plant Growth and development......................................................................................... 214.7 Bio Diversity..................................................................................................................... 284.8 Discussion......................................................................................................................... 29
5.0. Harvesting, Baling & Storage ........................................................................................ 31
5.1 Yield Rates........................................................................................................................ 325.2 Material Handling Trial .................................................................................................... 32
4
6.0 Combustion Trial - Fuel Data ........................................................................................ 37
7.0. Combustion Trial ............................................................................................................ 39
7.1. Test Procedure ................................................................................................................. 407.2. Sampling and Recording................................................................................................... 407.3. Test Results....................................................................................................................... 447.4. Comments ......................................................................................................................... 46
8.0 Plant Performance .......................................................................................................... 47
8.1 Energy Balance ................................................................................................................. 478.2 Plant Emissions................................................................................................................. 478.3 Ash Details........................................................................................................................ 53
9.0 Financial Implications .................................................................................................... 55
9.1 Straw Supply..................................................................................................................... 559.2 The Price of Straw ............................................................................................................ 55
10.0 Comments and Conclusions ........................................................................................... 58
10.1 Agronomy ......................................................................................................................... 5810.2 Combustion Trial .............................................................................................................. 5910.3 Assessment........................................................................................................................ 59
REFERENCES............................................................................................................................ 62
APPENDICES
A1 Layout of Trial Plot at Witcham, Mepal........................................................................... 64A2 General Grower Guidelines .............................................................................................. 65A3 General Comparison of Fuels ........................................................................................... 66A4 Normal Operating Details of Ely Power Station............................................................... 67A5 Plant Instrumentation ........................................................................................................ 69A6 Test Procedures................................................................................................................. 70A7 Overall Steam Cycles and Efficiency ............................................................................... 72A8 Plant Emissions................................................................................................................. 75A9 Details of Sub-Contractors................................................................................................ 78A10 Key Staff ........................................................................................................................... 79

5
INDEX OF TABLES
Table 4.2 Rhizome weight variation ..................................................................................... 20Table 4.6.1 Growth Characteristics.......................................................................................... 22Table 4.6.2 Wheeling Affects on Stem Height ........................................................................ 26Table 4.6.3 Changes in Stem Height in individual Plots in 2002 ............................................ 26Table 4.6.4 Assessment of Rhizomes ...................................................................................... 28Table 4.6.8 The Abundance of various Weeds in the field in Spring 2001 ............................. 30Table 5.1 Yield Rates............................................................................................................ 32Table 5.2.2 Comparison of Handling Power Requirements .................................................... 36Table 6.1 Summary of Straw Supplied ................................................................................. 37Table 6.2 Analytical Results of Straw Samples.................................................................... 37Table 6.3 Mixed Solid Fuel Analysis, as fired...................................................................... 38Table 7.3 Test Results........................................................................................................... 44Table 8.2 Emission Test Results ........................................................................................... 47Table 8.2.1 SO2 & HCl Emissions........................................................................................... 49Table 8.2.2 Particulates Emissions. ......................................................................................... 49Table 8.3 Ash Analysis, by weight ....................................................................................... 53Table 9.1 The Price of Straw ................................................................................................ 56Table 10.1 Overall Cost of Straw by Weight & Energy Supplied.......................................... 59
INDEX OF FIGURES
Figure 1 Miscanthus ............................................................................................................ 7Figure 2 Pattern of Branching in the growth of Rhizomes.................................................. 8Figure 3 EPR Ely, Straw Fired Power Station .................................................................... 9Figure 4 Combustion System .............................................................................................. 10Figure 5 Seasonal Variation in Straw Consumption and Export Power ............................. 11Figure 6 Seasonal Variation in Straw Moisture and plant Efficiency................................. 12Figure 7 Overall Process Flow Diagram ............................................................................. 13Figure 8 Reinforced Transfer Conveying System............................................................... 17Figure 9 Cross Conveyor and Scarifier ............................................................................... 17Figure 10 Miscanthus plot at Witcham. ................................................................................ 19Figure 11 Original Planting and Replanted growth after 2 Years......................................... 22Figure 12 Miscanthus growth Rate ....................................................................................... 23Figure 13 Changes in Stem Density between 2000 and 2002............................................... 24Figure 14 Stem Production Following Harvest Operations .................................................. 25Figure 15 Changes in Stem Height between 1999 and 2000 ................................................ 25Figure 16 Effect of Water Logging on Stem Growth in 2001............................................... 27Figure 17 Examples of Rhizomes planted at Witcham ......................................................... 28Figure 18 Unloading of Miscanthus into the West Barn....................................................... 33Figure 19 Un-sheeting of a Miscanthus Delivery ................................................................. 39Figure 20 Collected Fuel Sample .......................................................................................... 42Figure 21 Miscanthus – Ready for Transfer.......................................................................... 42Figure 22 Crane Transfer from Barn to Conveyor ................................................................ 43

6
Figure 23 Bag Filter System and Gas Suspension Absorber ................................................ 51Figure 24 Power Output and Oxygen Level.......................................................................... 52Figure 25 Straw Emissions, referenced to Limits ................................................................. 53Figure 26 Straw Cost Variations with Moisture Content ...................................................... 56Figure 27 Variation in Straw Consumption with Moisture Content ..................................... 57Figure 28 Overall System Diagram....................................................................................... 73Figure 29 Summary of Plant Emission Levels...................................................................... 76

7
1.0 What is Miscanthus
Miscanthus, sometimes called ‘elephant grass’, is a woody perennial that can be harvestedannually. Because of its efficient photosynthesis mechanism, it has a higher yield potential thanmost other plant species grown in the UK with yields up to 10dt/ha. The crop takes approximately3 years to mature in the UK and yields do not reach an optimum until this point. It is alsoconsidered to have a low nutrient requirement and relatively low moisture content on harvest,when compared with conventional cereal straw.
Figure 1. Miscanthus (ref: Wood Fuel Now, Oct 1993)
Miscanthus is a genus of woody, perennial grass that originated in South-East Asia. The rhizomesmake up a highly branched storage system and the roots usually penetrate at least a meter into thesoil. Even though much of the below ground growth takes place in the first year, the crop usually

8
does not reach maturity until after two or three years. This crop does not make many demands onthe soil and therefore is usually able to grow on different types of land.
There are 14 species within the genus Miscanthus (Hodkinson et al 1997), it is indigenous to Asia,geographic range from 50oN in North Eastern Siberia to Polynesia 22o and west to Kashmir andNepal. Four species are found in Africa (Hodkinson et al 1997).
The grass has woody stems that die back in winter and in spring new growth is regenerated frombuds on underground rhizomes. In the UK and continental Europe most of the research has centredon M. giganteus. This is a naturally occurring interspecific triploid (N=57) hybrid between M.sacchariflorus and M. sinensis. M. giganteus is sterile and requires vegetative propagation togenerate plant stocks. It possesses the C4 photosynthis pathway that makes it more efficient in theuse of nitrogen and water than many temperate cereals and grasses (Brown 1978). Stems elongatevery rapidly reaching 2-3 m in height in mature plants, taking several years to reach optimumyield.
A few varieties of M. sinensis have been evaluated, mainly in Europe. This species is a tuftedperennial and stems grow 1-2m. It is a flowering species producing an attractive flower like plume.Seeds can be fertile but present a very low level of establishment because they cannot ordinarilysurvive the winter conditions. However, M. sinensis is considered to be better adapted to coolerconditions than M. sacchariflorus.
Figure 2. Pattern of Branching in the growth of Rhizomes (Rutherford 1992)

9
Fig
3E
PR
Ely
, Str
aw F
ired
Pow
er S
tati
on
10
2.0 The Elean Power Station
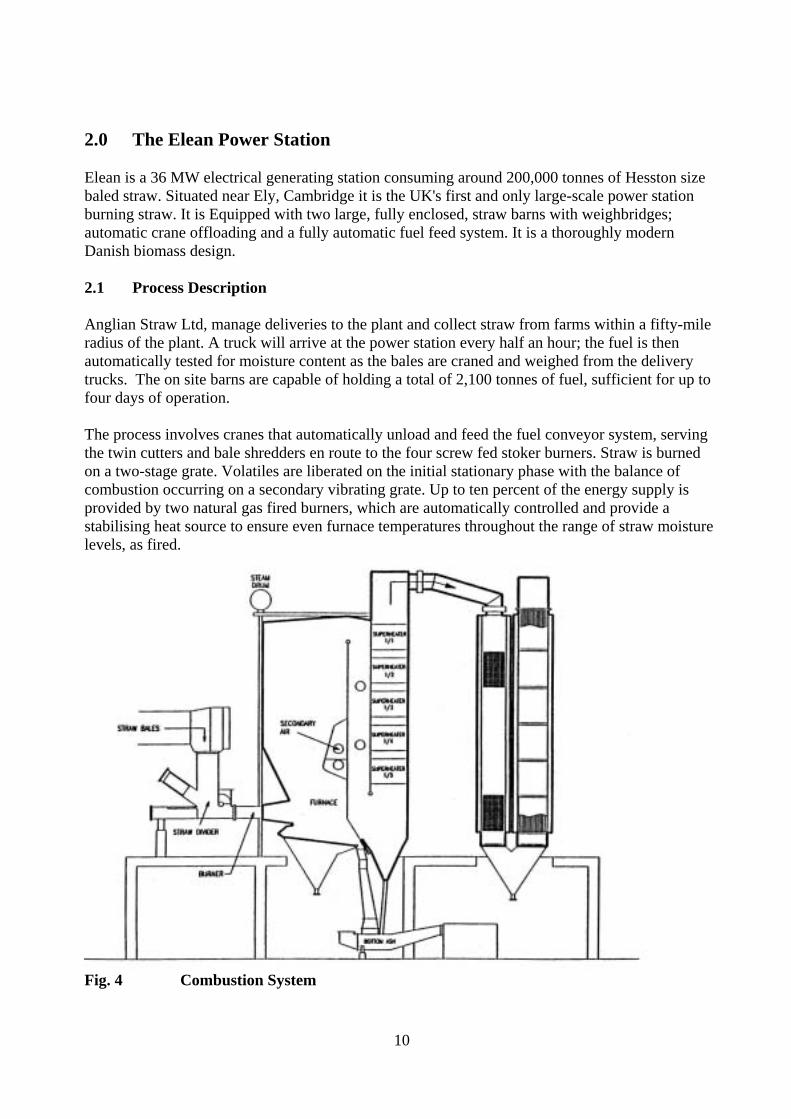
Elean is a 36 MW electrical generating station consuming around 200,000 tonnes of Hesston sizebaled straw. Situated near Ely, Cambridge it is the UK's first and only large-scale power stationburning straw. It is Equipped with two large, fully enclosed, straw barns with weighbridges;automatic crane offloading and a fully automatic fuel feed system. It is a thoroughly modernDanish biomass design.
2.1 Process Description
Anglian Straw Ltd, manage deliveries to the plant and collect straw from farms within a fifty-mileradius of the plant. A truck will arrive at the power station every half an hour; the fuel is thenautomatically tested for moisture content as the bales are craned and weighed from the deliverytrucks. The on site barns are capable of holding a total of 2,100 tonnes of fuel, sufficient for up tofour days of operation.
The process involves cranes that automatically unload and feed the fuel conveyor system, servingthe twin cutters and bale shredders en route to the four screw fed stoker burners. Straw is burnedon a two-stage grate. Volatiles are liberated on the initial stationary phase with the balance ofcombustion occurring on a secondary vibrating grate. Up to ten percent of the energy supply isprovided by two natural gas fired burners, which are automatically controlled and provide astabilising heat source to ensure even furnace temperatures throughout the range of straw moisturelevels, as fired.
Fig. 4 Combustion System

11
Flue gases pass through an economiser and are neutralised by lime injection prior to their passagethrough a bag filter to remove particulates and acid gases. The resultant fly ash is rich in potassiumand phosphate salts and is the basis of an organic fertiliser.
The boiler plant is a high temperature and high-pressure water tube design. A two second residencetime at temperatures in excess of 850°C is maintained to ensure complete combustion and toensure the destruction of dioxins and furans. Steam from the boiler is superheated to 520°C and 92bar. The superheated steam flows to a high efficiency two stage-condensing turbine. The low-pressure turbine exhaust steam is then cooled and condensed in an air-cooled condenser unit. Thisunit operates under vacuum at an average 70mbar varying 50 to 90mbar, winter to summer,controlled by the ambient air temperature
Electricity is generated at 11,000 volts, some of which is used to run the in-house Power Stationload (for fans and pumps etc), the remainder is sent to a step up transformer for export to the gridat 33,000 volts. The parasitic, in-house load is less than 3MW and the export capacity is 36MW,varying 32 to 38 from summer to winter.
The plant is expected to operate for around 8000 hours (91.3% of the year), allowing time forannual maintenance and further unplanned outage. The plant efficiency was planned to be between32.0% in the winter and 32.2% in the summer. This assumed that the average moisture content ofthe Straw was 16%, ash content of 6.9% and a calorific value of 14MJ/kg and that a maximum of10% of the combustion energy was from Natural Gas.
The following graphs, Figures 5 and 6, show the actual operational data for the year April 2001 toMarch 2002. This period covered the first year of operation from start-up.
Fig 5 Seasonal Variation in Straw Consumption and Export Power
0
50000
100000
150000
200000
250000
APR. MAY JUNE JULY AUG. SEPT. OCT. NOV. DEC. JAN. FEB. MAR.
Month (2001/2002)
Str
aw
In
pu
t /
GJ
of
En
erg
y
0
5000
10000
15000
20000
25000
30000
Ele
ctri
city
Gen
erat
ed /
GW
Straw Input Electricity Output

12
27
28
29
30
31
32
33
34
35
36
APR.
MAY
JUNE
JULY
AUG.
SEPT.
OC
T.
NOV.
DEC.
JAN
.
FEB.
MAR.
Month (2001/2002)
Pe
rcen
tag
e P
owe
r S
tatio
n E
ffici
ency
14
14.5
15
15.5
16
16.5
17
17.5
18
18.5
19
Pe
rce
ntag
e M
ois
ture
Co
nten
t
% Efficiency % Moisture
Fig 6 Seasonal Variation in straw Moisture and plant Efficiency

13
Fig
7O
vera
ll P
roce
ss F
low
Dia
gram

14
2.2 Design Plant Performance
During June and July 2000 the Ely Power Station began receiving conventional Hesston bales andundergoing commissioning. It began the final stages of reliability and performance testing early in2001.
The Power Station passed its MCR (Maximum Continuous Rating) test and achieved a significantlevel of efficiency above design, from 32% design value to 35% overall when firing with the full10 percent natural gas.
Despite the supply problems caused by extreme wet weather in its first year, the power stationcontinues to operate at full power, exporting electricity for over 8,000 hours per year at anavailability of + 91.5%.
2.3 Impact of Plant on Cereal Straw Production
The quantity of cereal straw produced per year around the Ely Power Station prior to constructionwas:
25 mile radius approximately < 700,000 tonnes
75 mile radius approximately <4,000,000 tonnes
Three quarters of this straw was baled.
Prior to the power station around 80% of the straw was used as livestock bedding. The 200,000tonnes of baled straw used at the power station has reduced this figure to 75% and has had,otherwise, little impact on the overall straw market. It is hoped that the introduction of miscanthuswill help to redress this small change.

15
3.0 Power Station Modification
To provide a suitable miscanthus fuel supply in a form that can be readily accepted and easilyburned required the fuel to be processed in some way prior to delivery to the Power Station.Two possibilities for introducing miscanthus into the facility were evaluated. The first possibilitywas to modify the plant allowing it to accept chopped miscanthus. The second option was tomodify the plant to allow it to accept the extra weight of a large number of Miscanthus bales. Foreither option it was important that the modifications would prevent damage and not restrict theplant.
3.1. Options considered
The two ways of introducing Miscanthus into the facility were considered according to the form inwhich the material was to be presented, i.e., chopped or Hesston baled. Both methods wereconsidered, designed and priced as suitable alternatives.
CHOPPED MISCANTHUS
The scope of this design extended beyond the horizon of just miscanthus; the provision of acomplete facility for the acceptance of a chopped fuel would make it available for a number ofother fuels such as wood chips and processed fuels such as RDF.
The chopped fuel design required the provision of a covered loading area with a 100m3 capacitystorage pit, to provide capacity at weekends and periods of no delivery. Once in the pit, ahorizontal auger will convey the fuel onto a series of elevating conveyors to a balancing silo (dayhopper) located above the main straw feed system. From this silo, metered volumes of fuel will befed into the central straw feed lines and into the combustion system via interlocked air sealed firedampers.
The additional building required to house the loading area and storage pit required a significantchange to the Planning Consent, which would present an unacceptable time delay to the projectand add to the cost.
The capital cost to provide this system in its entirety was very expensive and close to the originalbudget of £1.2m. This would have left no money to complete the rest of the miscanthus work. Thisoption was thoroughly investigated, however, but in light of the considerations outlined in section3.2. ; it was decided that the project would not go ahead with this system.
BALED MISCANTHUS
This option assessed the requirements and cost benefits of integrating baled Miscanthus into theexisting straw feed system. In order to achieve satisfactory operation, the design of the entire strawfuel handling system, from reception and storage to the furnace, had to be modified. This wasrequired to accommodate the fundamental physical differences between Miscanthus and cerealstraw, i.e., the material bulk density and its abrasion characteristics.

16
The crane system and feed conveyor designs required up rating from the 650kg cereal straw balemaximum to accommodate a possible 850kg Miscanthus bale. The structures were stiffened andhigh specification bale breaking screws were incorporated to mitigate the possible affects ofincreased material abrasion.
This design did not require any special planning revisions and the capital cost to achieve thismodification was £190k.
3.2. Summary of considerations
Both options for plant modification were investigated thoroughly, with the advantages anddisadvantages of each being considered. There were several key factors that were deemed to beimportant in choosing the most appropriate modification option. These included: the efficient useof storage, transport costs, ease of handling, impact on power plant and firing techniques, impacton control systems and fouling potential and perhaps most importantly financing options.
It was agreed that on site farm storage of bales would be easier and utilise existing straw basedequipment. Storage of chopped miscanthus on a farm would be difficult, it would take up valuableland space, require covering to prevent a wind blown nuisance and protect it from heavy rainfall.
A different high-sided road transport vehicle would have to be used to carry a load of lowerdensity. Transport cost for chopped miscanthus would therefore be much more expensive.
By moving miscanthus in bales and firing as such into the main bale burners, any combinationbetween 0 and 100% firing of miscanthus could be theoretically achieved. The chipped fuel optionwould be limited to a maximum of 25% due to the existing furnace feed design.
The control system and flame protection systems for an independent chopped fuel feed supplywould be much more complicated and obtaining even combustion rates across the furnace couldnot be guaranteed. With the potential for slagging and fouling any localised high temperature zonecould prove detrimental to plant performance and availability.
Evaluation of the miscanthus combustion trial was considered to be much easier with directcomparison made between baled straw and baled miscanthus. Particularly if straw can be storedand fired from one barn whilst miscanthus is stored and fired from the other barn.
The most important point in the selection of the feed system for miscanthus is that of finance.EPRL cannot currently obtain clearance from our bank, within the timescale available, for theprovision of an extra £1.2 million, unless the market for chopped miscanthus is proven to beestablished. As demonstrating an establishment of the market is partly the purpose of the projectthis requirement clearly cannot be met.

17
Fig 8 Reinforced Transfer Conveying System
Fig 9 Cross Conveyor and Scarifier

18
In light of these considerations it was decided that the project would go ahead with baled system.The designs and costing for the chipped system has been retained should the market for choppedmiscanthus change or if finance a more achievable goal.
Modifications for reception, transport and introduction of baled miscanthus into the combustionprocess with modifications to the crane and feed system, to allow denser, heavier Hesston baleswere implemented in time during the last phase of construction of the Power Station.
3.3. Consents
The design for taking chopped miscanthus, as an alternative fuel source, had to be fully integratedwith the main plant facility including the civil engineering implications, overall site layout andvehicle movements. This information was submitted to the local Planning Authority, EastCambridge District Council, for approval in mid June 1999.
Planning approval was granted without any additional conditions for the change to plant layout andfor the use of baled miscanthus, provided current emission limits were met.
3.4. Modifications for the Baled System
The plant design was modified in the spring of 2000 to accommodate heavier Miscanthus balesand included:
Upgrade of cranes and associated equipmentUpgrade of conveyors and stiffening of steelworkSmart card system to differentiate bales of Miscanthus (allowing greater flexibility)Upgrade of weighbridge
This new arrangement allows for miscanthus in baled form to be directly fired into any of theexisting four bale burners without adversely affecting combustion or output of the plant.

19
4.0 Establishment of Miscanthus
4.1 Site details
An appropriate field was selected to hold the trial plot. It is situated on the outskirts of the villageof Witcham, towards the village of Mepal, in Cambridgeshire. The field is in an ideal location as itadjoins the site of the Elean Straw Burning Power Station.
The field is 12hectares in total and had been in continuous wheat production for a number of years.2 hectares of the field was set aside for the Miscanthus field trial. The soil type is a clay loam, fromwhich the usual spectrum of agricultural broad-leaved weeds, couch grass and some wild oats wereexpected.
Figure 10 Miscanthus Plot at Witcham, Showing Ely Power Station In theBackground (after 2nd phase of planting)
4.2 Details of seed and site preparation
Preparation of the site took place at the end of May 1999. The existing wheat crop was cut andbaled for silage in order to remove all the green material that could hamper planting.
The soil was dry, as there had been very little rainfall in the preceding weeks. Moistureconservation was, therefore critical, particularly as it was late in the season for miscanthusplanting.
The soil was disc harrowed five times in alternate ways in order to create some tilth. Themiscanthus rhizomes needed to be in contact with fine soil particles to maximise take up ofavailable moisture. The site was then power harrowed and rolled using a Cambridge ring roll.

20
The rhizomes were supplied by BICAL and were of the Giganteus variety. The rhizomesoriginated from the Dominican Republic and had been refrigerated en route from abroad and instorage in the UK. MAFF phytosanitary requirements for cleanliness and contamination wereadhered to. The weights of the rhizomes were extremely variable. A random sample of 27rhizomes saw a variation in weight of 1 to 60g (Table 1). The average weight of the rhizome was17.1g, and the majority of rhizomes weighed within the range 1 to 20g.
Table 4.2 Rhizome weight variation
Rhizome Weight1-10g 10-20g 20-30g 30-40g 40-50g 50-60g
8 18 22 37 6010 15 26 587 13 2510 1710 206 119 187 144 161 136
A further sample of 48 pieces was checked for size and number of buds. The mean length was140.8mm (range 21-373mm), with a mean diameter of 7.8mm. The average rhizome and numberof buds per rhizome was 1.88. No link could be observed between length of rhizome and numberof buds present on the piece. There was on average 1.46 branches per piece, 42% wereunbranched.
4.3. First Phase of Planting
Planting took place in May 1999, with a seed rate of 2.5 rhizome/m2 or 25000 rhizome/ha. A reardischarge, hydraulic floored muck spreader was used to plant the rhizomes, calibrated to spread therequired seed rate. Calibration was calculated using the forward speed, width of spread and speedof the floor given that a box contained 400 rhizomes. The floor slatting was set at 300mm,although the recommended rate was 500mm. Gearing was adjusted at alter the bed speed tocompensate.
The speed rate varied between 2 to 2.5 rhizomes/m2. This was measured by checking plant densityin three positions behind the spreader:
1. Immediately behind the centre line2. 1.5m from the left wheeltrack3. 1.5 m from the right wheeltrack
After each pass of the spreader the rhizomes were ploughed into a depth of 10cm using a sevenfurrow shallow plough, in order to prevent them drying out. The time period between spreading

21
and ploughing in was between 30 – 45 minutes. The soil was then rolled immediately to furtherconserve soil moisture. The previous soil cultivations made it difficult to maintain direction anddepth of ploughing. This has created some patches of unevenness in the tilth around the field trial.Inevitably some ends of rhizomes are left exposed.
At planting the weather conditions were 16 – 18°C, sunny with overcast periods, windy, gooddrying conditions. Within 5 days of planting 37mm of rain had fallen soaking the soil to a depth of10cm.
4.4. First Phase of Miscanthus Establishment and Growth Characteristics
Monitoring from between 45 and 164 days after planting identified an emergence that continued tobe patchy with some plants up to 70mm tall, with many others less than half this height. Theachieved establishment was therefore not as good as originally anticipated. The crop was sparseand would require several years to increase density sufficiently to cover the whole of the field.Plant population was not evenly spread and there were areas where no plants existed. The overalleffect was unsatisfactory.
The plot had long suffered from inquisitive grazing, by hares that were attracted to the youngplants and new shoots. Weeds were recognised as a problem but their treatment at this stage wasdeemed unnecessary since winter was approaching they would die down naturally and those thatdidn’t would help to provide some protection from frost and snow.
Growth had been good in some places, patchy in others with little or no growth in the remainingareas. The main areas for concern were the centre of the field and the competition from weeds. Itwas agreed, therefore, that the whole plot would be re-established with new rhizomes and BICALwere asked to replant using best available practice for site preparation and planting.
4.5. Second Phase Preparation and planting
Preparations were started early during this second phase to ensure better planting conditions. Theweed killer Gramoxone and a 17.17.17 (N:P:K) fertilizer was applied 6 weeks prior to replanting;the field was cultivated and more rhizomes planted. Replanting was undertaken in May 2000, at aplanting rate of approximately 3 rhizomes/m2, with a shallow plough 2-4 inches deep. Individualrhizomes averaged 84 mm in length and weighed an average of 29g. Following replanting the landwas rolled, with a tractor on terra tyres, which tended to compact the soil surface.
Grower guidelines were produced by BICAL that provided the basis for the growing and tendingregime (Appendix 5).
4.6. Plant Growth and Development
Early growth (June and July 2000) was successfully established and the field was in better shapeoverall than in the previous year. Rainfall was high over the spring, which may have affectedgrowth. The plant population was about 0.5 plants/m2 and was variable over the site.

22
A method of recording growth was established whereby the three plots previously established, toprovide continuity to the assessments, were re-established in the same places. These plots were setat a stagger across the field (Appendix 1) and measurements were made randomly on plants withinthe plots. In 2001 and 2002 marked plants were used throughout the growth period.
Progress between July and September 2000 was encouraging, all plants looked healthy andvigorous with no evidence of disease. There was no significant change in the number of plants butshoot height had increased from 39cm to 100cm, an average of 0.9 cm per day. Some fullyemerged leaves were more than 100cm in length and 2.5 cm wide, at mid leaf point, with manyyoung shoots present.
There were still bare patches in the field; with the main areas of concern being the centre of thefield, the northern edge along the hedge and the main entry point of the field. There were still someun-germinated rhizomes half submerged and lying on top of the soil in these bare patches. Somewere plants still emerging, but the majority were in the range of 1.0 – 1.5 m tall.
Table 4.6.1 Growth Characteristics
Date of Measurement July 22nd September 27th
Plants m2 0.33 0.33Shoots m2 0.56 3.68Height cm 39.1 100.4
Figure 11 Shows Original Planting and Re-Planted Growth after 2 years(Yardstick shown is to a height of 1.35m)

23
0
50
100
150
200
250
300
350
0 50 100 150 200 250 300 350 400 450 500 550 600
Days After Planting
Ave
rag
e S
tem
Hei
gh
t cm
Fig 12 Miscanthus Growth Rate
4.6.1 Stem density.
Between spring 2000 and 2002, stem density increased more than 90-fold. The largest increase wasin 2001 and 2002 (Figure 13). Each year shoots emerged mainly in the spring and early summerperiod. In 2002, there was a higher stem number at the beginning of spring growth than at the endof the previous growth period.
Effect of wheeling on stem number.
In spring 2002, plants that had been either wheeled or unwheeled during earlier harvestingoperations were marked and monitored during the growth period. Shoot emergence and stems perplant were unaffected by wheeling and remained so throughout the growth period (Figure 14).

24
Fig. 13 Changes in stem density between 2000 and 2002.
4.6.2 Stem height.
Height measurements made before 28th June 2000 were to the peak of the leaf curve of the lastexpanded leaf. Subsequently measurement was to the collar (ligule) of the last expanded leaf. Thechange was made due to leaf movement on the windy site.
Stem height increased every year reaching over 2m in 2001 and 2.4m in 2002. Stem elongationwas rapid every year except 1999 (Figure 15). In the earlier years many stems did not growvertically probably because there was little between-plant competition but by 2001 decumbentstem growth had almost ceased.
Measurement to the collar understates stem height and actual height of stems can be estimated byadding 50cm to values given in the figures and tables. In 2001 and 2002, some stem heights wereeven greater because flowers emerged (Figure 17).
0
5
10
15
20
25
15/03/00
23/06/00
01/10/00
09/01/01
19/04/01
28/07/01
05/11/01
13/02/02
24/05/02
01/09/02
10/12/02
20/03/03
Date
Ste
ms,
m-

25
Fig 14 Stem production following harvest operations.
Fig.15 Changes in stem height between 1999 and 2002.
Effect of wheeling on stem height, 2002.
The average height for unwheeled and wheeled plants was similar on two of the three plots and onplot 3 an interaction with water logging may have affected growth (Table 4.6.2).
0
50
100
150
200
250
Year
Ste
m h
eig
ht,
cm
1999
2000
2001
2002
������������������������������������������������������������������������
����������������������������������������������������������������������������������������
��������������������������������������������������������������������������������
����������������������������������������������������������������������������������������
������������������������������������������������������������������������
0
10
20
30
40
50
60
70
20-Apr 15-May 13-Jul 24-Aug 28-Oct
2002
Ste
ms p
er
pla
�����Unw heeled
Wheeled
26
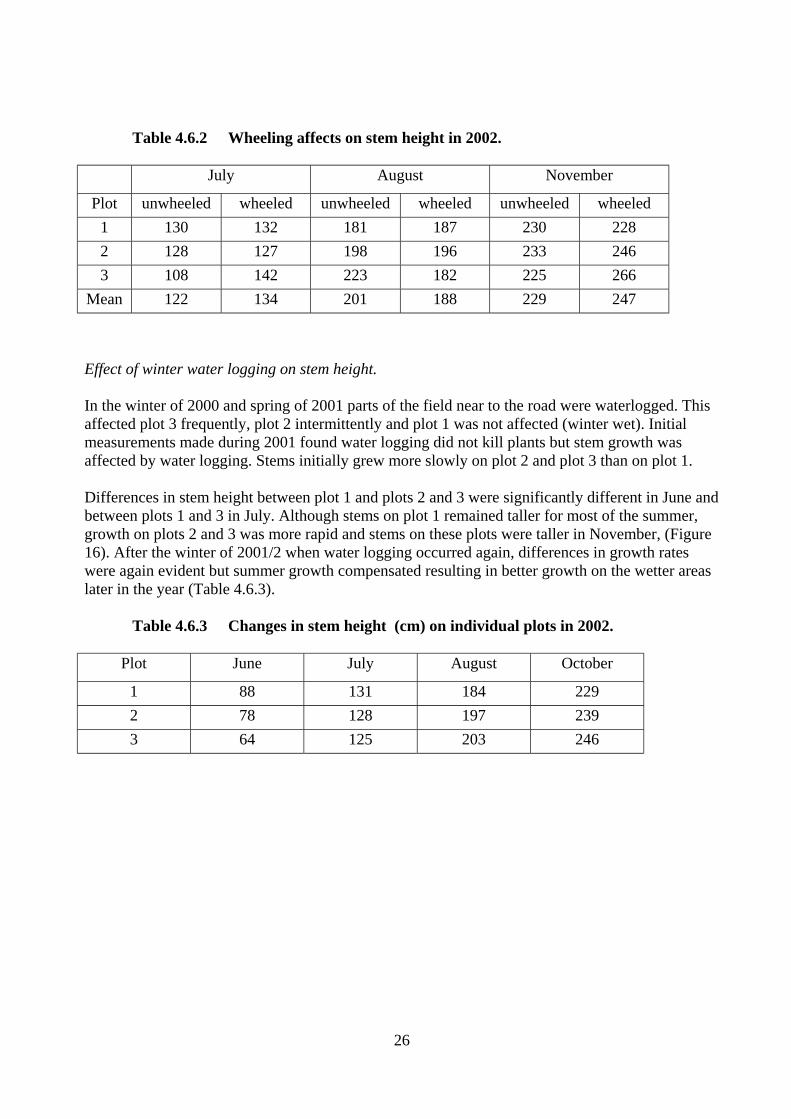
Table 4.6.2 Wheeling affects on stem height in 2002.
July August November
Plot unwheeled wheeled unwheeled wheeled unwheeled wheeled
1 130 132 181 187 230 228
2 128 127 198 196 233 246
3 108 142 223 182 225 266
Mean 122 134 201 188 229 247
Effect of winter water logging on stem height.
In the winter of 2000 and spring of 2001 parts of the field near to the road were waterlogged. Thisaffected plot 3 frequently, plot 2 intermittently and plot 1 was not affected (winter wet). Initialmeasurements made during 2001 found water logging did not kill plants but stem growth wasaffected by water logging. Stems initially grew more slowly on plot 2 and plot 3 than on plot 1.
Differences in stem height between plot 1 and plots 2 and 3 were significantly different in June andbetween plots 1 and 3 in July. Although stems on plot 1 remained taller for most of the summer,growth on plots 2 and 3 was more rapid and stems on these plots were taller in November, (Figure16). After the winter of 2001/2 when water logging occurred again, differences in growth rateswere again evident but summer growth compensated resulting in better growth on the wetter areaslater in the year (Table 4.6.3).
Table 4.6.3 Changes in stem height (cm) on individual plots in 2002.
Plot June July August October
1 88 131 184 229
2 78 128 197 239
3 64 125 203 246

27
Fig. 16 Effect of winter water logging on stem growth in 2001
4.6.3 Weed Control.
The short time available in 1999 to remove the previous crop and cultivate the soil before plantingprevented adequate preparation of the field to minimise weeds. After planting, a wide range ofbroad-leaved weeds germinated as well as patches of grasses. In 2001 a springtime assessmentshowed the range of broad-leaved weeds present (Table 4.8). The weed flora is typical of fieldsunder arable crop management.
The majority of the weed species are annual or biennial but the presence of elder, a deciduousshrub of woodland and hedgerows, established because no harvesting had, so far, taken place.Weeds in the area subjected to winter water logging were less than elsewhere. Weeds have been agreater problem at the site than would normally be the situation in a Miscanthus crop. In a cropwith a normal spatial distribution of plants, weeds would be out-competed by the rapid growth ofthe crop and shading created by the tall canopy. Surface litter from shed leaves would alsocontribute by the suppressing of weed germination.
4.6.4 Rhizome assessment
A rhizome assessment was carried out during this period. Six rhizomes were dug from randompoints in the field. The plants were selected as single stand plants. Rhizomes were washed toremove soil and weighed to obtain fresh weight. Four plants were dried in an oven at 80°C and dryweight determined. Two plants were kept whole, the number of shoots was counted ant therhizomes were photographed. The purpose of this assessment was to establish the rhizome size andweight one growing season after replanting. Thirty pieces of rhizome were also measured at thetime of replanting.
The assessment was made with caution as the rhizomes dug were of two different ages (1999 &2000) but it did give a general indication of how much the rhizomes had grown during the year.
0
50
100
150
200
250
Winterw aterlogging
Intermittentw aterlogging
Winter w et
Winter condition
Ste
m h
eig
ht,
cm
30-Jun
21-Jul
18-Aug
06-Oct
10-Nov

28
Table 4.6.4 Assessment of Rhizomes
Rhizome Fresh weight (g) Dry weight (g) Moisture %1 734.9 155.7 78.82 321.3 73.1 77.23 463.4 102.4 77.84 232.2 47.5 79.55a 147.6 - -6a 689.2 - -
MEAN 431.4 94.7b 78.3b
a photographed plants b average of 4 plants
The average rhizome weight at replanting was28.8g (ranging 7 to 58.9), compared with theoriginal planting weight of 17.1g (ranging 1 to 60g). The above table indicates a growth in bodyweight of up to 15 times, which would be expected given the increase in shoot density and heightover the same period.
4.7 Bio-diversity.
The field has provided a habitat for a number of different animals and birds. Hares were frequentlyseen in the field in the first 2 years. None have been seen recently but their droppings (or possiblyrabbits) can be found. The height of the crop now makes it impossible to see more than a fewmetres in any direction. Foxes visiting the field have been reported by a person living nearby. Intwo years red-legged partridge have reared chicks in the crop and pheasants have also been seen inthe field. Their choice of the field shows that the crop could provide suitable cover for game birds
Fig. 17 Examples of Rhizomes planted at Witcham

29
except that beating through the crop would be difficult and unpleasant. Small birds and butterflieshave been abundant probably feeding on weed flowers, seeds and insects on the plants.
Animals have caused little damage to the crop; rabbits or hares have sometimes grazed tendershoots but damage stopped once stems elongate, hence damage has mainly been confined to thespring and very occasionally later when new shoots appear.
Game birds might not use the field so much if the crop was denser because birds would lack flightareas. These could be provided either within the field or around the periphery. The terms of theplanting grant for Miscanthus permits 10% of the field to remain uncropped to provide open spacethat could be used for improving biodiversity.
4.8 Discussion.
Lessons learnt at Witcham about how to plant Miscanthus rhizomes have been useful indeveloping planting strategies. Although the number of established plants was low the populationhas been maintained throughout the project. Plants have grown well and development has beencomparable to plants grown elsewhere in experimental plots. Stems per plant are similar to valuesreported elsewhere. Harvesting in 2002 created extensive wheel marks across the field that couldbe clearly seen later in the year. However plant growth afterwards was not affected.
Monitoring growth has shown that most shoots emerge in the spring and early summer except inthe planting year. The contribution to stem density from late season shoots was negligible. Lateemerging shoots may die possibly from shading in the older crop (figure 13). This growthcharacteristic means that a greater uniformity of stem size is present at harvest.
Some new shoots for the next season are evident by late summer and if they grow too much beforethe winter they are vulnerable to frost damage. However the majority of stems arise from budsdeeper in the soil and these were unaffected by frost or wheel damage and this could be the reasonwhy wheeling did not affect growth.
The fact that water logging did not kill plants is a very positive finding but soil water logging isdetrimental to harvesting operations and its timing.Water logging did affect stem growth and it was evident that differences between plots wererelated to the length of time that plants were subject to winter water logging. In 2001 and 2002,stem height was shorter at the end of the summer on the plot not affected by water logging. Thissuggests that soil water reserves were better on the other plots and supported better growth. But itmight also be a topographical effect with water draining to the area from the drier bank on whichplot 1 is situated.
Pre-planting strategies for weed control could not be carried out because of the brief periodavailable for planting after the wheat had been removed and this probably contributed to the levelof weed infestation. Also weed suppression by the crop was not very effective because of the lowplant density. The result demonstrates the value of good weed control prior to planting and theimportance of a high plant density and good spatial distribution.

30
Table 4.8 The abundance of various weeds in the field in spring 2001.
Common name Botanical name
Very abundant
Thistles Cirsium spp
Groundsel Senecio vulgaris
White campion Silene alba
Redshank Polygonum maculosa
Less abundant
Chickweed Stellaria media
Black bindweed Polygonum convululus
Cleavers (Bedstraws) Galium aparine
Spear thistle Cirsium vulgare
Occasional
Teasel Dipacus fullonum
Mayweeds Matricaria spp
Black-grass Alopecurus myosuroides
Elder Sambucus nigra
Lesser celandine and creeping buttercup Ranunculus ficaria and R repens
Common couch grass Elytrigia repens
Shepherds purse Capsella bura-pastoris

31
5.0 Harvesting, Baling & Storage
Work on this aspect of the programme was unfortunately delayed due to replanting of theMiscanthus rhizomes. It was originally hoped that the trial plot would yield 10 to 15 tonnes perhectare, sufficient for a 2-hour combustion trial, however the trial plot itself did not providesufficient Miscanthus. This difficulty was overcome by harvesting miscanthus on a variety of othersites in the area around the Elean Power Station, and the quantity required was increased to allowfor a 4-hour trial to ensure sufficient time for combustion establishment and comparison withcereal straw.
Early harvesting of these other plots was undertaken in October 2001 to provide material for ahandling trial. This was accomplished using a mower conditioner and rape swathe, with balingundertaken within a few weeks of this. The swathe left stubble that ranged from 10-20 cm tall. Theyield was confirmed between 6-9 t/ha.
There was also between 8 and 12 hectares of miscanthus available from these other sites thatprovided the additional material for a trial burn. These sites include EPRL's site at Witcham,ADAS sites at Mepal, Elton and Boxworth plus an Anglian Straw site in Peterborough. Bales werecollected on site and, if possible, stored on site in one of the adjacent barns. Fuel delivery costswere then estimated using existing data on these three sites.
While harvesting, trailers, balers and lorries used to handle straw can cause soil compaction,particularly in a wet year. Compaction can have a major impact on yield that may not be possibleto remedy in one year, leading to loss in yield for two or even three years. It was important toensure that this impact is minimised, as far as was practicable, for the trial plot as miscanthus is alimited resource that cannot be easily replaced or improved. Harvesting of the trial plot wastherefore not undertaken until soil conditions were sufficiently dry.
Harvesting for the final combustion trial was undertaken one week prior to the test. Natural overwinter desiccation with two days drying in the swathe saw bales registering 10 to 16% moisture.The method and practice adopted was the same as that for the original handling trial although theweather at the time was dry with good soil conditions to allow easier field access, operation andremoval. This can be seen from the much dryer straw produced for the combustion trial with 14%moisture compared to the handling trial at 22%.
As with cereal straw, a steel flail conditioner, in the exit chute of the mower, was used to fracturethe stalks. This was not particularly effective on Miscanthus, which is quite woody and tended toproduce long, strong lengths of material for the baler. In hindsight a second conditioner may havebeen more effective. After mowing the stubble was left at less than 10 cm.
Harvesting at the trial plot in Witcham utilised the full 2 hectares of growth, at the other sites asimilar area was utilised to give comparison in number of bales collected. Since the requirementwas for a total of around 50 tonnes it was not necessary to harvest the full areas available. The plotat Ramsey for example had around 20 ha available and could have provided all the fuel required.These other sites also had Miscanthus of different ages varying 1 to 4 years old with stem heightsvarying 2 to 4m.

32
Regardless of age or height baling was difficult because of the strength of woody materialcontained within the crop.
5.1 Yield Rates
From the various sites listed in table 5.1, 99 bales were collected of which 5 bales failed to meetthe EPR bale specification as they were out of shape with tie strings being mechanically unstable.Three of these bales were successfully re-baled but two could not. The total of 99 bales wasreduced; therefore, to 97 and these were transported directly to the power station for the fullcombustion trial.
Table 5.1 Yield Rates
Location Crop AgeApprox
CropHeight m
No. of Bales
Collected
HectaresHarvested
tonnes t/ha
EPR, Witcham 3 yr 3.3 27 2 14.54 7.3
ADAS, Mepal 1 yr 2.2 9 <2 4.85 3.0
Ramsey 1 yr 2.0 15 2 8.08 4.0
Elton 4 yr 4.0 44 <3 23.69 8.8
Willingham 1 yr ND 4 ND 2.15 ND
Totals 99 53.31
5.2 Material Handling Trial
The handling trial, using material from the first small harvest, took place on the 23rd April 2002and lasted for approximately 2 hours. The fuel provided a short-term test on the ability of thepower station to take the Miscanthus at the full 100% firing rate. Information gathered from thistrial was then used to assess the requirements for the full combustion test.
Arthur Rickward at Mepal provided thirty-two bales for the test. These included some harvested 6weeks previously and some bales that were up to two years old. The older bales were uniform inshape but of a grey, very weathered and partially composted appearance. The new Miscanthusbales were bright and light yellow in appearance, but the bale shapes were not ideal This year'sMiscanthus was baled using a swather, which resulted in longer strands of material that did notcompact sufficiently to maintain a uniform shape.
Twenty-four selected bales were loaded onto Anglian Straw transport vehicles, in the field, by asuitable bale loader. These bales were moisture checked using a Protimeter moisture probe andinspected for bale shape and unwanted inclusions such as soil and grass plus any impact from birds

33
or rats. Some soil and grass was found on a few of the older bales, taken from the top layer, butthere was no evidence of attack from birds or rats.
The vehicles were netted and taken directly to the Power Station at Ely where they were weighedand moisture readings by the plants microwave system was taken.
Moisture probe readings indicated that the moisture levels had increased significantly in the olderbales, showing an increase from 22% to 44% in some bales. There was also an obvious differencein appearance between the older and more recently baled material.
It was observed that the miscanthus bales from last year had faired better in the relatively smallstack than conventional wheat straw may have done. A three high stack of wheat straw last yearwould have lost the top two rows and some of the bottom bales due to water ingress. In themiscanthus bales only the top level of bales were lost.
Of the thirty-two bales available, eight were rejected primarily on the basis of their moisturecontent. Readings varied between 27 – 40% averaging, at approximately 30%. Twenty-four baleswere accepted, with moisture readings between 8–26%, averaging approximately 18%.
5.2.1 At the Plant
The bales were delivered to the fuel reception barn, netting removed, weighed by the craneunloading system and their moisture levels recorded. The bales were temporarily stored in the barnbefore transfer to the main conveyor track for feeding both sides of the boiler, providing short term100% Miscanthus firing.
Fig 18 Unloading of Miscanthus Bales Into the West Fuel Barn

34
During the test, which lasted for approximately two hours, there were no noticeable changes in theplant operating performance. The bales were easily picked up by the crane and easily transportedon the conveyor mechanism. There have been some problems with the conveyor when highermoisture content straw has come into the plant. The conveyor chain link will rip through thebottom part of a bale if the fuel is damp and is then unable to carry the bale forward, this was notobserved with the miscanthus bales.
As the bales moved through the plant important electric drive motors were monitored at strategiclocations along the fuel transport line. They showed no significant difference in operating powerlevels during the Miscanthus handling trial compared to straw. The older Arthur RickwardMiscanthus had been weighed following baling, prior to being stored in the field, and each baleaveraged around 800 kg weight. After 2 years storage the crane weighed these bales, including thenewer Miscanthus, at around 500kg per bale. This is much more in line with conventional straw.EPR had expected the fuel handling equipment to use more power to feed the heavier bales, butthis never materialized.
There were some problems with the more irregular shaped bales that tended to jam at bends in theconveyor system. This, however, is quite normal for out of shape bales and they were overcomespeedily and caused no significant problems.
The bale cutter (scarifier) for feeding the furnace had no problems in cutting the bales but thetorque required to do so had to be increased for bales containing the newer Miscanthus, with thicklong strands. The older material was quite brittle and easier to chop. Apart from this the scarifierworked well throughout the trial.
5.2.2 Combustion
From the scarifier the fuel, straw or Miscanthus, was blown into the furnace, just above a vibratinggrate. Miscanthus, being a denser material than straw, was expected to require a longer period ofburning on the grate. This was found to be the case in practice and so the vibration rate was sloweddown to allow the miscanthus material to burn for longer. If more time had been available somesmall adjustments to the primary and secondary air settings would have also been made.Influencing factors such as grate residence time and air settings are firstly observed by viewing thegrate, then inspecting the grate ash for unburned material and finally by laboratory analysis ofgrate and fly ashes.
During the trial the plant did not lose any output, it remained steady, generating 36MW grosspower at the turbine and exporting a net electrical power of 33 MW. The boiler drum pressure andsteam flow also remained steady indicating no appreciable difference between Miscanthus firingand straw firing.
5.2.3 Conclusions
The Miscanthus handling and combustion proving trial was reasonably successful although itwould have been useful to have used 800 kg bales rather than 500 kg. The fact that the plant iscurrently set up to burn 500kg bales is probably the reason that the fuel firing rate and fuel to airratios did not need changing to any significant degree.

35
Long hard pieces of miscanthus should in some way be broken into more manageable sizes prior tobaling if the full bale shape and density is to be obtained.
There were no problems encountered with the loading and delivery of the bales of miscanthus andthe crane system operated as normal on their receipt.

36
Table 5.2.2 Comparison of Handling Power Requirements
FEED BUFFER BELT –ECA22AF001
Straw Miscanthus
Low HighFrequency (Hz) 50 (average) 50 60Current 11.5 +/- .25 8.4 9.51Power (%) 69.5 36 47
SEAL BELT –ENA41AF001
Straw Miscanthus
Low High Low HighFrequency (Hz) 49(average) 48 49Current 2.9 3.4 2.93 3.18Power (%) 22 24 20.15 48.63
SCARIFIER Straw MiscanthusLow High Low High
Frequency (Hz) 20.6 20.8 24 26Current 15.6(average) 15 16Torque 16 19 14 19
Burner HHA4OAF001 Straw MiscanthusLow High Low High
Frequency (Hz) 43.39 (average) 38.9Current 10.18 (average) 10Torque 5.83 7.55 6.4 7.55
Burner HHA3OAF001 Straw MiscanthusLow High Low High
Frequency (Hz) 35 39Current 10.11 10.14 10.15Torque 3.92 4.40 4.33 5.16

37
6.0 Combustion Trial - Fuel Data
For the full combustion trial samples of cereal straw and Miscanthus were taken from the vehicledeliveries and analysed by an independent laboratory. Moisture measurements were taken directlyfrom bale moisture readings in the fuel barn, also from each delivery, using the plant’s microwavemoisture measuring system.
Table 6.1 Summary of Straw Supplied
Cereal StrawMixed Cereal& Miscanthus
Cereal Straw
Test Period hours 2 4 2
No. Of Cereal Bales Burned 102 111 110No. Of Miscanthus Bales Burned 0 97 0Average Bale Moisture % 13.9 14.09 13.9
Miscanthus Bale Weight kg ---- 539 ----Cereal Bale Weight kg 503 503 503
Ratio of Cereal to Miscanthus 100 : 1 51.7 : 48.3 100 : 1
Natural Gas Fired Energy % 6.02 6.08 6.45
Bale density is an average for the whole test period.
Table 6.2 Analytical Results of Straw Samples
Ultimate Analysis Units Cereal Straw Miscanthus
Carbon % weight 45.13 45.73Hydrogen db 5.47 5.70Nitrogen 0.53 0.46Chlorine 0.42 0.39Sulphur 0.16 0.11Oxygen 41.27 41.06Ash 7.02 6.55
Calorific ValueNet CV MJ/kg, db 16.5 17.3Moisture % af 14.30 13.90

38
Table 6.3 Mixed Solid Fuel Analysis, as fired
Units Mixed CerealAnd
MiscanthusCereal Straw
Carbon % weight 39.26 38.86Hydrogen af 4.89 4.71Nitrogen 0.39 0.46Chlorine 0.35 0.36Sulphur 0.09 0.14Oxygen 35.28 35.53Ash 5.65 6.04Moisture 14.09 13.90
Net CV MJ/kg, 14.18 13.79
Note: af = as fired, db = dry basis, NCV– Net Calorific Value

39
7.0 Combustion Trial
The reasons for choosing the Elean Power Station plant is firstly that Miscanthus is believed toburn in a similar fashion to straw, indeed it has a similar fuel analysis. The Power Station isstrategically placed in a potential large scale growing area for both straw and miscanthus and it isthe only suitable recipient for this baled fuel.
The objectives of the Combustion Trial were:
• To confirm that Miscanthus in baled format can provide a practical and costeffective method of fuel handling
• To confirm the combustion of Miscanthus in commercial quantities did not imposeany operational constraints, or result in adverse financial impact. This was achievedby substituting up to 50% of the total straw feed to the plant, for the duration of theburning trial. Using up to 50% miscanthus in the fuel for the test period isappropriate as this is the maximum proportion of miscanthus EPR foresee using inthe fuel during normal plant operation.
Fig 19 Miscanthus delivery being unsheeted for the Combustion Test

40
During the trial burn it was hoped to demonstrate that miscanthus is a suitable alternative fuel forthe Power Station, that it can be harvested, baled, transported and handled by the plant equipmentin the same way as straw. Also to confirm that miscanthus is comparable to straw in terms ofmaintaining plant efficiency and out put. Performance of the plant, particularly in terms ofefficiency and emissions, were continually monitored and the results trended to identify anydeleterious affects resulting from the introduction of Miscanthus. Additionally, any abnormal plantdisruption, additional manpower requirements or evidence of poor combustion were recorded.
A 50:50 split represents the maximum acceptable firing ratio, on a batch basis, that the Ely plantcould reasonably maintain to provide sufficient proof of at least a 20% Annual Capability.
7.1 Test Procedure
The combustion test was undertaken generally in accordance with DIN 1942, a Europe wideaccepted test code, for a continuous period of four hours. This required the supply of over 50tonnes of baled miscanthus in the fuel barn, which was provided well in advance, ready for use.The plant was maintained for a period of several hours on conventional straw prior to change overto duel fuel firing.
The test continued until the miscanthus ran out and the plant forced to return to full cereal strawfiring, this provided approximately four hours operating data. Data logging continued for a furtherthree hours to record how the boiler recovered and to note any impacts on performance due to themiscanthus burn.
7.2 Sampling and Recording
• Plant – Data was continuously recorded by the plant plc system during the test and printedout at the end. A steady operating period of four hours was selected from the data and usedfor analysis.
• Fuel – Fuel was sampled from both the straw and miscanthus and aggregated(independently), for the analysis period. The number of bales consumed was determinedfrom the delivered weights and average bale densities.
• Ash – Samples were taken and aggregated in the same manner.
• Emissions – Data was recorded and trended showing IPC requirements before, during andafter the trial and reported in half hourly averages.
Assessment of how Miscanthus performed was undertaken by comparison with conventionalcereal straw against the following criteria:
• Ease of handling and conveying• Ease of chopping• Ease of entry into combustion chamber• Furnace temperature profile• Steam and Electricity production rates

41
• Plant Chimney Emissions• Ash collection and removal• Operating stability, and• Sustainability and Availability

42
Fig 20 Collected Fuel Sample, size indicated by a 2p coin
Fig 21 Miscanthus Ready for Transfer

43
Fig 22 Crane Transfer from Barn to Conveyor

44
7.3 Test Results
Average Plant Operating Data Cereal Straw Mixed Cereal Cereal Straw24/04/2003 Units & Miscanthus
10 - 12 h 12 -16 h 16 - 18 h Operating Period hours 2 4 2 Cereal bales Consumed 101.7 111.2 110.1 Miscanthus Bales Consumed 0 97 0 Miscanthus Burned kg 0 52,232 0 Cereal Straw Burned kg 55,670 55,920 55,405 Solid Fuel Consumption tph 27.84 27.04 27.70 Miscanthus % weight 0.00 47.41 0.00 Cereal 98.23 50.76 98.10 Natural gas 1.77 1.83 1.90 Electrical Export Gross MWe 39.58 39.15 39.60 Electrical Export Net MWe 36.98 36.53 37.00 Plant Running Load MWe 2.60 2.63 2.60 Average gas burned kg/s 0.139 0.140 0.149 Nat. Gas NCV MJ/kg 49.1 49.1 49.1 Total Straw energy burned MWth 106.64 106.47 106.14 Total Nat Gas energy burned MWth 6.835 6.886 7.316 Total Fuel Energy Consumed MWth 113.48 113.36 113.46
Gas Firing by energy % 6.02 6.08 6.45 Overall Plant Cycle Efficiency % 32.59 32.22 32.61 Boiler Duty MWth 102.84 102.64 102.63 Blow down Loss MWth 0.204 0.203 0.210 Soot blower loss MWth 0.000 0.000 0.000 STEAM Flow tph 142.85 142.56 142.56 Pressure bar 91.5 92.4 92.3 Temperature °C 519.9 520.1 520.2 Blow down Rate % 0.95 0.94 0.98 Heat in Steam MWth 136.356 136.081 136.081 Heat Lost to Blow down MWth 0.204 0.203 0.210 FEED WATER Flow tph 144.20 143.90 143.95 Pressure bar 118.5 118.5 118.5 Temperature °C 196.6 196.6 196.6 Heat in Feed water MWth 33.72 33.65 33.66

45
Average Plant Operating Data Cereal Straw Mixed Cereal Cereal Straw24/04/2003 Units & Miscanthus
10 - 12 h 12 -16 h 16 - 18 h Total Air Flow tph 162.5 163.1 162.7 Overall Excess Air % 18.7 19.6 19.0 Air Temperature °C 127 129 128 Air Humidity kg/kg da 0.012 0.0125 0.012 Energy in Preheated Air MWth 4.71 4.82 4.76 Econ. Gas Exit Temperature °C 245.5 247.8 243.9 Economiser Gas Exit Oxygen % vol 3.41 3.54 3.46 APH2 Exit gas temperature °C 194.3 196.2 195.7 Final Gas temperature °C 138.2 141.8 142.0 Outside Ambient Temperature °C 11.8 17.2 15.3 Air cooled condenser Vacuum bar.a 0.085 0.111 0.095 Flue Gas Oxygen % vol 4.68 4.70 4.79 Flue Gas Moisture % vol 12.32 12.06 14.26
Lime Consumption kg/h 22.6 65.4 69.6 Fly Ash tph 0.276 0.233 0.302 Fly Ash Dry Matter % 98.8 98.8 98.8 Fly ash / kg fuel dry/dry 0.0099 0.0099 0.0125 Total Ash tph 1.828 1.679 1.851 Total Ash kg/kgfuel 0.0766 0.0724 0.0779 Dry Fly Ash Fraction % 14.9 13.7 16.1 Dry Bottom Ash Fraction % 85.1 86.3 83.9
Loss on Ignition Fly Ash % 0.7 0.4 0.9 Loss on Ignition Bottom Ash % 4.7 6.2 4.5 Unburned Energy in Fly ash MWth 0.014 0.007 0.020 Bottom Ash MWth 0.548 0.674 0.536 Unburned CO in Flue Gas MWth 0.062 0.055 0.036 Total Unburned Loss MWth 0.625 0.736 0.580 Overall Unburned Loss % 0.53 0.62 0.49 Combustion Efficiency % 99.47 99.38 99.51

46
7.4 Comments
The trial burn generated sufficient data and information to allow Miscanthus to be compared withcereal straw as an alternative fuel. The periods before and after Miscanthus firing can be used fordirect comparison. The key items for comparison are:
• Steam flow rate and steam temperature• Overall plant cycle efficiency• Combustion Efficiency, and• Plant running load
In all aspects the trial showed virtually no difference between cereal straw and mixed miscanthusand cereal straws before, during or after mixed straw firing. A very small increase in parasitic load(from 2.60 to 2.63MW) was observed with the mixed fuel, which slightly lowered the export valueduring this period. If Miscanthus only had been fired one could expect this 30kW difference tohave doubled, however this is still well within normal plant running load variations.
No immediate adjustments or improvements to operation need to be made when firing up to 50%miscanthus and all cereal straw set points can remain in place.
All operating data was easily trended and retrieved and the relaxed manner with which theoperator’s handled the trial was a good indication of how well the trial had performed.

47
8.0 Plant Performance
8.1 Energy Balance
To assess plant performance an energy balance was undertaken for each of three periods of thetrial, this included the initial cereal straw firing prior to mixed fuel firing, followed by the mixedfuel period of four hours, concluding with the final period when the plant was returned toconventional cereal straw firing. Refer to Appendix 7 for energy balance details.
It is necessary to undertake an energy balance to establish not only to establish the combustion andcycle efficiencies of the plant but also to determine where the fuel energy is used and to verify theenergy losses. It is a fundamental part of DIN 1942 and provides useful information to allowquantified adjustments and improvements to be made to plant performance.
8.2 Plant Emissions
EPR Ely is authorised to operate under IPC consent from the Environment Agency. Thechimneystack is 46.7 metres high and was designed to British Standard 4076 (1989). The stackdesign was optimised to provide an efflux velocity in excess of 15 m/s over the normal operatingregimes of the boiler. The emissions from the stack are monitored and data logged at the stack andreported to the control room. Additionally this emission data is sent directly to the EnvironmentAgency and East Cambridgeshire District Council by a modem link.
The plant was designed and commissioned to burn cereal straw and one would expect the bestemission test values with this fuel. Other straw types would be expected to have higher emissionlevels.
All emission levels are measured at actual conditions and corrected automatically to referenceconditions for compliance purposes. Reference conditions are: 11% oxygen in the dry flue gas, 0°Cand 101.3 kPa.
Table 8.2 Emission Test Results
Emission UnitsCereal Straw
StartMixed Cereal& Miscanthus
Cereal StrawEnd
IPC Limits
Particulates mg/Nm3 13.0 19.0 15.2 25
SO2 159.7 146.3 215.0 300CO 112.1 100.0 66.2 250NO 49.1 70.5 83.1 --NO2 3.4 3.3 3.2 --
NOx (as NO2) 70.3 99.4 116.5 300HCl 18.8 24.4 20.5 30
Dioxins ng/m3 ND ND ND 0.5
Lime Consumption kg/h 22.6 65.4 69.6 ---

48
8.2.1 Carbon Monoxide
The level of carbon monoxide achieved was well below the limit for all three periods and perfectlyacceptable. This data reflects the fact that the mixed fuel did not require any major adjustments toplant air settings with furnace performance similar to cereal straw alone.
8.2.2 Nitrous Oxides
Nitrous Oxides are determined by the addition of separately measured NO and NO2 components.All values measured are around a third of the limit.
8.2.3 Oxides of Sulphur (SO2)
The fly ash from straw contains reasonably high levels of calcium and potassium, which are veryreactive metals and used to capture most of the sulphur (and chloride) in the fuel. This takes placeat different temperature points within the furnace, boiler and economiser sections of the steamgenerating plant. To ensure compliance the remainder is captured in the GSA with the addition ofdry lime (Ca(OH)2) and filtered out of the flue gas as solid matter by the high efficiency fabricfilter, downstream of the GSA. With a fuel that contains lower levels of reactive metals (calcium,sodium, magnesium and potassium generally), then higher quantities of lime would be required toabsorb the sulphur.
The flue gas monitoring system records both SO2 and HCL and the signals are fed back to the limedosing equipment to regulate the quantity of lime addition for the for the highest level of eitherSO2 or HCl.
Results show that Miscanthus and cereal straws require similar levels of lime addition to meet theacid gas limits.
The SO2 emissions on all periods were significantly lower than the limits highlighting a goodability for sulphur retention from both straw types, despite an initial surge in emissions at the startof Miscanthus combustion.
8.2.4 Hydrogen Chloride (HCl)
HCl is not as easy to capture in the higher temperature regions of the steam generating plant as isthe case with SO2. However, in the GSA and bag filter, where the flue gas temperature is lowest,the opposite is true. HCL is easily captured in the ash at these lower temperatures and with amodest amount of lime addition up to 90% can be collected.
HCL is collected in the fly ash by the filter in the same manner as SO2.
The results are sufficiently below the set limits (around 2/3 rds) and again show the ability of eachstraw ash type to retain acid gas components

49
Table 8.2.1 SO2 &HCl Emissions
Units Cereal Strawstart
Mixed Cereal& Miscanthus
Cereal Strawend
Fly ash kg/h 276 233 302Lime addition kg/h 22.6 65.4 69.6
SO2 Emission mg/m3 159.7 146.3 215.0HCl Emission mg/m3 18.8 24.4 20.5
8.2.5 Particulates (Dust)
Particulate emission levels can be quite variable and dependant upon the amount of lime addition,degree of recirculation of fly ash, whether the bags have been cleaned or about to be cleaned and isalso dependant upon gas volumetric flow, which affects the velocity through the bag.
The results show high levels of particulate emissions for all three periods, this was not a problemwith the fuels fired but unfortunately a need to replace the filter bags, which were at the end oftheir three-year life. New bags, which have since been confirmed, would give the more normalemission level of 1 to 4 mg/Nm3.
Table 8.2.2 Particulate Emissions
Units Cereal Strawstart
Mixed Cereal& Miscanthus
Cereal Strawend
Gas Flow tph 189.1 189.4 189.0Fly ash kg/h 276 233 302Lime addition kg/h 22.6 65.4 69.6Emission mg/m3 13.0 19.0 15.2
8.2.6 Dioxins and Furans
Trace levels of Dioxins and Furans are found in the chimney gas, the bottom ash and fly ash. In thechimney gas the levels observed are a fraction of the authorised limit and in the solid ashes are nomore than found in the surrounding soil. Dioxins and Furans (usually referred to as dioxins) are afamily of chemicals (containing around 140 different components) based on the tri-cyclic moleculebenzo-p-dioxin, which has two benzene rings, linked by two oxygen atoms and have had some orall of the hydrogen on the benzene rings replaced by chlorine.
Dioxins are usually associated with the incomplete combustion of material containing chlorine andas such are commonly associated with the ash from combustion processes, but can be found insmall traces in soils. To date only traces have been found in the previous studies of the ashes andflue gases at levels well below the emission limits, as part of the routine power station monitoring
50
Due to time and cost constraints a more detailed examination of Dioxin concentration levels at thispower station was not carried out. The cost for undertaking dioxin tests on the flue gas and ashesfor three different fuels would have been around £10,000.
Dioxins are usually associated with aspects of poor combustion and these can also be indicated byhigh levels of CO, several times the limit and by random testing for organic hydro carbons. Toensure dioxins are adequately destroyed the furnace temperature is maintained above 850°C formore than two seconds and the flue gases are quickly cooled between the temperature range 400and 200°C to prevent any reforming. Control on the 850°C is by the use of natural gas, whichalways ensures this temperature regardless of straw moisture and furnace conditions.
8.2.7 Emission Control Techniques
Emissions from a biomass-fuelled boiler can be controlled by a variety of methods. The controlsystems needed depend mainly on the composition of the feedstock, variations in moisture contentand variations in calorific value. If control is lost this can lead to increased emission problems,predominantly due to incomplete combustion and increased carbon monoxide emissions orexcessive temperatures leading to high NOx emissions.
The acidic flue gas from the furnace enters the cleaning plant at the bottom of the GSA reactorwhere the gas is mixed with dry lime and with re-circulated fly ash that has been collected. Thefine lime is evenly distributed with a very large contact surface area and is carried with the flue gasthrough the GSA allowing a neutralising reaction to occur.
The removal of the acidic components of the flue gas is a result of the following chemicalreactions:
2 HCl + Ca (OH) 2 => CaCl2 + 2H2O SO2 + Ca (OH) 2 + H2O => CaSO3 + 2H2O
The resultant Calcium compounds are particulates and are removed in the fly ash by a fabric filter.The purified flue gas now relieved of both the dust and acid components are released to theatmosphere through the chimneystack well below the emission limits.
Lime is added automatically by means of a screw conveyer system and transfer pipe. The amountto be added is determined by the control system, which measures the HCl and SO2 emissions fromthe stack.

51
Fig 23 Left: Picture of the bag filter system showing 3 of the 6 compartments. Right:Picture of the lime silo and dosing system beside the Gas Suspension Absorber
The plant uses a FabricleanTM Filter system. This comprises of six cleaning compartmentsarranged in parallel, which receive gases from a common inlet manifold. The flue gases from thefurnace are drawn through the filter compartments under the influence of the Induced Draught fan.
The collected dust is dislodged automatically from the filter bags by short pulses of compressed airinjected into each row of bags. The cleaning cycle is initiated by differential pressuremeasurements when a predetermined level of resistance is obtained over the filter.
The high efficiency fabric filter removes +99.95% of all particles from the flue gas after the GSAto fulfil the emission guarantees on particulates.
NOx levels can be controlled and maintained below emission limits by the use of specialequipment such as SCR or SNCR (selective catalytic reduction and selective non-catalyticreduction). These processes use ammonia or urea injected into the furnace and boiler sections tocapture NOx from the flue gas. This equipment is very expensive in both capital and running costand not available at the Ely power station. Instead, at Ely, the traditional method for NOxreduction has been adopted whereby air is entered into the furnace at different heights (stagedcombustion) with control on furnace temperature (in the range 850° to 1050°) throughout.

52
CO levels are maintained in a similar way by adding air at different stages to even out thecombustion rate in the furnace, without creating excessively high or excessively low temperatures.High temperatures lead to an increase in NOx but a reduction in CO whereas low temperatureslead to a reduction in NOx but an increase in CO. It is very important therefore that good control ofthe straw bale moisture content is maintained and the reason why a maximum limit of 26%moisture is placed on bales during loading in the straw barn. High moisture can quench furnacetemperatures and lead to excessive CO emissions.
8.2.8 Comments and Conclusions
Supply of Miscanthus to the furnace occurred at the same time as a dip in power generation and arise in furnace oxygen level, which is normally associated with a short period of poor combustion.This was followed by a surge in emission levels that still met hourly limits but caused a short-termexcursion. The plant took an hour or so to recover back to more normal conditions. This was apotential problem envisaged before the test and one of the reasons the amount of Miscanthus waslimited to around 50% of solid fuel firing.
Fig 24 Power Output & Oxygen Level
3.00
3.20
3.40
3.60
3.80
4.00
4.20
4.40
4.60
4.80
5.00
9.00 10.00 11.00 12.00 13.00 14.00 15.00 16.00 17.00 18.00 19.00
Time
Oxy
gen
%
35
36
37
38
39
40
41
Gro
ss
Ele
ctr
ica
l P
ow
er
MW
oxygen Power

53
Fig 25 Straw Emissions
0
20
40
60
80
100
120
9.00 10.00 11.00 12.00 13.00 14.00 15.00 16.00 17.00 18.00 19.00Time
Em
issi
on
Lev
el %
of
Lim
it
0
5
10
15
20
25
30
35
40
45
Gro
ss E
lect
rica
l Pow
er M
W
Dust SO2 CO NOx HCl Power MW
The emission test results, table 8.2, show emissions for the start on cereal straw, the period ofmixed fuel firing and for cereal straw only at the end of the test to see if there was any ‘follow-on’problems. All three periods were well below statutory limits.
In conclusion baled Miscanthus straw has sufficiently proven itself to burn efficiently, meet IPClimits and plant output requirements.
8.3 Ash Details
Ash samples were collected from the conveying lines during each test period and analysed for theircombustible content, to provide data for energy balance purposes.
Table 8.3 Ash Analyses
Cereal - Start Cereal + Miscanthus Cereal - EndBottom
AshFly Ash Bottom
AshFly Ash Bottom
AshFly Ash
Dry Ash Fraction % 85.1 14.9 86.3 13.7 73.9 16.1Loss on Ignition % 4.7 0.7 6.2 0.4 4.5 0.9Unburned Loss % 0.46 0.01 0.57 0.01 0.45 0.01

54
A full elemental ash analysis was not undertaken for this trial since no particular problems wereencountered with combustion during any stage of the trial. The proximate details given in table 8.3are sufficient for energy balance purposes and to compare performance at each stage.
A little more bottom ash was produced with Miscanthus with marginally higher unburned loss, asindicated by the loss on ignition value. There is no particular reason for this except that Miscanthusis probably denser than cereal straw with less tendency to fly. However the results are so close andwell within the normally accepted range that adjustments to plant are not required. If the plant wasoperated on 100% Miscanthus then this small figure may increase to double the difference buteven this would not be considered a problem.
55
9.0 Financial Implications
9.1 Straw supply
The cost of baled straw as a fuel is dependant upon a number of factors such as calorific value ofstraw type, moisture content, soil inclusions, transport distance, cost of baling and storage andseasonality effects, which may reduce the available quantity of purchased straw to the powerstation. The power station operator requires a steady supply of suitable straw throughout the year,at a regular known price and does not want to be unduly affected by these variations.
To smooth out the variations in delivery and delivered price Anglian Straw provide the bufferbetween the farmer and haulier on one hand and the power station demands on the other. Theylook after the whole of the supply and storage logistics and coordination requirements, ensuringand maintaining a steady, reliable and suitable supply of straw.
9.2 The Price of Straw
The cost of straw to the power station is currently based on the use of cereal straw at an annualaverage moisture content of 16 % by weight. The following table (table 9.1) details the currentprice of cereal straw and the price for baled Miscanthus, as determined by the combustion trial, andcorrected to the same basis for moisture and transport distance.
The price of baled Miscanthus is much the same as for cereal straw at £15.50 per bale. This is notsurprising since many of the suppliers of Miscanthus will also provide much of the cereal straw tothe power station. When compared as a price per tonne Miscanthus is not as favourable as cerealstraw because the cost of baling will be higher. Yield rates, however, are higher for Miscanthus ataround 7tonne per hectare compared with cereal straw at 5 tonne per hectare.
Table 9.1 includes a loss factor. This is an allowance for material loss due to degradation in thefield and inclement weather. Exceptional rainfall, fire and alternative supply requirements incur acost additional to the totals given in the table.
All costs quoted in table 9.1 are typical. Actual values will vary from farm to farm according to thearrangements undertaken with the farmer, the level of split responsibility, loading requirements,netting requirements, delivery distances, provision of all weather sites and time of year.
If Miscanthus can be mown in the field to slightly shorter lengths with stronger twine used, thenthe ability to pack each bale of Miscanthus to a higher density would help reduce transport costs byup to £1.00 per bale. Current transport vehicles are limited to a gross tare weight that cannot beexceeded, this restriction would limit the maximum bale weight to 750kg and not the 850 kg thatthe power station was designed to take.

56
Table 9.1 The Cost of Straw
Cereal StrawTested
MiscanthusTested
Miscanthus BaledDenser
£/bale £/tonne £/bale £/tonne £/bale £/tonne
Nominal Bale Weight kg/bale 503 539 750
Nominal Yield tonne/ha 5.0 7.0 7.0
Nominal Payment at Farm 1.50 2.98 1.60 2.98 2.23 2.98
Mowing 1.50 2.98 1.60 2.98 2.24 2.98
Baling 5.00 9.94 6.50 12.06 7.50 10.00
Chase to stack 1.00 1.99 1.00 1.85 1.00 1.33
Load & Deliver 4.90 9.74 4.90 9.10 4.00 5.33
Loss Factor 1.10 2.19 0.70 1.30 0.70 0.93
Overheads & Costs 0.50 0.99 0.50 0.93 0.50 0.67
Total Cost 15.50 30.81 16.80 31.20 18.17 24.22
Cost £ per GJ (16 % Moisture) 2.29 2.20 1.71
Variations with Moisture
The annual average moisture of 16% by weight would command a price of 100% of the fuel cost,as given in table 9.1.
70
75
80
85
90
95
100
105
110
10 12 14 16 18 20 22 24 26 28 30
Moisture Content %
Fig 26 Straw Cost Variations with Moisture Content
Cos
t %

57
Maximum Acceptable Moisture per bale is 26 %Maximum Acceptable Moisture per load is 23.5 %
The reason for limiting the moisture content is that at high moisture the calorific value is reducedand to maintain output more fuel has to be fired. The limiting factors on this are the maximumcapacity of the burner, shredders and screw feeders and the furnace volume, which is fixed, andgas residence times would therefore be reduced. The limiting condition in this case is for aminimum of 2 seconds residence time. There is also the potential for blocking and fouling of plantcomponents, such as the bale shredders
70
80
90
100
110
120
130
10 12 14 16 18 20 22 24 26 28 30
Moisture Content %
Fig 27 Variation in Straw Consumption with Moisture Content
The power station currently consumes around 200,000 tonnes of straw at an average 16% moisturefor 8,000 operating hours per year. The total cost of fuel is £6.2 million per year (year 2002). Fig.26 shows how the quantity of wet straw required, to maintain power station output, changes withmoisture and Fig. 27, how the price paid reflects this to ensure that, no matter what moisture strawis delivered at, the power station always pays £6.2 million. This amount is escalated each year withthe retail price index.
As the price varies with moisture at the power station, so does the price paid to the farmer. Thisvariation is passed directly and in the same way, but after transport and handling charges. It isclear, therefore, that if the farmer can harvest and store his straw and accurately measure themoisture, giving an improved tonnage at lower moisture, then he can maximise his income.Equally if less is delivered, or is wetter, then less income can be raised.
Str
aw C
onsu
mp
tion
%

58
10.0 Comments and Conclusions
10.1 Agronomy
Planting in 1999 took place under less than ideal conditions and plant establishment was poor;replanting the following spring did not improve plant population very much. The plant populationin 2000 remained unchanged for the rest of the project. Plants grew well and stem densityincreased each year. Most shoots emerged in spring, which resulted in a fairly uniform shoot sizeon individual plants. Stem height reached 2.4m in 2002. This is the measurement to the last leafcollar therefore actual height is about 50cm taller.
Lessons learnt at Witcham about how to plant Miscanthus rhizomes have been useful in developingplanting strategies. Although the number of established plants was low the population has beenmaintained throughout the project. Plants have grown well and development has been comparable toplants grown elsewhere in experimental plots. Stems per plant are similar to values reportedelsewhere. Harvesting in 2002 created extensive wheel marks across the field that could be clearlyseen later in the year. However plant growth afterwards was not affected.
Monitoring growth has shown that most shoots emerge in the spring and early summer except in theplanting year. The contribution to stem density from late season shoots was negligible. Lateemerging shoots may die possibly from shading in the older crop. This growth characteristic meansthat a greater uniformity of stem size is present at harvest.
Some new shoots for the next season were evident by late summer and if they grow too much beforethe winter they would be vulnerable to frost damage. However the majority of stems arise from budsdeeper in the soil and these have been unaffected by frost or wheel damage and this could be thereason why wheeling did not affect growth.
The fact that water logging did not kill plants is a very positive finding but soil water logging isdetrimental to harvesting operations and its timing. Water logging did affect stem growth and it wasevident that differences between plots were related to the length of time that plants were subject to winterwater logging. In 2001 and 2002, stem height was shorter at the end of the summer on the plot not affectedby water logging. This suggests that soil water reserves were better on the other plots and supported bettergrowth. But it might also be a topographical effect with water draining to the area from the drier bank onwhich plot 1 is situated.
Pre-planting strategies for weed control could not be carried out because of the brief period available forplanting after the wheat had been removed and this probably contributed to the level of weed infestation.Also weed suppression by the crop was not very effective because of the low plant density. The resultdemonstrates the value of good weed control prior to planting and the importance of a high plant densityand good spatial distribution.
There have been no pest or disease problems and very little damage by animals and the field hassupported a range of birds and animals demonstrating the value of the to bio-diversity.

59
10.2 Combustion Trial
Overall, both cereal and mixed cereal and Miscanthus fuels appeared to perform in a similarmanner with no significant handling, chopping, combustion or ash handling problems encountered.
The project has shown the feasibility of using Miscanthus up to 50% solid fuel ratio when mixedwith conventional cereal straw without any significant impact in environmental emissions, energyefficiency or ash handling.
Use of Miscanthus, although a more expensive fuel, still offers some advantages financiallybecause of its higher calorific value and bale density. This will help reduce the cost per tonne andmore importantly the cost per unit energy to the power station.
Miscanthus is a suitable fuel for use in plants similar to Elean, it provides an alternative fuelresource for this existing plant and opens up the potential for further biomass plant development inthe UK. The use of this fuel reduces the dependency and risks associated with the use of only onefuel type and allows alternative periods of the year for harvesting, when equipment is not beingutilised elsewhere.
Table 10.1 Overall Cost of Straw by weight and Energy Supplied.
Cereal Miscanthus
Load & Deliver Cost £ / tonne 9.74 9.10£ / GJ 0.72 0.64
Total Cost £ / tonne 30.81 31.20£ / GJ 2.29 2.20
* Total cost excludes any payment to the farmer, for non-food crops grown on set-aside land
Use of a broader range of fuels could help the sustainability of the overall combustion process byimproving the reliability of the fuel supplies. Sufficient fuel quantities would appear to beavailable within an economic transport distance to ensure the future use of Miscanthus.
10.3 Assessment
A method of assessing Miscanthus was developed prior to the test work and was designed toensure that any particular impact on operation and performance was clearly observed and reported.Performance against the assessment parameters is shown below.

60
Ease of handling and conveying
Both cereal and Miscanthus, in baled form, handled and conveyed in a similar manner
Ease of chopping
All baled materials chopped successfully although Miscanthus required a small increase in torquesetting, indicating that it was slightly tougher to chop.
Ease of entry into combustion chamber
No particular problems were encountered with either baled type.
Furnace temperature profile
A similar profile was encountered with cereal straw and the mixed fuel. Miscanthus tended to burnmore intensively at the beginning of the trial, which allied with a drop in output just previously,caused a short-term emissions excursion.
Steam and electrical production rate
Steady steam rates of around 142tph were achieved throughout. A very small increase in parasiticload (from 2.60 to 2.63MW) was observed, however, with the mixed fuel, which slightly loweredthe export value during this period.
Plant chimney emissions
With the exception of the short-term excursion at the start of mixed fuel firing, all plant chimneyemissions were below the emission limits on an hourly basis. Performance throughout the testshowed very little difference when burning Miscanthus and is very encouraging.
Ash collection and removal
No particular problems were encountered on either bottom ash or fly ash with either cereal ormixed cereal and Miscanthus ashes. Experience with other straw types, particularly Oil Seed Rape,has shown that the bottom ash may tend to float in the quench bath, making ash extraction moredifficult. This was not encountered with Miscanthus.
Currently the fly ash is pneumatically conveyed to a fly ash silo where it is stored prior to removalto land fill. The wet bottom ash, containing no lime addition, is mechanically transported to a largehopper prior to sale as a building aggregate material. The ash quality and consistency did not varyon either discharge route and removal from site posed no problems.
Operating stability
The mixed fuel took an hour to settle down and for emissions to stabilise. Once settled theoperation of the plant became relatively stable and, although a variety of different moistures was

61
not encountered, it would appear that either type could have operated for long periods withoutoperator intervention. With cereal straw the ratio of natural gas fired to solid fuel can be adjustedto provide prolonged stability in the event of differing fuel moisture, provided the maximummoisture limit, at fuel reception, of 26% by weight is adhered to. This should also be a validoperation for high moisture Miscanthus.
Sustainability & Availability
Due to the limited nature of the test work, covering a one-day trial only, the question ofsustainability of combustion is more difficult to establish. Given the very similar results andperformance between the two fuels, one could expect Miscanthus bales to provide long-termresults similar to wheat. There appears to be no valid reason why Miscanthus should not become aregular contract fuel.
Plant availability is currently around 90%, having been proven over a two-year period. New fuelsusually create new problems and any other type of baled straw would require at least 3monthscontinued use before it’s impact, if any, on the availability of the plant could be truly assessed.From the results of these trials it would appear that Miscanthus would have little impact on thelong-term availability.

62
REFERENCES
Brown R A (1978). A difference in N use efficiency in C3 and C4 plants and its implication in adaptation and evolution. Crop Science.
Christian D G & A B Riche. (1999). Establishing fuel specifications of non-wood biomass crops. Department of Energy Contract Report B/U1/00612/REP.
Energy Technology Support Unit (ETSU), Harwell, Oxford, UK.
Christian D G, A R Riche & N E Yates MC. (1999). Monitoring growth and yield ofcrops grown as biofuels. Department of Energy Contract ReportB/W2/00548/11/REP. Energy Technology Support Unit (ETSU), Harwell, Oxford,UK.
Hodkinson T R , Renvoize S A & Chase M W. (1997) Systematics of miscanthus. In Bullard M J; Ellis R G; Heath M C; Knight J D; Lainsbury M A & Parker S R (eds), Biomass and energy crops. Aspects of Applied Biology, 1997.
Rutherford & MC Heath. (1992). The potential of miscanthus as a fuel crop. Department of Energy Contract Report B 1354. Energy Technology Support Unit (ETSU),
Harwell, Oxford, UK.
FEC Ltd (1988) Straw Firing of Industrial Boilers. Department of Energy Contract ReportETSU B 1158. . Energy Technology Support Unit (ETSU), Harwell, Oxford, UK.
Garstang J.R. (1994). The Analysis of Straw. ADAS Cambridge. Department of EnergyContract Report B/M3/00388/39/REP. Energy Technology Support Unit (ETSU),Harwell, Oxford, UK.
ETSU B-W2-00619-REP Development of Generic Solutions for Biomass Storage andTransport.
ETSU B 1242 Straw Ash Characteristics.
ETSU B/M5/00533/16 The Fast Pyrolysis Of Oil Seed Rape
ETSU B/M4/00487/01 Energy and Carbon Analysis of Using Straw As A Fuel
ETSU B/M3/00388/39 The Analysis of Straw

63
APPENDICES
A1 Layout of Trial Plot at Witcham, Mepal
A2 General Grower Guidelines
A3 General Comparison of Fuels
A4 Normal Operating Details of Ely Power Station
A5 Plant Instrumentation
A6 Test Procedures
A7 Overall Steam Cycles and Efficiency
A8 Plant Emissions
A9 Details of Sub-Contractors
A10 Key Staff

64
APPENDIX 1
Lay
out
of T
rial
Plo
t at
Wit
cham
, Mep
al

65
APPENDIX 2
GROWER GUIDELINES
Management plan for EPRL site at Witcham
This plan outlines a proposed course of action to produce a commercial quality stand ofMiscanthus as a demonstration facility at the Witcham site, Cambridgeshire. The stand shall have aminimum plant population of one plant per m2, as agreed, planned, (and confirmed by independentassessment of emergence) for May.
The proposed actions have been divided into two areas, remedial work on the current stand, andmaintenance work following this action.
Remedial Work
This work is to be carried out once above ground growth has become dormant, it is proposed thiswould occur alter November, but a decision will be made based on grown during this growingseason.
• Harvest of above ground cane, to be baled and stored in the field for collection• Herbicide application to remove residual weed populations.
• Cultivation of the demonstration area to re-establish current stands in homogenousmanner, the area will then be rolled to ensure soil-rhizome contact Additional rhizomes willbe established if appropriate.
Maintenance work
• Agronomic inputs of fertilisers and agrochemicals will be determined by visits to thesite, and presented in a detailed programme giving required compounds, rates and time ofapplication.
• Crop diary maintained for all inputs into the crop, to be supplied if requested whendemonstration facility is used.
• Access to BICAL telephone help line and technical staff for advice on me maintenanceof the site to commercial standards,

66
APPENDIX 3
GENERAL COMPARISON OF FUELS
Fuel Type Typical Straw Miscanthus CoalWheat & Barley Anticipated Daw Mill
Proximate Analysis, as received Moisture % range 11.8-22.4 12-25 % Ave 16.2 16.0 7.2 Ash % range 3.2-8.2 As Straw % Ave 5.5 5.5 6.2 Volatile Matter % range 57.2-69.7 As Straw % Ave 63.5 62.5 34.1 Fixed Carbon % range 14.8-16.0 As Straw % Ave 15.2 16.0 50.5 Ultimate Analysis, dry basis Range Range Average Carbon % by weight 40.9-48 43-48 68.7 Hydrogen % by weight 5.3-6.4 5.6-6.2 4.5 Nitrogen % by weight 0.3-0.9 0.2-0.6 1.1 Chloride % by weight 0.1-0.6 0.2-0.9 N.D. Sulphur % by weight 0.2-0.4 0.02-0.40 1.5 Oxygen (by difference) % by weight 36.9-39.1 38-42 8.8
GCV dry basis kJ/kg 17,840-18,600 18,000-20,000 31,057 GCV dry ash free kJ/kg 19,260-19,600 19,500-20,500 33,110 Ash Fusion Temperatures Initial Deformation Temp °C 800-1400 1000-1150 1225 Hemisphere Temp °C 930-1430 1200-1350 1265 Fluid Temp °C 1100-1440 1300+ 1320
Note: Ash content, due to soil inclusions, may vary considerably according to ground conditions at time of harvesting.

67
APPENDIX 4
NORMAL OPERATING DETAILS OF ELY POWER STATION
Name: Elean Power Station
Location: Sutton near Ely, Cambridge
Site Size: approximately 4.5 ha (10 acres)
Technology: FLS miljo Vibrating Grate / Whole bale burner
Main Furnace Temperature: 850°C
Number of Furnace Lines: 4 feed lines to separate burners on a single furnace
Plant Capacity: 200,000 tonnes of straw per year plus 10% Natural Gas byenergy Input
Net Electricity Output: 36 MWe Normal, 38 MWe Winter Condition
Net Thermal Input 103 MW thermal, Normal
Overall Cycle Efficiency 35.0%
Steam Turbine: 2 stage condensing
Steam Conditions: 92 bar/540°C
Cooling: Air-cooled condenser
Stack Height: 43.5m
Plant Residue: Potash and phosphate rich ash
Emissions: IPC ref. S2 1.05 Limits Typical
Particulates < 25 mg/m3 < 4 mg/m3
SOx <300 mg/m3 60 mg/m3
NOx <300 mg/m3 250 mg/m3
HCL < 30 mg/m3 18 mg/m3
CO < 250 mg/m3 120 mg/m3

68
APPENDIX 5
PLANT INSTRUMENTATION
Flue Gas
To assist in the control of plant processes and to monitor the emissions to air, on line instrumentsmonitor, display and record all important process parameters.
All instruments are calibrated on a regular basis using a reference gas at a fixed level or by aphysical test such as an isokinetic sample, in the case of particulate. Full-scale accuracy is less than2% of the measurement range.
The monitoring equipment is kept within an air-conditioned cabinet mounted within a steelcontainer situated at the bottom of the stack. Three types of analyser make up the equipment. AGP 2000 H particulate monitor (Pillard Opastop), an Oxygen monitor, Oxitec 5000 (Enotec) and aGasnet CX-4000 (Temet), which determines the concentration of CO, HCl, S02, NO, NO2 andwater vapour using Fourier Transform Infra-Red analysis. The reference conditions of themeasured substances in the gas sampled are 0°C, pressure 101.3kPa, dry gas, at 11% oxygen byvolume. Samples of the gas emissions are taken through heated probes from a point 15 metresabove ground level within the stack. From the measuring points the gas is brought to the cabinetthrougha heated sample line. The gas is then automatically measured using the three analysers and thedata gathered transferred to a networked computer to allow for real time monitoring by the plantoperators.
Table A5.1 Monitoring and Reporting Instruments for Emissions to Air
Parameter Units MonitoringFrequency
InstrumentRange
ContinuousStandard
Non ContinuousStandard
Particulate mg/m3 Continuous 0 – 50 BS 13010155 BS : 6069pt 4.3Oxides of Nitrogen mg/m3 Continuous 0 – 1000 NO
0 – 50 NO2ISO 10849 BS :150 11564
Oxides of Sulphur mg/m3 Continuous 0 – 1000 BS6069Pt4.1 BS :15011632Carbon Monoxide mg/m3 Continuous 0 – 300 and
0 – 1000ISO 12039 ISO 12039
Volatile OrganicCompounds
mg/m3 Periodic 0 - 100 BS : EN12619
HydrogenChloride
mg/m3 Continuous 0 – 30 and0 – 100
BS : EN1911
Flow Nm3/h Continuous 0 – 200,000Oxygen % vol Continuous 0 – 21Moisture % vol Continuous 0 – 30
Alarm levels are set well below EPA limits.

69
Internal reports were compiled specifying the following information on plant operation andmonitoring:
• Hours run
• Emissions (corrected to reference conditions)
Flue Gas Flow (dry basis)Flue Gas Oxygen (dry basis)Flue Gas Moisture
Particulates Retrieved DCS archivesCO emissions Retrieved DCS archivesSOx emissions Retrieved DCS archivesHCl emissions Retrieved DCS archivesNOx emissions Retrieved DCS archives

70
APPENDIX 6
TEST PROCEDURES
The combustion test was to be undertaken in general accordance with DIN 1942, which requires aminimum period of three hours continuous duration.
All trials were to be carried out at MCR conditions and continued for a period of 4 hours until thebaled Miscanthus ran out, the plant was then returned to full cereal straw firing.
Data logging throughout each trial was to be undertaken on an hourly average basis and manuallogging of data undertaken on the hour.
Sampling and Recording Requirements
• Plant Data - to be continuously recorded by the plant plc system during the test, utilisingthe pre-calibrated in-house instruments and printed out at the end.
• Fuel – sampled on a regular basis during the test and aggregated (independently), for theanalysis period.
• Ash Samples - taken and aggregated in the same manner.
• Emissions Data - The pre-calibrated continuous monitoring equipment installed forrecording emissions to EA standards were to be employed with test data trended on theplant plc system.
Recorded Data
Trended and manually recorded data includes:
Steam Flow tphPressure barTemperature oC
Feed water Flow tphPressure barTemperature oC
Blow down rate (if applicable) % of steam flow
Total Air Flow m3/hAir Temperature oCAir Humidity kg/kg dry air (or rh)Fuel tonnages (from crane) tonnesMoisture %wtEconomiser Gas Exit Temperature oC

71
Economiser Gas Exit Oxygen % volFly ash collected tonnesBottom ash collected tonnesElectrical Export Gross MWeElectrical Export Net MWePlant power load MWeNatural Gas Consumption ft3
Chimney Emissions:
NOx mg/Nm3 at 11% O2 refSOxHCLCOParticulates
Laboratory Analysis:
Fuel Ultimate Analysis + GCV & NCVFly Ash Analysis Carbon in ash/loss on ignitionBottom Ash Analysis Carbon in ash/loss on ignition
General:
Monitoring and recording by general observation was also undertaken during combustion foridentification of any variations to normal plant operation that could impact on plant efficiency oremission levels.
Natural Gas Calorific values were to be obtained from the supplier to establish the correct energyinput.

72
APPENDIX 7
OVERALL STEAM CYCLE & PLANT EFFICIENCY
• Boiler & Overall System Diagram For the Mixed Cereal & Miscanthus TrialPeriod
• Summary of Overall Energy Balance for all three test periods

73
Fig 28 Overall System DiagramMixed Miscanthus and Cereal Straw
Heat Losses Unburned Loss540 736
Overall System Boundary
Blowdown Loss Steam203 141,552 2,625
Soot blower Loss In House Load 36,5250 Electrical
Straw Energy Gross 39,150 Export106,471
Nat. Gas Energy6,886 ACC & Heat Losses
68,753 Solids Loss Flue Gas Loss
114 Boiler System Boundary 9,960
Cold Water
Boiler Water33,649
Pre Heated Air4,822
Feed Pump
Chimney Loss
All values are in kW
Deaerator
Turbine
A.C.C.
Boi
ler
Econ
APH2
FGC
APH1

74
Summary of Overall Energy Balance
Cereal Start Mixed Fuel Cereal EndHeat Input kW
Heat from straw kW 106,648 106,471 106,141Heat from Natural Gas kW 6,835 6,886 7,316Heat in Preheated Air kW 4,712 4,822 4,764Total heat to Input kW 118,195 118,179 118,221
Boiler Duty kW 102,842 102,635 102,631
kW % kW % kW %Dry Gas LossMoisture Loss Flue Gas Loss % 9,829 8.316 9,960 8.428 9,909 8.382Humidity LossSolids Loss % 122 0.104 113.8 0.096 121 0.102Unburned Loss 625 0.529 736 0.623 580 0.491Radiation and Convection Loss 540 0.457 540 0.457 540 0.457Soot blower Loss % 0 0.000 0 0.000 0 0.000
Total Losses % 11,117 9.405 11,349 9.604 11,150 9.432
Boiler Efficiency Calculated % 90.595 90.396 90.568(Indirect Method)Boiler Efficiency from Test Averages 90.623 90.542 90.459(Direct Method)Error in Calculation by direct Method 0.028 0.145 -0.110
Combustion Efficiency % 99.471 99.377 99.509
Gross Power Generated MW 39,580 39,150 39,600In - House Power MW 2,600 2,625 2,600Net Export Level MW 36,980 36,525 37,000
Overall Cycle Efficiency 32.59 32.22 32.61
Straw Specific Fuel Consumption 0.753 0.740 0.749

75
APPENDIX 8
Plant Emissions
• Summary of Plant Emission Levels, in half hour averages

76
Fig 29 Summary of Plant Emission Levels, in half hourly averages
0
50
100
150
200
250
300
350
9.00 10.00 11.00 12.00 13.00 14.00 15.00 16.00 17.00 18.00 19.00
Time
Em
issi
on L
evel
mg/
m3
0
5
10
15
20
25
30
35
40
45
Gro
ss E
lect
rica
l Pow
er M
W
Dust SO2 CO NOx HCl Power MW
Cereal Only Cereal OnlyMixed Cereal & Miscanthus

77
APPENDIX 9
DETAILS OF CONTRACTORS
Energy Power Resources Ltd.Energy Power Resources is a leading UK developer of renewable energy projects. It has a proventrack record and a diverse portfolio; including chicken litter, straw and wood burning projects.Currently, EPR has two biofuel power stations constructed and in operation with three furtherschemes at planning approval stage.
Northern StrawNorthern Straw is the largest specialist straw baling contractor and trader in the UK, balingapproximately 100,000 tpa. The company, formed almost 20 years ago, is based in Goole, EastYorkshire and employs @ 40 staff. Northern Straw’s Managing Director and co-founder is DavidJohnson a very well known figure in the industry and the President Elect of the UK Hay and StrawMerchants Association. Over the years Northern Straw has undertaken and contributed to anumber of research studies on the straw market and its utilisation, including ETSU reportB/M4/00487/16/REP
Anglian Straw Ltd.Anglian Straw is a subsidiary of EPR Ely and is the UK’s largest biofuel logistics company. Thecompany specialises in providing ‘just in time’ deliveries of biomass, particularly straw, fromfarmers and suppliers to end users such as energy producers.
IACR – RothamstedThe Institute of Arable Crops Research (IACR) has three main research laboratories and threeresearch units. The Institute is grant supported by the Biotechnology and Biological SciencesResearch Council.
IACR’s scientific objective is the provision of basic information for improvement of yieldconsistency, quality, production efficiency and competitiveness of major arable crops in sympathywith environmental considerations.
The Institute’s multidisciplinary expertise operates from cellular level to field studies. The staffcomplement is about 800 with 500 working at Rothamsted.
Annual income is about £27M of which about 40% is derived from non-government sourcesi.e., industry levy boards and European Commission funds.
BicalBical was established by a group of West Country farmers in England 1998. Bical offers apractical understanding of establishing and marketing this crop, with its own well qualifiedtechnical staff and agronomists. It also employs a team of practical farmer members who visit allnew growers and provide a close, practical based advisory service on each and every farm.

78
APPENDIX 10
KEY STAFF
John Hewson: EPR ElyProject DirectorQualifications: MSc Energy Engineering
BSc Environmental Science
Previous Experience: John was specifically recruited by EPR to deliver the £60m Ely StrawPower Station Project. He was responsible for negotiating the contracts associated with thescheme and managed the project through financial close. He lives in East Anglia and has a long-term role in the construction and future of EPR. He is currently responsible for the establishmentof Anglian Straw, which will become the UK’s largest straw logistic company. Before joiningEPR, John worked for AEP, the development arm of Compagnie Generale des Eaux, the world’slargest operator of EFW plants. As Project Manager he spent 6 years developing MSW Waste toEnergy and Biomass plants. Prior to this, he spent 10 years working for a leading environmentalconsultancy group, culminating in the project management of two landmark Refuse Derived Fuelpower plants.
Dudley Christian: IACRProject LeaderQualification: BSc
Previous Experience: Dudley is project leader on energy crops research at RothamstedExperimental Station. He has been conducting research on herbaceous energy crops since 1993. Hehas participated in the EU funded Miscanthus network and currently in both the EU fundedMiscanthus Improvement Programme and the EU Switchgrass Evaluation Project. He has alsoparticipated in a number of ETSU funded projects. Prior to these he conducted research on soilcultivation, agronomy of cereals and cover crops, control of volunteer cereals and the dynamics ofN uptake in barley. He has a BSc. in agriculture and HND in agricultural engineering.
Robert Newman: EPR Ltd., Technical ManagerQualifications: BSc Mech Engineering
Previous Experience: Robert has over 30 years experience in engineering, with the last 20 yearsbeing directly involved in energy and design. As a senior engineer he has specific expertise incombustion, fuels, fuel handling, control systems, the efficient use of energy and has designed andbuilt energy systems world wide.
Amber Jenkins: EPR Ltd., Energy Development ExecutiveQualifications: BSc Environmental Geology
Previous Experience: Amber has sound experience in environmental engineering, spending thelast 5 years directly involved in renewable energy development, particularly in biomass

79
applications on a variety of scales. Amber is currently completing her MSc in Renewable EnergyTechnology with CREST at Loughborough University and is specialising in biomass fuels andtechnology. Amber’s role in EPRL covers areas such as plant procurement, project development,and the preparation of IPPC applications and Environmental Impact Assessments. She hasmanaged several grant-aided biomass (energy crop) projects and is part of the biomassdevelopment team.
Nigel Viney: Director European Renewables Ltd.Project ManagerQualifications: H.N.D Agriculture
Previous Experience: Nigel has been involved in agricultural merchandising since leavingShuttleworth Agricultural College. He gained a wide experience dealing with all aspects of arablefarming and trading, whilst working for Sidney C. Banks plc. Five years ago, Nigel progressed tobecome Arable Manager for Banks Agriculture. During this period he was responsible for theoverall management of that company’s involvement in both wood and straw firing of powerstations.
Nigel is a Director of European Biofuels Ltd. and European Renewables Ltd.
Andy Middleton:
As Operations Manager for Anglian Straw Ltd., Andy is responsible for all the day-to-dayoperation of ASL’s straw gathering activities. These responsibilities include the organisation ofbringing all contracted and special deliveries of baled straw to site; beginning with the crop in thefield and culminating in site storage.