Embed Size (px)
Citation preview
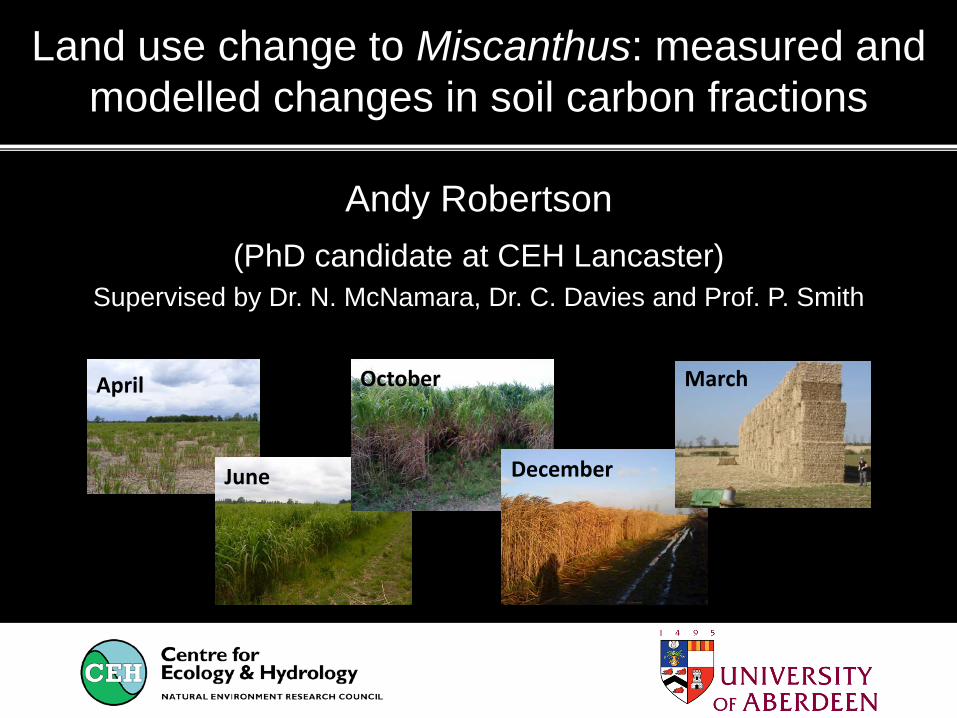
Land use change to Miscanthus: measured and modelled changes in soil carbon fractions
Andy Robertson (PhD candidate at CEH Lancaster)
Supervised by Dr. N. McNamara, Dr. C. Davies and Prof. P. Smith
April
June
October
December
March
Problems and solutions Ba
ckgr
ound
and
Con
text
• Climate change policy means governments are committed to offsetting greenhouse gas emissions
• Bioenergy has the potential to displace some demand for fossil fuels and it’s renewable
• Before we implement - sustainability criteria • Carbon budgets, ecosystem services, biodiversity...
• Effects are location dependent but measuring everywhere is impossible – therefore, we model
Why Miscanthus? Ba
ckgr
ound
and
Con
text
• C4 species growing up to 4 meters tall that can produce >15 dry t aboveground and >20 dry t belowground per ha per yr
• High sequestration potential through large C inputs
• Miscanthus C has a different isotopic signature to soil C in the UK allowing changes to be quantified
• Ideal annual life cycle for studying these C cycles
Miscanthus life cycle Ba
ckgr
ound
and
Con
text
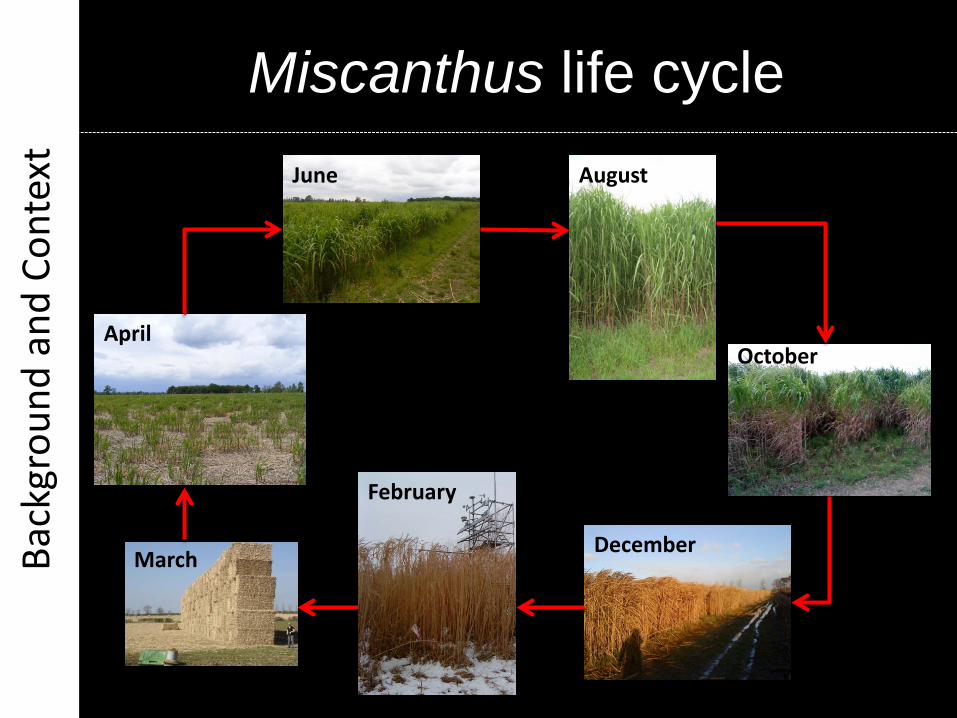
April
June August
March December
October
February
Miscanthus C inputs Ba
ckgr
ound
and
Con
text
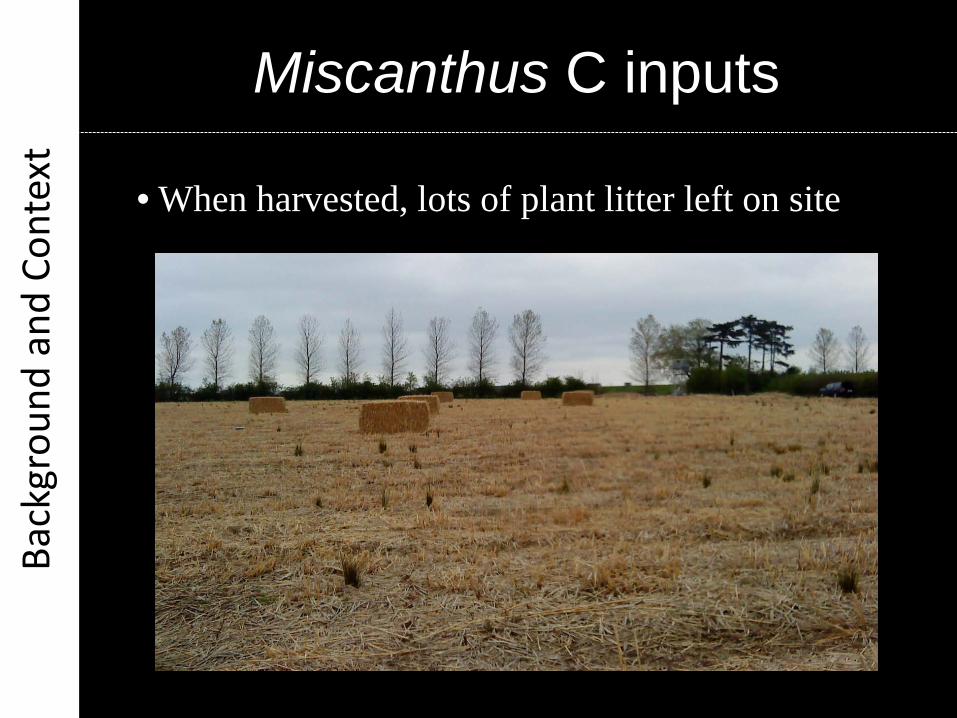
• When harvested, lots of plant litter left on site
Project aim #1 Ai
m #
1 –
Part
ition
ing
soil
C st
ocks
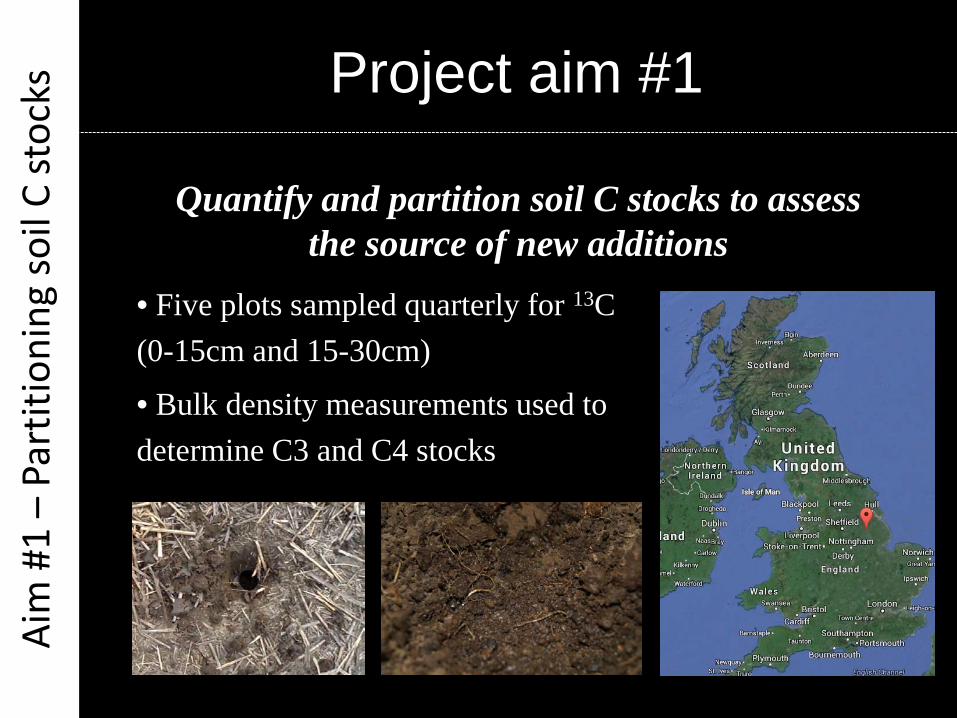
Quantify and partition soil C stocks to assess the source of new additions
• Five plots sampled quarterly for 13C (0-15cm and 15-30cm)
• Bulk density measurements used to determine C3 and C4 stocks
Photo credit: Kim Parmar
Partitioning soil C stocks (0-15cm)
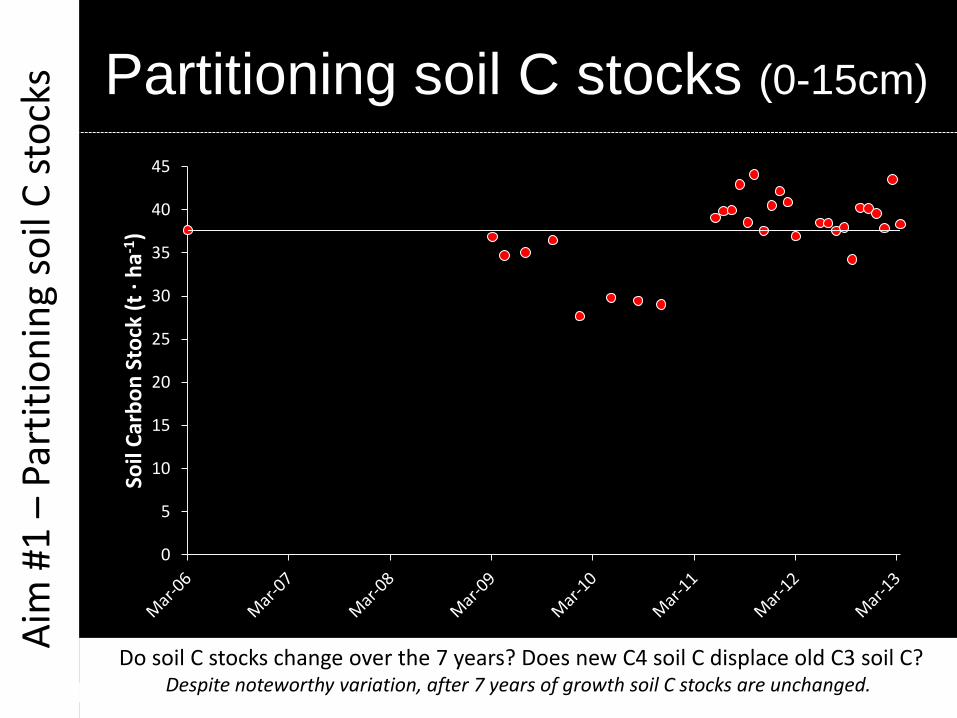
Do soil C stocks change over the 7 years? Does new C4 soil C displace old C3 soil C? Despite noteworthy variation, after 7 years of growth soil C stocks are unchanged.
Aim
#1
– Pa
rtiti
onin
g so
il C
stoc
ks
0
5
10
15
20
25
30
35
40
45
Soil
Carb
on S
tock
(t ·
ha-1
)
0
5
10
15
20
25
30
35
40
45
Soil
Carb
on S
tock
(t ·
ha-1
)
C4 Soil C
C3 Soil C
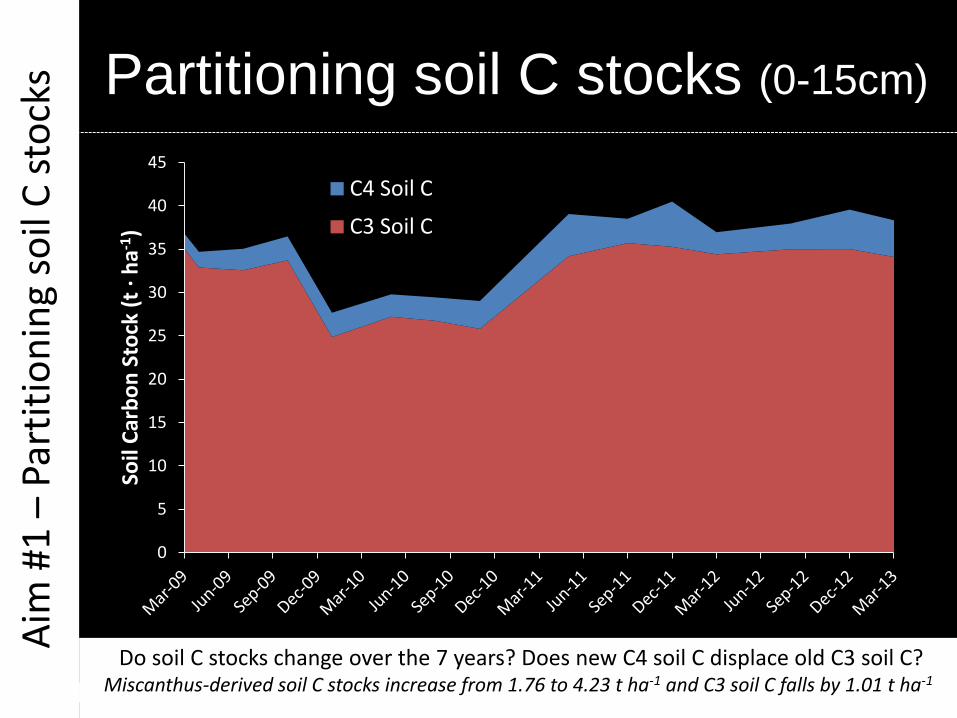
Partitioning soil C stocks (0-15cm)
Do soil C stocks change over the 7 years? Does new C4 soil C displace old C3 soil C? Miscanthus-derived soil C stocks increase from 1.76 to 4.23 t ha-1 and C3 soil C falls by 1.01 t ha-1
Aim
#1
– Pa
rtiti
onin
g so
il C
stoc
ks
Project aim #2 Ai
m #
2 –
Frac
tiona
ting
soil
C
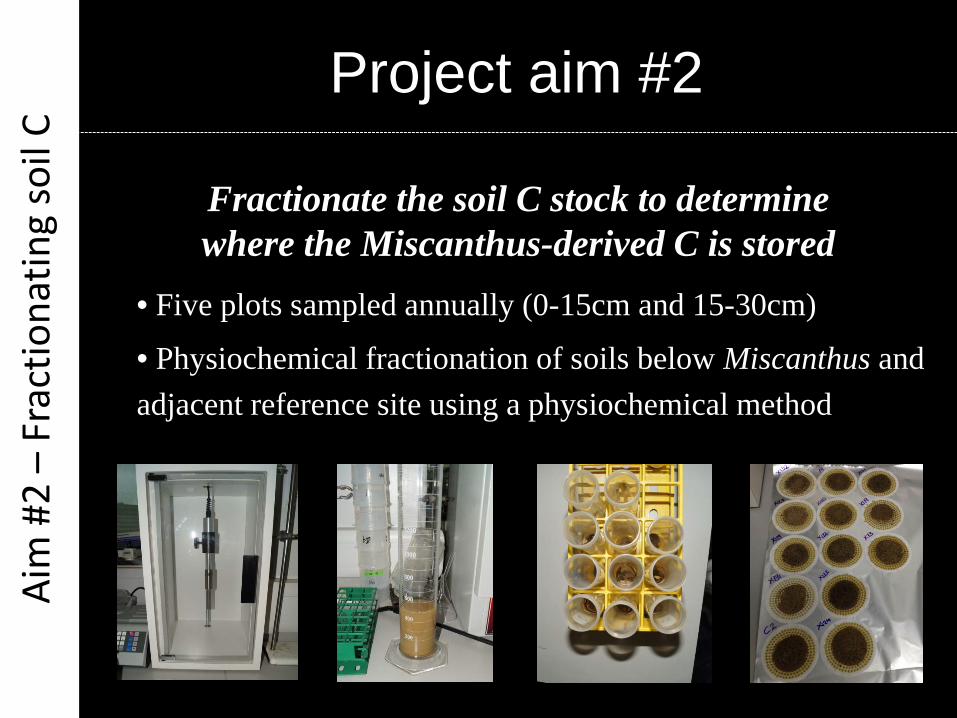
Fractionate the soil C stock to determine where the Miscanthus-derived C is stored
• Five plots sampled annually (0-15cm and 15-30cm)
• Physiochemical fractionation of soils below Miscanthus and adjacent reference site using a physiochemical method
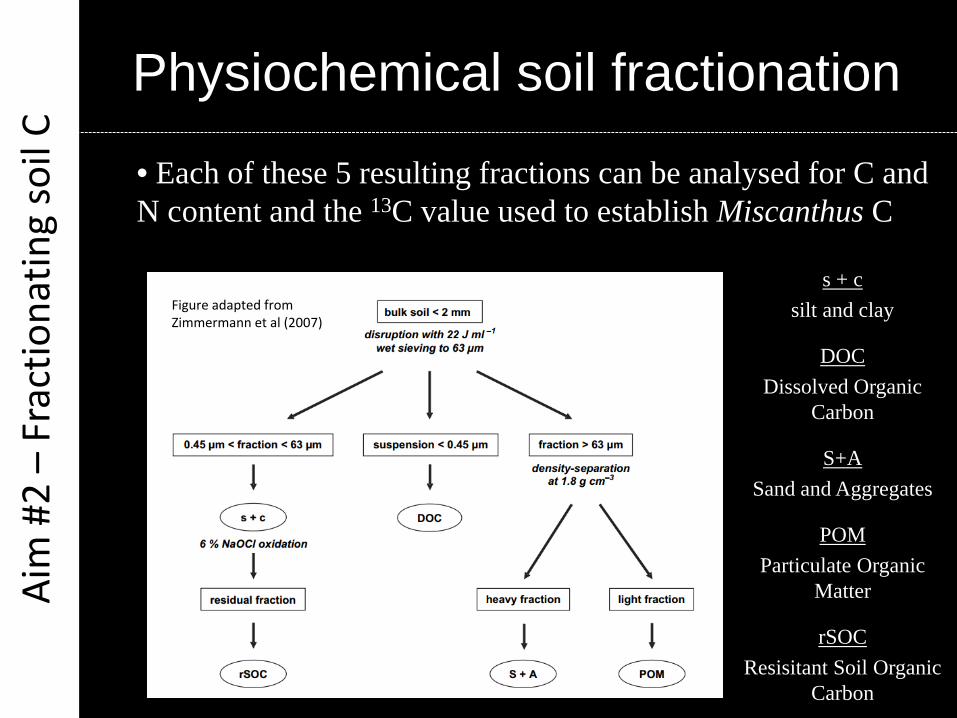
• Each of these 5 resulting fractions can be analysed for C and N content and the 13C value used to establish Miscanthus C
Physiochemical soil fractionation
s + c silt and clay
DOC Dissolved Organic
Carbon
S+A Sand and Aggregates
POM Particulate Organic
Matter
rSOC Resisitant Soil Organic
Carbon
Aim
#2
– Fr
actio
natin
g so
il C
Figure adapted from Zimmermann et al (2007)
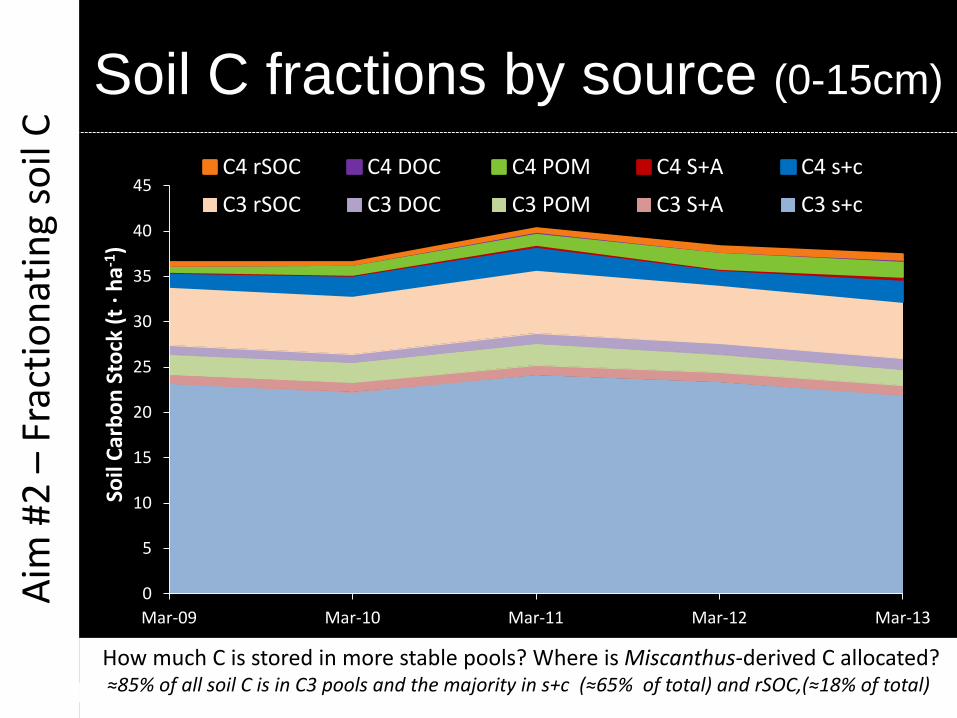
Soil C fractions by source (0-15cm)
How much C is stored in more stable pools? Where is Miscanthus-derived C allocated? ≈85% of all soil C is in C3 pools and the majority in s+c (≈65% of total) and rSOC,(≈18% of total)
0
5
10
15
20
25
30
35
40
45
Mar-09 Mar-10 Mar-11 Mar-12 Mar-13
Soil
Carb
on S
tock
(t ·
ha-1
)
C4 rSOC C4 DOC C4 POM C4 S+A C4 s+c C3 rSOC C3 DOC C3 POM C3 S+A C3 s+c
Aim
#2
– Fr
actio
natin
g so
il C
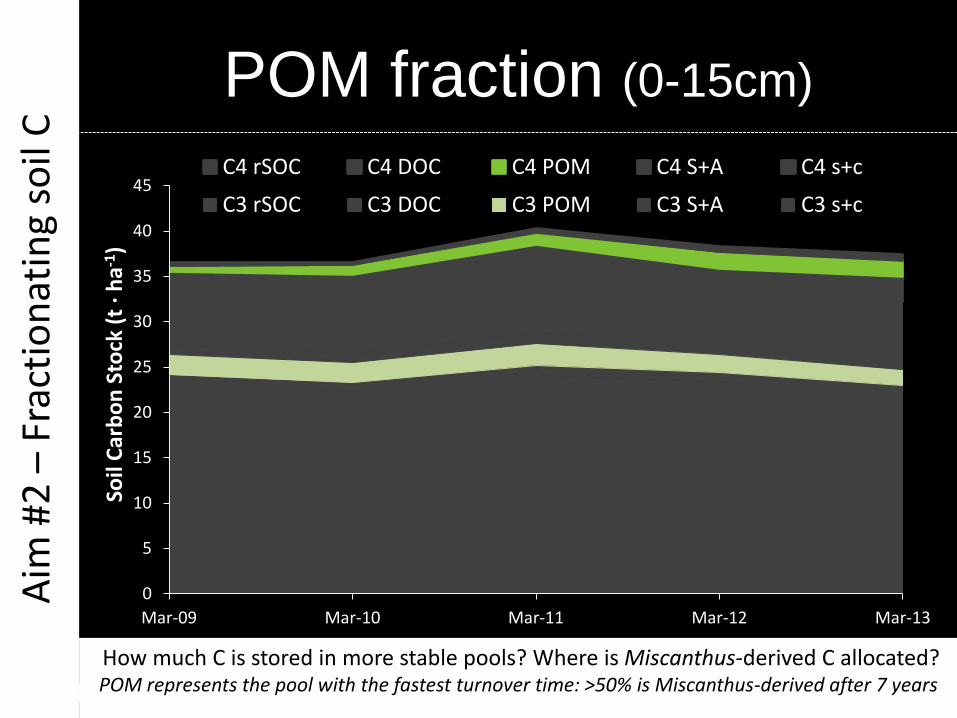
POM fraction (0-15cm)
How much C is stored in more stable pools? Where is Miscanthus-derived C allocated? POM represents the pool with the fastest turnover time: >50% is Miscanthus-derived after 7 years
0
5
10
15
20
25
30
35
40
45
Mar-09 Mar-10 Mar-11 Mar-12 Mar-13
Soil
Carb
on S
tock
(t ·
ha-1
)
C4 rSOC C4 DOC C4 POM C4 S+A C4 s+c C3 rSOC C3 DOC C3 POM C3 S+A C3 s+c
Aim
#2
– Fr
actio
natin
g so
il C
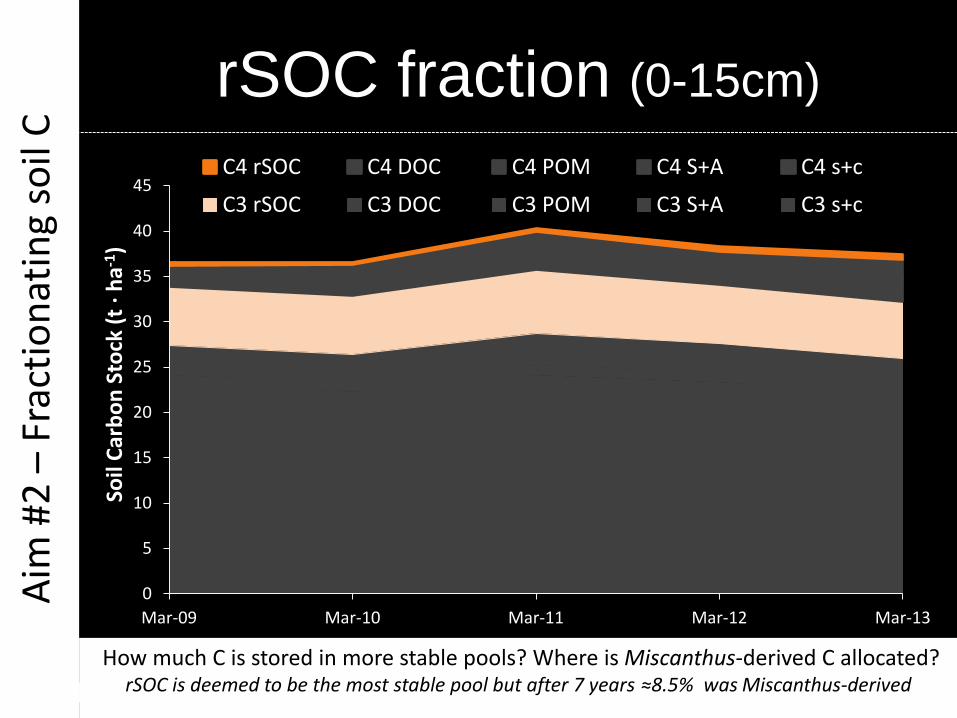
rSOC fraction (0-15cm)
How much C is stored in more stable pools? Where is Miscanthus-derived C allocated? rSOC is deemed to be the most stable pool but after 7 years ≈8.5% was Miscanthus-derived
0
5
10
15
20
25
30
35
40
45
Mar-09 Mar-10 Mar-11 Mar-12 Mar-13
Soil
Carb
on S
tock
(t ·
ha-1
)
C4 rSOC C4 DOC C4 POM C4 S+A C4 s+c C3 rSOC C3 DOC C3 POM C3 S+A C3 s+c
Aim
#2
– Fr
actio
natin
g so
il C
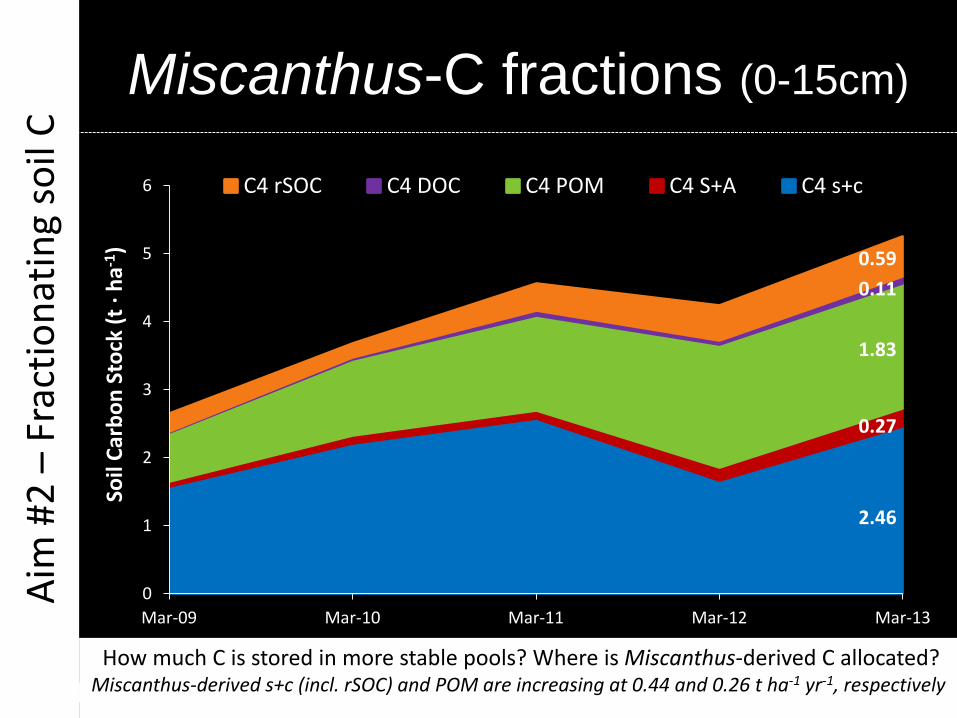
Miscanthus-C fractions (0-15cm)
How much C is stored in more stable pools? Where is Miscanthus-derived C allocated? Miscanthus-derived s+c (incl. rSOC) and POM are increasing at 0.44 and 0.26 t ha-1 yr-1, respectively
2.46
0.27
1.83
0.11 0.59
0
1
2
3
4
5
6
Mar-09 Mar-10 Mar-11 Mar-12 Mar-13
Soil
Carb
on S
tock
(t ·
ha-1
)
C4 rSOC C4 DOC C4 POM C4 S+A C4 s+c
Aim
#2
– Fr
actio
natin
g so
il C
Project aim #3 Ai
m #
3 –
Mea
sure
d fra
ctio
ns to
mod
el p
ools
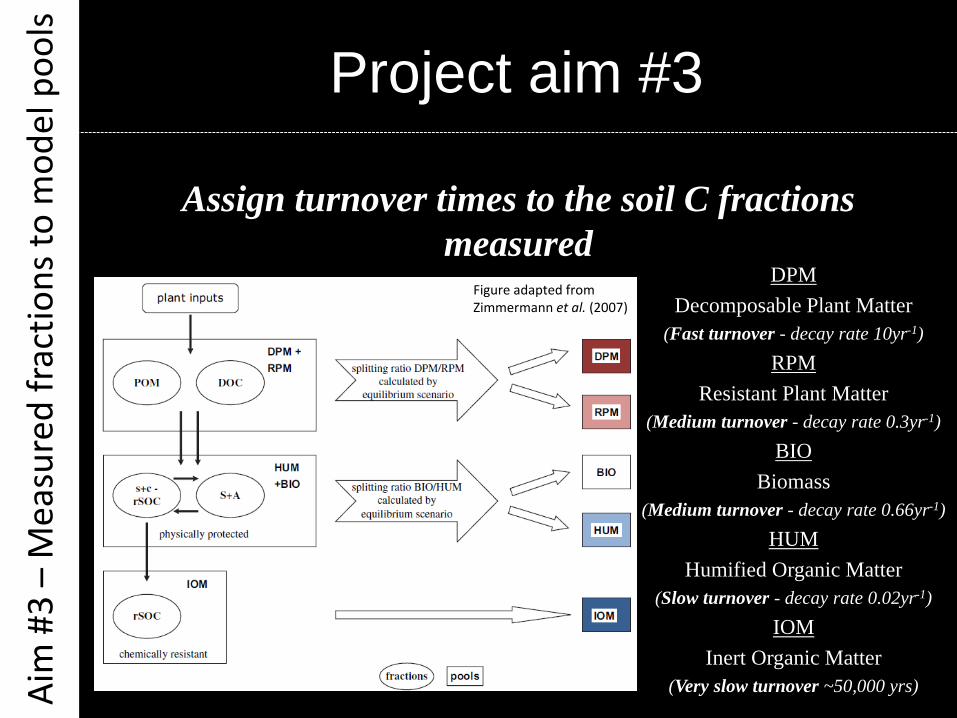
Assign turnover times to the soil C fractions measured
Figure adapted from Zimmermann et al. (2007)
DPM Decomposable Plant Matter
(Fast turnover - decay rate 10yr-1) RPM
Resistant Plant Matter (Medium turnover - decay rate 0.3yr-1)
BIO Biomass
(Medium turnover - decay rate 0.66yr-1) HUM
Humified Organic Matter (Slow turnover - decay rate 0.02yr-1)
IOM Inert Organic Matter
(Very slow turnover ~50,000 yrs)
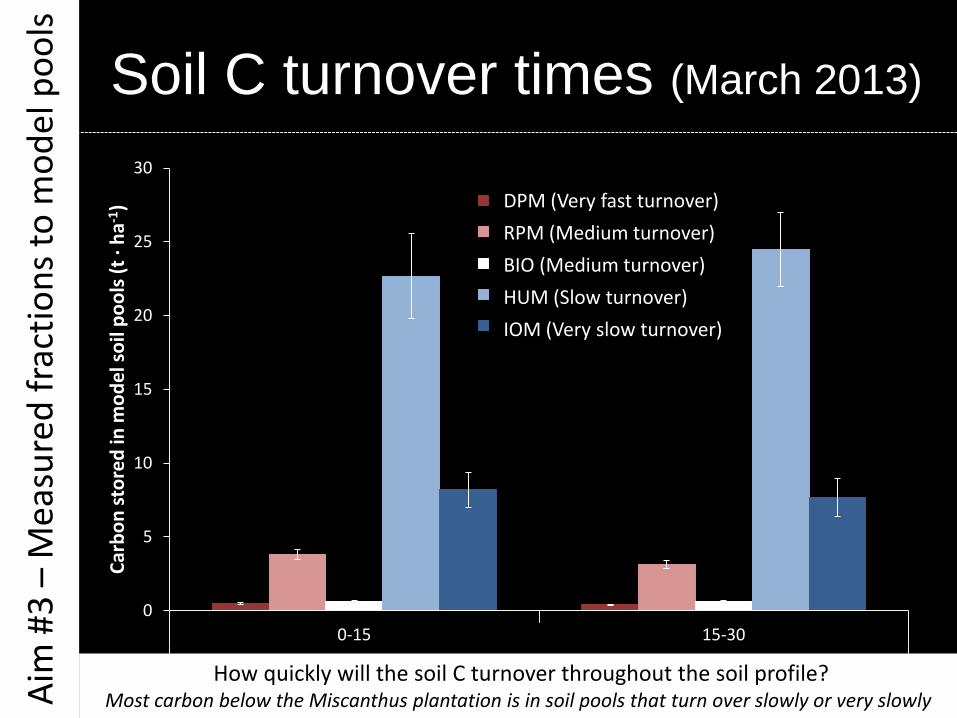
Soil C turnover times (March 2013)
0
5
10
15
20
25
30
0-15 15-30
Single Litter
Carb
on st
ored
in m
odel
soil
pool
s (t ·
ha-1
) Litter C (0-1yrs)
Litter C (1-100yrs)
Soil C (0-1yrs)
Soil C (1-100yrs)
Soil C (100+ yrs)
How quickly will the soil C turnover throughout the soil profile? Most carbon below the Miscanthus plantation is in soil pools that turn over slowly or very slowly Ai
m #
3 –
Mea
sure
d fra
ctio
ns to
mod
el p
ools
DPM (Very fast turnover) RPM (Medium turnover) BIO (Medium turnover) HUM (Slow turnover) IOM (Very slow turnover)
Future aims Ai
ms #
......
......
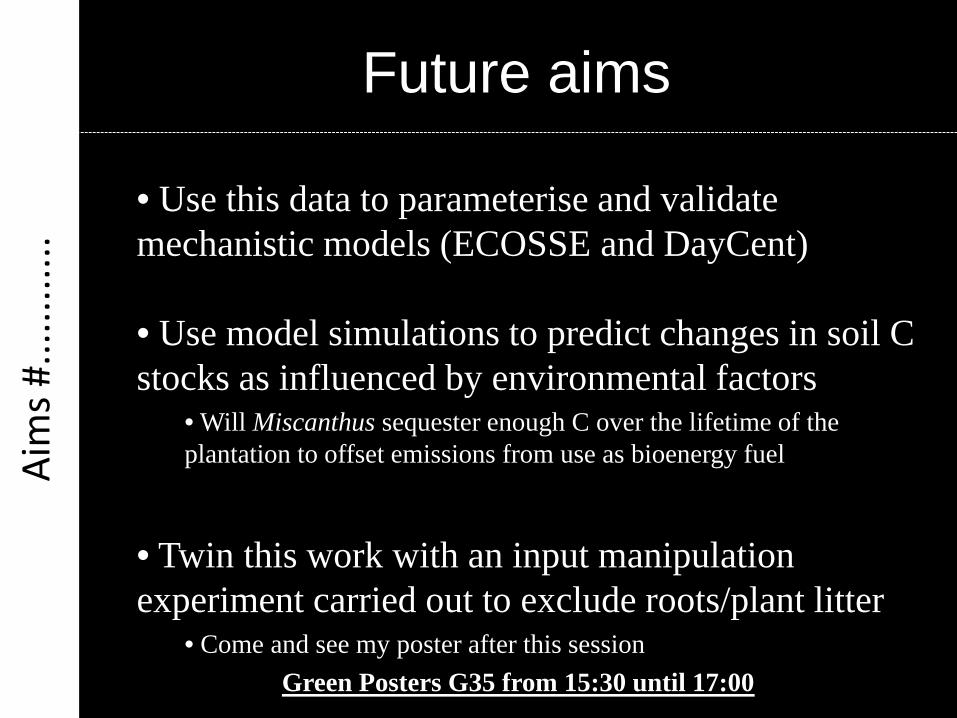
• Use this data to parameterise and validate mechanistic models (ECOSSE and DayCent)
• Use model simulations to predict changes in soil C stocks as influenced by environmental factors
• Will Miscanthus sequester enough C over the lifetime of the plantation to offset emissions from use as bioenergy fuel
• Twin this work with an input manipulation experiment carried out to exclude roots/plant litter
• Come and see my poster after this session Green Posters G35 from 15:30 until 17:00

Thank you! Th
ank
You!
Supervisors Niall McNamara (CEH Lancaster)
Pete Smith (University of Aberdeen)
Christian Davies (Shell)
Other acknowledgements Emily Bottoms Andy Stott Helen Grant Sean Case Mike Whitfield Simon Oakley Harriet Richardson Tom Walker Everyone else at CEH Lancaster!
AND THANK YOU FOR LISTENING! If you have any questions please ask
Project aim #X Ai
m #
X –
Part
ition
ing
soil
resp
iratio
n
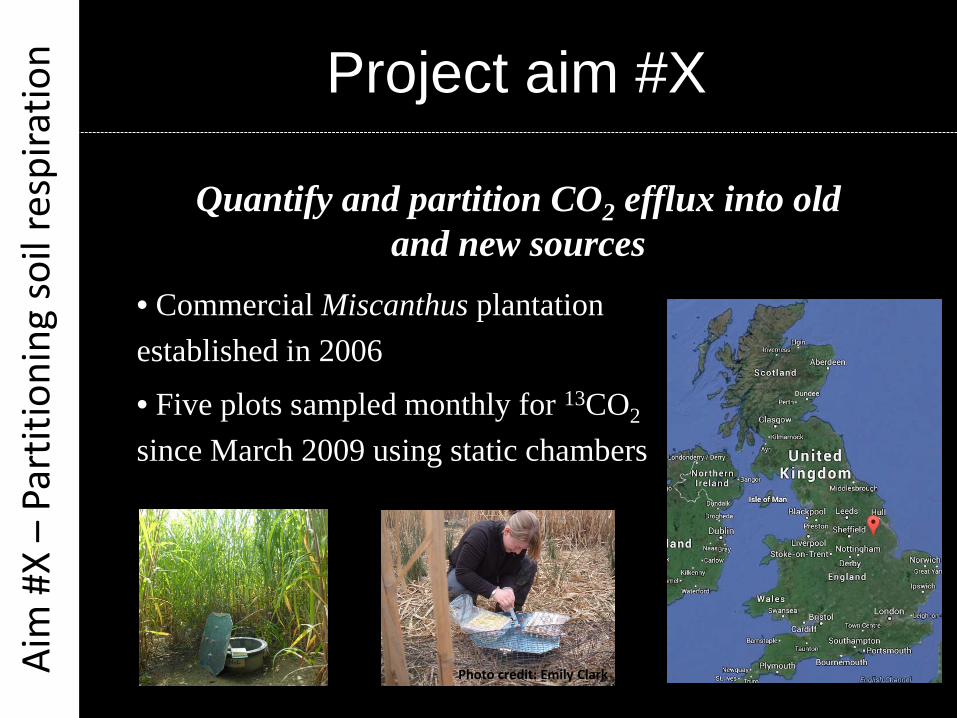
Quantify and partition CO2 efflux into old and new sources
• Commercial Miscanthus plantation established in 2006
• Five plots sampled monthly for 13CO2 since March 2009 using static chambers
Photo credit: Emily Clark
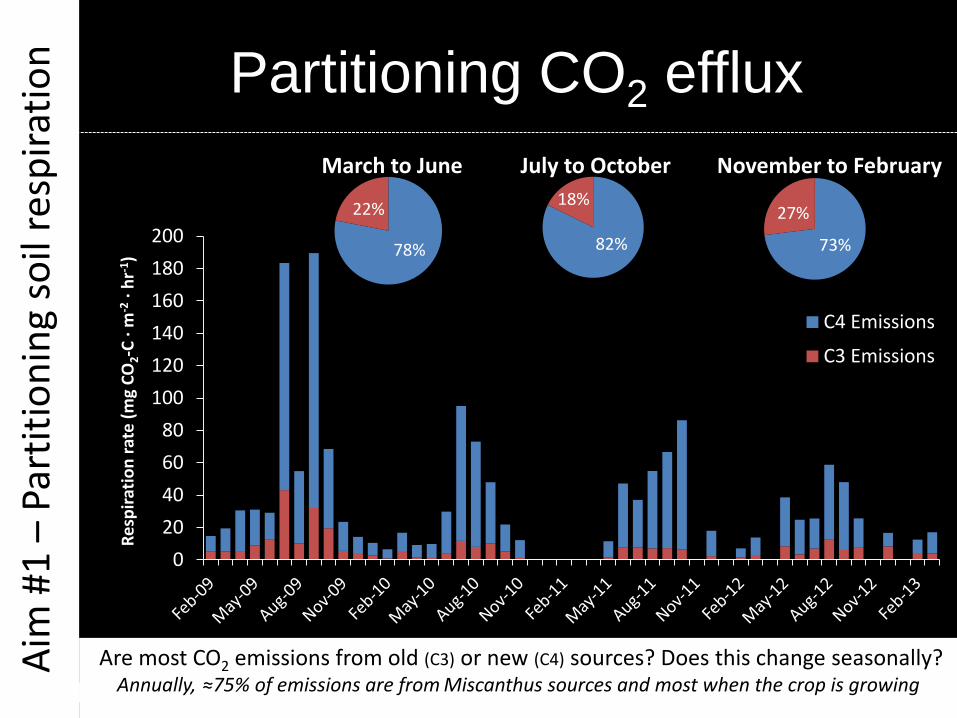
Partitioning CO2 efflux
Are most CO2 emissions from old (C3) or new (C4) sources? Does this change seasonally? Annually, ≈75% of emissions are from Miscanthus sources and most when the crop is growing
0 20 40 60 80
100 120 140 160 180 200
Resp
iratio
n ra
te (m
g CO
2-C
· m-2
· hr
-1)
C4 Emissions
C3 Emissions
78%
22%
March to June
82%
18%
July to October
73%
27%
November to February
Aim
#1
– Pa
rtiti
onin
g so
il re
spira
tion