Embed Size (px)
Citation preview
The carbon budget implications of establishing Miscanthus plantations
Andy Robertson (PhD candidate at CEH Lancaster)
Supervised by Dr. N. McNamara, Dr. C. Davies and Prof. P. Smith with help from Dr. E. Bottoms, Dr. A. Stott and H. Grant
Problems and solutions
• National governments are committed to reducing CO2 emissions
• But as energy demands increase so too do CO2 emissions from fossil fuel derived energy
• Renewable sources of energy are likely to be part of the solution
• Bioenergy has great potential but uncertain just how beneficial it can be - data is lacking!
Viability of bioenergy
• Sustainability criteria required before implementation • Ecosystem services, carbon budgets, biodiversity...
• This research focuses on C budgets and C cycling
• Benefits are very location dependent but measuring everywhere is impossible – therefore, modelling is required
• Several components of C cycling models are poorly quantified and this research aims to ‘fill the gaps’
Miscanthus as a bioenergy crop
• Very different to other crops currently grown in the UK
• Miscanthus is a C4 crop species that can grow up to 4 meters tall and produce >10 t · ha-1 · yr-1
• Miscanthus C has a different isotopic signature to soil C allowing changes to be quantified
• Ideal life cycle for annual biomass production
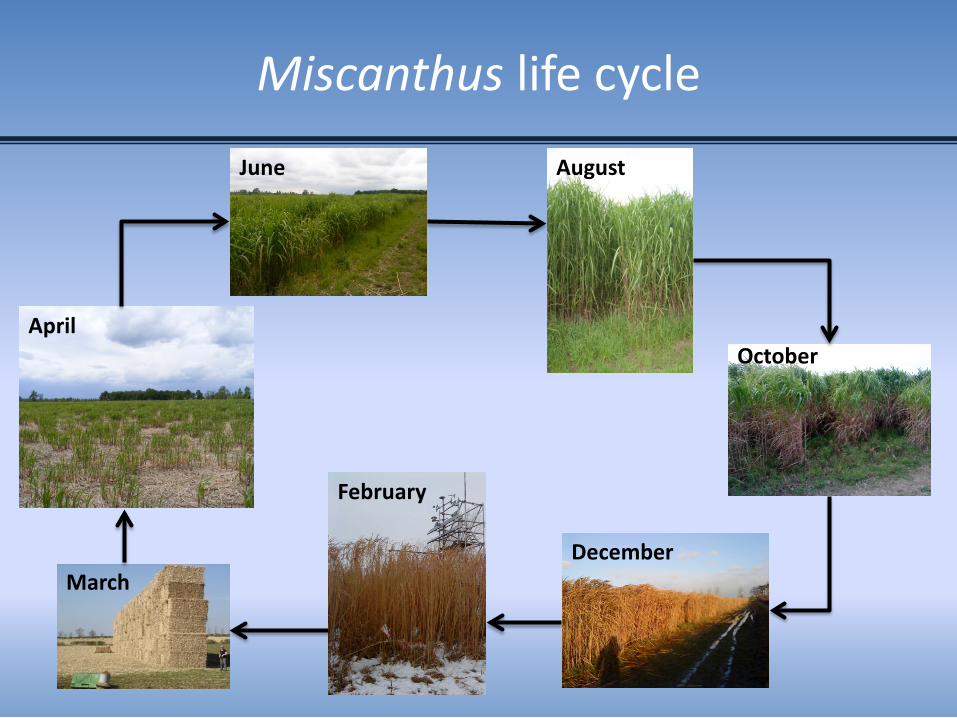
Miscanthus life cycle
April
June August
March December
October
February
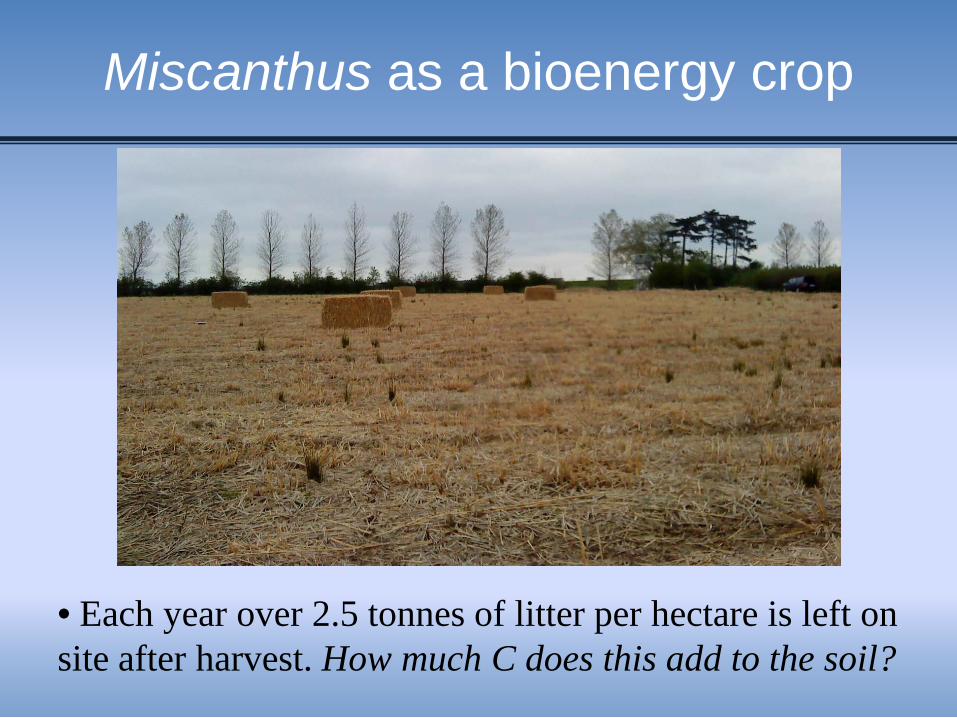
Miscanthus as a bioenergy crop
• Each year over 2.5 tonnes of litter per hectare is left on site after harvest. How much C does this add to the soil?
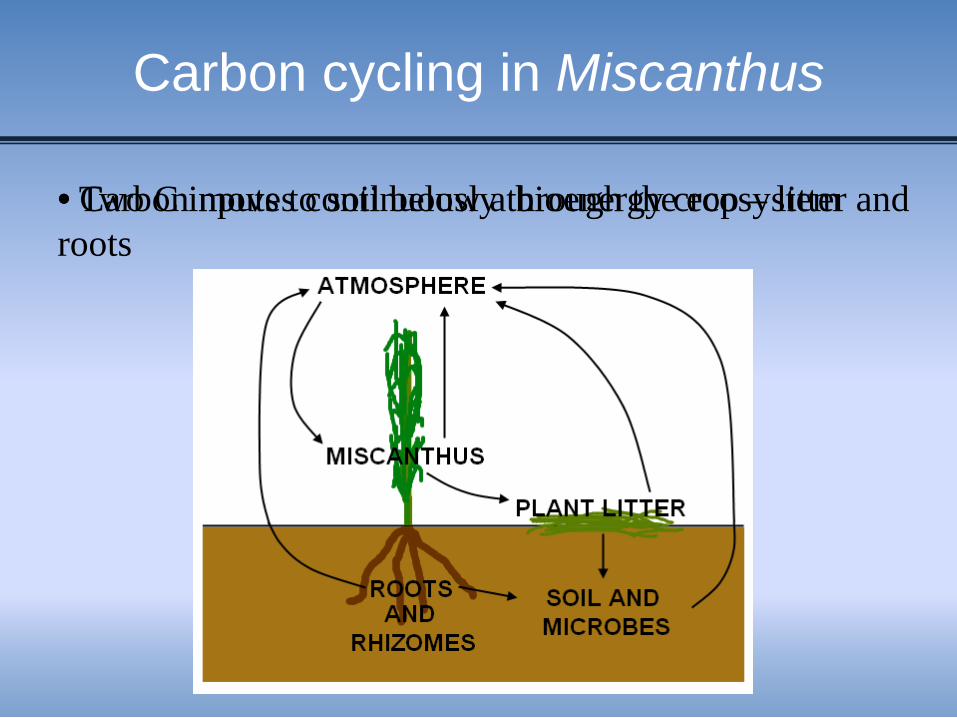
Carbon cycling in Miscanthus
• Carbon moves continuously through the ecosystem • Two C inputs to soil below a bioenergy crop – litter and roots
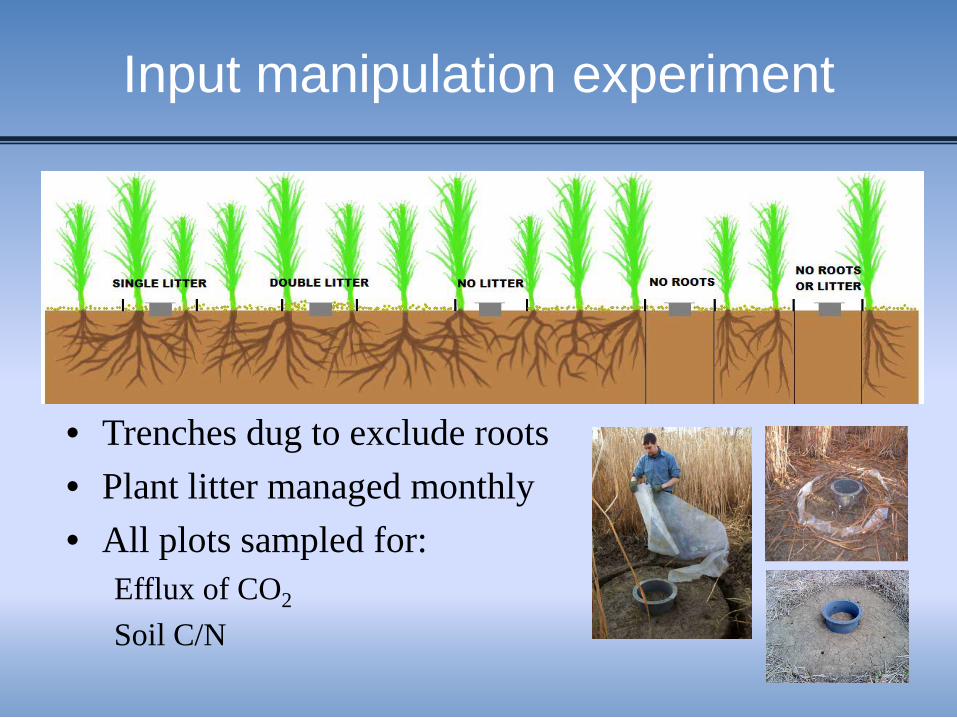
Input manipulation experiment
• Trenches dug to exclude roots • Plant litter managed monthly • All plots sampled for:
Efflux of CO2
Soil C/N
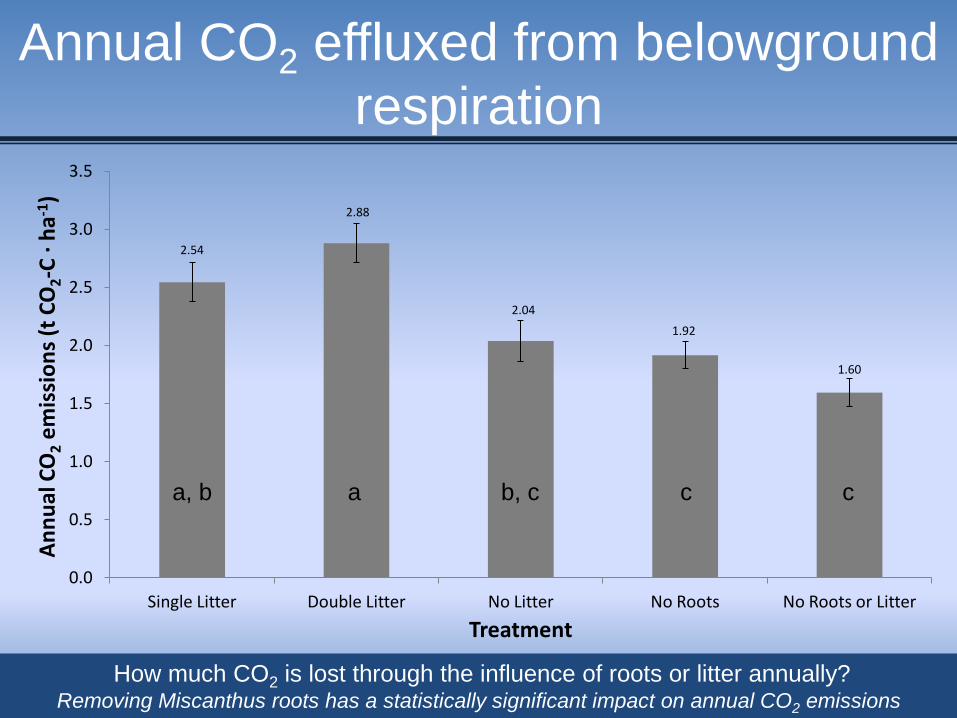
2.54
2.88
2.04
1.92
1.60
0.0
0.5
1.0
1.5
2.0
2.5
3.0
3.5
Single Litter Double Litter No Litter No Roots No Roots or Litter
Ann
ual C
O2 e
mis
sion
s (t
CO
2-C
∙ ha-1
)
Treatment
Annual CO2 effluxed from belowground respiration
a, b a b, c c c
How much CO2 is lost through the influence of roots or litter annually? Removing Miscanthus roots has a statistically significant impact on annual CO2 emissions
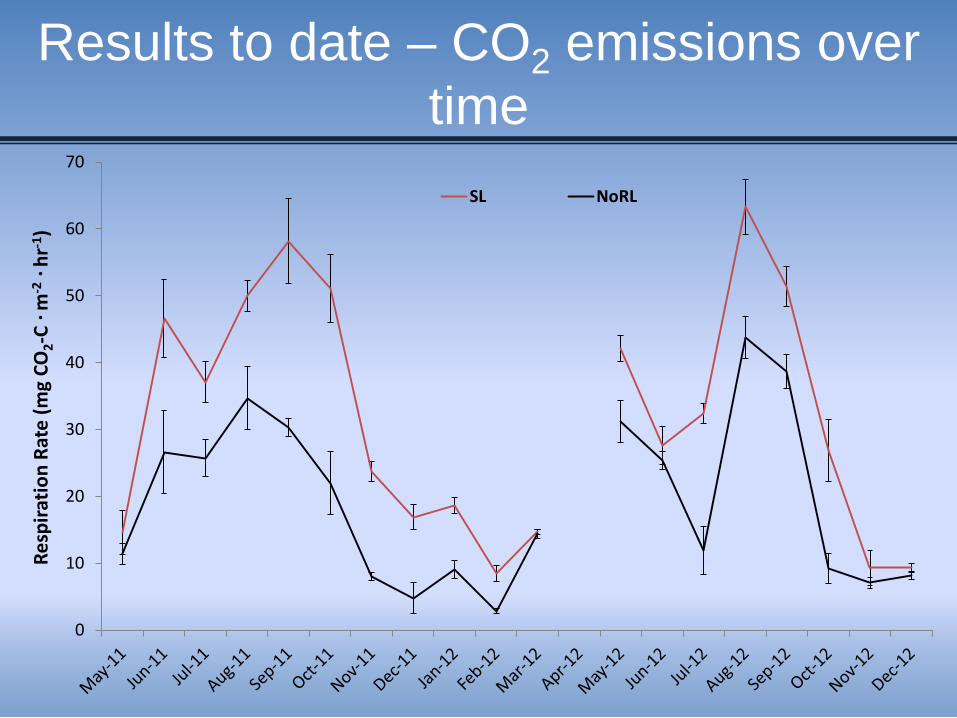
Results to date – CO2 emissions over time
0
10
20
30
40
50
60
70
Resp
irat
ion
Rate
(mg
CO2-
C · m
-2 ·
hr-1
)
SL NoRL
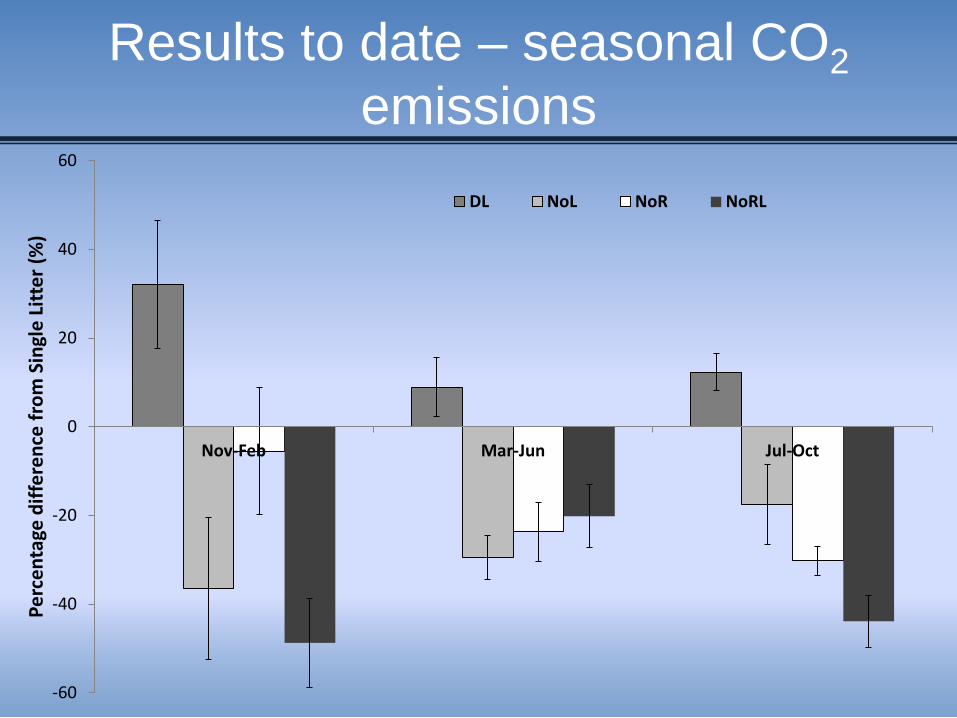
Results to date – seasonal CO2 emissions
-60
-40
-20
0
20
40
60
Nov-Feb Mar-Jun Jul-Oct
Perc
enta
ge d
iffer
ence
from
Sin
gle
Litt
er (%
)
DL NoL NoR NoRL
Miscanthus as a bioenergy crop
• Miscanthus C has a different isotopic signature to the soil allowing belowground respiration to be partitioned
• This also allows the C from the plant to be traced into the C in the soil
• Working with SIF upstairs to use 13CO2 values to track how much CO2 is Miscanthus-derived.
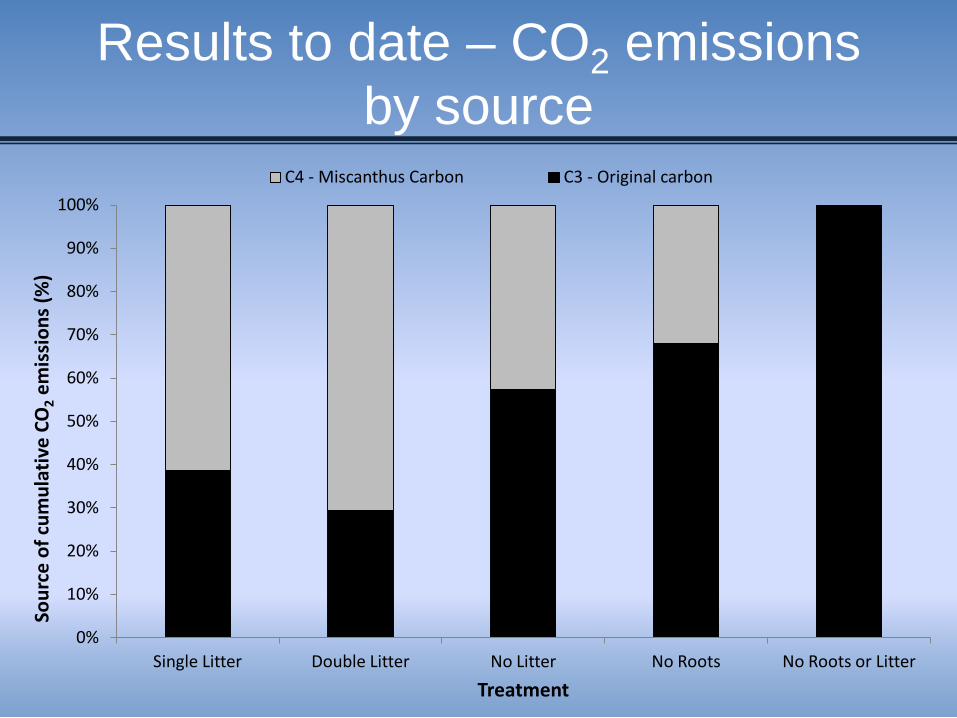
Results to date – CO2 emissions by source
0%
10%
20%
30%
40%
50%
60%
70%
80%
90%
100%
Single Litter Double Litter No Litter No Roots No Roots or Litter
Sour
ce o
f cum
ulat
ive
CO2 e
mis
sion
s (%
)
Treatment
C4 - Miscanthus Carbon C3 - Original carbon
Future research
• Finish off measurements from current season and quantify litter C additions
• Study the amount of Miscanthus C in soil from different treatments
• Remove treatment effects on abiotic factors and determine if differences in C efflux are still significant
• Working with modellers in Aberdeen and Colorado to apply the data to C cycling models
Acknowledgements
Supervisors Niall McNamara (CEH Lancaster)
Pete Smith (University of Aberdeen)
Christian Davies (Shell Global Solutions)
Other acknowledgements Emily Bottoms Andy Stott Helen Grant Sean Case Mike Whitfield Simon Oakley Harriet Rea Photo credits to Emily Bottoms and www.SimplyNetworking.com
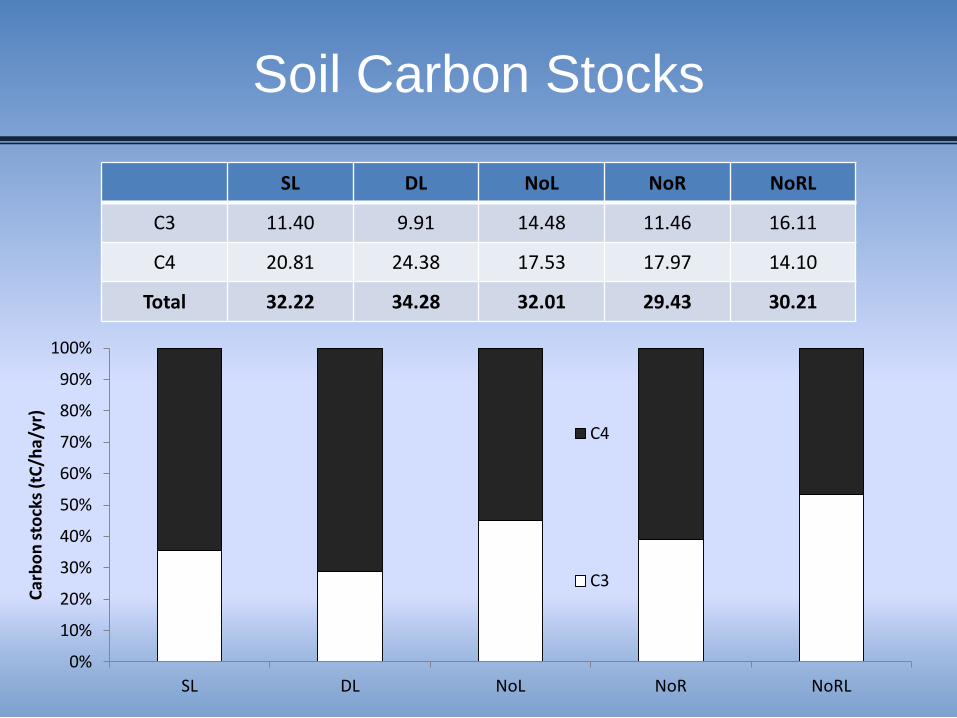
Soil Carbon Stocks
SL DL NoL NoR NoRL
C3 11.40 9.91 14.48 11.46 16.11
C4 20.81 24.38 17.53 17.97 14.10
Total 32.22 34.28 32.01 29.43 30.21
0%
10%
20%
30%
40%
50%
60%
70%
80%
90%
100%
SL DL NoL NoR NoRL
Carb
on s
tock
s (t
C/ha
/yr)
C4
C3