Embed Size (px)
Citation preview
Minimum change in spherical aberration that can be perceived
SILVESTRE MANZANERA AND PABLO ARTAL*
Laboratorio de Óptica, Instituto Universitario de Investigación en Óptica y Nanofísica, Universidad de Murcia, Campus de Espinardo (Edificio 34), E-30100, Murcia Spain *[email protected]
Abstract: It is important to know the visual sensitivity to optical blur from both a basic science perspective and a practical point of view. Of particular interest is the sensitivity to blur induced by spherical aberration because it is being used to increase depth of focus as a component of a presbyopic solution. Using a flicker detection-based procedure implemented on an adaptive optics visual simulator, we measured the spherical aberration thresholds that produce just-noticeable differences in perceived image quality. The thresholds were measured for positive and negative values of spherical aberration, for best focus and + 0.5 D and + 1.0 D of defocus. At best focus, the SA thresholds were 0.20 ± 0.01 µm and −0.17 ± 0.03 µm for positive and negative spherical aberration respectively (referred to a 6-mm pupil). These experimental values may be useful in setting spherical aberration permissible levels in different ophthalmic techniques. © 2016 Optical Society of America
OCIS codes: (330.4460) Ophthalmic optics and devices; (330.7327) Visual optics, ophthalmic instrumentation.
References and links
1. F. W. Campbell and G. Westheimer, “Sensitivity of the Eye to Differences in Focus,” J. Physiol. 143, 18 (1958). 2. G. E. Legge, K. T. Mullen, G. C. Woo, and F. W. Campbell, “Tolerance to visual defocus,” J. Opt. Soc. Am. A
4(5), 851–863 (1987). 3. G. Walsh and W. N. Charman, “Visual sensitivity to temporal change in focus and its relevance to the
accommodation response,” Vision Res. 28(11), 1207–1221 (1988). 4. R. J. Jacobs, G. Smith, and C. D. C. Chan, “Effect of defocus on blur thresholds and on thresholds of perceived
change in blur: comparison of source and observer methods,” Optom. Vis. Sci. 66(8), 545–553 (1989). 5. D. A. Atchison, W. N. Charman, and R. L. Woods, “Subjective Depth-of-Focus of the Eye,” Optom. Vis. Sci.
74(7), 511–520 (1997). 6. D. A. Atchison, S. W. Fisher, C. A. Pedersen, and P. G. Ridall, “Noticeable, troublesome and objectionable
limits of blur,” Vision Res. 45(15), 1967–1974 (2005). 7. S. Vitale, L. Ellwein, M. F. Cotch, F. L. Ferris 3rd, and R. Sperduto, “Prevalence of Refractive Error in the
United States, 1999-2004,” Arch. Ophthalmol. 126(8), 1111–1119 (2008). 8. E. A. Villegas, E. Alcón, and P. Artal, “Minimum amount of astigmatism that should be corrected,” J. Cataract
Refract. Surg. 40(1), 13–19 (2014). 9. D. A. Atchison and H. Guo, “Subjective Blur Limits for Higher Order Aberrations,” Optom. Vis. Sci. 87(11),
E890–E898 (2010). 10. E. J. Fernández and P. Artal, “Study on the effects of monochromatic aberrations in the accommodation response
by using adaptive optics,” J. Opt. Soc. Am. A 22(9), 1732–1738 (2005). 11. E. F. Fincham, “The accommodation reflex and its stimulus,” Br. J. Ophthalmol. 35(7), 381–393 (1951). 12. B. Wang, K. J. Ciuffreda, and J. Miller, “Depth-of-focus of the human eye: theory and clinical implications,”
Surv. Ophthalmol. 51(1), 75–85 (2006). 13. N. D. Haig and G. J. Burton, “Effects of wavefront aberration on visual instrument performance, and a
consequential test technique,” Appl. Opt. 26(3), 492–500 (1987). 14. G. J. Burton and N. D. Haig, “Effects of the Seidel aberrations on visual target discrimination,” J. Opt. Soc. Am.
A 1(4), 373–385 (1984). 15. H. W. Babcock, “The possibility of compensating astronomical seeing,” Publ. Astron. Soc. Pacific|Publ. Astron.
Soc. Pac. 65, 229 (1953), doi:10.1086/126606. 16. J. Liang, D. R. Williams, and D. T. Miller, “Supernormal vision and high-resolution retinal imaging through
adaptive optics,” J. Opt. Soc. Am. A 14(11), 2884–2892 (1997). 17. D. A. Atchison, H. Guo, W. N. Charman, and S. W. Fisher, “Blur limits for defocus, astigmatism and trefoil,”
Vision Res. 49(19), 2393–2403 (2009). 18. D. A. Atchison, H. Guo, and S. W. Fisher, “Limits of spherical blur determined with an adaptive optics mirror,”
Ophthalmic Physiol. Opt. 49, 2393–2403 (2009).
Vol. 7, No. 9 | 1 Sep 2016 | BIOMEDICAL OPTICS EXPRESS 3471
#269450 Journal © 2016
http://dx.doi.org/10.1364/BOE.7.003471 Received 30 Jun 2016; revised 9 Aug 2016; accepted 11 Aug 2016; published 15 Aug 2016
19. Y. K. Nio, N. M. Jansonius, V. Fidler, E. Geraghty, S. Norrby, and A. C. Kooijman, “Spherical and irregular aberrations are important for the optimal performance of the human eye,” Ophthalmic Physiol. Opt. 22(2), 103–112 (2002).
20. S. Marcos, S. Barbero, and I. Jiménez-Alfaro, “Optical quality and depth-of-field of eyes implanted with spherical and aspheric intraocular lenses,” J. Refract. Surg. 21(3), 223–235 (2005).
21. E. A. Villegas, E. Alcón, S. Mirabet, I. Yago, J. M. Marín, and P. Artal, “Extended Depth of Focus With Induced Spherical Aberration in Light-Adjustable Intraocular Lenses,” Am. J. Ophthalmol. 157(1), 142–149 (2014).
22. P. A. Piers, E. J. Fernandez, S. Manzanera, S. Norrby, and P. Artal, “Adaptive optics simulation of intraocular lenses with modified spherical aberration,” Invest. Ophthalmol. Vis. Sci. 45(12), 4601–4610 (2004).
23. F. Yi, D. R. Iskander, and M. Collins, “Depth of focus and visual acuity with primary and secondary spherical aberration,” Vision Res. 51(14), 1648–1658 (2011).
24. E. J. Fernández, S. Manzanera, P. Piers, and P. Artal, “Adaptive optics visual simulator,” J. Refract. Surg. 18(5), S634–S638 (2002).
25. E. J. Fernández, P. M. Prieto, and P. Artal, “Binocular adaptive optics visual simulator,” Opt. Lett. 34(17), 2628–2630 (2009).
26. C. Schwarz, P. M. Prieto, E. J. Fernández, and P. Artal, “Binocular adaptive optics vision analyzer with full control over the complex pupil functions,” Opt. Lett. 36(24), 4779–4781 (2011).
27. C. Schwarz, S. Manzanera, and P. Artal, “Binocular visual performance with aberration correction as a function of light level,” J. Vis. 14(14), 6 (2014).
28. L. N. Thibos, R. A. Applegate, J. T. Schwiegerling, and R. Webb, “Standards for Reporting the Optical Aberrations of Eyes,” J. Refractive Surg. 18, S652–S660 (2000).
1. Introduction
The ability to estimate the human visual system’s tolerance to optically blurred images is important from different perspectives. On the one hand for basic research to extend the knowledge about the working principles of our vision and on the other hand from a practical point of view because it can be used to set the admissible range of errors with which optical instruments, or ophthalmic corrections, can be designed.
Among all the possible causes producing retinal blur, undoubtedly defocus related to refractive errors such as myopia or hyperopia is the most important and early studies investigated our tolerance to this type of blur. In 1958, Campbell and Westheimer [1] devised an experimental system consisting of a motor moving a target back and forth at a frequency of 2 Hz. This target was perceived by the subject with constant size and luminance and only defocus changed. By increasing the amplitude of the movement a threshold was reached at which the subject perceived changes in blur at the moving frequency. From this, they estimated that the minimum value of perceptible focus difference is around 0.2 D. Subsequently, further work [2–6] was carried out to study the effect of different factors such as pupil size, luminance, and object’s spatial frequency content.
Astigmatism is another relevant cause of optical blur affecting nearly a third of the population [7]. The sensitivity threshold to astigmatism was found to be around 0.3 D [8].
An additional source for blur in the retinal images are higher-order aberrations (HOA) [9]. Although HOA are typically of lesser magnitude than defocus or astigmatism, to estimate the sensitivity of the visual system to them is interesting because they are known to affect accommodation [10,11] and depth-of-focus (DoF) [12]. To our knowledge, the first studies that aimed to understand the sensitivity of HOA were carried out by Burton and Haig [13,14] in 1980’s. Due to the technical limitations in inducing controllable amounts of HOA at that time, they simulated the effect of HOAs by digital convolution of images that were presented to the observer producing on the retina a similar image to the one that would have been produced by the actual HOA. Adaptive optics (AO) [15,16] allowed precise and effective manipulation of HOA. This technique was used to further investigate the eye’s sensitivity thresholds for HOA [9,17,18].
Among all the HOA modes, especially relevant, for its well-known potential to increase DoF, is spherical aberration (SA) [19–21]. However, this increase is at the expense of blurring the retinal images [22,23]. In this trade-off, the maximum amount of SA that can be induced without being perceived by the subject is of interest. Burton and Haig [13,14] studied the Seidel SA threshold levels that produce a just-noticeable difference between an
Vol. 7, No. 9 | 1 Sep 2016 | BIOMEDICAL OPTICS EXPRESS 3472
aberration-free image and images digitally convolved with different amounts of SA using a forced-choice procedure. Atchison and Guo [9] measured both the Seidel and Zernike SA thresholds for different letters sizes using AO technology. By rotating a knob, the subject was able to modify the amount of induced aberration and the threshold was set following an adjustment procedure.
The aim of this work was to estimate the Zernike SA threshold values that produce a just-noticeable difference in image quality, hereafter the SA thresholds, using an AO visual simulator [24] through a flicker detection-based subjective procedure in a similar manner to that employed by Campbell and Westheimer [1]. It is anticipated that this procedure makes it easier for the subject to perceive changes to blur and thus more accurate SA thresholds could be determined.
2. Methods
2.1 Experimental system
The experimental apparatus employed in this work is a binocular adaptive optics visual simulator (BAOVS) which was used in previous studies [25–27]. Figure 1 shows a schematic diagram of the optical setup showing the main components. An organic light-emitting diode (OLED) micro display (eMagin, Bellevue, WA, USA) featuring a pixel pitch of 15 μm with a resolution of 800x600 is used to present visual stimuli to the subject. Two spatial-light-modulators (SLM) modify the optics through which these stimuli are seen by the subject. The first SLM (SLM-ampl) (LC2002 Holoeye, Berlin, Germany) works in amplitude mode to produce artificial apertures that limit the size of the subject’s natural pupils. The next SLM (SLM-phase) (PLUTO-VIS, Holoeye, Germany) is used to change the phase of the wave-front. Its full HD resolution allows shaping the wave-front with almost no limitations and simultaneously for both eyes. Both SLMs are optically conjugated with the subject’s pupils by means of 2 consecutive 4-f optical relays.
Ocular aberrations are measured by means of a Hartmann-Shack wave-front sensor (HS-WFS) which is composed of a lenslet array (OKOTech, Rijswijk, The Netherlands) (f’ = 3.17 mm; pitch = 192 μm) and a complementary metal–oxide–semiconductor (CMOS) camera (IDS, Obersulm, Germany) with size and resolution large enough (1280 x 1024) to allow the measurement of both eyes aberrations simultaneously. The necessary point source on the retina is provided by a near infrared (IR) diode laser (780 nm) with an irradiance below 2 μm/cm2 on the cornea, which is more than three orders of magnitude below the maximum permissible exposure for continuous viewing. An additional path consisting of a couple of light-emitting diode (LEDs) (850 nm) to illuminate the eyes and an additional camera (Pupil CAM) to acquire their images is incorporated to monitor the alignment between the subject’s pupils and the active areas on both SLMs and the HS-WFS. The different paths for visual testing, wave-front sensing and alignment monitoring are separated by the use of short-pass spectral filters (F1, F2) with the proper cut-off wavelengths.
Vol. 7, No. 9 | 1 Sep 2016 | BIOMEDICAL OPTICS EXPRESS 3473
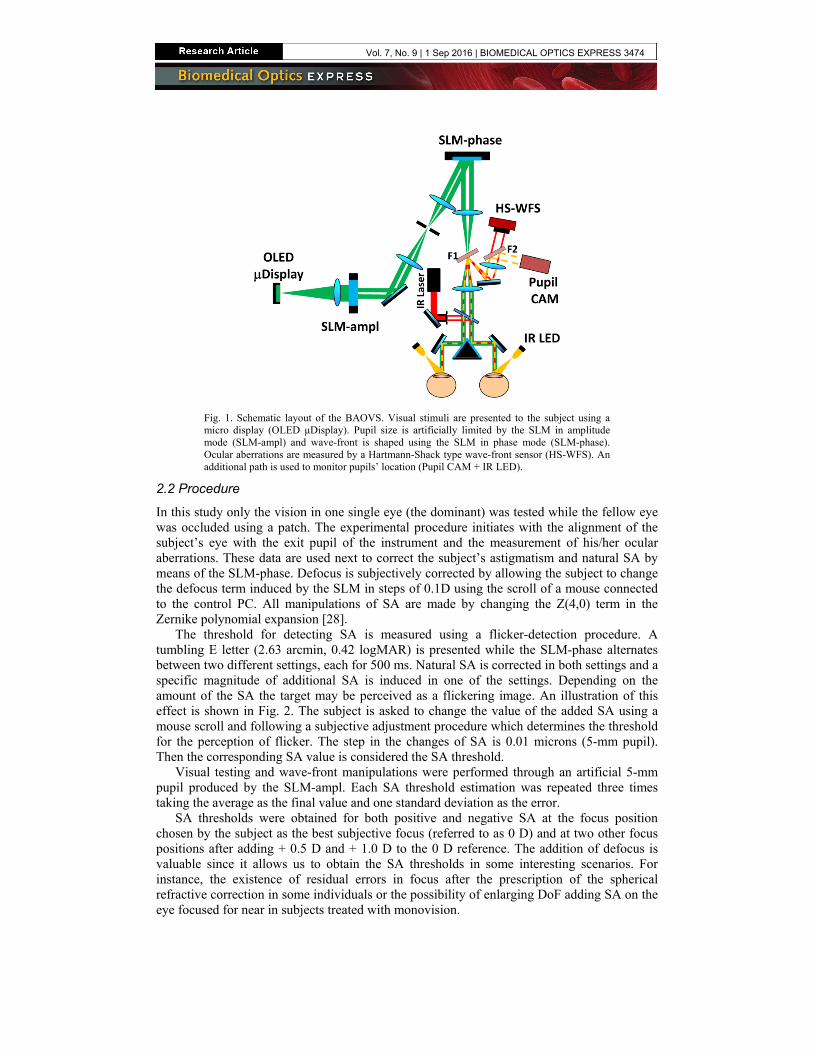
Fig. 1. Schematic layout of the BAOVS. Visual stimuli are presented to the subject using a micro display (OLED μDisplay). Pupil size is artificially limited by the SLM in amplitude mode (SLM-ampl) and wave-front is shaped using the SLM in phase mode (SLM-phase). Ocular aberrations are measured by a Hartmann-Shack type wave-front sensor (HS-WFS). An additional path is used to monitor pupils’ location (Pupil CAM + IR LED).
2.2 Procedure
In this study only the vision in one single eye (the dominant) was tested while the fellow eye was occluded using a patch. The experimental procedure initiates with the alignment of the subject’s eye with the exit pupil of the instrument and the measurement of his/her ocular aberrations. These data are used next to correct the subject’s astigmatism and natural SA by means of the SLM-phase. Defocus is subjectively corrected by allowing the subject to change the defocus term induced by the SLM in steps of 0.1D using the scroll of a mouse connected to the control PC. All manipulations of SA are made by changing the Z(4,0) term in the Zernike polynomial expansion [28].
The threshold for detecting SA is measured using a flicker-detection procedure. A tumbling E letter (2.63 arcmin, 0.42 logMAR) is presented while the SLM-phase alternates between two different settings, each for 500 ms. Natural SA is corrected in both settings and a specific magnitude of additional SA is induced in one of the settings. Depending on the amount of the SA the target may be perceived as a flickering image. An illustration of this effect is shown in Fig. 2. The subject is asked to change the value of the added SA using a mouse scroll and following a subjective adjustment procedure which determines the threshold for the perception of flicker. The step in the changes of SA is 0.01 microns (5-mm pupil). Then the corresponding SA value is considered the SA threshold.
Visual testing and wave-front manipulations were performed through an artificial 5-mm pupil produced by the SLM-ampl. Each SA threshold estimation was repeated three times taking the average as the final value and one standard deviation as the error.
SA thresholds were obtained for both positive and negative SA at the focus position chosen by the subject as the best subjective focus (referred to as 0 D) and at two other focus positions after adding + 0.5 D and + 1.0 D to the 0 D reference. The addition of defocus is valuable since it allows us to obtain the SA thresholds in some interesting scenarios. For instance, the existence of residual errors in focus after the prescription of the spherical refractive correction in some individuals or the possibility of enlarging DoF adding SA on the eye focused for near in subjects treated with monovision.
Vol. 7, No. 9 | 1 Sep 2016 | BIOMEDICAL OPTICS EXPRESS 3474
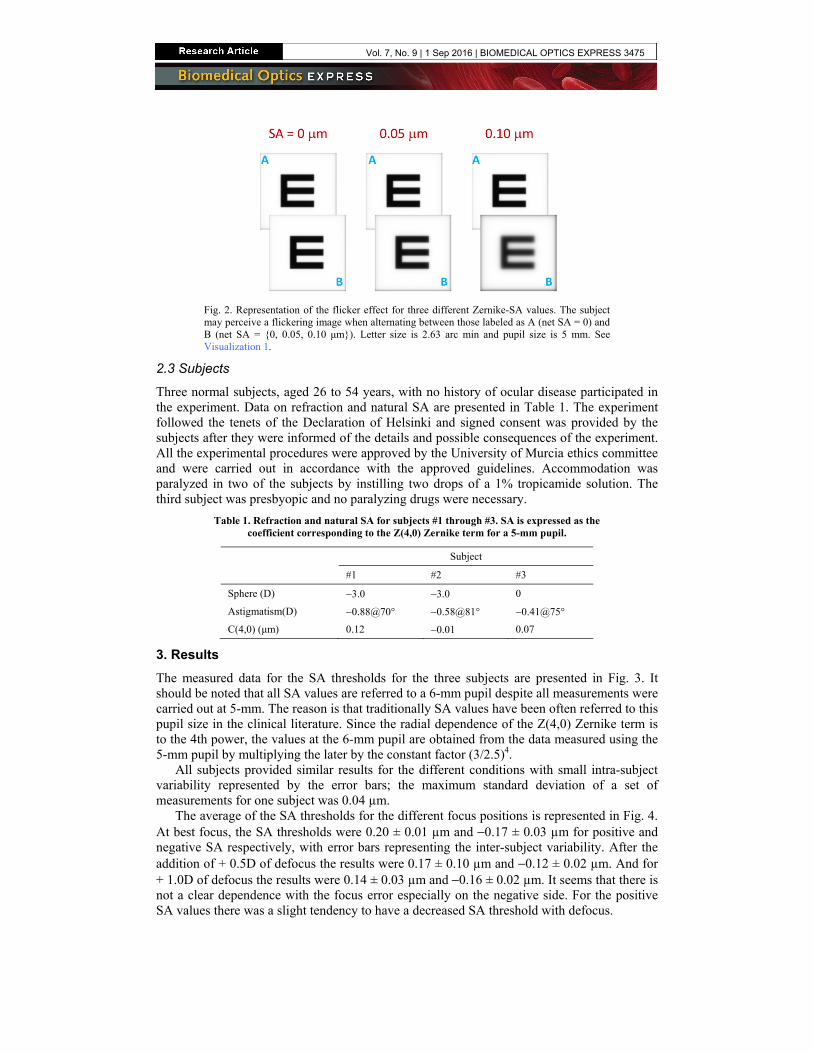
Fig. 2. Representation of the flicker effect for three different Zernike-SA values. The subject may perceive a flickering image when alternating between those labeled as A (net SA = 0) and B (net SA = {0, 0.05, 0.10 μm}). Letter size is 2.63 arc min and pupil size is 5 mm. See Visualization 1.
2.3 Subjects
Three normal subjects, aged 26 to 54 years, with no history of ocular disease participated in the experiment. Data on refraction and natural SA are presented in Table 1. The experiment followed the tenets of the Declaration of Helsinki and signed consent was provided by the subjects after they were informed of the details and possible consequences of the experiment. All the experimental procedures were approved by the University of Murcia ethics committee and were carried out in accordance with the approved guidelines. Accommodation was paralyzed in two of the subjects by instilling two drops of a 1% tropicamide solution. The third subject was presbyopic and no paralyzing drugs were necessary.
Table 1. Refraction and natural SA for subjects #1 through #3. SA is expressed as the coefficient corresponding to the Z(4,0) Zernike term for a 5-mm pupil.
Subject
#1 #2 #3
Sphere (D) −3.0 −3.0 0
Astigmatism(D) −0.88@70° −0.58@81° −0.41@75°
C(4,0) (μm) 0.12 −0.01 0.07
3. Results
The measured data for the SA thresholds for the three subjects are presented in Fig. 3. It should be noted that all SA values are referred to a 6-mm pupil despite all measurements were carried out at 5-mm. The reason is that traditionally SA values have been often referred to this pupil size in the clinical literature. Since the radial dependence of the Z(4,0) Zernike term is to the 4th power, the values at the 6-mm pupil are obtained from the data measured using the 5-mm pupil by multiplying the later by the constant factor (3/2.5)4.
All subjects provided similar results for the different conditions with small intra-subject variability represented by the error bars; the maximum standard deviation of a set of measurements for one subject was 0.04 µm.
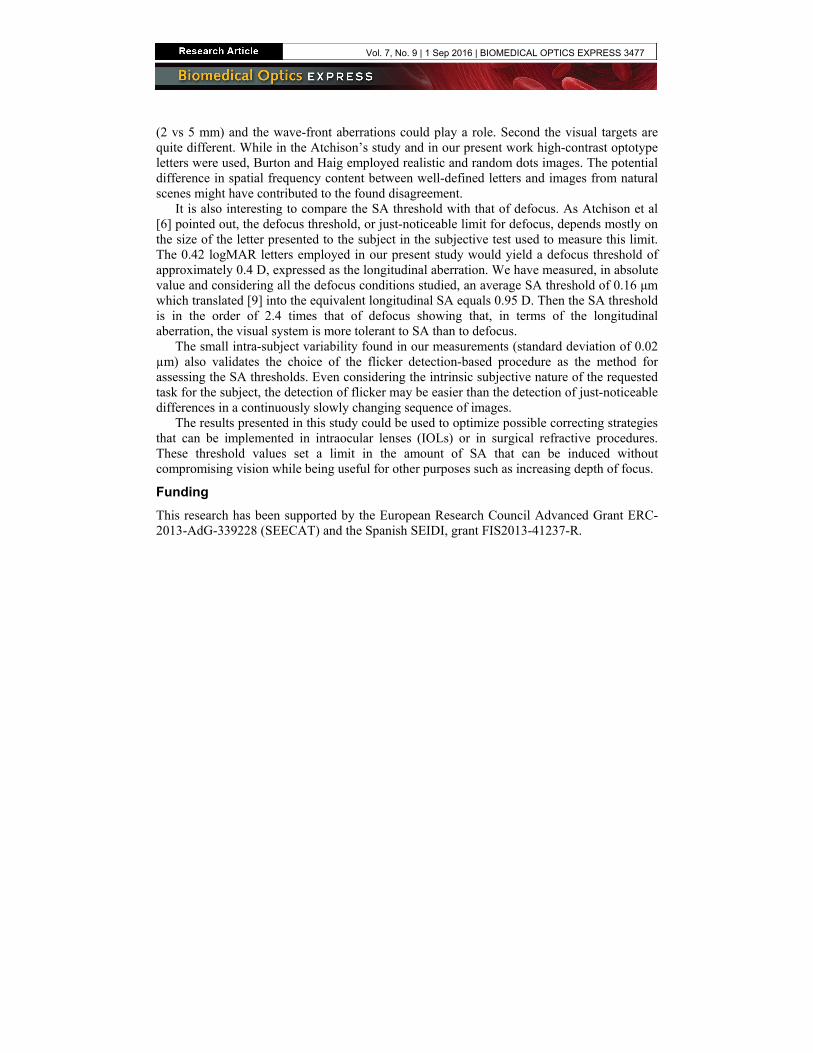
The average of the SA thresholds for the different focus positions is represented in Fig. 4. At best focus, the SA thresholds were 0.20 ± 0.01 µm and −0.17 ± 0.03 µm for positive and negative SA respectively, with error bars representing the inter-subject variability. After the addition of + 0.5D of defocus the results were 0.17 ± 0.10 µm and −0.12 ± 0.02 µm. And for + 1.0D of defocus the results were 0.14 ± 0.03 µm and −0.16 ± 0.02 µm. It seems that there is not a clear dependence with the focus error especially on the negative side. For the positive SA values there was a slight tendency to have a decreased SA threshold with defocus.
Vol. 7, No. 9 | 1 Sep 2016 | BIOMEDICAL OPTICS EXPRESS 3475
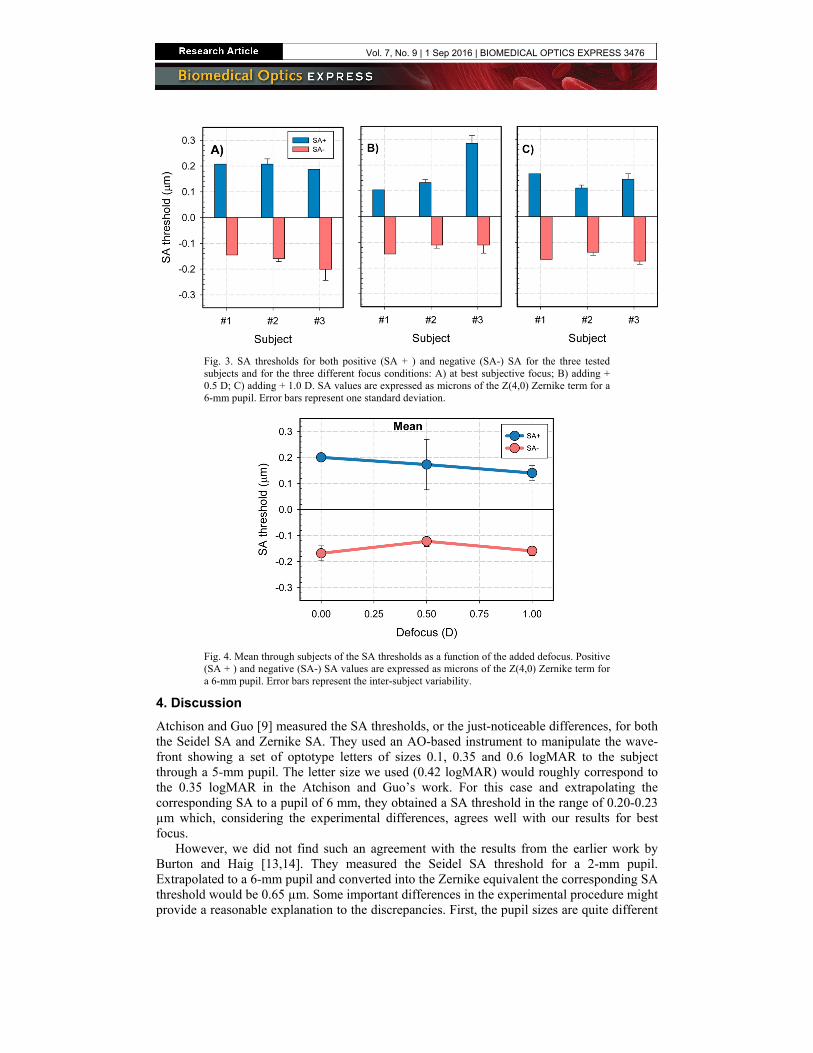
Fig. 3. SA thresholds for both positive (SA + ) and negative (SA-) SA for the three tested subjects and for the three different focus conditions: A) at best subjective focus; B) adding + 0.5 D; C) adding + 1.0 D. SA values are expressed as microns of the Z(4,0) Zernike term for a 6-mm pupil. Error bars represent one standard deviation.
Fig. 4. Mean through subjects of the SA thresholds as a function of the added defocus. Positive (SA + ) and negative (SA-) SA values are expressed as microns of the Z(4,0) Zernike term for a 6-mm pupil. Error bars represent the inter-subject variability.
4. Discussion
Atchison and Guo [9] measured the SA thresholds, or the just-noticeable differences, for both the Seidel SA and Zernike SA. They used an AO-based instrument to manipulate the wave-front showing a set of optotype letters of sizes 0.1, 0.35 and 0.6 logMAR to the subject through a 5-mm pupil. The letter size we used (0.42 logMAR) would roughly correspond to the 0.35 logMAR in the Atchison and Guo’s work. For this case and extrapolating the corresponding SA to a pupil of 6 mm, they obtained a SA threshold in the range of 0.20-0.23 µm which, considering the experimental differences, agrees well with our results for best focus.
However, we did not find such an agreement with the results from the earlier work by Burton and Haig [13,14]. They measured the Seidel SA threshold for a 2-mm pupil. Extrapolated to a 6-mm pupil and converted into the Zernike equivalent the corresponding SA threshold would be 0.65 µm. Some important differences in the experimental procedure might provide a reasonable explanation to the discrepancies. First, the pupil sizes are quite different
Vol. 7, No. 9 | 1 Sep 2016 | BIOMEDICAL OPTICS EXPRESS 3476
(2 vs 5 mm) and the wave-front aberrations could play a role. Second the visual targets are quite different. While in the Atchison’s study and in our present work high-contrast optotype letters were used, Burton and Haig employed realistic and random dots images. The potential difference in spatial frequency content between well-defined letters and images from natural scenes might have contributed to the found disagreement.
It is also interesting to compare the SA threshold with that of defocus. As Atchison et al [6] pointed out, the defocus threshold, or just-noticeable limit for defocus, depends mostly on the size of the letter presented to the subject in the subjective test used to measure this limit. The 0.42 logMAR letters employed in our present study would yield a defocus threshold of approximately 0.4 D, expressed as the longitudinal aberration. We have measured, in absolute value and considering all the defocus conditions studied, an average SA threshold of 0.16 μm which translated [9] into the equivalent longitudinal SA equals 0.95 D. Then the SA threshold is in the order of 2.4 times that of defocus showing that, in terms of the longitudinal aberration, the visual system is more tolerant to SA than to defocus.
The small intra-subject variability found in our measurements (standard deviation of 0.02 µm) also validates the choice of the flicker detection-based procedure as the method for assessing the SA thresholds. Even considering the intrinsic subjective nature of the requested task for the subject, the detection of flicker may be easier than the detection of just-noticeable differences in a continuously slowly changing sequence of images.
The results presented in this study could be used to optimize possible correcting strategies that can be implemented in intraocular lenses (IOLs) or in surgical refractive procedures. These threshold values set a limit in the amount of SA that can be induced without compromising vision while being useful for other purposes such as increasing depth of focus.
Funding
This research has been supported by the European Research Council Advanced Grant ERC-2013-AdG-339228 (SEECAT) and the Spanish SEIDI, grant FIS2013-41237-R.
Vol. 7, No. 9 | 1 Sep 2016 | BIOMEDICAL OPTICS EXPRESS 3477


![Index [link.springer.com]3A978-3-642...preoperative vs. post operative aberration, 254 pseudophakic IOL, 249 selection, 250–251 shrink wrap effect, 252 spherical aberration, 249](https://img.pdfslide.us/doc/110x75/6007b3795dd77f35d01bc971/index-link-3a978-3-642-preoperative-vs-post-operative-aberration-254-pseudophakic.jpg)