Embed Size (px)
Citation preview
Mind the gaps for analysis and policy making
Lee Heng Guie Regional Head of Economics CIMB Investment Bank Berhad 7 Nov 2012
2
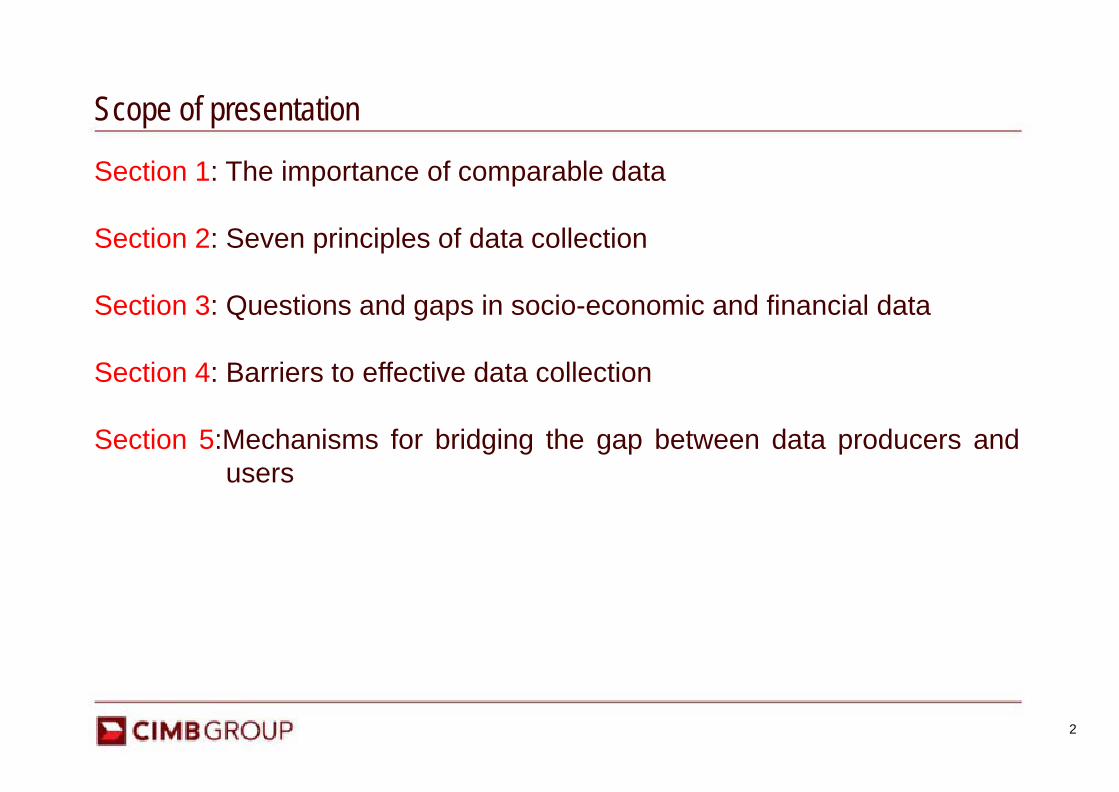
Scope of presentation
Section 1: The importance of comparable data Section 2: Seven principles of data collection Section 3: Questions and gaps in socio-economic and financial data Section 4: Barriers to effective data collection Section 5:Mechanisms for bridging the gap between data producers and users
3
“ An essential component of any development planning is data. Without
data, a country’s efforts to plan for future growth cannot be grounded in reality and
therefore may be severely flawed.”
4
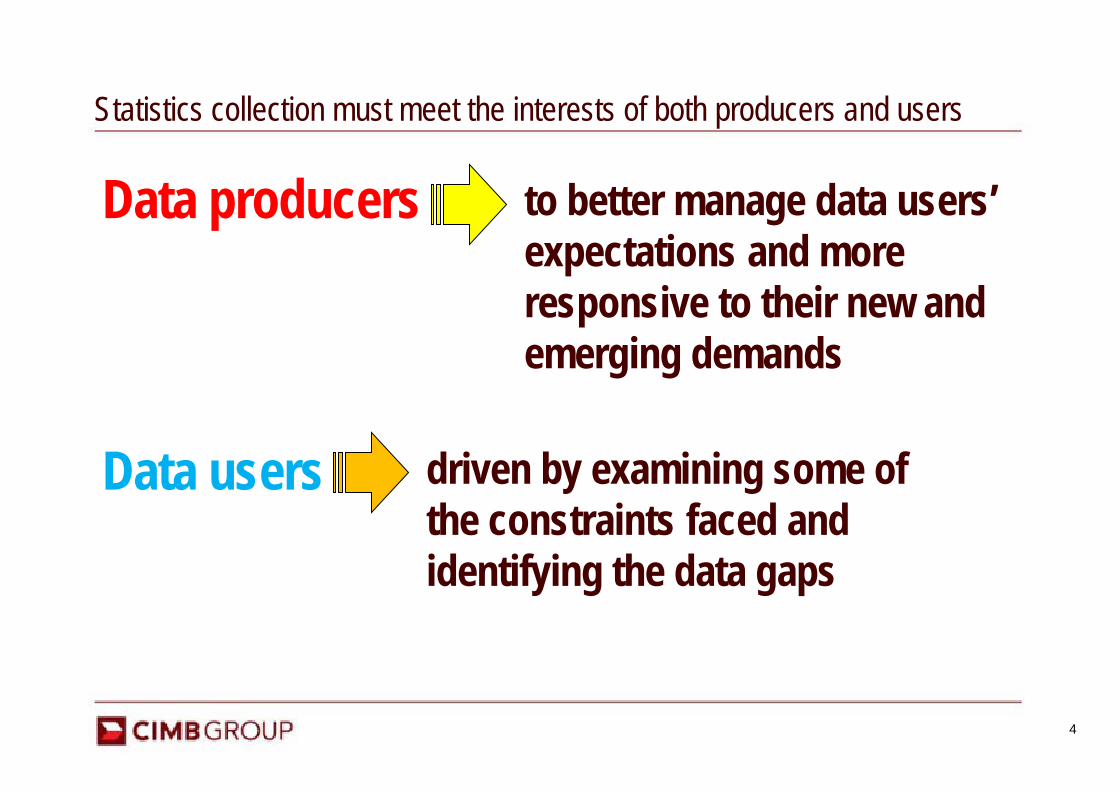
Statistics collection must meet the interests of both producers and users
Data producers
Data users
to better manage data users’ expectations and more responsive to their new and emerging demands
driven by examining some of the constraints faced and identifying the data gaps
5
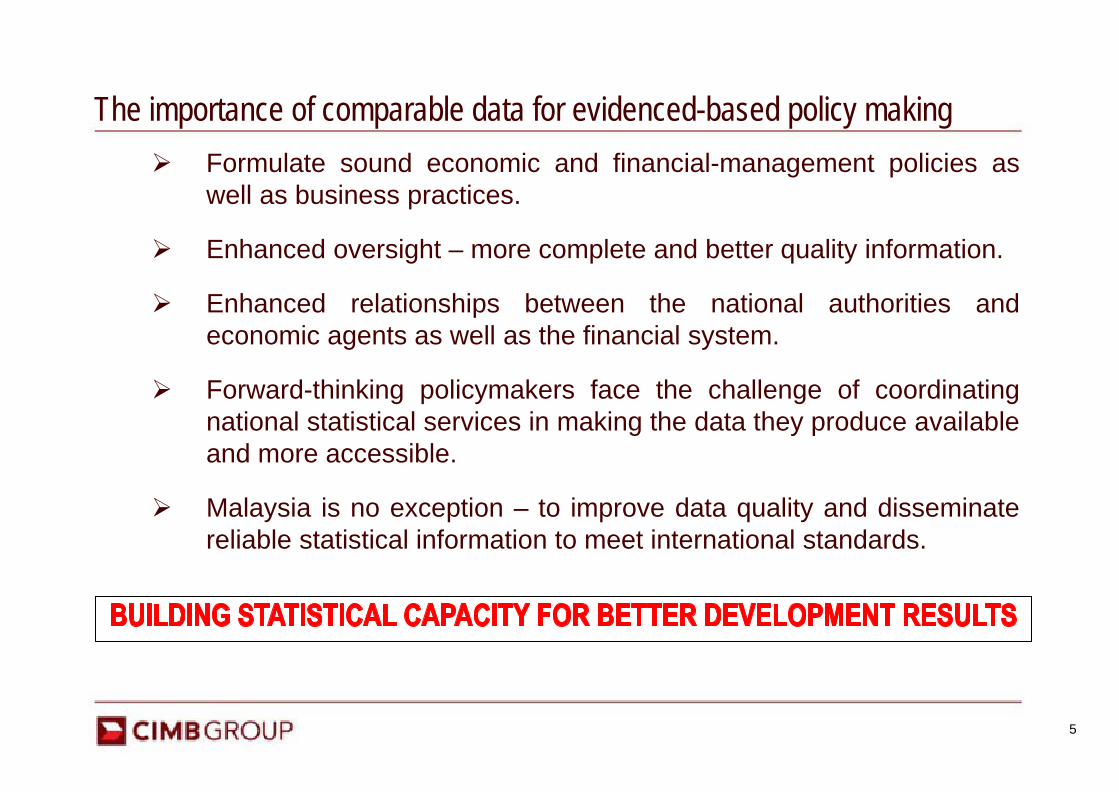
The importance of comparable data for evidenced-based policy making Formulate sound economic and financial-management policies as
well as business practices.
Enhanced oversight – more complete and better quality information.
Enhanced relationships between the national authorities and economic agents as well as the financial system.
Forward-thinking policymakers face the challenge of coordinating national statistical services in making the data they produce available and more accessible.
Malaysia is no exception – to improve data quality and disseminate reliable statistical information to meet international standards.
6
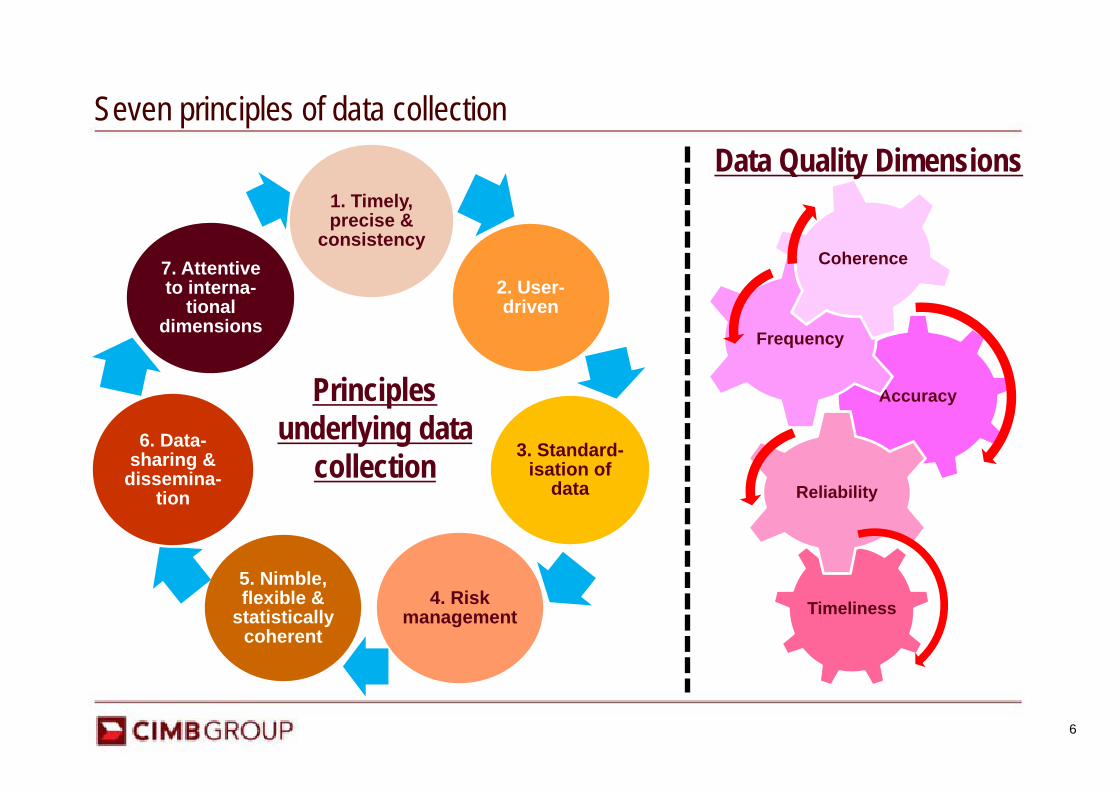
Seven principles of data collection
1. Timely, precise &
consistency
2. User-driven
3. Standard-isation of
data
4. Risk management
5. Nimble, flexible &
statistically coherent
6. Data-sharing &
dissemina-tion
7. Attentive to interna-
tional dimensions
Accuracy
Frequency
Coherence
Timeliness
Reliability
Data Quality Dimensions
Principles underlying data
collection
7
Reconcile the interests of both the users and producers
YES...same here. They always give us
a lot of excuses.
NO no no… we have
the data, but we cannot disclose all or u have to purchase. Hope
U guys understand.
Hello!!!!!!!!!! we feel so disgruntled
when asking for more data for further
analysis.
We r just small potatoes. We cannot
decide. We just follow instructions and
procedures.
8
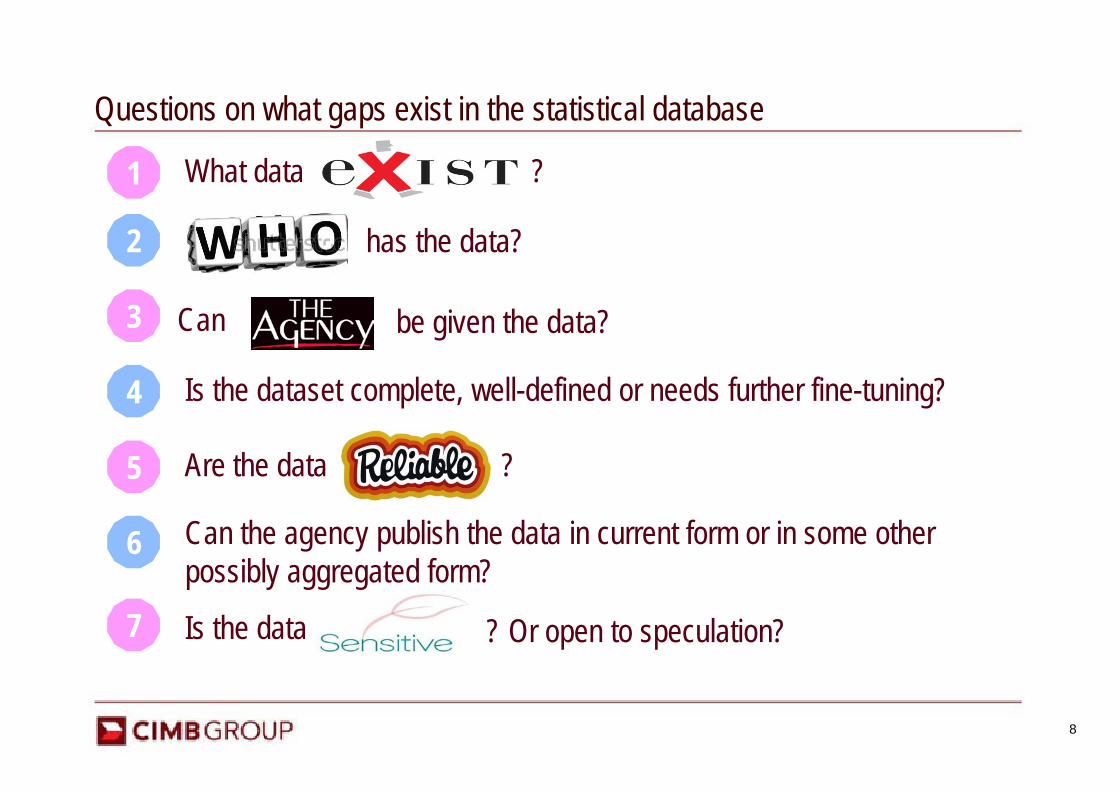
Questions on what gaps exist in the statistical database
What data 1 ?
2 has the data?
3 Can be given the data?
4 Is the dataset complete, well-defined or needs further fine-tuning?
5 Are the data ?
6 Can the agency publish the data in current form or in some other possibly aggregated form?
7 Is the data ? Or open to speculation?
9
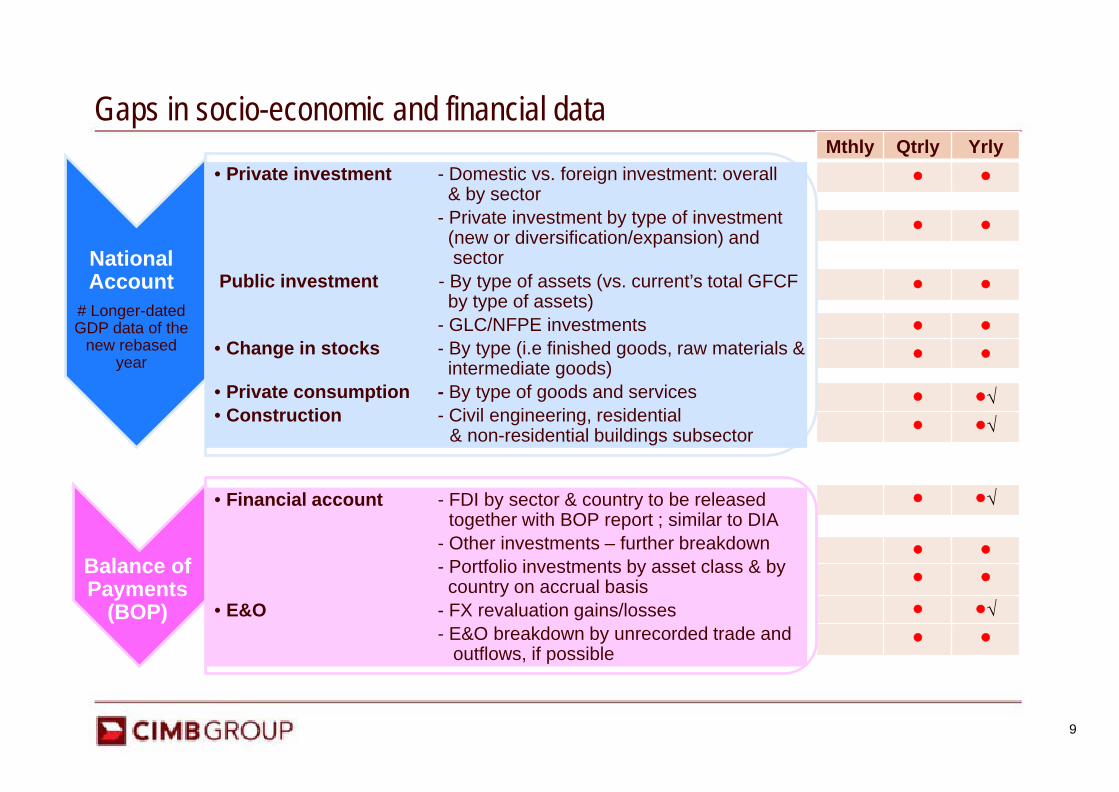
Gaps in socio-economic and financial data Mthly Qtrly Yrly
● ●
● ●
● ●
● ● ● ●
● ●√ ● ●√
● ●√
● ● ● ● ● ●√ ● ●
National Account
# Longer-dated GDP data of the
new rebased year
• Private investment - Domestic vs. foreign investment: overall & by sector
- Private investment by type of investment (new or diversification/expansion) and sector
Public investment - By type of assets (vs. current’s total GFCF by type of assets)
- GLC/NFPE investments • Change in stocks - By type (i.e finished goods, raw materials &
intermediate goods) • Private consumption - By type of goods and services • Construction - Civil engineering, residential
& non-residential buildings subsector
Balance of Payments
(BOP)
• Financial account - FDI by sector & country to be released together with BOP report ; similar to DIA
- Other investments – further breakdown - Portfolio investments by asset class & by
country on accrual basis • E&O - FX revaluation gains/losses - E&O breakdown by unrecorded trade and
outflows, if possible
10
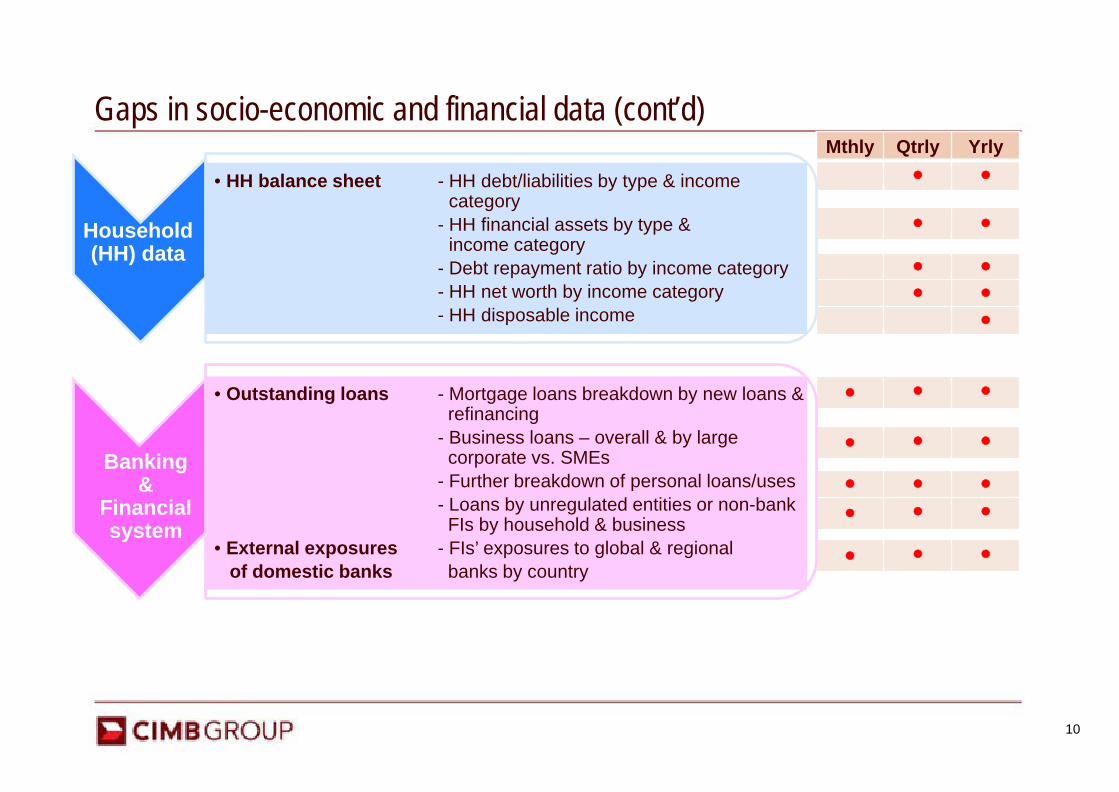
Gaps in socio-economic and financial data (cont’d) Mthly Qtrly Yrly
● ●
● ●
● ● ● ●
●
● ● ●
● ● ●
● ● ● ● ● ●
● ● ●
Household (HH) data
• HH balance sheet - HH debt/liabilities by type & income category
- HH financial assets by type & income category
- Debt repayment ratio by income category - HH net worth by income category - HH disposable income
Banking &
Financial system
• Outstanding loans - Mortgage loans breakdown by new loans & refinancing
- Business loans – overall & by large corporate vs. SMEs
- Further breakdown of personal loans/uses - Loans by unregulated entities or non-bank
FIs by household & business • External exposures - FIs’ exposures to global & regional of domestic banks banks by country
11
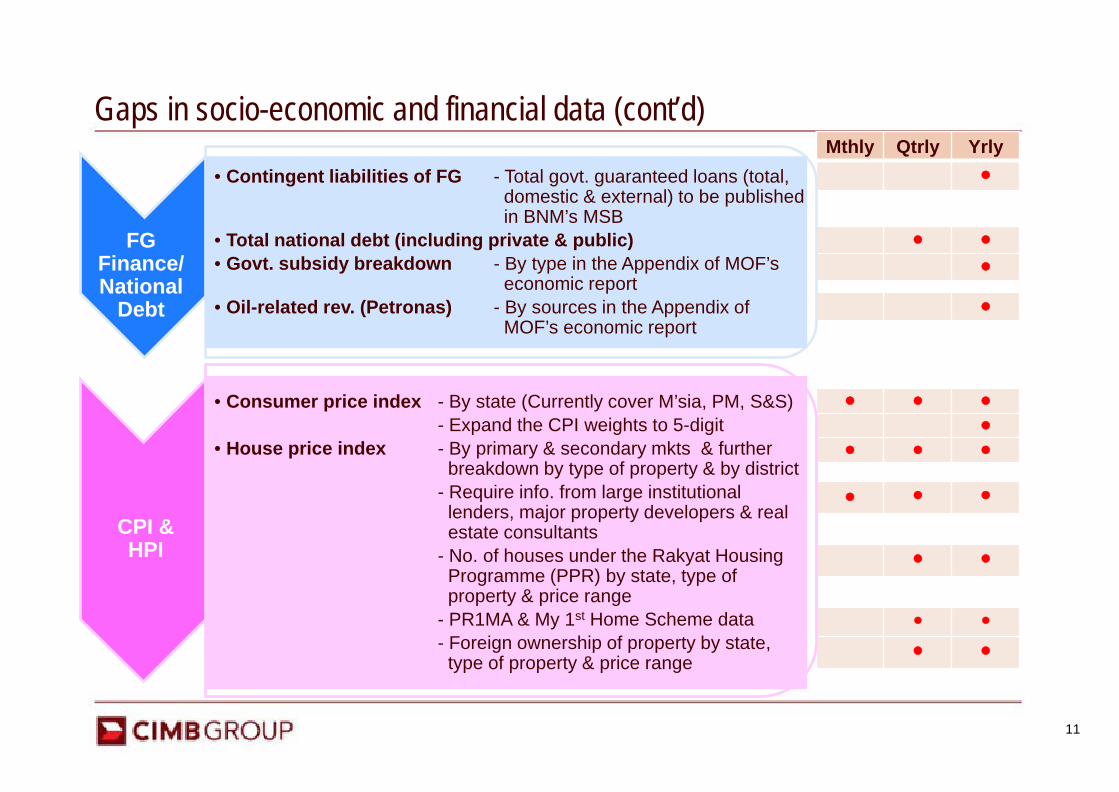
Gaps in socio-economic and financial data (cont’d) Mthly Qtrly Yrly
●
● ● ●
●
● ● ● ●
● ● ●
● ● ●
● ●
● ●
● ●
FG Finance/ National
Debt
• Contingent liabilities of FG - Total govt. guaranteed loans (total, domestic & external) to be published in BNM’s MSB
• Total national debt (including private & public) • Govt. subsidy breakdown - By type in the Appendix of MOF’s
economic report • Oil-related rev. (Petronas) - By sources in the Appendix of
MOF’s economic report
CPI & HPI
• Consumer price index - By state (Currently cover M’sia, PM, S&S) - Expand the CPI weights to 5-digit
• House price index - By primary & secondary mkts & further breakdown by type of property & by district
- Require info. from large institutional lenders, major property developers & real estate consultants
- No. of houses under the Rakyat Housing Programme (PPR) by state, type of property & price range
- PR1MA & My 1st Home Scheme data - Foreign ownership of property by state,
type of property & price range
12
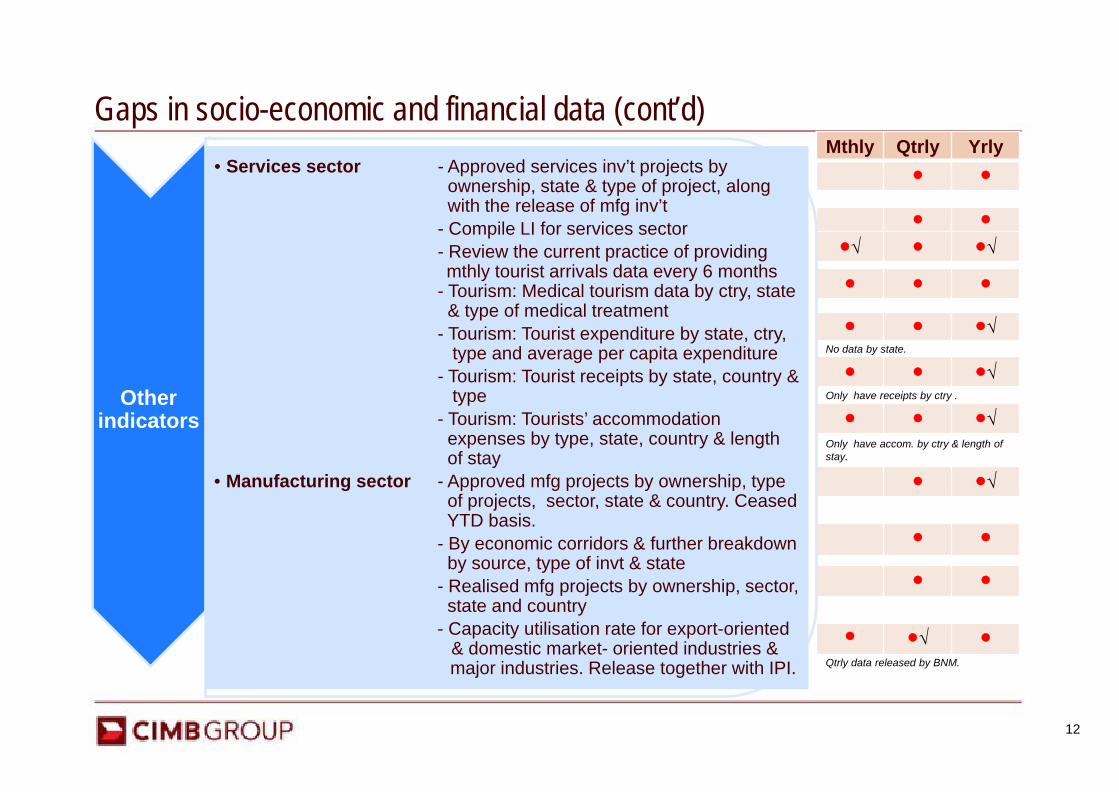
Gaps in socio-economic and financial data (cont’d) Mthly Qtrly Yrly
● ●
● ● ●√ ● ●√
● ● ●
● ● ●√ No data by state.
● ● ●√ Only have receipts by ctry .
● ● ●√ Only have accom. by ctry & length of stay.
● ●√
● ●
● ●
● ●√ ● Qtrly data released by BNM.
Other indicators
• Services sector - Approved services inv’t projects by ownership, state & type of project, along with the release of mfg inv’t
- Compile LI for services sector - Review the current practice of providing
mthly tourist arrivals data every 6 months - Tourism: Medical tourism data by ctry, state & type of medical treatment
- Tourism: Tourist expenditure by state, ctry, type and average per capita expenditure
- Tourism: Tourist receipts by state, country & type
- Tourism: Tourists’ accommodation expenses by type, state, country & length of stay
• Manufacturing sector - Approved mfg projects by ownership, type of projects, sector, state & country. Ceased YTD basis.
- By economic corridors & further breakdown by source, type of invt & state
- Realised mfg projects by ownership, sector, state and country
- Capacity utilisation rate for export-oriented & domestic market- oriented industries & major industries. Release together with IPI.
13
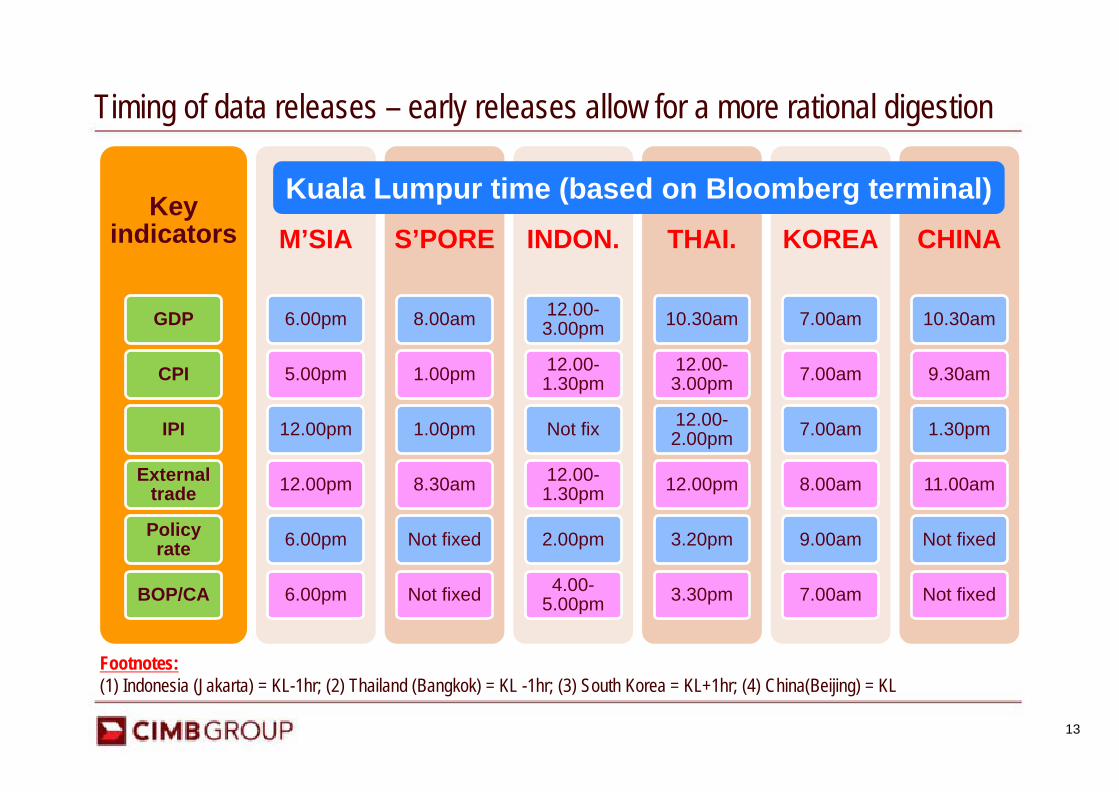
Timing of data releases – early releases allow for a more rational digestion
Key indicators
GDP
CPI
IPI
External trade
Policy rate
BOP/CA
M’SIA
6.00pm
5.00pm
12.00pm
12.00pm
6.00pm
6.00pm
S’PORE
8.00am
1.00pm
1.00pm
8.30am
Not fixed
Not fixed
INDON.
12.00-3.00pm
12.00-1.30pm
Not fix
12.00-1.30pm
2.00pm
4.00-5.00pm
THAI.
10.30am
12.00-3.00pm
12.00-2.00pm
12.00pm
3.20pm
3.30pm
KOREA
7.00am
7.00am
7.00am
8.00am
9.00am
7.00am
CHINA
10.30am
9.30am
1.30pm
11.00am
Not fixed
Not fixed
Kuala Lumpur time (based on Bloomberg terminal)
Footnotes: (1) Indonesia (Jakarta) = KL-1hr; (2) Thailand (Bangkok) = KL -1hr; (3) South Korea = KL+1hr; (4) China(Beijing) = KL
14
Press statements, publications and information material
• Strengthen the analysis and content of the press releases and statements. More disclosure of information.
• A regular review and assessment of existing structure of data collection, compilation and publication is necessary to ensure that the data are still relevant to both regulators and users.
• Include regional comparable statistics for key socio-economic indicators.
15
Barriers to effective data collection – Issues to consider
1. The level of cooperation between the regulators and market participants.
2. How to balance the cost and benefit of data collection and analysis?
3. Limit the quality of data collection and analysis as well as prevent the sharing of data due to privacy protection.
4. Co-engage with private sector vendors to help fill the gaps in collecting market-based data such as for the real estate market.
16
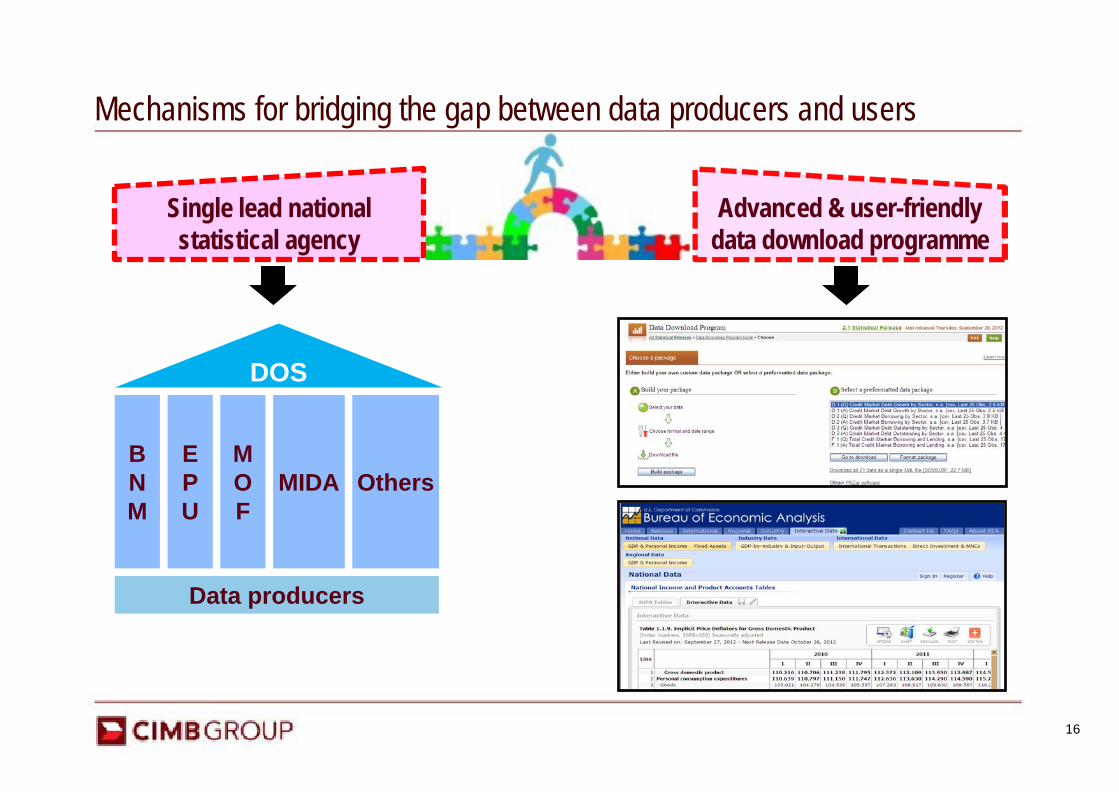
Mechanisms for bridging the gap between data producers and users
Single lead national statistical agency
Advanced & user-friendly data download programme
DOS
BNM
EPU
MOF
MIDA
Data producers
Others
17
Conclusions
A thorough review and reassessment of the existing structure of data collection and data usage.
Provide more disaggregated data to facilitate deeper analysis.
Data is reliable and of quality.
Leverage on ICT to provide greater access to statistics for users.

THANK YOU
This presentation/material has been prepared by CIMB Investment Bank Berhad (“CIMB”) exclusively for your benefit and internal use in order to indicate, on a preliminary basis, the feasibility of possible transactions. Information contained in this presentation/material are intended for discussion purposes only and are subject to a definitive agreement. All information contained in this presentation/material belongs to CIMB and may not be copied, distributed or otherwise disseminated in whole or in part without the prior written consent of CIMB. This presentation/material has been prepared on the basis of information that is believed to be correct at the time the presentation/material was prepared, but that may not have been independently verified. CIMB makes no express or implied warranty as to the accuracy or completeness of any such information. This information is subject to change without notice and its accuracy is not guaranteed. Neither CIMB nor any of its affiliates, advisers or representatives make undertaking to update any such information subsequent to the date hereof. The views expressed in this presentation/material accurately reflect the personal views of the analyst(s). Investors are advised to make their own independent assessment of the contents of this presentation/material, should not treat such content as advice relating to legal, accounting, taxation, technical or investment matters and should consult their own advisers. CIMB or its affiliates (the “CIMB Group”) may from time to time do and seek to do business with the company(ies) covered in this presentation/material without further consultation with or notification to you. Nothing in this presentation/material is intended to be, or should be construed as an offer to buy or sell, or invitation to subscribe for, any securities. Neither the CIMB Group nor any of their directors, employees or representatives are to have any liability (including liability to any person by reason of negligence or negligent misstatement) from any statement, opinion, information or matter (express or implied) arising out of, contained in or derived from or any omission from the presentation/material, except liability under statute that cannot be excluded.
Disclaimer