Embed Size (px)
Citation preview
MIND THE GAP
EDUCATION INEQUALITY ACROSS EU REGIONS
An independent report authored for the European Commission by the NESSE network of experts
Authored by
Dimitris Ballas Ruth Lupton
Dimitris Kavroudakis Benjamin Hennig
Vassiliki Yiagopoulou Roger Dale
Danny Dorling
on behalf of the NESSE network of experts
Commissioned by Authored by www.nesse.fr

EDUCATION INEQUALITY ACROSS EU REGIONS
Report identity
This is an independent report authored for the European Commission's Directorate-General for Education and Culture. It has been authored by Dr. Dimitris Ballas, Dr. Ruth Lupton, Prof. Roger Dale, Dr. Dimitris Kavroudakis, Dr. Benjamin Hennig, Vassiliki Yiagopoulou and Prof. Danny Dorling on behalf of the NESSE network of experts. Other members of the NESSE network and other experts in this field provided input and comments on drafts.
All responsibility for the analysis and interpretation of the data presented in this report lies with the authors.
Available at: www.nesse.fr/nesse/activities/reports
and at: http://ec.europa.eu/education/news/20120914docs_en.htm
Acknowledgements
The authors are grateful to Dr. Kornelia Kozovska and Dr. Paola Annoni for providing regional data pertaining to the Regional Competitiveness Index and University Accessibility. Thanks are also due to Dr. Adam Whitworth for his constructive comments, suggestions and ideas and to Dr. Manuel Souto-Otero for helpful suggestions on relevant literature. We would also like to thank Nikos Paizis and Polina Fatourou for helpful comments and suggestions. The authors are also grateful to Dr. Angelos Agalianos for his guidance and for his thoughtful editing of the last version.
Other NESSE reports
The NESSE independent team of social scientists supported the European Commission with expertise between 2007 and 2011. Its work included a series of reports written primarily for policy makers. These unique reports summarise key policy lessons and evidence from research on:
Early School Leaving
Education and Migration
Early Childhood Education and Care
Education and Disability/Special Needs
Gender and Education (and employment)
Private tutoring and its implications for policy makers in the EU
The views expressed in NESSE reports are those of independent experts and do not necessarily reflect the official position of the European Commission.
ISBN: 978-92-79-25980-7 © European Union, 2012 Reproduction for non-commercial purposes is authorised provided the source is acknowledged. For printed copies of NESSE reports (free of charge) contact: [email protected]

EDUCATION INEQUALITY ACROSS EU REGIONS
1
Despite commitments by EU Member States to promote equity in education and training, major geographic disparities persist in educational opportunities and outcomes,
across but also within EU Member States and regions.
EDUCATION INEQUALITY ACROSS EU REGIONS
2
Table of Contents Glossary …………………………………………………………………………………………………………………………………………………… 4
List of tables and list of figures ……………………………………………………………………………………………………………………………… 7-9
Foreword ……………………………………………………………………………………………………………………………….…………………. 11
Executive Summary ………………………………………………………………………………………………………………………………………..…….. 13 Résumé ……………………………………………………………………………………………………………………………………….…….….. 15 Zusammenfassung ……………………………………………………………………………………………………………………………….… 17 Резюме ……………………………………………………………………………………………………………………………………………….… 19 Shrnutí …………………………………………………………………………………………………………………………………………..…….. 21 Resumé …………………………………………………………………………………………………………………………………….…….……. 23 Resumen ……………………………………………………………………………………………………………………………………..………. 25 Περίληψη ….………………………………………………………………………………………………………………………………..…….… 27 Kokkuvõte ………………………………………………………………………………………………………………………..…………..……… 29 Tiivistelmä ……………………………………………………………………………………………………………………………………….…… 31 Összefoglaló ………………………………………………………………………………………………………………………………..………. 33 Sommario …………………………………………………………………………………………………………………………………..…….… 35 Santrauka ……………………………………………………………………………………………………………………………….…….……. 37 Kopsavilkums ………………………………………………………………………………………………………………………….…………. 39 Sommarju eżekuttiv …………………………………………………………………………………………………………………………. 41 Samenvatting …………………………………………………………………………………………………….……………………….……. 43 Streszczenie …………………………………………………………………………………………………………………………….…………. 45 Síntese …………………………………………………………………………………………………………………………………….…………. 47 Rezumat ………………………………………………………………………………………………………………………………….…………. 49 Zhrnutie ………………………………………………………………………………………………………………………………….…………. 51 Povzetek ………………………………………………………………………………………………………………………………….…………. 53 Sammanfattning …………………………………………………………………………………………………………………….…………. 55
Chapter 1 Introduction …………………………………………………….…………………………………………………….………………… 57
Chapter 2 Regional inequalities in education: causes, consequences and policy challenges ……………………. 61
Chapter 3 Mapping educational inequality across EU regions -Top-10 and Bottom 10 regions ……………….. 73
Chapter 4 Regional inequalities in education in each EU Member State with two or more NUTS2 regions* 89
Regional inequalities in Austria …………………………………….…………………………………………….. 89 Regional inequalities in Belgium …………………………………….…………………………………………… 93 Regional inequalities in Bulgaria …………………………………….…………………………………………… 96 Regional inequalities in the Czech Republic ……………………………………….……………………….. 98 Regional inequalities in Germany …………………………………….…………………………………………. 100 Regional inequalities in Denmark …………………………………….………………………………………… 104 Regional inequalities in Spain …………………………………….………………………………………………. 107 Regional inequalities in Finland …………………………………….……………………………………………. 110 Regional inequalities in France …………………………………….……………………………………………. 112 Regional inequalities in Greece …………………………………….…………………………………………… 117 Regional inequalities in Hungary …………………………………….…………………………………………. 120 Regional inequalities in the Republic of Ireland …………………………………….……………………. 122 Regional inequalities in Italy …………………………………….……………………………………………….. 123 Regional inequalities in the Netherlands …………………………………….……………………………… 127 Regional inequalities in Poland …………………………………….…………………………………………… 130 Regional inequalities in Portugal …………………………………….………………………………………… 133 Regional inequalities in Romania …………………………………….…………………………………………. 135 Regional inequalities in Sweden …………………………………….…………………………………………… 138 Regional inequalities in Slovenia …………………………………….………………………………………….. 141 Regional inequalities in Slovakia …………………………………….………………………………………….. 142 Regional inequalities in the United Kingdom …………………………………….………………………… 144
Summary: How EU Member States compare in terms of regional inequalities in education ……. 149
EDUCATION INEQUALITY ACROSS EU REGIONS
3
Chapter 5 An example of what is possible with NUTS 3 and smaller area level data – Mapping "local" educational inequalities, opportunities and outcomes …………………………………… 153
Chapter 6 Conclusions and policy recommendations …………………………………………………………….………………….. 161
References …………………………………………………………………………………………………………………………….………………………. 163
Annex (Population cartograms) ……………………………………………………………………………………………………………………….………. 169
* This study discusses the distribution of educational inequalities in only 21 of the 27 EU Member States which have two
or more NUTS2 regions. Cyprus, Estonia, Latvia, Lithuania, Luxembourg and Malta are EU NUTS2 regions themselves and as a result are not discussed in this report due to lack of suitable data.
Also, as a result of a consistent methodological choice of the researchers, analysis in this report does not include
any of the European Union's overseas territories (8 outermost regions and 26 overseas territories linked to Denmark, France, the Netherlands, Portugal, Spain and the UK).
EDUCATION INEQUALITY ACROSS EU REGIONS
4
Glossary 1. The NUTS (Nomenclature d’Unités Territoriales Statistiques) classification is a hierarchical system for dividing up the economic
territory of the EU for the purpose of the collection, development and harmonisation of EU regional statistics, and socio-economic analyses of the regions. It is divided into three levels:
NUTS 1: major socio-economic regions—essentially country level
NUTS 2: basic regions for the application of regional policies—major region level
NUTS 3: small regions for specific diagnoses—county level, districts, prefectures
The EU has 271 regions at NUTS level 2 which are distributed within Member States as follows:
EU Member State Number of regions
Austria 9
Belgium 11
Bulgaria 6
Czech Republic 8
Cyprus 1
Denmark 5
Estonia 1
Finland 5
France 26
Germany 39
Greece 13
Hungary 7
Ireland 2
EU Member State Number of regions
Italy 21
Latvia 1
Lithuania 1
Luxembourg 1
Malta 1
The Netherlands 12
Spain 19
Poland 16
Portugal 7
Romania 8
Slovakia 4
Slovenia 2
Sweden 8
United Kingdom 37
2. ISCED: The International Standard Classification of Education is an instrument for compiling internationally comparable education statistics. The current version, ISCED 97, covers two classification variables: levels and fields of education as well as general/vocational/prevocational orientation and educational/labour market destination. ISCED 97 was implemented in European Union countries for collecting data starting with the 1997/98 school year. There are seven levels of education in ISCED 97:
Level 0: Pre-primary education – the initial stage of organised instruction; it is school- or centre-based and is designed for children aged at least three years.
Level 1: Primary education – begins between five and seven years of age, is the start of compulsory education where it exists and generally covers six years of full-time schooling.
Level 2: Lower secondary education – continues the basic programmes of the primary level, although teaching is typically more subject-focused. Usually, the end of this level coincides with the end of compulsory education.
Level 3: Upper secondary education – generally begins at the end of compulsory education. The entrance age is typically 15 or 16 years. Entrance qualifications (end of compulsory education) and other minimum entry requirements are usually needed. Instruction is often more subject-oriented than at ISCED level 2. The typical duration of ISCED level 3 varies from two to five years.
Level 4: Post-secondary non-tertiary education – between upper secondary and tertiary education. This level serves to broaden the knowledge of ISCED level 3 graduates. Typical examples are programmes designed to prepare pupils for studies at level 5 or programmes designed to prepare pupils for direct labour market entry.
Level 5: Tertiary education (first stage) – entry to these programmes normally requires the successful completion of ISCED level 3 or 4. This includes tertiary programmes with academic orientation (type A) which are largely theoretical and tertiary programmes with an occupational orientation (type B). The latter are typically shorter than type A programmes and aimed at preparing students for the labour market.
Level 6: Tertiary education (second stage) – reserved for tertiary studies that lead to an advanced research qualification (Ph.D. or doctorate).
EDUCATION INEQUALITY ACROSS EU REGIONS
5
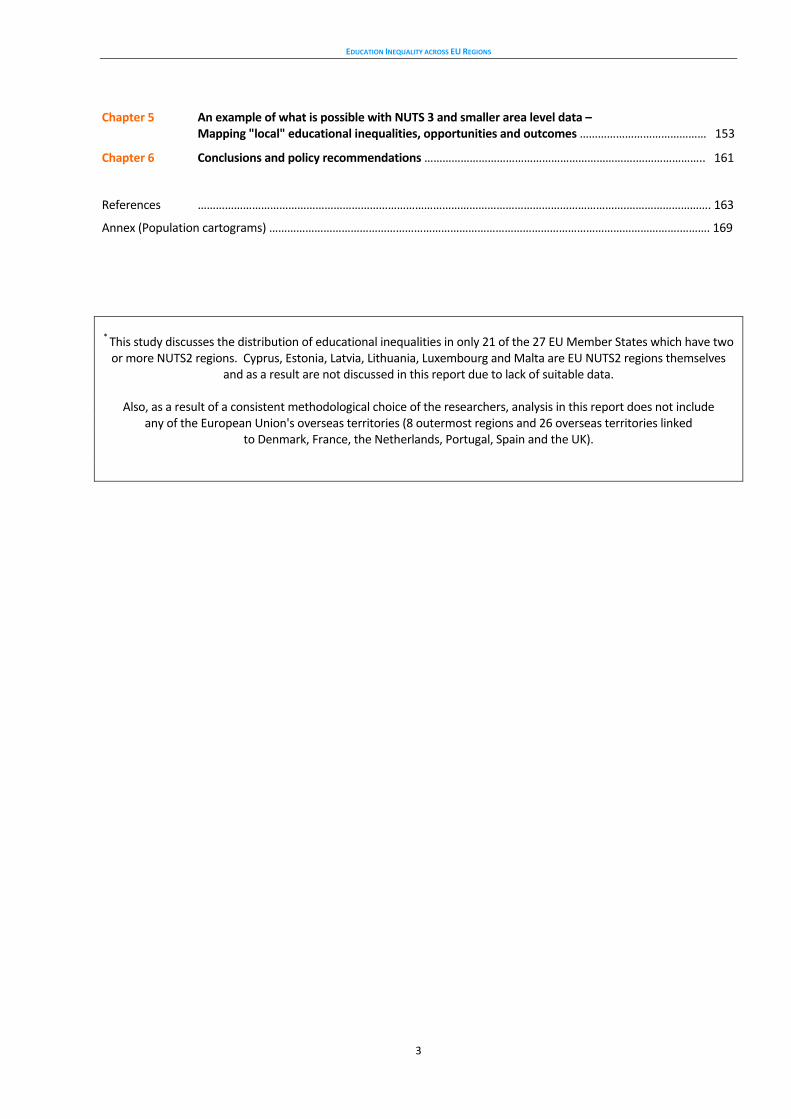
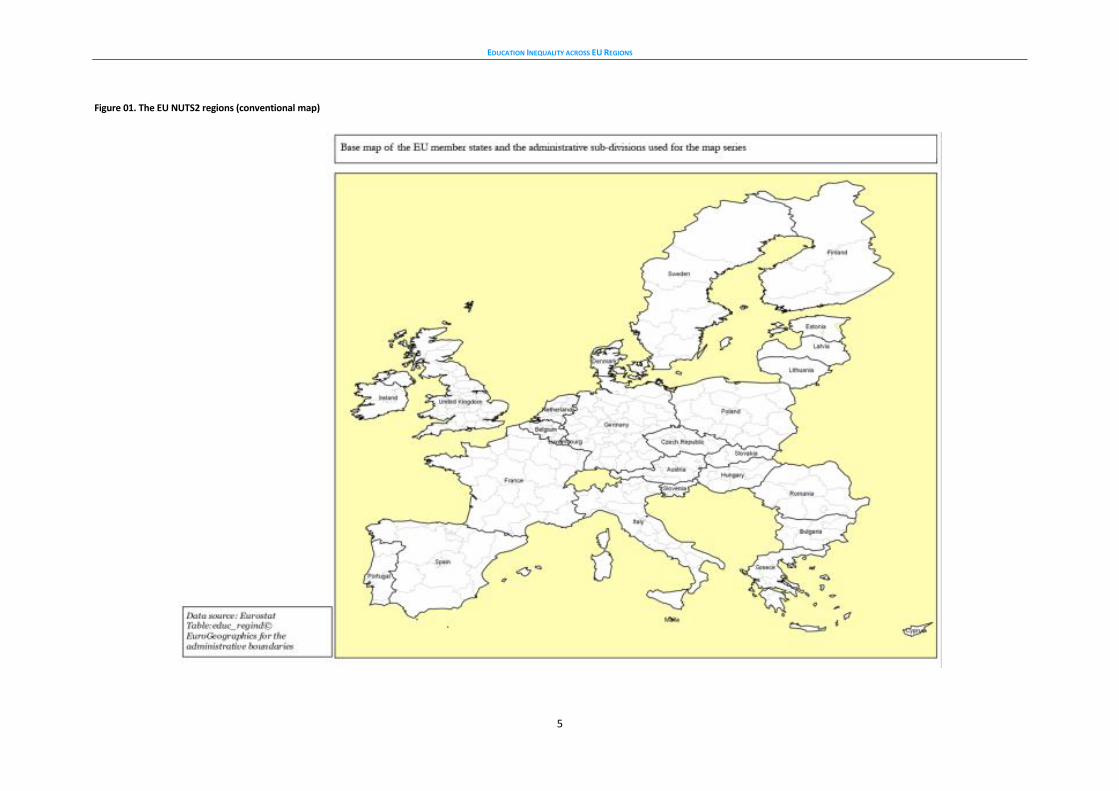
Figure 01. The EU NUTS2 regions (conventional map)
EDUCATION INEQUALITY ACROSS EU REGIONS
6
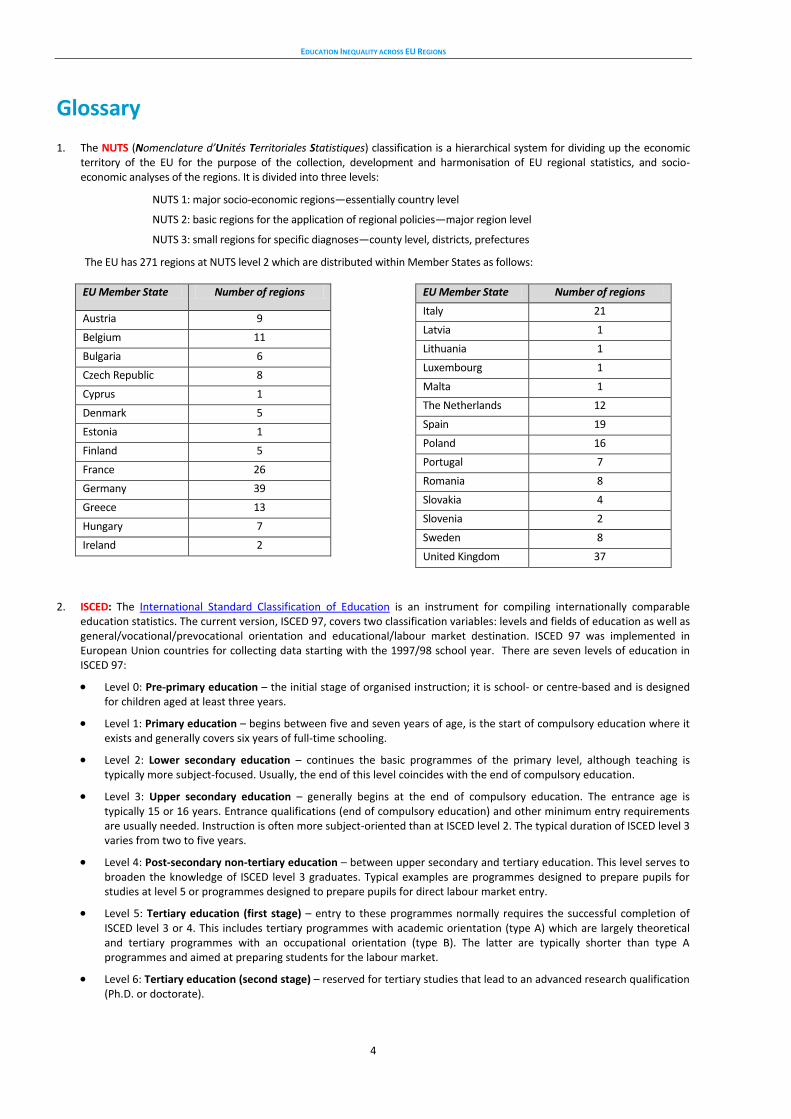
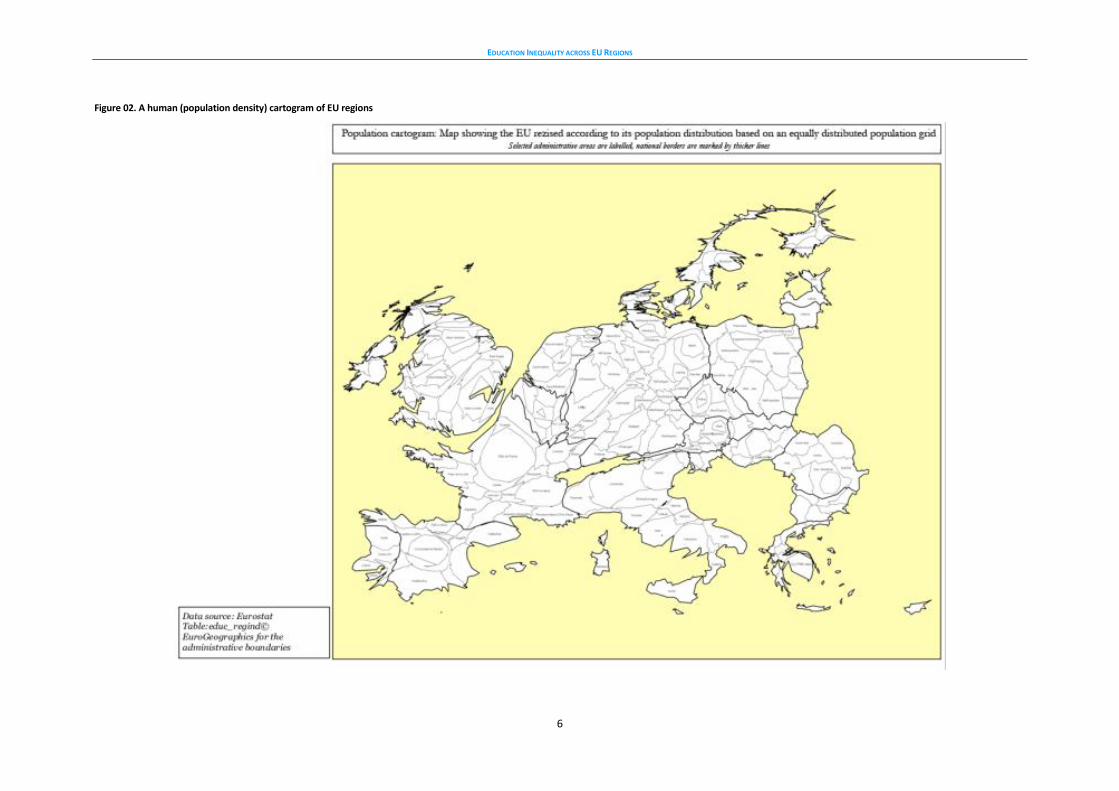
Figure 02. A human (population density) cartogram of EU regions

EDUCATION INEQUALITY ACROSS EU REGIONS
7
List of tables
Table 3.1. Education-related regional indicators used in this study ……………………………………………….………………………………………………….….. 74
Table 3.2. Top 10 regions – Pupils and students (%) in all levels of education (ISCED 0-6) as % of total population ……………………………………….. 75
Table 3.3. Bottom 10 regions – Pupils and students (%) in all levels of education (ISCED 0-6) as % total population ……………………………………… 75
Table 3.4. Top 10 regions – Lifelong learning – participation of adults aged 25-65 in education and training (%) ………………………………………….. 76
Table 3.5. Bottom 10 Regions – Lifelong learning – participation of adults aged 25-64 in education and training (%) ……………………………………. 76
Table 3.6. Top 10 regions – Pupils (%) in primary and lower secondary education (ISCED 1-2) as % of total population ………………………….…….. 77
Table 3.7. Bottom 10 regions – Pupils (%) in primary and lower secondary education (ISCED 1-2) as % of total population …………………….……. 77
Table 3.8. Top 10 regions – Pupils and students in upper secondary and post-secondary non-tertiary education (ISCED 3-4) as % of the population aged 15-24 years old ………………………………….…………………………………………………….……………………………………… 78
Table 3.9. Bottom 10 regions – Pupils and students in upper secondary and post-secondary non-tertiary education (ISCED 3-4) as % of the population aged 15-24 years old …….…………………………………………………….………………………………………………… 78
Table 3.10. Top 10 regions – Students in tertiary education (ISCED 5-6) as % of the population aged 20-24 years ………………………………………… 79
Table 3.11. Bottom 10 regions – Students in tertiary education (ISCED 5-6) as % of the population aged 20-24 …………………………………………… 79
Table 3.12. "Top 10" Regions –population living at more than 60 minutes from the nearest university, (% of total population) …………………… 81
Table 3.13. Top 10 regions – All persons aged 25-64 with lower secondary education attainment ……………………………………………………………….. 82
Table 3.14. Bottom 10 regions –All persons aged 25-64 with lower secondary education attainment ………………………………………………………….. 82
Table 3.15. Top 10 regions – all persons aged 25-64 with upper secondary education attainment ………………………………………………………………. 83
Table 3.16. Bottom 10 regions – all persons aged 25-64 with upper secondary education attainment …………………………………………………………. 83
Table 3.17.Top 10 regions – persons with at most pre-primary, primary and lower secondary education – levels 0-2 (ISCED 1997) as % of all population over 15 years old ….…………………………………………………….…………………………………………………….. 84
Table 3.18. Bottom 10 regions – persons with at most pre-primary, primary and lower secondary education – levels 0-2 (ISCED 1997) as % of all population over 15 years old ………………….…………………………………………………….…………………………………..… 84
Table 3.19. Top 10 regions – persons with at most upper secondary and post-secondary non-tertiary education – levels 3-4 (ISCED 1997) as % of all persons aged 15+ …………………….………………………………………………….……………………………………………………… 85
Table 3.20. Bottom 10 regions – persons with at most upper secondary and post-secondary non-tertiary education – levels 3-4 (ISCED 1997) as % of all persons aged 15+ …………………………….…………………………………………………….…………………………………………… 85
Table 3.21. Top 10 regions – persons with tertiary education – levels 5-6 (ISCED 1997) as % of all persons aged 15+ …………………………………… 86
Table 3.22. Bottom 10 regions –persons with tertiary education – levels 5-6 (ISCED 1997) as % of all persons aged 15+ ………………………………. 86
Table 4.1. "Target group" and "opportunity" indicators in Austrian regions …………………………………………………….……………………………………..….... 89
Table 4.2. "Outcome" and "performance" indicators in Austrian regions …………………………………………………….……………………………………………..… 92
Table 4.3. "Target group" and "opportunity" indicators in Belgian regions …………………………………………………….…………………………………………..… 93
Table 4.4. "Outcome" and "performance" indicators in Belgian regions …………………………………………………….………………………………………………… 94
Table 4.5. "Target group" and "opportunity" indicators in Bulgarian regions …………………………………………………….…………………………….…………… 96
Table 4.6. "Outcome" and "performance" indicators in Bulgarian regions …………………………………………………….……………………………………………… 97
Table 4.7. "Target groups" and "opportunity" indicators in Czech Republic regions …………………………………………………….………………………….……. 98
Table 4.8. "Outcome" and "performance" indicators in Czech Republic regions …………………………………………………….……………………………..……… 99
Table 4.9. "Target group"/"opportunity" indicators in German regions (NUTS1) …………………………………………………….………………………….……… 100
Table 4.10. "Outcome" and "performance" indicators in German regions (NUTS2) …………………………………………………….……………………………… 103
Table 4.11. "Target group" and "opportunity" indicators in Danish regions …………………………………………………….…………………………………………. 104
Table 4.12. "Outcome" and "performance" indicators in Danish regions …………………………………………………….………………………………………..…… 106
Table 4.13. "Target group" and "opportunity" indicators in Spanish regions …………………………………………………….……………………………………..… 107
Table 4.14. "Outcome" and "performance" indicators in Spanish regions …………………………………………………….……………………………………….….. 108
Table 4.15. "Target group" and "opportunity" indicators in Finnish regions …………………………………………………….………………………………………… 110
Table 4.16. "Outcome" and "performance" indicators in Finnish regions …………………………………………………….…………………………………………… 111
Table 4.17. "Target group" and "opportunity" indicators in French regions …………………………………………………….…………………………………….…… 112
Table 4.18. "Outcome" and "performance" indicators in French regions …………………………………………………….……………………………………………… 114
Table 4.19. "Target group" and "opportunity" indicators in Greek regions …………………………………………………….……………………………………..…… 116
Table 4.20. "Outcome" and "performance" indicators in Greek regions …………………………………………………….………………………………………….…… 118
Table 4.21. "Target group" and "opportunity" indicators in Hungarian regions …………………………………………………….………………………….………… 120
Table 4.22. "Outcome" and "performance" indicators in Hungarian regions …………………………………………………….………………………………..……… 121
Table 4.23. "Target group" and "opportunity" indicators in Irish regions …………………………………………………….……………………………………….……. 122
EDUCATION INEQUALITY ACROSS EU REGIONS
8
Table 4.24. "Outcome" and "performance" indicators in Irish regions …………………………………………………….…………………………………………………. 122
Table 4.25. "Target group" and "opportunity" indicators in Italian regions ……………………………………………….…………………………………………..…… 123
Table 4.26. "Outcome" and "performance" indicators in Italian regions …………………………………………………….……………………………………….….…. 126
Table 4.27. "Target group" and "opportunity" indicators in Dutch regions …………………………………………………….………………………………………..… 127
Table 4.28. "Outcome" and "performance" indicators in Dutch regions …………………………………………………….………………………………………………. 128
Table 4.29. "Target group" and "opportunity" indicators in Polish regions …………………………………………………….…………………………………..……… 130
Table 4.30. "Outcome" and "performance" indicators in Polish regions …………………………………………………….………………………………………………. 131
Table 4.31. "Target group" and "opportunity" indicators in Portuguese regions …………………………………………………….……………………………….…. 133
Table 4.32. "Outcome" and performance" indicators in Portuguese regions …………………………………………………….………………………………….…….. 134
Table 4.33. "Target group" and "opportunity" indicators in Romanian regions …………………………………………………….……………………….………….… 135
Table 4.34. "Outcome" and "performance" indicators in Romanian regions …………………………………………………….…………………………………..……. 137
Table 4.35. "Target group" and "opportunity" indicators in Swedish regions …………………………………………………….………………………..……………… 139
Table 4.36. "Outcome" and "performance" indicators in Swedish regions …………………………………………………….…………………………………………… 140
Table 4.37. "Target group" and "opportunity" indicators in Slovenian regions …………………………………………………….……………………………..……….142
Table 4.38. "Outcome" and "performance" indicators in Slovenian regions …………………………………………………….…………………………………………. 142
Table 4.39. "Target group" and "opportunity" indicators in Slovakian regions …………………………………………………….……………………………………… 143
Table 4.40. "Outcome" and "performance" indicators in Slovakian regions …………………………………………………….………………………………….……… 144
Table 4.41. "Target group" indicators, UK NUTS1 regions …………………………………………………….…………………………………………………….……….…….. 145
Table 4.42. "Target group" indicators, UK NUTS2 regions …………………………………………………….…………………………………………………….……….. …… 146
Table 4.43. "Outcome" and "performance" indicators, UK NUTS2 regions …………………………………………………….…………………………………………… 148
Table 4.44. "Outcome" and performance" indicators, UK NUTS2 regions …………………………………………………….……………………………………..……… 149
Table 4. 45. The gap between the top and bottom region in each Member State in terms of "Potential climate for educational
development within the region" indicators (EU Member States with more than one region) …………………………………………………….…… 151
Table 4.46. The gap between the top and bottom region in each Member State in terms of "current educational level of the
population in a region" indicators (EU Member States with more than one region) ……………………….……………………………………..……… 152
EDUCATION INEQUALITY ACROSS EU REGIONS
9
List of Figures
Figure 01: The EU NUTS2 regions (conventional map) …………………………………………………….……………………………………………………. ………………….….. 5
Figure 02: Human population density cartogram, NUTS 2 EU regions ………………………………………………….……………………………………………………….… 6
Figure 2.1: Current Human Capital and Economic Performance/Growth (simplified model) ………………………………………………….……………………… 69
Figure 2.2: Current Educational Attainment and Future Human Capital (simplified model) ……… ……………………………… ………………………………… 69
Figure 3.1: Pupils and students (%) in all levels of education (ISCED 0-6) as % of total population ………………………………………………….………..…… 75
Figure 3.2: Lifelong learning – participation of adults aged 25-64 in education and training ………………………………………………….……………………… 76
Figure 3.3: Pupils in primary and lower secondary education (ISCED 1-2) ………………………………………………….………… ………………………….……………77
Figure 3.4: Regional distribution of pupils and students in upper secondary and post-secondary and post-secondary education as % of the population aged 15-24 years old (ISCED 3-4) ………………………………………………….………… …………………………… 78
Figure 3.5: Students in tertiary education (ISCED 5-6) ………………………………………………….………… ……………………………… ……………………..…………… 79
Figure 3.6: Population living at more than 60 minutes from the nearest university, (% of total population) …………………………………………….…… 80
Figure 3.7: All persons aged 25-64 with lower secondary education attainment ………………………………………………….………… …………………………… 81
Figure 3.8: All persons aged 25-64 with upper secondary education attainment ………………………………………………….……… ……………………………… 82
Figure 3.9: Persons with at most pre-primary, primary and lower secondary education …………………………………………………………………….………… 83
Figure 3.10: Persons with at most upper secondary and post-secondary non-tertiary education ………………………………………………….……………… 84
Figure 3.11: Persons with tertiary education – levels 5-6 (ISCED 1997) as % of all persons aged 15+ ………………………………………………….………… 85
Figure 3.12: Higher Education/Training and Lifelong learning pillar sub-rank (after Annoni and Kozovska, 2010: 127) …………………………..……… 86
Figure 4.1: Regional distribution of pupils and students in all levels of education (ISCED 0-6) in Austria …………………………………………….……….… 90
Figure 4.2: Lifelong learning – participation of adults aged 25-64 in education and training, Austrian regions ………………………………………………. 90
Figure 4.3: University "accessibility" by region in Austria ………………………………………………….………… ……………………………… ……………………………… 91
Figure 4.4: Persons with at most pre-primary, primary and lower secondary education, Austrian regions ………………………………………………….… 91
Figure 4.5: With tertiary education, Austrian regions ………………………………………………….………… ……………………………… …………………………………… 92
Figure 4.6: Pupils and students in all levels of education (ISCED 0-6), Belgian regions ………………………………………………….……… …………….………… 93
Figure 4.7: Students in tertiary education, Belgian regions ………………………………………………….………… ……………………………… …………………………… 94
Figure 4.8: Persons with at most pre-primary, primary and lower secondary education, Belgian regions ……………………………………………………… 95
Figure 4.9: With tertiary education (%), Belgian regions ………………………………………………….………… ……………………………… …………………….………… 95
Figure 4.10: University "accessibility" by region in Bulgaria ………………………………………………….………… ……………………………… ……………………..…… 96
Figure 4.11: Persons aged 15+ with at most pre-primary, primary and lower secondary education, Bulgarian regions …………………………….…… 97
Figure 4.12: With tertiary education, Bulgarian regions ………………………………………………….………… ……………………………… ………………………..……… 97
Figure 4.13: Regional distribution of all pupils and students in Czech Republic regions ……………………………………………….………… ……………….…… 98
Figure 4.14: University "accessibility" by region in the Czech Republic ………………………………………………….………… …………………………………….….… 98
Figure 4.15: Persons with at most pre-primary, primary and lower secondary education, Czech Republic, regions ………………………….…………… 99
Figure 4.16: With tertiary education, Czech Republic regions ………………………………………………….………… ……………………………… …………….………… 99
Figure 4.17: Regional distribution of all pupils and students in German NUTS1 regions ………………………………………………….……………….………… 100
Figure 4.18: Lifelong learning, German NUTS2 regions ………………………………………………….………… ……………………………… …………………….………… 100
Figure 4.19: University "accessibility" by NUTS2 region in Germany ………………………………………………….………… ……………………………… ……..…… 102
Figure 4.20: With tertiary education (%), German NUTS2 regions ………………………………………………….………… ………………………………………….…… 102
Figure 4.21: Regional distribution of all pupils and students in Denmark ………………………………………………….………… ……………………….…………… 104
Figure 4.22: Regional distribution of all tertiary students (%) in Denmark ………………………………………………….………… ………………….……………… 105
Figure 4.23: University "accessibility" by region in Denmark ………………………………………………….………… ……………………………………………….……… 105
Figure 4.24: Regional distribution of individuals with tertiary education qualifications in Denmark ………………………………………….……..………… 106
Figure 4.25: Regional distribution of pupils and students in all levels of education in Spain ………………………………………………….……………….…… 107
Figure 4.26: Regional distribution of all tertiary students (%) in Spain ………………………………………………….………… ………………………………………… 108
Figure 4.27: Regional distribution of persons with at most pre-primary, primary and lower secondary education, Spain …………………………… 109
Figure 4.28: Regional distribution of individuals with tertiary education qualifications in Spain ………………………………………………………….……… 109
Figure 4.29: University "accessibility" by region in Finland ………………………………………………….………… ……………………………… ………………………… 110
Figure 4.30: Regional distribution of persons with at most pre-primary, primary and lower secondary education, Finland ………………………… 111
Figure 4.31: Regional distribution of individuals with tertiary education qualifications in Finland ……………………………………………….……………… 111
Figure 4.32: Regional distribution of all pupils and students in all levels of education, France ………………………………………………….………………… 113
Figure 4.33: Regional distribution of pupils (%) and students (ISCED 3-4), France …………………………………………….………… ………………………..…… 113
Figure 4.34: Regional distribution of students in tertiary education, France ………………………………………………….………… …………………………..…… 114
Figure 4.35: University "accessibility" by region in France ………………………………………………….………… ……………………………… …………………….…… 114
Figure 4.36: At most pre-primary, primary and lower secondary education, French regions ……………………………………………………………………… 116
Figure 4.37: Tertiary education graduates, French regions ………………………………………………….………… …………………………… …………………………… 116
Figure 4.38: Regional distribution of all pupils and students in Greece ………………………………………………….………… ………………………… ………….… 117
Figure 4.39: Regional distribution of students in tertiary education in Greece ………………………………………………….………… ………………………….… 118
Figure 4.40: University accessibility in Greek regions ………………………………………………….………… ……………………………… ………………………………… 118
EDUCATION INEQUALITY ACROSS EU REGIONS
10
Figure 4.41: Tertiary education graduates, Greek regions ………………………………………………….………… …………………………… …………………..………… 119
Figure 4.42: Regional distribution (%) of persons 15+ with at most lower secondary education, Greece ………………………………………………….… 119
Figure 4.43: Regional distribution of students in tertiary education in Hungary ………………………………………………….………… ………………………..… 120
Figure 4.44: Regional distribution of tertiary education graduates, Hungary ………………………………………………….………… …………………………….… 121
Figure 4.45: Regional distribution (%) of persons 15+ with at most lower secondary education, Hungary ………………………………………………..… 121
Figure 4.46: Persons aged 15+ with at most pre-primary, primary and lower secondary education as % of all persons aged 15+, Republic of Ireland ………………………………………………….………… ……………………………… …………………………………… 122
Figure 4.47: Regional distribution of all pupils and students, Italy ………………………………………………….………… ……………………………… ……………… 124
Figure 4.48: Regional distribution of pupils and students (ISCED 3-4), Italy ………………………………………………….………… ……………………….………… 124
Figure 4.49: Regional distribution of tertiary education students, Italy ………………………………………………….………… ……………………………………… 125
Figure 4.50: University accessibility by region, Italy ………………………………………………….………… ……………………………… …………………………………… 125
Figure 4.51: Regional distribution of tertiary education graduates, Italy ………………………………………………….………… …………………………………..… 126
Figure 4.52: Regional distribution (%) with at most lower secondary education, Italy ………………………………………………….………… ………………… 127
Figure 4.53: Regional distribution of tertiary education students in the Netherlands ………………………………………………….………… ……………….… 128
Figure 4.54: Regional distribution of tertiary education graduates in the Netherlands ………………………………………………….…………………………… 129
Figure 4.55: Regional distribution (%) of persons with at most lower secondary education, The Netherlands …………………………………………… 129
Figure 4.56: Regional distribution of pupils and students, Poland ………………………………………………….………… …………………………… ………………… 130
Figure 4.57: Regional distribution of tertiary education students in Poland ………………………………………………….………… ………………………………… 131
Figure 5.58: Regional distribution of tertiary education graduates, Poland ………………………………………………….………… …………………………….…… 132
Figure 4.59: Regional distribution of persons with at most pre-primary and lower secondary education, Poland ………………………………….…… 132
Figure 4.60: Regional distribution of students in tertiary education, Portugal ………………………………………………….………… …………………..………… 133
Figure 4.61: Tertiary education graduates, Portuguese regions ………………………………………………….………… ……………………………… …………….…… 134
Figure 4.62: Regional distribution of pupils and students, Romania ………………………………………………….………… ……………………………… …………… 135
Figure 4.63: Regional distribution of students in tertiary education, Romania ………………………………………………….………… ……………………….…… 136
Figure 4.64: University accessibility indicator by region, Romania ………………………………………………….………… ………………………………….…………… 136
Figure 4.65: Tertiary education graduates in Romania regions ………………………………………………….………… ……………………………… …………………… 137
Figure 4.66: Regional distribution of persons with at most pre-primary, primary and lower secondary education, Romania ……………………… 137
Figure 4.67: Regional distribution of tertiary education students, Sweden ………………………………………………….………… ………………………….……… 138
Figure 4.68: University accessibility by region, Sweden ………………………………………………….………… ……………………………… ……………………………… 139
Figure 4.69: Tertiary education graduates, Swedish regions ………………………………………………….………… ……………………………… …………….………… 140
Figure 4.70: Regional distribution of persons with at most pre-primary, primary and lower secondary education, Sweden …………………….… 140
Figure 4.71: Persons aged 15+ with at most pre-primary, primary and lower secondary education as % of all persons aged 15+, Slovenia … 141
Figure 4.72: Regional distribution of pupils and students in all levels of education, Slovakia ………………………………………………….……………..…… 142
Figure 4.73: Tertiary education graduates, Slovakia ………………………………………………….………… ……………………………… …………………………………… 143
Figure 4.74: At most pre-primary, primary and lower secondary education, Slovakia ………………………………………………….………………………...…… 143
Figure 4.75: Regional distribution of all pupils and students, UK NUTS1 regions ………………………………………………….………… ……………..…………… 144
Figure 4.76: University accessibility indicator, UK regions ………………………………………………….………… ……………………………… …………………………… 145
Figure 4.77: Tertiary education graduates, UK regions ………………………………………………….………… ……………………………… …………………………..…… 146
Figure 4.78: At most pre-primary, primary and lower secondary education, UK regions ………………………………………………….……………………….… 147
Figure 6.1: Breadline poverty in Sheffield Neighbourhoods in 2001 (after Thomas et al., 2009) ……………………………………………………….………… 153
Figure 6.2: Pupil absence 2007 (after Thomas et al., 2009) ………………………………………………….………… ……………………………… ……………….………… 154
Figure 6.3: Post 16 Activity – Full Time Education, 2006 (after Thomas et al., 2009) ………………………………………………….………… ……………….…… 154
Figure 6.4: Post 16 Activity – Employment without training, 2005 (after Thomas et al., 2009) ………………………………………………….………………… 155
Figure 6.5: What 18-21 year olds are most likely to be doing (2005) (after Thomas et al., 2009) ………………………………………………….………..…… 155
Figure 6.6: What 18-21 year olds are second most likely to be doing (after Thomas et al., 2009) ………………………………………………….………….… 156
Figure 6.7: Most common educational level, 2001 (after Thomas et al., 2009) ………………………………………………….………… ……………………….…… 156
Figure 6.8: Secondary pupils' educational outcomes/attainment across the 54 Greek municipalities in 2008 ……………………………….………. 158
Figure 6.9: Disparities in secondary pupils' education outcomes and performance in Greece, 2008 (KANEP) ………………………………….……..…… 159
Figure 6.10: Secondary VET -Retainment and drop out before the end of the school year in Greece -top 10 and bottom 10 prefectures …… 159
Figure A1: Human population cartogram of pupils and students (%) in all levels of education ………………………………………………….………………… 169
Figure A2: Human population cartogram of lifelong learning ………………………………………………….………… ………………………… …………………………… 170
Figure A3: Human population cartogram of pupils (%) in primary and lower secondary education ………………………………………………….…….…… 170
Figure A4: Population cartogram of pupils and students in upper secondary and post-secondary non-tertiary education ……………………..…… 171
Figure A5: Population cartogram of students in tertiary education (ISCED 5-6) ………………………………………………….………… …………………………… 171
Figure A6: Population cartogram of population living at more than 60 minutes from the nearest university ……………………………………….……… 172
Figure A7: Population cartogram of all persons aged 25-64 with lower secondary education attainment …………………………………………..…….… 172
Figure A8: Population cartogram of all persons aged 25-64 with upper secondary education attainment ………………………………………………..… 173
Figure A9: Human population cartogram of persons with at most pre-primary, primary and lower secondary education …………………………… 173
Figure A10: Population cartogram of persons with at most upper secondary and post-secondary non-tertiary education ………………….……… 174
Figure A11: Population cartogram of persons with tertiary education-levels 5-6 ………………………………………………….………… …………………….…… 174
EDUCATION INEQUALITY ACROSS EU REGIONS
11
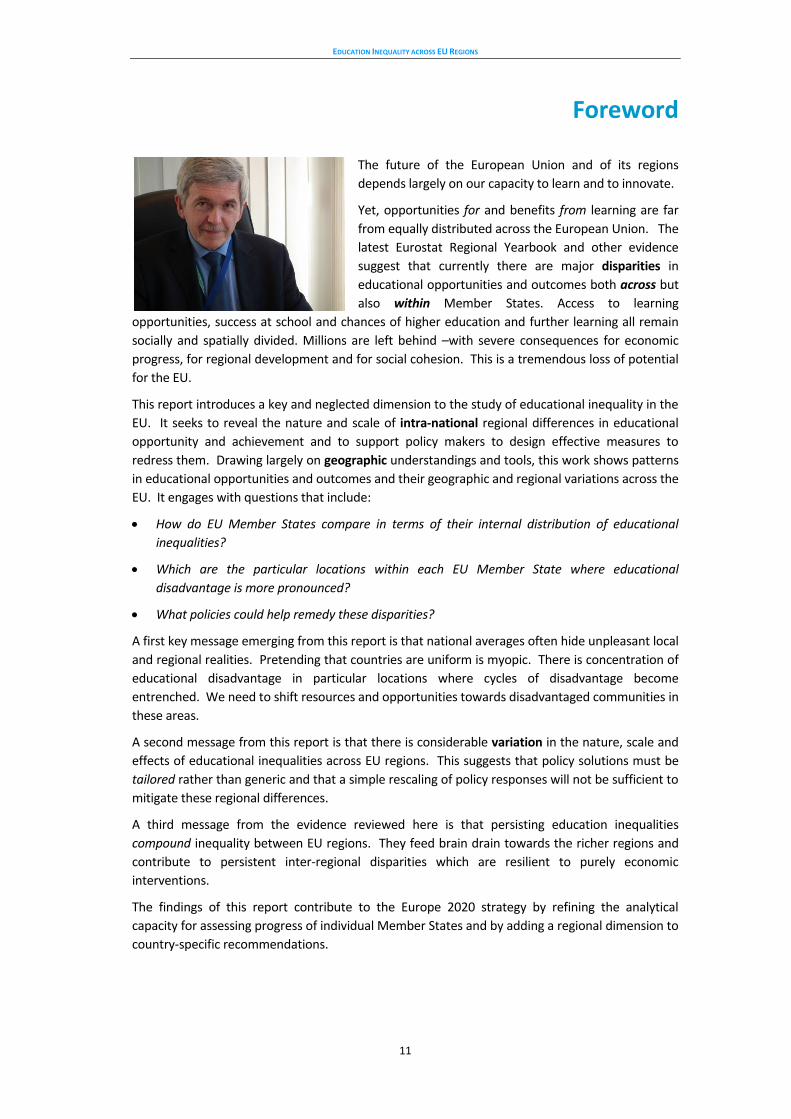
Foreword
The future of the European Union and of its regions
depends largely on our capacity to learn and to innovate.
Yet, opportunities for and benefits from learning are far
from equally distributed across the European Union. The
latest Eurostat Regional Yearbook and other evidence
suggest that currently there are major disparities in
educational opportunities and outcomes both across but
also within Member States. Access to learning
opportunities, success at school and chances of higher education and further learning all remain
socially and spatially divided. Millions are left behind –with severe consequences for economic
progress, for regional development and for social cohesion. This is a tremendous loss of potential
for the EU.
This report introduces a key and neglected dimension to the study of educational inequality in the
EU. It seeks to reveal the nature and scale of intra-national regional differences in educational
opportunity and achievement and to support policy makers to design effective measures to
redress them. Drawing largely on geographic understandings and tools, this work shows patterns
in educational opportunities and outcomes and their geographic and regional variations across the
EU. It engages with questions that include:
How do EU Member States compare in terms of their internal distribution of educational
inequalities?
Which are the particular locations within each EU Member State where educational
disadvantage is more pronounced?
What policies could help remedy these disparities?
A first key message emerging from this report is that national averages often hide unpleasant local
and regional realities. Pretending that countries are uniform is myopic. There is concentration of
educational disadvantage in particular locations where cycles of disadvantage become
entrenched. We need to shift resources and opportunities towards disadvantaged communities in
these areas.
A second message from this report is that there is considerable variation in the nature, scale and
effects of educational inequalities across EU regions. This suggests that policy solutions must be
tailored rather than generic and that a simple rescaling of policy responses will not be sufficient to
mitigate these regional differences.
A third message from the evidence reviewed here is that persisting education inequalities
compound inequality between EU regions. They feed brain drain towards the richer regions and
contribute to persistent inter-regional disparities which are resilient to purely economic
interventions.
The findings of this report contribute to the Europe 2020 strategy by refining the analytical
capacity for assessing progress of individual Member States and by adding a regional dimension to
country-specific recommendations.
EDUCATION INEQUALITY ACROSS EU REGIONS
12
The report also shows that more systematic collection and sharing of data at sub-regional level is
necessary to improve our knowledge base on this crucial topic and to inform policy. Eurostat,
national statistical services and the European research community all have an important role to
play in this process.
Much has been achieved in recent years through support to regional development and cohesion.
But more remains to be done. The Europe 2020 strategy underlines that we cannot afford ignoring
inequalities and that inclusive growth is a key aim. To this end, the report suggests, we need to
look under the surface of national averages. Ignoring the nature and scale of intra-national
educational disparities will merely perpetuate and compound the inequalities they enshrine.
Making effective interventions at the appropriate sub-national level requires not only evidence of
where the problems lie, but an understanding of their causes and consequences and the spatial
scales at which these operate. This report is a contribution towards evidence-based policy making
in this direction. It is also a contribution to the effort to improve the targeting and effectiveness of
the European Structural Funds.
Brussels, September 2012
Jan Truszczyński
Director-General
European Commission's Directorate-General for Education and Culture
EDUCATION INEQUALITY ACROSS EU REGIONS
13
Executive Summary
In a nutshell: Despite commitments by EU Member States to promote equity in education and training, major geographic disparities persist in educational opportunities and outcomes, across but also within EU Member States.
This report paints a picture of intra-national regional inequalities in educational opportunities and outcomes in the EU. Its aim is to support policy makers in their efforts to design effective measures to redress these disparities. It contains over 100 maps that help visualise inequalities. It identifies the top 10 and bottom 10 EU regions for each of the indicators it examines. Its key messages are:
Education inequalities across EU regions
There are considerable inequalities in educational opportunities and outcomes between EU regions. Intra-national differences of achievement are frequently at least as large, and often larger, when compared to inter-national differences.
The regions with the highest rates of people with low formal qualifications ("at most pre-primary, primary or lower secondary education") are mostly in southern Europe and especially in Portugal and Spain. In contrast, the regions where people have higher qualifications are mostly found in the UK, as well as central and eastern Europe1.
The regions with the highest rates of individuals with tertiary education qualifications are mostly found in the UK, Belgium and the Netherlands, but also in northern Spain and in Cyprus. In contrast, the regions with the lowest rates are in Italy, Portugal, and in central and eastern EU2.
The EU regions with the highest rates of "pupils and students in all levels of education as a percentage of the total population" are concentrated in the north and west EU, especially Finland, Sweden but also Belgium and Ireland. The regions with the lowest rates are found mostly in the east of Germany, north of Italy and south-east Europe, but also north-west Spain and Portugal3.
The regions with the highest rates of "pupils in primary and lower secondary education as a percentage of the total population" are observed in regions of the Republic of Ireland, Portugal, southern Spain, but also the Netherlands, Denmark and Southern Sweden. In contrast, the
1 See Tables 3.17-3.18 and Figure 3.9 (pp. 83-84).
2 See Figure 3.11; Tables 3.21 and 3.22 (pp.85-86).
3 See Figure 3.1 and Tables 3.2 and 3.3 (p. 75).
lowest rates are observed in the north of Italy and in south-east Europe4.
The regions with the highest rates of "pupils and students in upper secondary and post-secondary non-tertiary education as a percentage of the population aged 15-24 years" are mostly in Italy, Belgium, Sweden and Finland, whereas most of the regions with the lowest rates are in Greece, Spain, Portugal, Romania, Bulgaria and France5.
The regions with the highest rates of people with "at most upper-secondary and post-secondary non-tertiary education" qualifications are mostly in central and eastern Europe, whereas the regions with the lowest rates are mostly found in southern Europe6.
There are big regional disparities in terms of adult participation in lifelong learning in the EU. The United Kingdom, Denmark, Finland and Sweden have the highest number of regions with strong participation in lifelong learning, whereas most of the regions with very low rates of participation in lifelong learning are in south-east Europe7.
There are significant differences in "geographical accessibility" to tertiary education across EU regions8. The regions with the best "geographical accessibility" are mostly in Germany, the United Kingdom and the Netherlands. In contrast, most of the regions with the lowest scores for "geo-graphical accessibility" to tertiary education9 are in south-east Europe, northern Sweden and Finland, the Baltic States, Spain, Denmark and France.
Regional disparities within EU Member States
Looking at regional disparities within each EU Member State as measured by the difference between the maximum and minimum regional values for each indicator examined10, Romania has the highest regional disparity with regard to the indicator "pupils and students in all levels of education as a % of the total population", closely followed by the Czech Republic, Belgium and Spain. On the other end, the Republic of Ireland has the smallest value (but note that it has only two regions). Denmark, Sweden, Hungary and Poland also seem to have relatively small differences between the regional maximum and minimum value for this indicator11.
4 See Figure 3.3 and Tables 3.6 and 3.7 (p. 77).
5 See Figure 3.4 and Tables 3.8 and 3.9 (p. 78).
6 See Figure 3.10; Tables 3.19 and 3.20 (pp. 84-85).
7 See Figure 3.2 and Tables 3.4 and 3.5 (p.76).
8 See Figure 3.6; Table 3.12 (pp.80-81).
9 The % of the total population of a region living more than 60
minutes from the nearest university. 10
The indicators examined are shown in Table 3.1, p. 74. 11
See Table 4.45, p. 150.
EDUCATION INEQUALITY ACROSS EU REGIONS
14
Looking at the indicator "adult participation in lifelong learning", the United Kingdom has by far the biggest regional disparity, with the difference between the region with the highest value (Inner London, 16.1%) and the region with the lowest value (Northern Ireland, 5.7%) at 10.4%. Slovakia and Denmark also have relatively large regional disparities with regards to this variable12.
Belgium has the highest difference between its top and bottom regions in terms of "pupils and students in upper secondary and post-secondary non-tertiary education (ISCED 3-4) as a percentage of the population aged 15-24 years".
In some Member States, there are big differences across regions for the indicator "students in tertiary education as a percentage of the population aged 20-24 years". Belgium has the widest gap, closely followed by the Czech Republic and Austria. In addition, Greece, Italy and Romania all have wide gaps for this indicator with a spread of over 80% between their top and bottom region. In most of these cases this is the result of the dominance of the capital region in terms of tertiary education opportunities13.
Spain has the biggest gap between its top and bottom regions in terms of number of people living at more than 60 minutes away from the nearest university, followed closely by Greece with Finland third and Bulgaria fourth.
Eight EU Member States have a difference of more than 15 percentage points between their top and bottom regions in terms of rates of tertiary education graduates in a region. The United Kingdom is the country with the biggest gap (23.4%), followed by France (21.3%), Belgium (19.4%), the Czech Republic (18.7%), Spain (17.5%), Slovakia (17%) and Romania (15.4%). The gap for this variable is relatively smaller in Ireland, Italy, Slovenia, Portugal, Finland and Austria (all below 10%)14.
Looking at the number of people with low educational qualifications (with "at most pre-primary, primary and lower secondary qualifications"), France has the highest disparity between its top and bottom regions (gap of 27.2%), followed by Greece, Spain, Romania and Germany. In contrast, the countries with the lowest disparity are Slovenia, Ireland, Slovakia, Austria and Finland15.
12
See Table 4.45, p. 150. 13
See table 4.45, p. 150. 14
See Table 4.46, p. 150. 15
See Table 4.46, p. 150.
Other key messages
National averages often hide unpleasant local and regional realities.
Regional disparities in learning hinder balanced regional development and economic growth.
Regional disparities in education compound inequality between EU regions. They also feed brain-drain towards the more developed/richer regions.
There is considerable variation in the nature, scale and effects of educational inequalities across EU regions. Policy solutions must be tailored rather than generic.
Data at the sub-regional level and at the level of individual schools and classrooms is currently being collected within Member States, but there is a need for better coordination and for this data to become available in the public domain.
Compiling geographically disaggregated data on educational inequality can be an important tool for local empowerment and de-centralization. It generates locally-relevant information. It can help schools, community organisations and government at all levels to engage in evidence-based planning and policy.
Spatial disparities of educational opportunities and outcomes reflect wider inequalities. Education policy measures alone are not enough. Policies that tackle poverty and related aspects of disadvantage at their roots are likely to be more successful than purely education policy interventions in influencing overall patterns of regional educational inequality.
EDUCATION INEQUALITY ACROSS EU REGIONS
15
Résumé
En bref: Malgré que les États membres se soient engagés à promouvoir l'égalité des chances dans l'éducation et la formation, il subsiste des disparités géographiques dans l’offre et les débouchés éducatifs non seulement entre les États membres, mais aussi à l’intérieur de ceux-ci.
Ce rapport dresse le tableau des inégalités en matière d’offres et de débouchés entre régions d’un même État membre. Il a été conçu à l'intention des décideurs politiques pour les aider à élaborer des mesures efficaces pour résorber ces inégalités. Ce rapport comprend plus de 100 cartes géographiques permettant de visualiser ces écarts. Les 10 premières et les 10 dernières régions du classement ont été identifiées pour chaque indicateur. Les conclusions à retenir sont les suivantes:
Inégalité d’éducation entre les régions de l’UE
Les inégalités dans l’offre et les débouchés entre les différentes régions de l’UE sont très importantes. Les écarts dans les taux de réussite au sein d'un même État sont généralement d’une ampleur similaire – et souvent plus importants – à ceux que l'on a constatés entre États.
Les régions où le nombre d’individus ne possédant pas ou guère de qualifications est le plus élevé («niveau préprimaire, primaire ou premier cycle de l’enseignement secondaire, au mieux») se situent pour la plupart dans le sud de l’Europe, en particulier au Portugal et en Espagne. À l’inverse, les régions où la population a le niveau de qualification le plus élevé se situent pour la plupart au Royaume-Uni et en Europe centrale et orientale16.
Les régions affichant le plus fort pourcentage de diplômés de l’enseignement supérieur se trouvent principalement au Royaume-Uni, en Belgique et aux Pays-Bas, mais il en existe aussi dans le nord de l’Espagne et à Chypre. À l’inverse, les régions affichant les pourcentages les plus faibles se situent en Italie, au Portugal et en Europe centrale et orientale17.
Les régions de l’UE affichant les taux les plus élevés d'«élèves et [d']étudiants à tous les niveaux de formation en pourcentage par rapport à la population totale» se concentrent dans le nord et l’ouest de l’UE: en Finlande et en Suède, essentiellement, mais aussi en Belgique et en Irlande. Les régions affichant les taux les plus bas se situent majoritairement dans l’Est de l’Allemagne, le nord de l’Italie et l’Europe du Sud-Est, mais il en existe aussi dans le nord-ouest de l’Espagne et au Portugal18.
16
Voir tableaux 3.17, 3.18 et figure 3.9 (pp. 83 et 84). 17
Voir figure 3.11; tableaux 3.21 et 3.22 (pp.85 et 86). 18
Voir figure 3.1 et tableaux 3.2 et 3.3 (p. 75).
Les régions où les «pourcentages d’élèves dans l’enseignement primaire et dans le premier cycle du secondaire par rapport à la population totale» sont les plus élevés se situent dans la République d’Irlande, au Portugal et dans le sud de l’Espagne, mais il en existe également aux Pays-Bas, au Danemark et dans le sud de la Suède. En revanche, les pourcentages les moins élevés s’observent dans le nord de l’Italie et dans l’Europe du Sud-Est19.
Les régions où les «pourcentages d’élèves et d’étudiants dans le secondaire et le post-secondaire non supérieur (CITE 3-4) parmi les 15-24 ans» sont les plus élevés se situent principalement en Italie, en Belgique, en Suède et en Finlande, alors que les régions où ces pourcentages sont les plus faibles se situent en Grèce, au Portugal, en Roumanie, en Bulgarie et en France20.
Les régions où les pourcentages d’individus avec un niveau d’instruction «de niveau secondaire ou post-secondaire non supérieur (CITE 3-4) au moins» sont les plus élevés se situent principalement en Europe centrale et orientale, tandis que les régions affichant les pourcentages les plus faibles se situent principalement Europe méridionale21.
Les écarts de participation des adultes à l’apprentissage tout au long de la vie entre les régions sont importants dans l’UE. Le Royaume-Uni, le Danemark, la Finlande et la Suède ont le plus grand nombre de régions à fort taux de participation, les régions où ce taux est faible se situent en Europe du Sud-Est22.
L'«accessibilité géographique» à l’enseignement supérieur montre d’importantes disparités selon les régions23. Les régions où l'«accessibilité géogra-phique» est la plus grande se situent principalement en Allemagne, au Royaume-Uni et aux Pays-Bas. À l’inverse, la plupart des régions où l'«accessibilité géographique» à l’enseignement supérieur24 est plus restreinte se situe en Europe du Sud-Est, dans le nord de la Suède et de la Finlande, dans les États baltes, en Espagne, au Danemark et en France.
Les disparités régionales à l’intérieur des États membres
Pour ce qui est des disparités régionales à l’intérieur de chaque État membre – mesuré par l’écart entre les valeurs maximales et minimales pour chaque indicateur25 –, c’est la Roumanie qui affiche l’écart le plus grand pour l’indicateur «Pourcentage d’élèves et étudiants à tous les niveaux d’instruction par rapport à la population totale». Elle est suivie de près par la
19
Voir figure 3.3 et tableaux 3.6 et 3.7 (p. 77). 20
Voir figure 3.4 et tableaux 3.8 et 3.9 (p. 78). 21
Voir figure 3.10; tableaux 3.19 et 3.20 (pp. 84 et 85). 22
Voir figure 3.2 et tableaux 3.4 et 3.5 (p.76). 23
Voir figure 3.6; tableau 3.12 (pp. 80 et 81). 24
Le % de la population totale d’une région résidant à plus de 60 minutes de l’université la plus proche. 25
Les indicateurs examinés sont listés dans le tableau 3.1, p. 74.
EDUCATION INEQUALITY ACROSS EU REGIONS
16
République tchèque, la Belgique et l’Espagne. L’Irlande affiche l’écart le plus faible (il faut noter toutefois qu’elle ne comporte que deux régions). Le Danemark, la Suède, la Hongrie et la Pologne semblent également se caractériser par de faibles écarts entre les valeurs maximales et minimales de leurs régions pour cet indicateur26.
Concernant l’indicateur «Participation des adultes à l’apprentissage tout au long de la vie», le Royaume-Uni est de loin l’État où les inégalités entre régions sont les plus flagrantes, l’écart entre la valeur la plus élevée (Londres intra-muros, 16,1 %) et la valeur la plus faible (Irlande du Nord, 5,7 %) étant de 10,4 %. La Slovaquie et le Danemark accusent aussi de fortes inégalités régionales pour cet indicateur27.
La Belgique est l’État où la différence est la plus marquée entre les régions affichant, respectivement, les plus élevés et les plus faibles chiffres en ce qui concerne les «pourcentages d’élèves et d’étudiants inscrits dans le secondaire et le post-secondaire non supérieur par rapport à la population des 15-24 ans».
Dans certains États membres, l’écart entre les régions est très marqué pour l’indicateur «Pourcentage d’étudiants dans l’enseignement supérieur par rapport à la population des 15-24 ans». Les trois États connaissant les écarts les plus accentués sont, dans l’ordre, la Belgique, la République tchèque et l’Autriche. En outre, la Grèce, l’Italie et la Roumanie accusent aussi une forte disparité interrégionale pour cet indicateur, avec un écart de plus de 80 % entre le haut et le bas du classement. Ceci tient souvent au monopole de la région de la capitale nationale sur l’offre en matière d’enseignement supérieur28.
Concernant le nombre de personnes résidant à plus de 60 minutes de l’université la plus proche, ce sont les régions espagnoles qui affichent la situation la plus disparate. La Grèce, la Finlande et la Bulgarie occupent les deuxième, troisième et quatrième positions.
Pour ce qui est du nombre de diplômés de l’enseignement supérieur, on observe un écart interrégional de plus de 15 % dans huit États membres. L’écart le plus important est enregistré au Royaume-Uni (23,4 %), viennent ensuite la France (21,3 %), la Belgique (19,4 %), la République tchèque (18,7 %), l’Espagne (17,5 %), la Slovaquie (17 %) et la Roumanie (15,4 %). La disparité pour cet indicateur est relativement plus faible en Irlande, en Italie, en Slovénie, au Portugal, en Finlande et en Autriche (toujours inférieure à 10 %)29.
26
Voir tableau 4.45, p. 150. 27
Voir tableau 4.45, p. 150. 28
Voir tableau 4.45, p. 150. 29
Voir tableau 4.46, p. 150.
S’agissant du nombre de personnes qui ne possèdent pas ou guère de diplômes (qui ont reçu «un enseignement préprimaire, primaire ou de premier cycle du secondaire, au mieux»), la France est en première position pour les disparités régionales, avec un écart de 27,2 %; elle est suivie par la Grèce, l’Espagne, la Roumanie et l’Allemagne. En revanche, les pays où les disparités sont les plus faibles sont la Slovénie, l’Irlande, la Slovaquie, l’Autriche et la Finlande30.
Autres conclusions importantes:
Les moyennes nationales dissimulent souvent de tristes réalités locales et régionales.
Les disparités régionales en matière d’apprentissage déséquilibrent le développement et la croissance économique des régions.
Les disparités régionales en matière d’éducation aggravent les inégalités entre régions. Elles alimentent aussi la fuite des cerveaux vers les régions plus riches ou plus développées.
Les inégalités en matière d’éducation entre les régions de l’UE ont une nature, une ampleur et des conséquences variables. Elles requièrent des solutions sur mesure plutôt que génériques.
Les données du niveau sous-régional et du niveau des établissements scolaires et des classes sont actuellement recueillies par les États membres. Cependant, une amélioration s’impose en ce qui concerne la coordination et la divulgation de ces informations.
La collecte de données sur les inégalités d’éducation avec ventilation géographique peut être utile pour l’autonomie locale et la décentralisation. Les informations recueillies sont pertinentes au niveau local. Elles peuvent encourager les écoles, les organisations locales et le gouvernement à s’engager dans la planification et la prise de mesures fondées sur des données précises.
Les disparités géographiques en matière d’offres et de débouchés reflètent des inégalités plus graves. Les actions en faveur de l’éducation ne sont pas suffisantes. Celles qui s’attaquent aux causes profondes de la pauvreté et d’autres inégalités auront probablement plus d’influence sur les inégalités régionales liées à l’éducation que les mesures uniquement centrées sur l’éducation.
30
Voir tableau 4.46, p. 150.
EDUCATION INEQUALITY ACROSS EU REGIONS
17
Zusammenfassung
Kurz gesagt: Obwohl sich die EU-Mitgliedstaaten zur Förderung der Chancengleichheit im Bereich der allgemeinen und beruflichen Bildung verpflichtet haben, bestehen bei den Ausbildungsangeboten und den Ausbildungsabschlüssen weiterhin große regionale Unterschiede, sowohl zwischen den einzelnen Mitglied-staaten als auch innerhalb jedes einzelnen Staates.
Dieser Bericht vermittelt ein Bild der innerstaatlichen regionalen Ungleichheiten der Ausbildungsangebote und -abschlüssen in der EU. Dies soll den politischen Entscheidungsträgern helfen, wirksame Maßnahmen zur Beseitigung dieser Ungleichheiten zu ergreifen. Auf über 100 Karten werden die geografischen Unterschiede optisch veranschaulicht. Der Bericht ermittelt für jeden einzelnen der untersuchten Indikatoren die zehn besten und die zehn schwächsten EU-Regionen auf. Der Bericht enthält folgende Schlüsselbotschaften:
Bildungsungleichheiten zwischen den EU-Regionen
Bei den einzelnen Ausbildungsangeboten und Ausbildungsabschlüssen bestehen erhebliche Ungleichheiten zwischen den einzelnen EU-Regionen. Verglichen mit den auf internationaler Ebene festgestellten Leistungsunterschieden sind die Unterschiede beim innerstaatlichen Vergleich häufig ebenso groß und oftmals größer.
Den höchsten Prozentsatz von Menschen mit geringer formaler Ausbildung ("maximal Vorschule, Primarbereich und unterer Sekundarbereich") weisen Regionen vorwiegend in Südeuropa und insbesondere in Portugal und Spanien auf. Dagegen liegen die Regionen mit höher qualifizierten Einwohnern größtenteils im Vereinigten Königreich sowie in Mittel- und Osteuropa31.
Die Regionen mit dem höchsten Anteil an Hochschulabsolventen finden sich in erster Linie im Vereinigten Königreich, in Belgien und den Niederlanden, aber auch in Nordspanien und auf Zypern. Im Gegensatz dazu liegen die Regionen mit dem geringsten Prozentsatz an Akademikern in Italien, Portugal sowie in Mittel- und Osteuropa32.
Die EU-Regionen mit dem höchsten Anteil an "Schülern und Studierenden aller Bildungsebenen ausgedrückt als Prozentsatz der Gesamtbevölkerung" konzentrieren sich im Norden und Westen der EU, insbesondere in Finnland und Schweden sowie in Belgien und Irland. Die Regionen mit dem niedrigsten Anteil liegen vornehmlich in Ostdeutschland, Norditalien und Südosteuropa sowie im Nordwesten Spaniens und in Portugal33.
31
Siehe Tabellen 3.17 und 3.18 sowie Schaubild 3.9 (S. 83 f.). 32
Siehe Schaubild 3.11 sowie die Tabellen 3.21 und 3.22 (S. 85 f.). 33
Siehe Schaubild 3.1 sowie die Tabellen 3.2 und 3.3 (S. 75).
Die Regionen mit dem höchsten Anteil an "Schülern im Primar- und unteren Sekundarbereich ausgedrückt als Prozentsatz der Gesamtbevölkerung" wurden in der Republik Irland, Portugal, Südspanien sowie in den Niederlanden, Dänemark und Südschweden ermittelt. Demgegenüber findet sich der niedrigste Anteil dieser Gruppe in Norditalien und in Südosteuropa34.
Die Regionen mit dem höchsten Anteil an "Schülern und Studierenden im postsekundären nicht-universitären Bereich ausgedrückt als Prozentsatz der Bevölkerung der 15-24jährigen" befinden sich vor allem in Italien, Belgien, Schweden und Finnland, die Regionen mit dem niedrigsten Anteil dagegen insbesondere in Griechenland, Spanien, Portugal, Rumänien, Bulgarien und Frankreich35.
Die Regionen mit dem höchsten Anteil an Personen, die "mindestens einen Abschluss im postsekundären nicht-universitären Bereich" erworben haben, liegen vor allem in Mittel- und Osteuropa, wohingegen die Regionen mit dem geringsten Anteil solcher Personen überwiegend in Südeuropa zu finden sind36.
Es bestehen große regionale Ungleichheiten bei der Zahl der Erwachsenen, die innerhalb der EU am lebenslangen Lernen teilnehmen. Das Vereinigte Königreich, Dänemark, Finnland und Schweden weisen die höchste Zahl von Regionen mit starker Beteiligung am lebenslangen Lernen auf, während die Regionen, deren Einwohner dieses Angebot am wenigsten in Anspruch nehmen, in erster Linie in Südosteuropa liegen37.
Zwischen den einzelnen EU-Regionen bestehen erhebliche Unterschiede beim "geografischen Zugang" zur Hochschulbildung38. Die Regionen mit dem besten "geografischen Zugang" liegen vornehmlich in Deutschland, dem Vereinigten Königreich und in den Niederlanden. Demgegenüber finden sich die Regionen mit den niedrigsten Werten in Bezug auf den "geografischen Zugang" zur Hochschulbildung39 vor allem in Südosteuropa, Nordschweden und Finnland sowie in den baltischen Staaten, Spanien, Dänemark und Frankreich.
Regionale Unterschiede innerhalb der einzelnen EU-Mitgliedstaaten
Werden die regionalen Ungleichheiten, die bei einem Vergleich der höchsten und der niedrigsten Werte der untersuchten Indikatoren40 innerhalb der einzelnen Mitgliedstaaten ermittelt wurden, zugrunde gelegt, so weist Rumänien die größten regionalen Ungleichheiten in Bezug auf den Indikator "Schüler und Studierende auf allen Bildungsstufen als
34
Siehe Schaubild 3.3 sowie die Tabellen 3.6 und 3.7 (S. 77). 35
Siehe Schaubild 3.4 sowie die Tabellen 3.8 und 3.9 (S. 78). 36
Siehe Schaubild 3.10 sowie die Tabellen 3.19 und 3.20 (S. 84 f.). 37
Siehe Schaubild 3.2 und die Tabellen 3.4 and 3.5 (S. 76). 38
Siehe Schaubild 3.6 sowie Tabelle 3.12 (S. 80 f.). 39
Personen, die weiter als 60 Minuten von der nächsten Universität entfernt leben, ausgedrückt als Prozentsatz der Gesamtbevölkerung einer Region. 40
Die untersuchten Indikatoren, siehe Tabelle 3.1, S. 74.
EDUCATION INEQUALITY ACROSS EU REGIONS
18
Prozentsatz der Gesamtbevölkerung" aus, dicht gefolgt von der Tschechischen Republik, Belgien und Spanien. Demgegenüber hat die Republik Irland die niedrigsten Werte (umfasst allerdings auch nur zwei Regionen). Auch in Dänemark, Schweden, Ungarn und Polen sind offensichtlich nur recht kleine Unterschiede zwischen den regionalen Höchst- bzw. Niedrigstwerten zu verzeichnen41.
In Bezug auf den Indikator "Beteiligung von Erwachsenen am lebenslangen Lernen" sind im Vereinigten Königreich bei Weitem die größten Unterschiede festzustellen. Der Unterschied zwischen der Region mit dem höchsten Wert (Inner London, 16,1 %) und dem niedrigsten Wert (Nordirland, 5,7 %) beträgt 10,4 %. Die Slowakei und Dänemark weisen ebenfalls relativ große regionale Unterschiede in Bezug auf diesen Indikator auf42.
Belgien weist mit seinen Regionen am Anfang bzw. am Ende der Skala bei der Auswertung des Indikators "Schüler und Studierende im oberen Sekundarbereich und im postsekundären nicht-universitären Bereich (ISCED 3-4) ausgedrückt als Prozentsatz der Bevölkerung der 15-24jährigen" den größten Unterschied auf.
In einigen Mitgliedstaaten bestehen große Unterschiede zwischen den Regionen bei dem Indikator "Hochschulstudierende als Prozentsatz der Bevölkerung zwischen 20 und 24 Jahren". Der größte Abstand besteht in Belgien, dicht gefolgt von der Tschechischen Republik und Österreich. Bei diesem Indikator weisen auch Griechenland, Italien und Rumänien große Unterschiede auf, denn die Spanne zwischen den Regionen, die am besten beziehungsweise am schlechtesten abschneiden, beträgt mehr als 80 %. In den meisten Fällen ist dies auf die vorherrschende Position zurückzuführen, die die Hauptstadtregion bei Bildungsangeboten der Hochschulen einnimmt43.
Spanien weist den größten Abstand zwischen denen erfolgreichsten und den am wenigsten erfolgreichen Regionen in Bezug auf die Zahl der Menschen aus, die mehr als 60 Minuten von der nächsten Universität entfernt wohnen; dicht darauf folgt Griechenland, Finnland belegt die dritte Position, und Bulgarien folgt an vierter Stelle.
Acht EU-Mitgliedstaaten weisen einen Unterschied von über 15% zwischen ihren leistungsfähigsten beziehungsweise leistungsschwächsten Regionen in Bezug auf die Zahl ihrer Hochschulabsolventen auf. Den größten Abstand weist das Vereinigte Königreich (23,4 %) auf gefolgt von Frankreich (21,3 %), Belgien (19,4 %), der Tschechischen Republik (18,7 %), Spanien (17,5 %), der Slowakei (17 %) und Rumänien (15,4 %). Relativ klein ist der Abstand bei dieser Variablen in Irland, Italien, Slowenien, Portugal, Finnland und Österreich (alle unter 10 %)44.
41
Siehe Tabelle 4.45, S. 150. 42
Siehe Tabelle 4.45, S. 150. 43
Siehe Tabelle 4.45, S. 150. 44
Siehe Tabelle 4.46, S. 150.
Bei der Anzahl der Personen mit niedrigen Bildungsabschlüssen ("maximal Vorschule, Primarbereich und unterer Sekundarbereich") weist Frankreich (mit einem Abstand von 27,2 %) den größten Unterschied zwischen den leistungsstärksten und den leistungsschwächsten Regionen auf, und zwar vor Griechenland, Spanien, Rumänien und Deutschland. Der geringste Abstand wurde dagegen in Slowenien, Irland, der Slowakei, in Österreich und Finnland festgestellt45.
Weitere Kernaussagen
Durch die nationalen Durchschnittswerte werden häufig schlechtere Ergebnisse, die die Untersuchungen auf lokaler und regionaler Ebene ergeben haben, kaschiert.
Die regionalen Ungleichheiten im Bildungsbereich verhindern eine ausgewogene regionale Entwicklung und wirtschaftliches Wachstum.
Regionale Bildungsunterschiede verschärfen die Ungleichheiten zwischen den EU-Regionen. Sie begünstigen ferner die Abwanderung gut ausgebildeter Menschen in stärker entwickelte/reichere Regionen.
Es bestehen zwischen den EU-Regionen erhebliche Abweichungen in Bezug auf Art, Umfang und Auswirkungen der Ungleichheiten im Bildungsbereich. Die politischen Lösungsansätze dürfen nicht einheitlich formuliert werden, sondern müssen maßgeschneidert sein.
In den Mitgliedstaaten werden derzeit Angaben auf regioneninterner Ebene und in einzelnen Schulen und Klassen erhoben, die jedoch besser koordiniert und öffentlich zugänglich gemacht werden müssen.
Die Zusammenstellung geografisch aufgesplitteter Daten kann ein wichtiges Instrument zur Stärkung der Verantwortung auf lokaler Ebene und zur Dezentralisierung sein. Daraus können für die lokale Ebene relevante Informationen abgeleitet werden. Dies kann dazu beitragen, dass Schulen, Gemeindeorganisationen und Regierungsverant-wortliche auf allen Ebenen evidenz-basierende Planung und Politiken verwenden
Räumliche Unterschiede bei den Bildungsangeboten und -abschlüssen sind Ausdruck weiterer Ungleichheiten. Bildungspolitische Maßnahmen allein reichen nicht aus. Maßnahmen, die die Armut und verwandte Aspekte der Benachteiligung bei der Wurzel packen, sind wahrscheinlich wirksamer gegen die Gesamtstruktur der regionalen Bildungs-unterschiede als rein bildungspolitische Interventionen.
45
Siehe Tabelle 4.46, S. 150.
EDUCATION INEQUALITY ACROSS EU REGIONS
19
Резюме
Накратко: Въпреки ангажиментите, поети от държавите членки на ЕС, за насърчаване на равнопоставеността в образованието и обучението, между държавите членки на ЕС, а също така и вътре в самите тях, продължават да съществуват големи географски различия по отношение на образователните възможности и постижения.
Този доклад представя регионалните неравенства вътре в самите държави по отношение на образователните възможности и постижения в ЕС. Целта му е да подкрепи авторите на политики в усилията им за разработване на ефективни мерки за отстраняването на тези несъответствия. В него се съдържат над 100 карти, които спомагат за визуализирането на неравнопоставеността в образованието. Посочени са челните 10 региона на ЕС, както и 10-те региона с най-незадоволителни резултати по всеки от разгледаните показатели. Ключовите послания на доклада са:
Неравенства в областта на образованието между регионите на ЕС
Съществуват значителни неравенства в образователните възможности и постижения между регионите на ЕС. Различията в образователните постижения вътре в самите държави често са поне толкова големи, колкото различията между държавите, като нерядко са и по-големи.
Регионите с най-висок дял на хората с ниска степен на образование („не по-високо от предучилищно, основно или прогимназиално образование“) са предимно в Южна Европа, и особено в Португалия и Испания. За сравнение, регионите, в които населението е с по-висока степен на образование, се намират главно в Обединеното кралство, както и в Централна и Източна Европа46.
Регионите с най-висок дял на хората с висше образование се намират предимно в Обединеното кралство, Белгия и Нидерландия, а също така и в Северна Испания и Кипър. За сравнение, регионите с най-нисък дял са в Италия, Португалия и в Централна и Източна Европа47.
Регионите на ЕС с най-висок дял на „ученици и студенти на всички нива на образованието като процент от общото население“ са съсредоточени в Северна и Западна Европа, по-специално във Финландия и Швеция, но също така и в Белгия и Ирландия. Регионите с най-нисък дял в това отношение се намират преобладаващо в източната част на Германия, Северна Италия и
46 Вж. таблици 3.17―3.18 и фигура 3.9 (стр. 83―84). 47
Вж. фигура 3.11 по-долу; таблици 3.21 и 3.22 (стр. 85―86).
Югоизточна Европа, както и в Северозападна Испания и Португалия48.
Регионите с най-висок дял на „ученици в началното и средното образование като процент от общото население“ се наблюдават в Република Ирландия, Португалия, Южна Испания, както и в Нидерландия, Дания и Южна Швеция. За сравнение, най-нисък дял в това отношение се наблюдава в северната част на Италия и в Югоизточна Европа49.
Регионите с най-висок дял на „ученици и студенти в гимназиалното и полувисшето образование като процент от населението на възраст 15—24 години“ са предимно в Италия, Белгия, Швеция и Финландия, докато повечето от регионите с най-нисък дял са в Гърция, Испания, Португалия, Румъния, България и Франция50.
Регионите с най-висок дял на хората с „не по-високо от гимназиално или полувисше образование“ са предимно в Централна и Източна Европа, докато повечето от регионите с най-нисък дял се намират главно в Южна Европа51.
В ЕС съществуват големи регионални несъответствия по отношение на участието на възрастните в обучението през целия живот. В Обединеното кралство, Дания, Финландия и Швеция има най-голям брой региони с активно участие в обучението през целия живот, докато повечето региони с много ниска степен на участие са в Югоизточна Европа52.
Между регионите на ЕС съществуват значителни разлики в „географската достъпност“ на висшето образование53. Регионите с най-добра „географска достъпност“ са предимно в Германия, Обединеното кралство и Нидерландия. За сравнение, повечето от регионите с най-ниска „географска достъпност“ на висшето образование54 са в Югоизточна Европа, Северна Швеция и Финландия, балтийските държави, Испания, Дания и Франция.
Регионални несъответствия в рамките на държавите членки на ЕС
По отношение на регионалните несъответствия в рамките на всяка държава членка на ЕС, измерени въз основа на разликата между максималните и минималните регионални стойности за всеки изследван показател55, Румъния е с най-високото регионално несъответствие по отношение на показателя „ученици и студенти от всички нива на образованието като процент от общото
48
Вж. фигура 3.1 и таблици 3.2 и 3.3 (стр. 75). 49
Вж. фигура 3.3 и таблици 3.6 и 3.7 (стр. 77). 50
Вж. фигура 3.4 и таблици 3.8 и 3.9 (стр. 78). 51
Вж. фигура 3.10 по-долу; таблици 3.19 и 3.20 (стр. 84 ―85). 52
Вж. фигура 3.2 и таблици 3.4 и 3.5 (стр. 76). 53
Вж. фигура 3.6 по-долу; таблица 3.12 (стр. 80―81). 54
% от общото население на региона, което живее на повече от 60 минути от най-близкия университет. 55
Изследваните показатели са показани в таблица 3.1, стр. 74.

EDUCATION INEQUALITY ACROSS EU REGIONS
20
население“, следвана плътно от Чешката република, Белгия и Испания. На другия край е Република Ирландия с най-ниски стойности (трябва да се отбележи, че тя има само два региона). Дания, Швеция, Унгария и Полша също така имат относително малки разлики между максималните и минималните регионални стойности за този показател56.
По отношение на показателя „участие на възрастните в обучение през целия живот“ Обединеното кралство е определено с най-голямо регионално несъответствие, като разликата между региона с най-висока стойност (Лондон―град, 16,1 %) и региона с най-ниска стойност (Северна Ирландия, 5,7 %) е 10,4 %. Словакия и Дания също така имат относително големи регионални несъответствия по отношение на тази променлива57.
Белгия е с най-голяма разлика между региона с най-висока и този с най-ниска стойност за „ученици и студенти в гимназиалното и полувисшето образование (ISCED 3-4) като процент от населението на възраст 15 — 24 години“.
В някои държави членки съществуват големи различия между регионите по показателя „студенти във висшето образование като процент от населението на възраст 20―24 години“. Белгия е с най-голямата разлика, следвана плътно от Чешката република и Австрия. В Гърция, Италия и Румъния също са налице големи различия по този показател - разликата между регионите им с най-висока и с най-ниска стойност е над 80 %. В повечето случаи това се дължи на концентрацията на висши учебни заведения в региона на столицата.58.
В Испания се наблюдава най-голяма разлика между регионите по брой жители, които живеят на повече от 60 минути от най-близкия университет. Веднага след нея е Гърция, трета е Финландия, а България е на четвърто място.
В осем държави членки на ЕС има разлика от повече от 15 % между регионите с най-голям и с най-малък брой на завършилите висше образование. Обединеното кралство е държавата с най-голяма разлика (23,4 %), следвана от Франция (21,3 %), Белгия (19,4 %), Чешката република (18,7 %), Испания (17,5 %), Словакия (17 %) и Румъния (15,4 %). Разликата по тази променлива е относително по-малка в Ирландия, Италия, Словения, Португалия, Финландия и Австрия (всички под 10 %)59.
Що се отнася до ниско образованите хора (с „не по-висока степен от предучилищно, основно или прогимназиално образование“), най-голямата разлика между регионите с най-голям и най-
56
Вж. таблица 4.45, стр. 150. 57
Вж. таблица 4.45, стр. 150. 58
Вж. таблица 4.45, стр. 150. 59
Вж. таблица 4.46, стр. 150.
малък брой слабо образовани хора, е във Франция (27,2 %). Следват Гърция, Испания, Румъния и Германия. За сравнение, държавите с най-малки разлики между регионите са Словения, Ирландия, Словакия, Австрия и Финландия60.
Други ключови послания
Средните национални стойности често прикриват неприятната местна и регионална действителност.
Регионалните различия в сферата на образованието възпрепятстват балансираното регионално развитие и икономически растеж.
Регионалните несъответствия в образованието задълбочават неравенството между регионите на ЕС. Те също така захранват изтичането на мозъци към по-развитите/по-богатите региони.
Съществуват значителни особености в естеството, мащаба и последиците от неравенствата в образованието в отделните региони на ЕС. Следователно, политиките и решенията трябва да се съобразяват с тези регионални особености, а не да следват един универсален модел.
Понастоящем в рамките на държавите членки се събират данни на подрегионално ниво и на ниво отделни училища и класове, като е необходима по-добра координация, както и тези данни да бъдат направени публично достояние.
Събирането на географски необобщени данни за неравенството в областта на образованието може да бъде важен инструмент за овластяване на местната администрация и за постигане на децентрализация. По този начин се събира полезна информация, която е специфична за съответното населено място. . Това също би помогнало на училищата, различните общности и на администрациите на всички нива да се включат в планирането и правенето на политики като се базират на реални данни.
Различията във възможностите и постиженията в образованието отразяват по-дълбоки различия между регионите. Мерките на образователната политика сами по себе си са недостатъчни. Политики, насочени към изкореняване на бедността и нейните последствия биха били по-успешни в това начинание отколкото чисто образователни интервенции.
60
Вж. таблица 4.46, стр. 150.
EDUCATION INEQUALITY ACROSS EU REGIONS
21
Shrnutí
Ve stručnosti: Navzdory závazkům členských států EU prosazovat rovný přístup ve vzdělávání a odborné přípravě přetrvávají velké zeměpisné rozdíly ve vzdělávacích příležitostech a výsledcích vzdělávání mezi členskými státy, ale i v rámci členských států EU.
Tato zpráva popisuje vnitrostátní regionální nerovnosti ve vzdělávacích příležitostech a výsledcích vzdělávání v EU. Jejím cílem je podpořit tvůrce politik v jejich úsilí o vypracování účinných opatření k odstranění těchto rozdílů. Obsahuje více než 100 map, které napomáhají názornému vyobrazení nerovností. Pro každý z posuzovaných ukazatelů zpráva určuje 10 nejsilnějších a 10 nejslabších regionů EU. Jejími klíčovými zjištěními jsou:
Nerovnosti ve vzdělávání mezi regiony EU
Mezi regiony EU existují značné nerovnosti ve vzdělávacích příležitostech a výsledcích vzdělávání. Vnitrostátní rozdíly jsou často přinejmenším stejně velké a někdy i větší, srovnáme-li je s mezinárodními rozdíly.
Regiony s nejvyšším podílem obyvatel s nízkou formální kvalifikací („nejvýše předškolní, základní nebo nižší střední vzdělání“) jsou většinou v jižní Evropě, a zejména v Portugalsku a ve Španělsku. Naopak regiony, kde lidé disponují vyšší kvalifikací, jsou většinou ve Spojeném království a také ve střední a východní Evropě61.
Regiony s nejvyšším podílem osob s terciárním vzděláním jsou většinou ve Spojeném království, Belgii a Nizozemsku, ale také v severním Španělsku a na Kypru. Naproti tomu regiony s nejnižším podílem jsou v Itálii, Portugalsku a v zemích EU střední a východní Evropy62.
Nejvíce regionů EU „s nejvyšším podílem žáků a studentů na všech úrovních vzdělávání z celkové populace“ je soustředěno v severní a západní části EU, zejména jde o Finsko, Švédsko, ale také Belgii a Irsko. Regiony s nejnižším podílem se nacházejí především na východě Německa, severu Itálie a v jihovýchodní Evropě, ale také v severozápadním Španělsku a v Portugalsku63.
Regiony s nejvyšším procentuálním podílem „žáků na základním a nižším stupni středoškolského vzdělávání z celkové populace“ se nacházejí mezi regiony Irska, Portugalska, jižního Španělska, ale
61
Viz tabulky 3.17-3.18 a obrázek 3.9 (s. 83–84). 62
Viz obrázek 3.11; Tabulky 3.21 a 3.22 (s. 85–86). 63
Viz obrázek 3.1 a tabulky 3.2 a 3.3 (s. 75).
také Nizozemska, Dánska a na jihu Švédska. Naproti tomu regiony s nejnižšími podíly jsou v severní Itálii a v jihovýchodní Evropě64.
Regiony s nejvyššími „procentuálními podíly žáků a studentů na stupni vyššího středního vzdělání a postsekundárního neterciárního vzdělání z celkové populace ve věku 15–24 let“ jsou především v Itálii, Belgii, Švédsku a Finsku, zatímco většina regionů s nejnižšími podíly jsou v Řecku, Španělsku, Portugalsku, Rumunsku, Bulharsku a ve Francii65.
Regiony s nejvyššími podíly obyvatel s „nanejvýš vyšším středním vzděláním a postsekundárním neterciárním vzděláním“ jsou většinou ve střední a východní Evropě, zatímco regiony s nejnižšími podíly jsou většinou v jižní Evropě66.
Existují velké regionální rozdíly, pokud jde o účast dospělých na celoživotním vzdělávání v EU. Spojené království, Dánsko, Finsko a Švédsko mají nejvyšší počet regionů s výraznou účastí na celoživotním učení, zatímco většina regionů s velmi nízkou mírou zapojení do celoživotního vzdělávání se nachází v jihovýchodní Evropě67.
Existují značné rozdíly v „zeměpisné přístupnosti“ terciárního vzdělávání mezi regiony EU68. Regiony s nejlepší „zeměpisnou přístupností“ jsou většinou v Německu, Spojeném království a Nizozemsku. Naproti tomu většina regionů s nejslabší hodnotou ukazatele „zeměpisná dostupnost“ terciárního vzdělávání69 se nachází v jihovýchodní Evropě, severní části Švédska a Finska, v pobaltských státech, Španělsku, Dánsku a ve Francii.
Regionální rozdíly v rámci členských států EU
Co se týče rozdílnosti regionů v rámci jednotlivých členských států EU vyjádřené rozdíly mezi nejvyšší a nejnižší regionální hodnotou pro každý posuzovaný ukazatel70, má nejvyšší regionální rozdíly, pokud jde o ukazatel „procentuální podíl žáků a studentů na všech úrovních vzdělávání z celkové populace“, Rumunsko těsně následované Českou republikou, Belgií a Španělskem. Na opačném konci se s nejnižší hodnotou nachází Irsko (ale všimněme si, že má pouze dva regiony). Zdá se, že Dánsko, Švédsko, Maďarsko a Polsko vykazují také poměrně malé rozdíly mezi nejvyšší a nejnižší regionální hodnotou tohoto ukazatele71.
64
Viz obrázek 3.3 a tabulky 3.6 a 3.7 (s. 77). 65
Viz obrázek 3.4 a tabulky 3.8 a 3.9 (s. 78). 66
Viz obrázek 3.10; Tabulky 3.19 a 3.20 (s. 84–85). 67
Viz obrázek 3.2 a tabulky 3.4 a 3.5 (s. 76). 68
Viz obrázek 3.6; Tabulka 3.12 (s.80–81). 69
Procento celkového obyvatelstva regionu, žijící více než 60 minut od nejbližší vysoké školy. 70
Posuzované ukazatele viz tabulka 3.1, s. 74. 71
Viz tabulka 4.45, s. 150.

EDUCATION INEQUALITY ACROSS EU REGIONS
22
Co se týče ukazatele „účast dospělých na celoživotním učení“, zdaleka největší regionální rozdíly má Spojené království, přičemž rozdíl mezi regionem s nejvyšší hodnotou (Vnitřní Londýn, 16,1 %) a regionem s nejnižší hodnotou (Severní Irsko, 5,7 %) činí 10,4 %. Slovensko a Dánsko rovněž vykazují relativně velké rozdíly mezi regiony, pokud jde o tuto proměnnou72.
Největší rozdíly mezi svým nejlepším a neslabším regionem vykazuje Belgie, pokud jde o „procentuální podíl žáků a studentů ve vyšším středním a postsekundárním neterciárním vzdělání (ISCED 3–4) z obyvatelstva ve věku 15–24 let“.
V některých členských státech existují velké rozdíly mezi regiony u ukazatele „procentuální podíl studentů v terciárním vzdělávání z obyvatelstva ve věku 20–24 let“. Největší rozdíl vykazuje Belgie, těsně následována Českou republikou a Rakouskem. Řecko, Itálie a Rumunsko dále mají velké rozdíly u tohoto ukazatele s rozpětím více než 80 % mezi svým nejlepším a nejslabším regionem. Ve většině těchto případů se jedná o výsledek dominantního postavení regionu hlavního města, pokud jde o příležitosti v oblasti terciárního vzdělávání73.
Španělsko vykazuje největší rozdíl mezi svým nejlepším a nejslabším regionem, pokud jde o počet lidí žijících více než 60 minut od nejbližší vysoké školy, za ním těsně následují Řecko s Finskem na třetím a Bulharsko na čtvrtém místě.
Osm členských států EU vykazuje rozdíl více než 15 % mezi svým nejlepším a nejslabším regionem, pokud jde o počet absolventů terciárního vzdělávání v regionu. Spojené království je zemí s největším rozdílem (23,4 %), následují Francie (21,3 %), Belgie (19,4 %), Česká republika (18,7 %), Španělsko (17,5 %), Slovensko (17 %) a Rumunsko (15,4 %). Rozdíl u této proměnné je relativně menší u Irska, Itálie, Slovinska, Portugalska, Finska a Rakouska (všechny méně než 10 %)74.
Co se týče počtu lidí s nízkou úrovní vzdělání („nanejvýš předškolní, základní a nižší středo-školské“), ukazuje se, že největší rozdíly mezi svými nejlepšími a nejslabšími regiony má Francie (rozdíl 27,2 %), následují Řecko, Španělsko, Rumunsko a Německo. Naproti tomu zeměmi s nejnižšími rozdíly jsou Slovinsko, Irsko, Slovensko, Rakousko, Finsko75.
72
Viz tabulka 4.45, s. 150. 73
Viz tabulka 4.45, s. 150. 74
Viz tabulka č. 4.46, s. 150. 75
Viz tabulka č. 4.46, s. 150.
Další klíčová zjištění
Vnitrostátní průměry často zakrývají nepříznivou situaci na místní a regionální úrovni.
Regionální rozdíly ve vzdělávání zabraňují vyváženému regionálnímu rozvoji a hospo-dářskému růstu.
Regionální rozdíly v úrovni vzdělávání prohlubují nerovnost mezi regiony EU. Zvyšují i odliv mozků směrem k rozvinutějším/bohatším regionům.
Existují značné odlišnosti v povaze, rozsahu a dopadech nerovností v oblasti vzdělávání mezi jednotlivými regiony EU. Politická řešení musí být šita na míru a nebýt pouze obecná.
Údaje na subregionální úrovni a na úrovni jednotlivých škol a školních tříd se v současnosti shromažďují v rámci členských států, je však třeba zlepšit koordinaci a poskytnout údaje k dispozici veřejnosti.
Sestavování zeměpisně rozlišených údajů o nerovnostech ve vzdělávání může být důležitým nástrojem k posílení účasti na místní úrovni a k decentralizaci. Vytvářejí se tak informace vztahující se k místní úrovni. To může pomoci školám, komunitním organizacím a orgánům státní správy na všech úrovních, aby se zapojily do plánování a tvorby politiky na základě skutečných poznatků.
Územní rozdíly, pokud jde o vzdělávací příležitosti a výsledky vzdělávání, odrážejí širší nerovnosti. Samotná opatření v oblasti vzdělávací politiky nepostačují. Politiky, které řeší otázky chudoby a související aspekty znevýhodnění již u jejich kořenů, budou mít při ovlivňování celkové struktury regionálních vzdělávacích nerovností pravděpodobně větší úspěch než čisté zásahy do vzdělávací politiky.
EDUCATION INEQUALITY ACROSS EU REGIONS
23
Resumé
Helt kortfattet: På trods af EU-medlemsstaternes
forpligtelser til at fremme lighed på uddannelses-
området er der fortsat store geografiske forskelle i
uddannelsesmuligheder og -resultater på tværs af, men
også inden for EU's medlemsstater.
Denne rapport tegner et billede af de intranationale
regionale uligheder med hensyn til uddannelses-
muligheder og -resultater i EU. Den har til hensigt at bistå
beslutningstagerne i deres bestræbelser på at udforme
effektive foranstaltninger til udjævning af disse forskelle.
Den indeholder mere end 100 kort, som bidrager til at
synliggøre ulighederne. De 10 bedste og de 10 dårligste
EU-regioner udpeges for hver af de undersøgte
indikatorer. De vigtigste budskaber i rapporten er
følgende:
Uligheder inden for uddannelse på tværs af EU's regioner
Der er betydelige uligheder mellem EU's regioner
med hensyn til uddannelses-muligheder
og -resultater. De intranationale forskelle i opnåede
resultater er typisk mindst lige så store og ofte endda
større end de internationale forskelle.
De regioner, som har det højeste antal personer med
ringe formelle kvalifikationer ("hvis højest
gennemførte uddannelse er førskole, grundskole til 7.
eller til 9./10. klassetrin"), ligger i Sydeuropa og
navnlig i Portugal og Spanien. I modsætning hertil
ligger de regioner, hvor folk har højere kvalifikationer,
hovedsagelig i Det Forenede Kongerige og i Central-
og Østeuropa76.
Regioner med den højeste andel af personer med en
videregående uddannelse ligger hovedsagelig i Det
Forenede Kongerige, Belgien og Nederlandene, men
også i det nordlige Spanien og i Cypern. I modsætning
hertil ligger regioner med den laveste andel af
personer med en videregående uddannelse i Italien,
Portugal og i den centrale og østlige del af EU77.
EU-regioner med den højeste andel af "elever og
studerende på alle uddannelsestrin som procentdel
af den samlede befolkning" findes i den nordlige og
vestlige del af EU, især i Finland og Sverige, men også
i Belgien og Irland. Regioner med den tilsvarende
laveste andel ligger hovedsagelig i det tidligere
Østtyskland, det nordlige Italien og Sydøsteuropa,
men også i det nordvestlige Spanien og Portugal78.
76
Jf. tabel 3.17-3.18 og figur 3.9 (s. 83-84). 77
Jf. figur 3.11, tabel 3.21 og 3.22 (s. 85-86). 78
Jf. figur 3.1, tabel 3.2 og 3.3 (s. 75).
Regioner med den højeste andel af "elever i
folkeskolen som procentdel af den samlede
befolkning" findes i Republikken Irland, Portugal, det
sydlige Spanien, men også i Nederlandene, Danmark
og det sydlige Sverige. I modsætning hertil findes den
laveste andel i det nordlige Italien og i
Sydøsteuropa79.
Regioner med den højeste andel af "elever og
studerende ved gymnasiale uddannelser og
eftergymnasiale uddannelser, som ikke er en højere
uddannelse, som procentdel af befolkningen i alderen
15-24 år" ligger hovedsagelig i Italien, Belgien, Sverige
og Finland, mens de fleste regioner med den laveste
andel findes i Grækenland, Spanien, Portugal,
Rumænien, Bulgarien og Frankrig80.
Regioner med den højeste andel af personer, hvis
"højest gennemførte uddannelse er en gymnasial
uddannelse eller eftergymnasial uddannelse, som
ikke er en højere uddannelse", ligger hovedsagelig i
Central- og Østeuropa, mens regionerne med den
laveste andel hovedsagelig ligger i Sydeuropa81.
Der er store regionale forskelle i EU for så vidt angår
voksnes deltagelse i livslang læring. Det Forenede
Kongerige, Danmark, Finland og Sverige har det
højeste antal regioner med høj deltagelse i livslang
læring, mens de fleste regioner med lav deltagelse i
livslang læring ligger i Sydøsteuropa82.
Der er betydelige forskelle mellem EU's regioner for
så vidt angår den "geografiske tilgængelighed" til
videregående uddannelser83. Regioner med den
bedste "geografiske tilgængelighed" findes
hovedsagelig i Tyskland, Det Forenede Kongerige og
Nederlandene. I modsætning hertil ligger regioner
med færrest point i vurderingen af "geografisk
tilgængelighed" af videregående uddannelser84 i
Sydøsteuropa, det nordlige Sverige og Finland, de
baltiske lande, Spanien, Danmark og Frankrig.
Regionale forskelle inden for EU's medlemsstater
Hvis man ser på de regionale forskelle inden for EU's
medlemsstater målt som forskellen mellem de
højeste og laveste regionale værdier for hver
undersøgt indikator85, har Rumænien den største
regionale ulighed for så vidt angår indikatoren "elever
og studerende på alle uddannelsestrin som
procentdel af den samlede befolkning", tæt efterfulgt
af Tjekkiet, Belgien og Spanien. I den anden ende af
skalaen har Republikken Irland den laveste værdi
79
Jf. figur 3.3, tabel 3.6 og 3.7 (s. 77). 80
Jf. figur 3.4, tabel 3.8 og 3.9 (s. 78). 81
Jf. figur 3.10, tabel 3.19 og 3.20 (s. 84-85). 82
Jf. figur 3.2 og tabel 3.4 og 3.5 (s. 76). 83
Jf. figur 3.6, tabel 3.12 (s. 80-81). 84
Procentdel af en regions samlede befolkning, som bor mere end 60 minutter fra det nærmeste universitet. 85
De undersøgte indikatorer vises i tabel 3.1, s. 74.
EDUCATION INEQUALITY ACROSS EU REGIONS
24
(men bemærk, at landet kun har to regioner).
Danmark, Sverige, Ungarn og Polen udviser også
relativt små forskelle mellem den højeste og laveste
regionale værdi for denne indikator86.
Hvis man ser på indikatoren "voksnes deltagelse i
livslang læring", har Det Forenede Kongerige langt
den største regionale ulighed, idet forskellen mellem
regionen med den højeste værdi (det indre London,
16,1 %) og regionen med den laveste værdi
(Nordirland, 5,7 %) er 10,4 %. Slovakiet og Danmark
har også rimelig store regionale forskelle for så vidt
angår denne indikator87.
Belgien udviser størst forskel mellem regionerne med
det højeste og laveste niveau for så vidt angår "elever
og studerende ved gymnasiale uddannelser og
eftergymnasiale uddannelser, som ikke er en højere
uddannelse (ISCED 3-4), som procentdel af
befolkningen i alderen 15-24 år".
I nogle medlemsstater er der stor forskel mellem
regionerne for så vidt angår indikatoren "studerende
ved videregående uddannelser som procentdel af
befolkningen i alderen 20-24 år". Belgien udviser den
største forskel, tæt efterfulgt af Tjekkiet og Østrig.
Grækenland, Italien og Rumænien udviser ligeledes
en stor spredning for så vidt angår denne indikator
med over 80 % mellem regionerne med det højeste
og det laveste niveau. I de fleste af de nævnte
tilfælde skyldes dette hovedstadsregionens
dominerende stilling med hensyn til udbuddet af
videregående uddannelser88.
Spanien udviser størst forskel mellem regioner med
det højeste og laveste niveau for så vidt angår
befolkning, som bor mere end 60 minutter fra det
nærmeste universitet, tæt efterfulgt af Grækenland
på andenpladsen, Finland på tredjepladsen og
Bulgarien på fjerdepladsen.
Otte EU-medlemsstater udviser en forskel på mere
end 15 % mellem regionerne med det højeste og
laveste niveau for så vidt angår antallet af personer
med en videregående uddannelse i en region. Det
Forenede Kongerige udviser den største forskel (23,4
%), herefter følger Frankrig (21,3 %), Belgien (19,4 %),
Tjekkiet (18,7 %), Spanien (17,5 %), Slovakiet (17 %)
og Rumænien (15,4 %). Forskellen for så vidt angår
denne indikator er noget mindre i Irland, Italien,
Slovenien, Portugal, Finland og Østrig (for alles
vedkommende under 10 %)89.
86
Jf. tabel 4.45, s. 150. 87
Jf. tabel 4.45, s. 150. 88
Jf. tabel 4.45, s. 150. 89
Jf. tabel 4.46, s. 150.
Hvis man ser på antallet af personer med ringe
uddannelsesmæssige kvalifikationer ("hvis højest
gennemførte uddannelse er førskole eller
folkeskole"), udviser Frankrig den største forskel
mellem regionerne med det højeste og laveste niveau
(forskel på 27,2 %), efterfulgt af Grækenland,
Spanien, Rumænien og Tyskland. I den anden ende af
skalaen udviser Slovenien, Irland, Slovakiet, Østrig og
Finland den mindste forskel90.
Andre vigtige budskaber
Det nationale gennemsnit dækker ofte over
ubehagelige lokale og regionale omstændigheder.
Regionale forskelle på uddannelsesområdet
forhindrer ensartet regional udvikling og økonomisk
vækst.
Regionale forskelle på uddannelsesområdet
forstørrer uligheden mellem EU's regioner. De
bidrager også til hjerneflugt i retning af mere
udviklede og rigere regioner.
Der er betydelige variationer i arten, omfanget og
virkningerne af de uddannelsesmæssige uligheder på
tværs af EU's regioner. Politiske løsningsmodeller skal
specifikt tilpasses til disse forhold, og ikke blot være
generelle.
Der indsamles for øjeblikket oplysninger om de
subregionale niveauer og de enkelte skoler og klasser
i medlemsstaterne, men der er behov for en bedre
koordinering heraf og for, at disse oplysninger bliver
gjort offentligt tilgængelige.
Samling af geografisk spredte oplysninger om
uligheder på uddannelsesområdet kan fungere som
et vigtigt redskab til lokal myndiggørelse og
decentralisering. Herved fremskaffes oplysninger med
lokal relevans. Disse oplysninger kan bidrage til at
inddrage skoler, lokalsamfundsorganisationer og
myndigheder på alle planer i evidensbaseret
planlægning og politik.
De rumlige forskelle med hensyn til
uddannelsesmuligheder og -resultater afspejler mere
vidtrækkende uligheder. Uddannelses-politiske
foranstaltninger kan ikke stå alene. Politiske tiltag,
som sikrer en varig løsning på fattigdomsproblemer
og hertil knyttede ulemper, vil sandsynligvis være
mere effektive med hensyn til udjævning af de
overordnede regionale uligheder på
uddannelsesområdet, hvis de rækker ud over rent
uddannelsespolitiske indgreb.
90
Jf. tabel 4.46, s. 150.
EDUCATION INEQUALITY ACROSS EU REGIONS
25
Resumen
En síntesis: A pesar de los compromisos de los Estados miembros de la UE por promover la igualdad en educación y formación, todavía existen importantes diferencias geográficas en las oportunidades y los resultados educativos, entre y también dentro de los Estados miembros de la UE.
Este informe presenta un panorama de las desigualdades regionales intranacionales que existen en las oportunidades y los resultados educativos en la UE. Su objetivo es colaborar con los responsables políticos en su esfuerzo por elaborar medidas eficaces que corrijan dichas desigualdades. Contiene más de cien mapas que ayudan a visualizar las desigualdades y localiza las diez primeras y las diez últimas regiones de la UE para cada uno de los indicadores que estudia. Sus mensajes clave son:
Desigualdades educativas entre las regiones de la UE
Existen desigualdades considerables en las oportunidades y resultados educativos entre las regiones de la UE. Las diferencias intranacionales en el rendimiento son frecuentemente y como mínimo tan amplias como las diferencias internacionales, llegando en ocasiones a superarlas.
Las regiones con las tasas más altas de individuos con bajas cualificaciones formales («en la mayoría de los casos educación infantil, primaria y secundaria obligatoria») se encuentran fundamentalmente en el sur de Europa, especialmente en Portugal y España. Por el contrario, las regiones en las que están más cualificados se encuentran fundamentalmente en el Reino Unido, así como en Europa central y oriental91.
Las regiones con las tasas más altas de individuos con una cualificación de educación superior se encuentran fundamentalmente en el Reino Unido, Bélgica y los Países Bajos, pero también en el norte de España y en Chipre. Por el contrario, las regiones con las tasas más bajas se encuentran en Italia, Portugal y en la UE central y oriental92
.
Las regiones de la UE con las tasas más altas de «alumnos y estudiantes de todos los niveles de educación como porcentaje del total de la población» están concentradas en la zona norte y oeste de la UE, especialmente en Finlandia y Suecia, pero también en Bélgica e Irlanda. Las regiones con las tasas más bajas se encuentran en su mayoría en el este de Alemania, el norte de Italia y el sureste de Europa, pero también en el noroeste de España y Portugal93
.
91
Véanse las tablas 3.17 y 3.18 y la figura 3.9 (pp.83-84). 92
Véase la figura 3.11; las tablas 3.21 y 3.22 (pp.85-86). 93
Véanse la figura 3.1 y las tablas 3.2 y 3.3 (p.75).
Las regiones con las tasas más altas de «alumnos en educación primaria y secundaria obligatoria como porcentaje de la población total» se observan en regiones de la República de Irlanda, Portugal y en el sur de España, pero también en los Países Bajos, Dinamarca y Suecia Meridional. Por el contrario, las tasas más bajas se observan en el norte de Italia y en el sureste de Europa94
.
Las regiones con las tasas más altas de «alumnos y estudiantes en Bachillerato y ciclos formativos de grado superior como porcentaje de la población con edades comprendidas entre quince y veinticuatro años» se encuentran fundamentalmente en Italia, Bélgica, Suecia y Finlandia, mientras que la mayoría de las regiones con las tasas más bajas están en Grecia, España, Portugal, Rumanía, Bulgaria y Francia95
.
Las regiones con las tasas más altas de individuos con «como máximo Bachillerato y ciclos formativos de grado superior » se encuentran fundamentalmente en Europa central y oriental. Por lo que se refiere a las regiones con las tasas más bajas, éstas están localizadas, en su mayoría, en el sur de Europa96
.
Existen grandes desigualdades regionales en lo que respecta a la participación de adultos en aprendizaje permanente en la UE. El Reino Unido, Dinamarca, Finlandia y Suecia tienen el mayor número de regiones en las que existe una gran participación en aprendizaje permanente, mientras que la mayoría de las regiones con tasas muy bajas de participación en aprendizaje permanente se encuentran en el sureste de Europa97.
Existen diferencias significativas con respecto al «accesibilidad geográfica» a la educación superior en las distintas regiones de la UE98
. Las regiones con mejor «accesibilidad geográfica» se encuentran, en la mayoría de los casos, en Alemania, el Reino Unido y los Países Bajos, mientras que, la mayoría de las regiones con peores resultados en la «accesibilidad geográfica» a la educación superior99 están en el sureste de Europa, el norte de Suecia y Finlandia, los países bálticos, España, Dinamarca y Francia.
Desigualdades regionales dentro de los Estados miembros de la UE
Observando las desigualdades regionales que se producen dentro de cada Estado miembro de la UE calculadas mediante la diferencia entre los valores regionales máximos y mínimos para cada indicador estudiado100, Rumanía tiene la desigualdad regional
94
Véanse la figura 3.3 y las tablas 3.6 y 3.7 (p.77). 95
Véanse la figura 3.4 y las tablas 3,8 y 3.9 (p.78). 96
Véase la figura 3.10; Las tablas 3.19 y 3.20 (pp.84-85). 97
Véanse la figura 3.12 y las tablas 3.4 y 3.5 (p.76). 98
Véase la figura 3.6; Tabla 3.12 (pp.80-81). 99
El % de la población total de una región que vive a más de 60 minutos de la universidad más cercana. 100
Los indicadores examinados aparecen en la tabla 3.1, p.74.
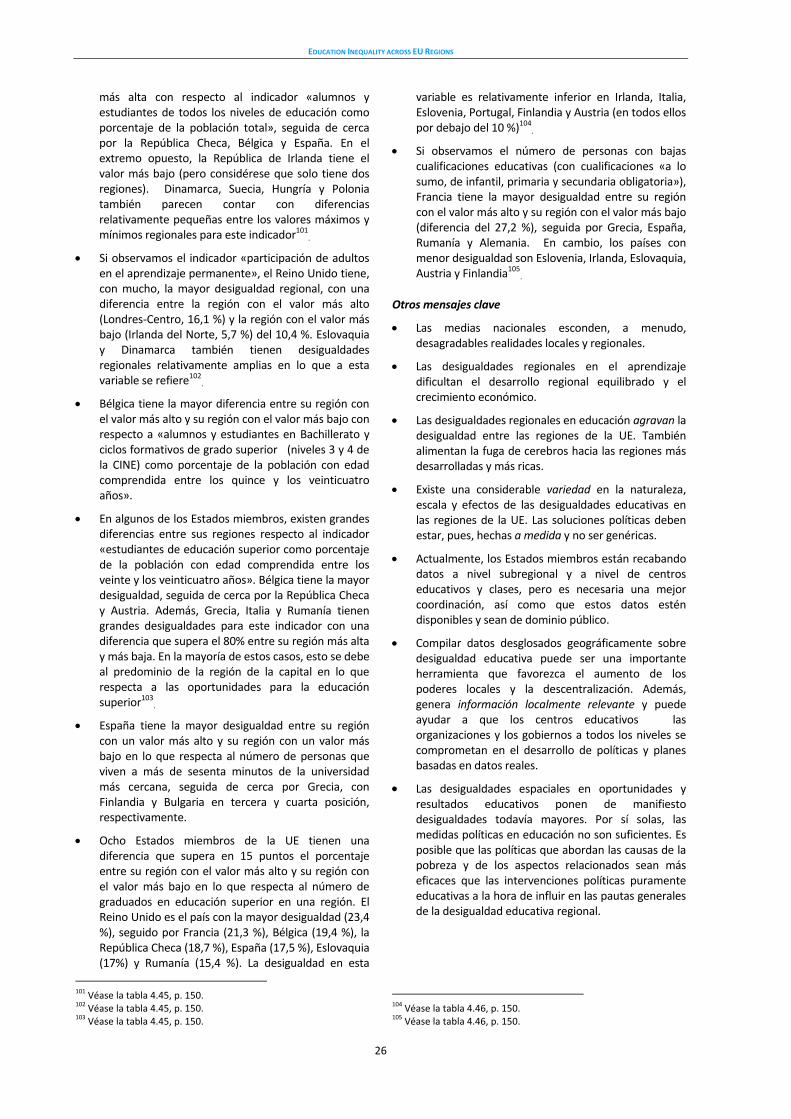
EDUCATION INEQUALITY ACROSS EU REGIONS
26
más alta con respecto al indicador «alumnos y estudiantes de todos los niveles de educación como porcentaje de la población total», seguida de cerca por la República Checa, Bélgica y España. En el extremo opuesto, la República de Irlanda tiene el valor más bajo (pero considérese que solo tiene dos regiones). Dinamarca, Suecia, Hungría y Polonia también parecen contar con diferencias relativamente pequeñas entre los valores máximos y mínimos regionales para este indicador101
.
Si observamos el indicador «participación de adultos en el aprendizaje permanente», el Reino Unido tiene, con mucho, la mayor desigualdad regional, con una diferencia entre la región con el valor más alto (Londres-Centro, 16,1 %) y la región con el valor más bajo (Irlanda del Norte, 5,7 %) del 10,4 %. Eslovaquia y Dinamarca también tienen desigualdades regionales relativamente amplias en lo que a esta variable se refiere102
.
Bélgica tiene la mayor diferencia entre su región con el valor más alto y su región con el valor más bajo con respecto a «alumnos y estudiantes en Bachillerato y ciclos formativos de grado superior (niveles 3 y 4 de la CINE) como porcentaje de la población con edad comprendida entre los quince y los veinticuatro años».
En algunos de los Estados miembros, existen grandes diferencias entre sus regiones respecto al indicador «estudiantes de educación superior como porcentaje de la población con edad comprendida entre los veinte y los veinticuatro años». Bélgica tiene la mayor desigualdad, seguida de cerca por la República Checa y Austria. Además, Grecia, Italia y Rumanía tienen grandes desigualdades para este indicador con una diferencia que supera el 80% entre su región más alta y más baja. En la mayoría de estos casos, esto se debe al predominio de la región de la capital en lo que respecta a las oportunidades para la educación superior103
.
España tiene la mayor desigualdad entre su región con un valor más alto y su región con un valor más bajo en lo que respecta al número de personas que viven a más de sesenta minutos de la universidad más cercana, seguida de cerca por Grecia, con Finlandia y Bulgaria en tercera y cuarta posición, respectivamente.
Ocho Estados miembros de la UE tienen una diferencia que supera en 15 puntos el porcentaje entre su región con el valor más alto y su región con el valor más bajo en lo que respecta al número de graduados en educación superior en una región. El Reino Unido es el país con la mayor desigualdad (23,4 %), seguido por Francia (21,3 %), Bélgica (19,4 %), la República Checa (18,7 %), España (17,5 %), Eslovaquia (17%) y Rumanía (15,4 %). La desigualdad en esta
101
Véase la tabla 4.45, p. 150. 102
Véase la tabla 4.45, p. 150. 103
Véase la tabla 4.45, p. 150.
variable es relativamente inferior en Irlanda, Italia, Eslovenia, Portugal, Finlandia y Austria (en todos ellos por debajo del 10 %)104
.
Si observamos el número de personas con bajas cualificaciones educativas (con cualificaciones «a lo sumo, de infantil, primaria y secundaria obligatoria»), Francia tiene la mayor desigualdad entre su región con el valor más alto y su región con el valor más bajo (diferencia del 27,2 %), seguida por Grecia, España, Rumanía y Alemania. En cambio, los países con menor desigualdad son Eslovenia, Irlanda, Eslovaquia, Austria y Finlandia105
.
Otros mensajes clave
Las medias nacionales esconden, a menudo, desagradables realidades locales y regionales.
Las desigualdades regionales en el aprendizaje dificultan el desarrollo regional equilibrado y el crecimiento económico.
Las desigualdades regionales en educación agravan la desigualdad entre las regiones de la UE. También alimentan la fuga de cerebros hacia las regiones más desarrolladas y más ricas.
Existe una considerable variedad en la naturaleza, escala y efectos de las desigualdades educativas en las regiones de la UE. Las soluciones políticas deben estar, pues, hechas a medida y no ser genéricas.
Actualmente, los Estados miembros están recabando datos a nivel subregional y a nivel de centros educativos y clases, pero es necesaria una mejor coordinación, así como que estos datos estén disponibles y sean de dominio público.
Compilar datos desglosados geográficamente sobre desigualdad educativa puede ser una importante herramienta que favorezca el aumento de los poderes locales y la descentralización. Además, genera información localmente relevante y puede ayudar a que los centros educativos las organizaciones y los gobiernos a todos los niveles se comprometan en el desarrollo de políticas y planes basadas en datos reales.
Las desigualdades espaciales en oportunidades y resultados educativos ponen de manifiesto desigualdades todavía mayores. Por sí solas, las medidas políticas en educación no son suficientes. Es posible que las políticas que abordan las causas de la pobreza y de los aspectos relacionados sean más eficaces que las intervenciones políticas puramente educativas a la hora de influir en las pautas generales de la desigualdad educativa regional.
104
Véase la tabla 4.46, p. 150. 105
Véase la tabla 4.46, p. 150.
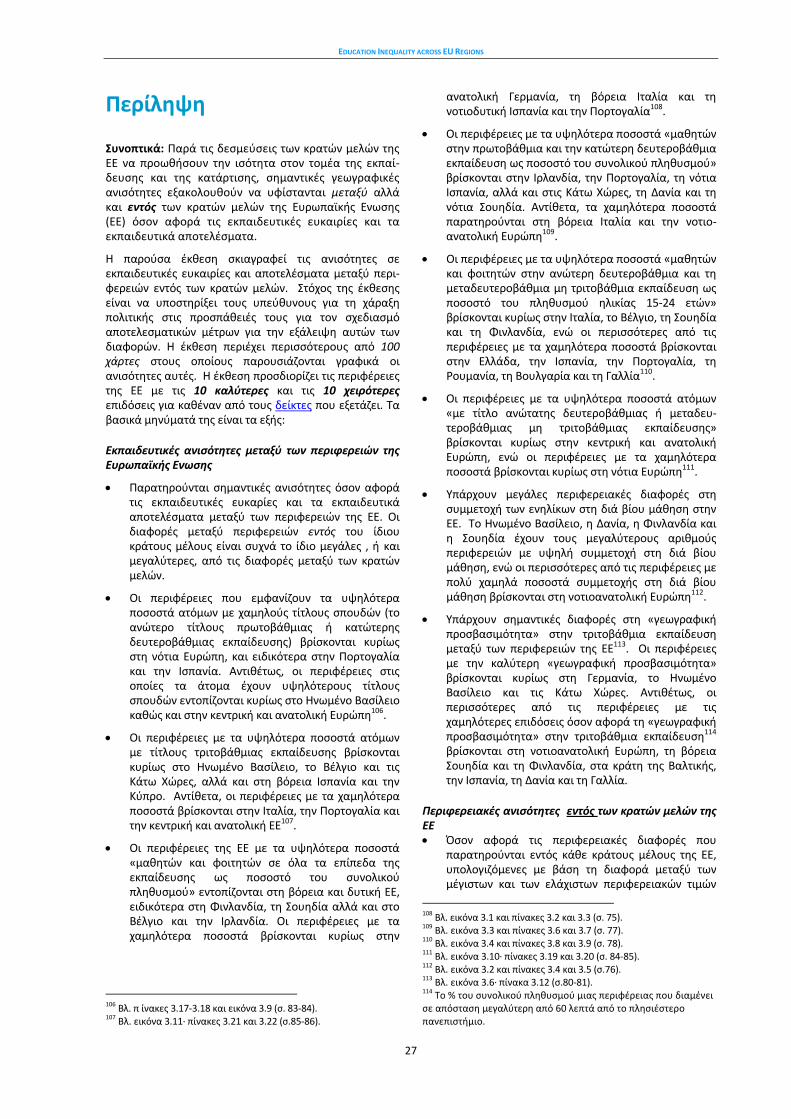
EDUCATION INEQUALITY ACROSS EU REGIONS
27
Περίληψη Συνοπτικά: Παρά τις δεσμεύσεις των κρατών μελών της ΕΕ να προωθήσουν την ισότητα στον τομέα της εκπαί-δευσης και της κατάρτισης, σημαντικές γεωγραφικές ανισότητες εξακολουθούν να υφίστανται μεταξύ αλλά και εντός των κρατών μελών της Ευρωπαϊκής Ενωσης (EE) όσον αφορά τις εκπαιδευτικές ευκαιρίες και τα εκπαιδευτικά αποτελέσματα.
Η παρούσα έκθεση σκιαγραφεί τις ανισότητες σε εκπαιδευτικές ευκαιρίες και αποτελέσματα μεταξύ περι-φερειών εντός των κρατών μελών. Στόχος της έκθεσης είναι να υποστηρίξει τους υπεύθυνους για τη χάραξη πολιτικής στις προσπάθειές τους για τον σχεδιασμό αποτελεσματικών μέτρων για την εξάλειψη αυτών των διαφορών. Η έκθεση περιέχει περισσότερους από 100 χάρτες στους οποίους παρουσιάζονται γραφικά οι ανισότητες αυτές. Η έκθεση προσδιορίζει τις περιφέρειες της ΕΕ με τις 10 καλύτερες και τις 10 χειρότερες επιδόσεις για καθέναν από τους δείκτες που εξετάζει. Τα βασικά μηνύματά της είναι τα εξής:
Εκπαιδευτικές ανισότητες μεταξύ των περιφερειών της Ευρωπαϊκής Ενωσης
Παρατηρούνται σημαντικές ανισότητες όσον αφορά τις εκπαιδευτικές ευκαρίες και τα εκπαιδευτικά αποτελέσματα μεταξύ των περιφερειών της ΕΕ. Οι διαφορές μεταξύ περιφερειών εντός του ίδιου κράτους μέλους είναι συχνά το ίδιο μεγάλες , ή και μεγαλύτερες, από τις διαφορές μεταξύ των κρατών μελών.
Οι περιφέρειες που εμφανίζουν τα υψηλότερα ποσοστά ατόμων με χαμηλούς τίτλους σπουδών (το ανώτερο τίτλους πρωτοβάθμιας ή κατώτερης δευτεροβάθμιας εκπαίδευσης) βρίσκονται κυρίως στη νότια Ευρώπη, και ειδικότερα στην Πορτογαλία και την Ισπανία. Αντιθέτως, οι περιφέρειες στις οποίες τα άτομα έχουν υψηλότερους τίτλους σπουδών εντοπίζονται κυρίως στο Ηνωμένο Βασίλειο καθώς και στην κεντρική και ανατολική Ευρώπη106.
Οι περιφέρειες με τα υψηλότερα ποσοστά ατόμων με τίτλους τριτοβάθμιας εκπαίδευσης βρίσκονται κυρίως στο Ηνωμένο Βασίλειο, το Βέλγιο και τις Κάτω Χώρες, αλλά και στη βόρεια Ισπανία και την Κύπρο. Αντίθετα, οι περιφέρειες με τα χαμηλότερα ποσοστά βρίσκονται στην Ιταλία, την Πορτογαλία και την κεντρική και ανατολική ΕΕ107.
Οι περιφέρειες της ΕΕ με τα υψηλότερα ποσοστά «μαθητών και φοιτητών σε όλα τα επίπεδα της εκπαίδευσης ως ποσοστό του συνολικού πληθυσμού» εντοπίζονται στη βόρεια και δυτική ΕΕ, ειδικότερα στη Φινλανδία, τη Σουηδία αλλά και στο Βέλγιο και την Ιρλανδία. Οι περιφέρειες με τα χαμηλότερα ποσοστά βρίσκονται κυρίως στην
106
Βλ. π ίνακες 3.17-3.18 και εικόνα 3.9 (σ. 83-84). 107
Βλ. εικόνα 3.11· πίνακες 3.21 και 3.22 (σ.85-86).
ανατολική Γερμανία, τη βόρεια Ιταλία και τη νοτιοδυτική Ισπανία και την Πορτογαλία108.
Οι περιφέρειες με τα υψηλότερα ποσοστά «μαθητών στην πρωτοβάθμια και την κατώτερη δευτεροβάθμια εκπαίδευση ως ποσοστό του συνολικού πληθυσμού» βρίσκονται στην Ιρλανδία, την Πορτογαλία, τη νότια Ισπανία, αλλά και στις Κάτω Χώρες, τη Δανία και τη νότια Σουηδία. Αντίθετα, τα χαμηλότερα ποσοστά παρατηρούνται στη βόρεια Ιταλία και την νοτιο-ανατολική Ευρώπη109.
Οι περιφέρειες με τα υψηλότερα ποσοστά «μαθητών και φοιτητών στην ανώτερη δευτεροβάθμια και τη μεταδευτεροβάθμια μη τριτοβάθμια εκπαίδευση ως ποσοστό του πληθυσμού ηλικίας 15-24 ετών» βρίσκονται κυρίως στην Ιταλία, το Βέλγιο, τη Σουηδία και τη Φινλανδία, ενώ οι περισσότερες από τις περιφέρειες με τα χαμηλότερα ποσοστά βρίσκονται στην Ελλάδα, την Ισπανία, την Πορτογαλία, τη Ρουμανία, τη Βουλγαρία και τη Γαλλία110.
Οι περιφέρειες με τα υψηλότερα ποσοστά ατόμων «με τίτλο ανώτατης δευτεροβάθμιας ή μεταδευ-τεροβάθμιας μη τριτοβάθμιας εκπαίδευσης» βρίσκονται κυρίως στην κεντρική και ανατολική Ευρώπη, ενώ οι περιφέρειες με τα χαμηλότερα ποσοστά βρίσκονται κυρίως στη νότια Ευρώπη111.
Υπάρχουν μεγάλες περιφερειακές διαφορές στη συμμετοχή των ενηλίκων στη διά βίου μάθηση στην ΕΕ. Το Ηνωμένο Βασίλειο, η Δανία, η Φινλανδία και η Σουηδία έχουν τους μεγαλύτερους αριθμούς περιφερειών με υψηλή συμμετοχή στη διά βίου μάθηση, ενώ οι περισσότερες από τις περιφέρειες με πολύ χαμηλά ποσοστά συμμετοχής στη διά βίου μάθηση βρίσκονται στη νοτιοανατολική Ευρώπη112.
Υπάρχουν σημαντικές διαφορές στη «γεωγραφική προσβασιμότητα» στην τριτοβάθμια εκπαίδευση μεταξύ των περιφερειών της ΕΕ113. Οι περιφέρειες με την καλύτερη «γεωγραφική προσβασιμότητα» βρίσκονται κυρίως στη Γερμανία, το Ηνωμένο Βασίλειο και τις Κάτω Χώρες. Αντιθέτως, οι περισσότερες από τις περιφέρειες με τις χαμηλότερες επιδόσεις όσον αφορά τη «γεωγραφική προσβασιμότητα» στην τριτοβάθμια εκπαίδευση114 βρίσκονται στη νοτιοανατολική Ευρώπη, τη βόρεια Σουηδία και τη Φινλανδία, στα κράτη της Βαλτικής, την Ισπανία, τη Δανία και τη Γαλλία.
Περιφερειακές ανισότητες εντός των κρατών μελών της ΕΕ Όσον αφορά τις περιφερειακές διαφορές που
παρατηρούνται εντός κάθε κράτους μέλους της ΕΕ, υπολογιζόμενες με βάση τη διαφορά μεταξύ των μέγιστων και των ελάχιστων περιφερειακών τιμών
108
Βλ. εικόνα 3.1 και πίνακες 3.2 και 3.3 (σ. 75). 109
Βλ. εικόνα 3.3 και πίνακες 3.6 και 3.7 (σ. 77). 110
Βλ. εικόνα 3.4 και πίνακες 3.8 και 3.9 (σ. 78). 111
Βλ. εικόνα 3.10· πίνακες 3.19 και 3.20 (σ. 84-85). 112
Βλ. εικόνα 3.2 και πίνακες 3.4 και 3.5 (σ.76). 113
Βλ. εικόνα 3.6· πίνακα 3.12 (σ.80-81). 114
Το % του συνολικού πληθυσμού μιας περιφέρειας που διαμένει σε απόσταση μεγαλύτερη από 60 λεπτά από το πλησιέστερο πανεπιστήμιο.
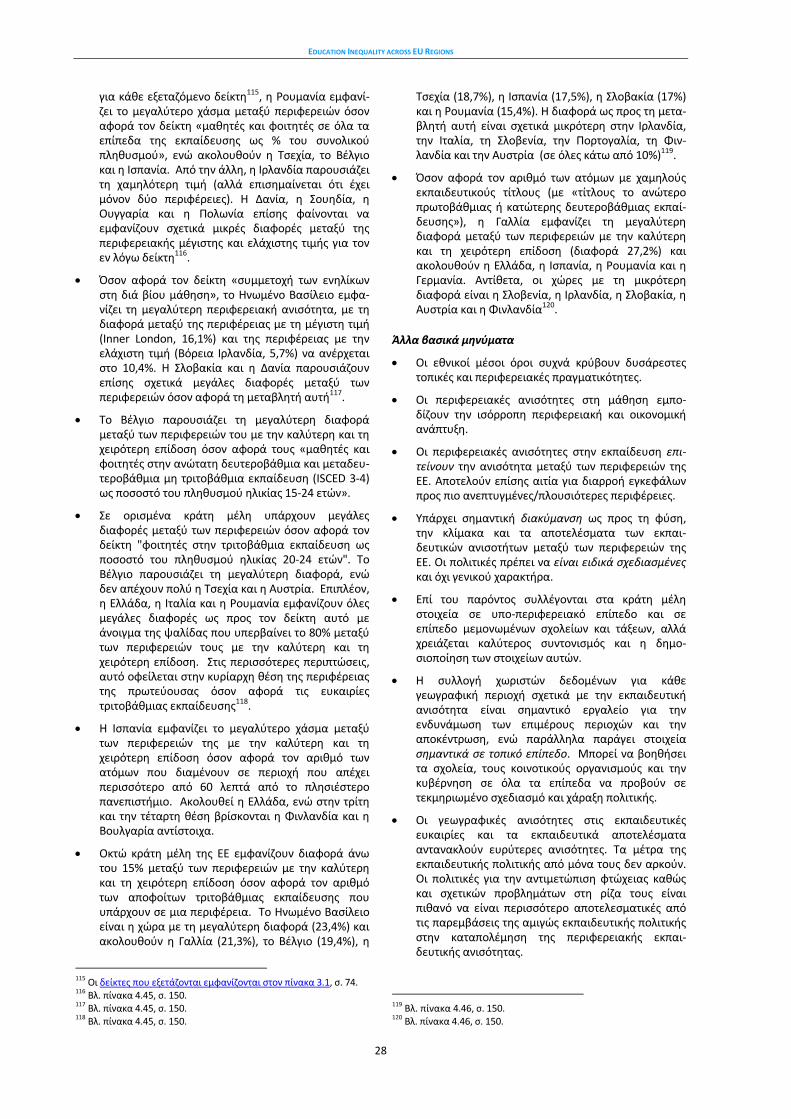
EDUCATION INEQUALITY ACROSS EU REGIONS
28
για κάθε εξεταζόμενο δείκτη115, η Ρουμανία εμφανί-ζει το μεγαλύτερο χάσμα μεταξύ περιφερειών όσον αφορά τον δείκτη «μαθητές και φοιτητές σε όλα τα επίπεδα της εκπαίδευσης ως % του συνολικού πληθυσμού», ενώ ακολουθούν η Τσεχία, το Βέλγιο και η Ισπανία. Από την άλλη, η Ιρλανδία παρουσιάζει τη χαμηλότερη τιμή (αλλά επισημαίνεται ότι έχει μόνον δύο περιφέρειες). Η Δανία, η Σουηδία, η Ουγγαρία και η Πολωνία επίσης φαίνονται να εμφανίζουν σχετικά μικρές διαφορές μεταξύ της περιφερειακής μέγιστης και ελάχιστης τιμής για τον εν λόγω δείκτη116.
Όσον αφορά τον δείκτη «συμμετοχή των ενηλίκων στη διά βίου μάθηση», το Ηνωμένο Βασίλειο εμφα-νίζει τη μεγαλύτερη περιφερειακή ανισότητα, με τη διαφορά μεταξύ της περιφέρειας με τη μέγιστη τιμή (Inner London, 16,1%) και της περιφέρειας με την ελάχιστη τιμή (Βόρεια Ιρλανδία, 5,7%) να ανέρχεται στο 10,4%. Η Σλοβακία και η Δανία παρουσιάζουν επίσης σχετικά μεγάλες διαφορές μεταξύ των περιφερειών όσον αφορά τη μεταβλητή αυτή117.
Το Βέλγιο παρουσιάζει τη μεγαλύτερη διαφορά μεταξύ των περιφερειών του με την καλύτερη και τη χειρότερη επίδοση όσον αφορά τους «μαθητές και φοιτητές στην ανώτατη δευτεροβάθμια και μεταδευ-τεροβάθμια μη τριτοβάθμια εκπαίδευση (ISCED 3-4) ως ποσοστό του πληθυσμού ηλικίας 15-24 ετών».
Σε ορισμένα κράτη μέλη υπάρχουν μεγάλες διαφορές μεταξύ των περιφερειών όσον αφορά τον δείκτη "φοιτητές στην τριτοβάθμια εκπαίδευση ως ποσοστό του πληθυσμού ηλικίας 20-24 ετών". Το Βέλγιο παρουσιάζει τη μεγαλύτερη διαφορά, ενώ δεν απέχουν πολύ η Τσεχία και η Αυστρία. Επιπλέον, η Ελλάδα, η Ιταλία και η Ρουμανία εμφανίζουν όλες μεγάλες διαφορές ως προς τον δείκτη αυτό με άνοιγμα της ψαλίδας που υπερβαίνει το 80% μεταξύ των περιφερειών τους με την καλύτερη και τη χειρότερη επίδοση. Στις περισσότερες περιπτώσεις, αυτό οφείλεται στην κυρίαρχη θέση της περιφέρειας της πρωτεύουσας όσον αφορά τις ευκαιρίες τριτοβάθμιας εκπαίδευσης118.
Η Ισπανία εμφανίζει το μεγαλύτερο χάσμα μεταξύ των περιφερειών της με την καλύτερη και τη χειρότερη επίδοση όσον αφορά τον αριθμό των ατόμων που διαμένουν σε περιοχή που απέχει περισσότερο από 60 λεπτά από το πλησιέστερο πανεπιστήμιο. Ακολουθεί η Ελλάδα, ενώ στην τρίτη και την τέταρτη θέση βρίσκονται η Φινλανδία και η Βουλγαρία αντίστοιχα.
Οκτώ κράτη μέλη της ΕΕ εμφανίζουν διαφορά άνω του 15% μεταξύ των περιφερειών με την καλύτερη και τη χειρότερη επίδοση όσον αφορά τον αριθμό των αποφοίτων τριτοβάθμιας εκπαίδευσης που υπάρχουν σε μια περιφέρεια. Το Ηνωμένο Βασίλειο είναι η χώρα με τη μεγαλύτερη διαφορά (23,4%) και ακολουθούν η Γαλλία (21,3%), το Βέλγιο (19,4%), η
115
Οι δείκτες που εξετάζονται εμφανίζονται στον πίνακα 3.1, σ. 74. 116
Βλ. πίνακα 4.45, σ. 150. 117
Βλ. πίνακα 4.45, σ. 150. 118
Βλ. πίνακα 4.45, σ. 150.
Τσεχία (18,7%), η Ισπανία (17,5%), η Σλοβακία (17%) και η Ρουμανία (15,4%). Η διαφορά ως προς τη μετα-βλητή αυτή είναι σχετικά μικρότερη στην Ιρλανδία, την Ιταλία, τη Σλοβενία, την Πορτογαλία, τη Φιν-λανδία και την Αυστρία (σε όλες κάτω από 10%)119.
Όσον αφορά τον αριθμό των ατόμων με χαμηλούς εκπαιδευτικούς τίτλους (με «τίτλους το ανώτερο πρωτοβάθμιας ή κατώτερης δευτεροβάθμιας εκπαί-δευσης»), η Γαλλία εμφανίζει τη μεγαλύτερη διαφορά μεταξύ των περιφερειών με την καλύτερη και τη χειρότερη επίδοση (διαφορά 27,2%) και ακολουθούν η Ελλάδα, η Ισπανία, η Ρουμανία και η Γερμανία. Αντίθετα, οι χώρες με τη μικρότερη διαφορά είναι η Σλοβενία, η Ιρλανδία, η Σλοβακία, η Αυστρία και η Φινλανδία120.
Άλλα βασικά μηνύματα
Οι εθνικοί μέσοι όροι συχνά κρύβουν δυσάρεστες τοπικές και περιφερειακές πραγματικότητες.
Οι περιφερειακές ανισότητες στη μάθηση εμπο-δίζουν την ισόρροπη περιφερειακή και οικονομική ανάπτυξη.
Οι περιφερειακές ανισότητες στην εκπαίδευση επι-τείνουν την ανισότητα μεταξύ των περιφερειών της ΕΕ. Αποτελούν επίσης αιτία για διαρροή εγκεφάλων προς πιο ανεπτυγμένες/πλουσιότερες περιφέρειες.
Υπάρχει σημαντική διακύμανση ως προς τη φύση, την κλίμακα και τα αποτελέσματα των εκπαι-δευτικών ανισοτήτων μεταξύ των περιφερειών της ΕΕ. Οι πολιτικές πρέπει να είναι ειδικά σχεδιασμένες και όχι γενικού χαρακτήρα.
Επί του παρόντος συλλέγονται στα κράτη μέλη στοιχεία σε υπο-περιφερειακό επίπεδο και σε επίπεδο μεμονωμένων σχολείων και τάξεων, αλλά χρειάζεται καλύτερος συντονισμός και η δημο-σιοποίηση των στοιχείων αυτών.
Η συλλογή χωριστών δεδομένων για κάθε γεωγραφική περιοχή σχετικά με την εκπαιδευτική ανισότητα είναι σημαντικό εργαλείο για την ενδυνάμωση των επιμέρους περιοχών και την αποκέντρωση, ενώ παράλληλα παράγει στοιχεία σημαντικά σε τοπικό επίπεδο. Mπορεί να βοηθήσει τα σχολεία, τους κοινοτικούς οργανισμούς και την κυβέρνηση σε όλα τα επίπεδα να προβούν σε τεκμηριωμένο σχεδιασμό και χάραξη πολιτικής.
Οι γεωγραφικές ανισότητες στις εκπαιδευτικές ευκαιρίες και τα εκπαιδευτικά αποτελέσματα αντανακλούν ευρύτερες ανισότητες. Τα μέτρα της εκπαιδευτικής πολιτικής από μόνα τους δεν αρκούν. Οι πολιτικές για την αντιμετώπιση φτώχειας καθώς και σχετικών προβλημάτων στη ρίζα τους είναι πιθανό να είναι περισσότερο αποτελεσματικές από τις παρεμβάσεις της αμιγώς εκπαιδευτικής πολιτικής στην καταπολέμηση της περιφερειακής εκπαι-δευτικής ανισότητας.
119
Βλ. πίνακα 4.46, σ. 150. 120
Βλ. πίνακα 4.46, σ. 150.
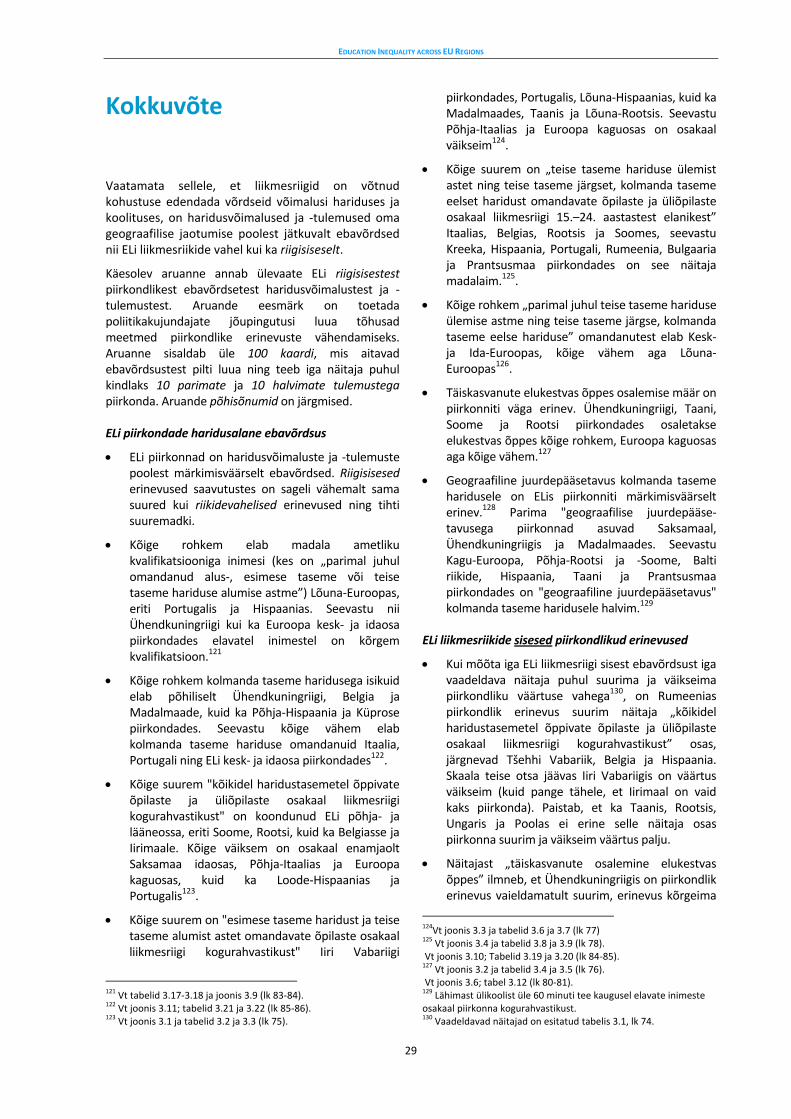
EDUCATION INEQUALITY ACROSS EU REGIONS
29
Kokkuvõte
Vaatamata sellele, et liikmesriigid on võtnud kohustuse edendada võrdseid võimalusi hariduses ja koolituses, on haridusvõimalused ja -tulemused oma geograafilise jaotumise poolest jätkuvalt ebavõrdsed nii ELi liikmesriikide vahel kui ka riigisiseselt.
Käesolev aruanne annab ülevaate ELi riigisisestest piirkondlikest ebavõrdsetest haridusvõimalustest ja -tulemustest. Aruande eesmärk on toetada poliitikakujundajate jõupingutusi luua tõhusad meetmed piirkondlike erinevuste vähendamiseks. Aruanne sisaldab üle 100 kaardi, mis aitavad ebavõrdsustest pilti luua ning teeb iga näitaja puhul kindlaks 10 parimate ja 10 halvimate tulemustega piirkonda. Aruande põhisõnumid on järgmised.
ELi piirkondade haridusalane ebavõrdsus
ELi piirkonnad on haridusvõimaluste ja -tulemuste poolest märkimisväärselt ebavõrdsed. Riigisisesed erinevused saavutustes on sageli vähemalt sama suured kui riikidevahelised erinevused ning tihti suuremadki.
Kõige rohkem elab madala ametliku kvalifikatsiooniga inimesi (kes on „parimal juhul omandanud alus-, esimese taseme või teise taseme hariduse alumise astme”) Lõuna-Euroopas, eriti Portugalis ja Hispaanias. Seevastu nii Ühendkuningriigi kui ka Euroopa kesk- ja idaosa piirkondades elavatel inimestel on kõrgem kvalifikatsioon.121
Kõige rohkem kolmanda taseme haridusega isikuid elab põhiliselt Ühendkuningriigi, Belgia ja Madalmaade, kuid ka Põhja-Hispaania ja Küprose piirkondades. Seevastu kõige vähem elab kolmanda taseme hariduse omandanuid Itaalia, Portugali ning ELi kesk- ja idaosa piirkondades122.
Kõige suurem "kõikidel haridustasemetel õppivate õpilaste ja üliõpilaste osakaal liikmesriigi kogurahvastikust" on koondunud ELi põhja- ja lääneossa, eriti Soome, Rootsi, kuid ka Belgiasse ja Iirimaale. Kõige väiksem on osakaal enamjaolt Saksamaa idaosas, Põhja-Itaalias ja Euroopa kaguosas, kuid ka Loode-Hispaanias ja Portugalis123.
Kõige suurem on "esimese taseme haridust ja teise taseme alumist astet omandavate õpilaste osakaal liikmesriigi kogurahvastikust" Iiri Vabariigi
121
Vt tabelid 3.17-3.18 ja joonis 3.9 (lk 83-84). 122
Vt joonis 3.11; tabelid 3.21 ja 3.22 (lk 85-86). 123
Vt joonis 3.1 ja tabelid 3.2 ja 3.3 (lk 75).
piirkondades, Portugalis, Lõuna-Hispaanias, kuid ka Madalmaades, Taanis ja Lõuna-Rootsis. Seevastu Põhja-Itaalias ja Euroopa kaguosas on osakaal väikseim124.
Kõige suurem on „teise taseme hariduse ülemist astet ning teise taseme järgset, kolmanda taseme eelset haridust omandavate õpilaste ja üliõpilaste osakaal liikmesriigi 15.–24. aastastest elanikest” Itaalias, Belgias, Rootsis ja Soomes, seevastu Kreeka, Hispaania, Portugali, Rumeenia, Bulgaaria ja Prantsusmaa piirkondades on see näitaja madalaim.125.
Kõige rohkem „parimal juhul teise taseme hariduse ülemise astme ning teise taseme järgse, kolmanda taseme eelse hariduse” omandanutest elab Kesk- ja Ida-Euroopas, kõige vähem aga Lõuna-Euroopas126.
Täiskasvanute elukestvas õppes osalemise määr on piirkonniti väga erinev. Ühendkuningriigi, Taani, Soome ja Rootsi piirkondades osaletakse elukestvas õppes kõige rohkem, Euroopa kaguosas aga kõige vähem.127
Geograafiline juurdepääsetavus kolmanda taseme haridusele on ELis piirkonniti märkimisväärselt erinev.128 Parima "geograafilise juurdepääse-tavusega piirkonnad asuvad Saksamaal, Ühendkuningriigis ja Madalmaades. Seevastu Kagu-Euroopa, Põhja-Rootsi ja -Soome, Balti riikide, Hispaania, Taani ja Prantsusmaa piirkondades on "geograafiline juurdepääsetavus" kolmanda taseme haridusele halvim.129
ELi liikmesriikide sisesed piirkondlikud erinevused
Kui mõõta iga ELi liikmesriigi sisest ebavõrdsust iga vaadeldava näitaja puhul suurima ja väikseima piirkondliku väärtuse vahega130, on Rumeenias piirkondlik erinevus suurim näitaja „kõikidel haridustasemetel õppivate õpilaste ja üliõpilaste osakaal liikmesriigi kogurahvastikust” osas, järgnevad Tšehhi Vabariik, Belgia ja Hispaania. Skaala teise otsa jäävas Iiri Vabariigis on väärtus väikseim (kuid pange tähele, et Iirimaal on vaid kaks piirkonda). Paistab, et ka Taanis, Rootsis, Ungaris ja Poolas ei erine selle näitaja osas piirkonna suurim ja väikseim väärtus palju.
Näitajast „täiskasvanute osalemine elukestvas õppes” ilmneb, et Ühendkuningriigis on piirkondlik erinevus vaieldamatult suurim, erinevus kõrgeima
124
Vt joonis 3.3 ja tabelid 3.6 ja 3.7 (lk 77) 125
Vt joonis 3.4 ja tabelid 3.8 ja 3.9 (lk 78). Vt joonis 3.10; Tabelid 3.19 ja 3.20 (lk 84-85). 127
Vt joonis 3.2 ja tabelid 3.4 ja 3.5 (lk 76). Vt joonis 3.6; tabel 3.12 (lk 80-81). 129
Lähimast ülikoolist üle 60 minuti tee kaugusel elavate inimeste osakaal piirkonna kogurahvastikust. 130
Vaadeldavad näitajad on esitatud tabelis 3.1, lk 74.
EDUCATION INEQUALITY ACROSS EU REGIONS
30
(Inner London, 16,1 %) ja madalaima väärtusega piirkonna (Põhja-Iirimaa, 5,7 %) vahel ulatub 10,4 %-ni. Ka Slovakkia ja Taani piirkondades on erinevus selle muutuja osas suur.131
Näitaja „teise taseme ülemise astme haridust või teise taseme järgset, kolmanda taseme eelset haridust (ISCED 3–4) omandavate õpilaste ja üliõpilaste osakaal 15.–24. aastastest elanikest” osas erinevad parimate ja halvimate tulemustega piirkonnad kõige rohkem Belgias.
Mõne liikmesriigi piirkonnad erinevad palju näitaja „kolmanda taseme haridust omandavate üliõpilaste osakaal 20.–24. aasta vanusest rahvastikust” osas. Erinevus on suurim Belgias, millele järgnevad tihedalt Tšehhi Vabariik ja Austria. Lisaks on selle näitaja osas suur erinevus ka Kreekas, Itaalias ja Rumeenias, kus erinevus parimate ja halvimate tulemustega piirkondade vahel ulatub 80 %-ni. Enamasti põhjustab suurt vahet see, et pealinna piirkonnas on kõige paremad võimalused kolmanda taseme hariduse omandamiseks.132
Erinevus parimate ja halvimate tulemustega piirkondade vahel selles osas, kui palju inimesi elab lähimast ülikoolist üle 60 minuti tee kaugusel, on suurim Hispaanias talle järgneb tihedalt Kreeka, kolmas on Soome ning neljas Bulgaaria.
Kaheksas ELi liikmesriigis erinevad parimate ja halvimate tulemustega piirkonnad kolmanda taseme hariduse omandanute arvu osas üle 15 %. Erinevus on suurim Ühendkuningriigis (23,4 %), järgnevad Prantsusmaa (21,3 %), Belgia (19,4 %), Tšehhi Vabariik (18,7 %), Hispaania (17,5 %), Slovakkia (17 %) ja Rumeenia (15,4 %). Selle näitaja osas on piirkondade vaheline erinevus suhteliselt väike Iirimaal, Itaalias, Sloveenias, Portugalis, Soomes ja Austrias (kõigis alla 10 %).133
Madala haridustasemega inimeste (kes on „parimal juhul omandanud alus-, esimese taseme või teise taseme hariduse alumise astme”) arvu osas on erinevus parimate ja halvimate tulemustega piirkondade vahel kõige suurem Prantsusmaal (27,2 %), järgnevad Kreeka, Hispaania, Rumeenia ja Saksamaa. Erinevus on aga väiksem Sloveenias, Iirimaal, Slovakkias, Austrias ja Soomes.134
Vt tabel 4.45, lk 150. Vt tabel 4.45, lk 150. Vt tabel 4.46, lk 150.
Vt tabel 4.46, lk 150.
Muud põhisõnumid
Riigi keskmine kätkeb endas tihti ebameeldivaid kohalikke ja piirkondlikke olusid.
Piirkondlikud erinevused õpivaldkonnas pidurdavad piirkondlikku arengut ja majanduskasvu.
Piirkondlikud erinevused haridusvaldkonnas süvendavad ELi piirkondade vahelist ebavõrdsust. Samuti hoogustab see ajude äravoolu arenenumatesse/rikkamatesse piirkondadesse.
Haridusalase ebavõrdsuse olemus, ulatus ja mõju varieeruvad ELi piirkondade lõikes silmatorkavalt. Üldiste lahenduste asemel peavad poliitilised lahendused lähtuma konkreetsetest oludest.
Liikmesriikides kogutakse praegu andmeid allpiirkondlikul ning üksikute koolide ja klasside tasandil, kuid tegevust oleks vaja paremini koordineerida ning andmed avalikustada.
Haridusalase ebavõrdsuse kohta geograafiliselt liigendatud andmete kogumisest võiks kasu olla kohaliku mõjuvõimu suurendamisel ja detsentraliseerimisel. Sel viisil kogutud teave on oluline kohalikul tasandil. Andmed võivad koolidele, kogukondlikele organisatsioonidele ja kõikide tasandite valitsusasutustele tõenduspõhisel planeerimisel ja poliitika väljatöötamisel toeks olla.
Piirkondlikud erinevused haridusvõimalustes ja -tulemustes viitavad laiemale ebavõrdsusele. Ainult hariduspoliitika meetmetest ei piisa. Üldiseid piirkondlikke haridusalaseid tavasid mõjutab üksnes haridust käsitleva poliitika asemel tõenäoliselt paremini poliitika, millega võideldakse vaesuse ja sellega seotud ebasoodsa olukorraga juba nende tekkimise ajal.
EDUCATION INEQUALITY ACROSS EU REGIONS
31
Tiivistelmä
Asia pähkinänkuoressa: Vaikka EU:n jäsenvaltiot ovat sitoutuneet edistämään koulutuksen tasapuolisuutta, koulutusmahdollisuuksien ja oppimistulosten välillä on vielä suuria maantieteellisiä eroja paitsi jäsenvaltioiden välillä myös niiden sisällä.
Tässä raportissa tarkastellaan kansallisten alueiden koulutusmahdollisuuksien ja tulosten eriarvoisuutta EU:ssa. Sen tavoitteena on tukea päätöksentekijöiden pyrkimyksiä suunnitella tehokkaita toimenpiteitä näiden erojen korjaamiseksi. Raportti sisältää yli 100 karttaa, jotka havainnollistavat eriarvoisuuksia. Siinä määritetään 10 parhaiten ja 10 huonoiten sijoittunutta EU-aluetta kunkin tutkitun indikaattorin osalta. Tärkeimmät havainnot ovat:
Koulutuksen eriarvoisuus EU:n alueilla
EU:n alueiden väliset erot koulutusmahdollisuuksien ja oppimistulosten osalta ovat huomattavat. Oppimistulosten erot kansallisessa vertailussa ovat usein vähintään yhtä suuret kuin kansainvälisessä vertailussa esiin tulevat erot.
Eniten sellaisia ihmisiä, joilla on vain perusasteen koulutus ("enintään esiasteen, alemman perusasteen tai ylemmän perusasteen koulutus"), on Etelä-Euroopan ja erityisesti Portugalin ja Espanjan alueilla. Sen sijaan alueet, joilla ihmisillä on korkeampi koulutus, sijaitsevat useimmiten Yhdistyneessä kuningaskunnassa sekä Keski- ja Itä-Euroopassa135.
Alueet, joilla on eniten korkea-asteen koulutuksen saaneita ihmisiä sijaitsevat lähinnä Yhdistyneessä kuningaskunnassa, Belgiassa ja Alankomaissa sekä Pohjois-Espanjassa ja Kyproksella. Sen sijaan alueet, joilla on vähiten korkea-asteen koulutuksen saaneita ihmisiä, sijaitsevat Italiassa, Portugalissa ja EU:n keski- ja itäosissa136.
Alueet, joilla on eniten "oppilaita ja opiskelijoita kaikilla koulutustasoilla suhteessa kokonaisväestöön" sijaitsevat lähinnä EU:n pohjois- ja länsiosissa, erityisesti Suomessa ja Ruotsissa sekä Belgiassa ja Irlannissa. Alueet, joilla on vähiten oppilaita ja opiskelijoita kaikilla koulutustasolla suhteessa kokonaisväestöön, sijaitsevat pääasiassa Saksan itäosassa, Pohjois-Italiassa ja Kaakkois-Euroopassa sekä Luoteis-Espanjassa ja Portugalissa137.
135
Ks. taulukot 3.17–3.18 ja kuvio 3.9 (s. 83–84). 136
Ks. kuvio 3.11 ja taulukot 3.21 ja 3.22 (s.85–86). 137
Ks. kuvio 3.1 ja taulukot 3.2 ja 3.3 (s. 75).
Eniten "oppilaita alemman perusasteen ja ylemmän perusasteen koulutuksessa suhteessa kokonaisväestöön" on Irlannin, Portugalin ja Etelä-Espanjan alueilla sekä Alankomaiden, Tanskan ja Etelä-Ruotsin alueilla. Vähiten oppilaita perusasteen koulutuksessa suhteessa kokonaisväestöön on sen sijaan Pohjois-Italiassa ja Kaakkois-Euroopassa138.
Alueet, joilla on eniten "oppilaita ja opiskelijoita keskiasteen koulutuksessa ja keskiasteen jälkeisessä koulutuksessa, joka ei ole korkea-asteen koulutusta, prosenttiosuutena 15–24-vuotiaista", sijaitsevat lähinnä Italiassa, Belgiassa, Ruotsissa ja Suomessa, kun taas suurin osa alueista, joilla osuudet ovat alhaisimmat, sijaitsevat Kreikassa, Espanjassa, Portugalissa, Romaniassa, Bulgariassa ja Ranskassa139.
Eniten ihmisiä, joilla on "enintään keskiasteen koulutus tai keskiasteen jälkeinen koulutus, joka ei ole korkea-asteen koulutusta", on lähinnä Keski- ja Itä-Euroopan alueilla, kun taas alueet, joilla määrät ovat alhaisimmat, sijaitsevat useimmiten Etelä-Euroopassa140.
Alueelliset erot aikuisten osallistumisessa elinikäiseen oppimiseen ovat EU:ssa suuret. Yhdistyneessä kuningaskunnassa, Tanskassa, Suomessa ja Ruotsissa on eniten alueita, joilla osallistuminen elinikäiseen oppimiseen on aktiivista, kun taas useimmat alueet, joilla osallistuminen elinikäiseen oppimiseen on hyvin vähäistä, sijaitsevat Kaakkois-Euroopassa141.
Korkea-asteen koulutuksen maantieteellisessä saavutettavuudessa on suuria eroja EU:n eri alueiden välillä142. Alueet, joilla maantieteellinen saavutettavuus on parhainta, sijaitsevat pääasiassa Saksassa, Yhdistyneessä kuningaskunnassa ja Alankomaissa. Sen sijaan useimmat alueet, joilla korkea-asteen koulutuksen maantieteellinen saavutettavuus143 on heikointa, sijaitsevat Kaakkois-Euroopassa, Pohjois-Ruotsissa, Pohjois-Suomessa, Baltian maissa, Espanjassa, Tanskassa ja Ranskassa.
Alueelliset erot EU:n jäsenvaltioiden sisällä
Kun tarkastellaan alueellisia eroja kunkin EU:n jäsenvaltion sisällä (mitattuna suurimpien ja pienimpien alueellisten arvojen välisinä eroina kunkin tutkitun indikaattorin144 osalta), käy ilmi
138
Ks. kuvio 3.3 ja taulukot 3.6 ja 3.7 (s. 77). 139
Ks. kuvio 3.4 ja taulukot 3.8 ja 3.9 (s. 78). 140
Ks. kuvio 3.10 ja taulukot 3.19 ja 3.20 (s. 84–85). 141
Ks. kuvio 3.2 ja taulukot 3.4 ja 3.5 (s.76). 142
Ks. kuvio 3.6 ja taulukko 3.12 (s.80–81). 143
Prosenttiosuus alueen kokonaisväestöstä, joka asuu yli 60 minuutin matkan päässä lähimmästä yliopistosta. 144
Tutkitut indikaattorit esitetään taulukossa 3.1, s. 74.
EDUCATION INEQUALITY ACROSS EU REGIONS
32
että indikaattorin "oppilaita ja opiskelijoita kaikilla koulutustasoilla suhteessa kokonaisväestöön" alueelliset erot ovat suurimmat Romaniassa. Heti perässä tulevat Tšekki, Belgia ja Espanja. Toisaalta pienin arvo mitattiin Irlannissa (jossa alueita on tosin vain kaksi). Myös Tanskassa, Ruotsissa, Unkarissa ja Puolassa kyseisen indikaattorin suurimman ja pienimmän arvon väliset erot vaikuttavat suhteellisen vähäisiltä145.
Indikaattorin "aikuisten osallistuminen elinikäiseen oppimiseen" osalta alueelliset erot ovat selvästi suurimmat Yhdistyneessä kuningaskunnassa, jossa suurimman (Inner London, 16,4 %) ja pienimmän (Pohjois-Irlanti, 5,7 %) arvon välinen ero on 10,4 %. Myös Slovakiassa ja Tanskassa alueelliset erot ovat suhteellisen suuria tämän muuttujan osalta146.
Indikaattorin “oppilaita ja opiskelijoita keskiasteen koulutuksessa ja keskiasteen jälkeisessä koulutuksessa, joka ei ole korkea-asteen koulutusta, (ISCED 3–4) prosenttiosuutena 15–24-vuotiaista” osalta ero alueiden suurimman ja pienimmän arvon välillä on suurin Belgiassa.
Joissakin jäsenvaltioissa alueiden väliset erot ovat suuret indikaattorissa ”opiskelijoita korkea-asteen koulutuksessa, prosenttiosuutena 15–24-vuotiaista”. Ero on suurin Belgiassa, ja heti sen jälkeen tulevat Tšekki ja Itävalta. Ero on suuri tämän indikaattorin osalta myös Kreikassa, Italiassa ja Romaniassa, joissa haarukka alueiden parhaimman ja heikoimman arvon välillä on yli 80 %. Useimmissa tapauksissa tämä johtuu siitä, että maan pääkaupunkiseutu on hallitsevassa asemassa korkea-asteen koulutuksen mahdollisuuksien osalta147.
Espanjassa on suurin ero alueiden suurimman ja pienimmän arvon välillä sen suhteen, kuinka monta ihmistä asuu yli 60 minuutin matkan päässä lähimmästä yliopistosta, ja sen perässä tulee heti Kreikka Suomen ollessa kolmannella ja Bulgarian neljännellä sijalla.
Kahdeksassa EU:n jäsenvaltiossa on yli 15 prosentin ero niiden alueiden välillä, joilla asuu eniten ja vähiten korkeakoulututkinnon suorittaneita. Ero on suurin Yhdistyneessä kuningaskunnassa (23,4 %), ja sen jälkeen tulevat Ranska (21,3 %), Belgia (19,4 %), Tšekki (18,7 %), Espanja (17,5 %), Slovakia (17 %) ja Romania (15,4 %). Ero tämän muuttujan osalta on suhteellisen vähäinen Irlannissa, Italiassa, Sloveniassa, Portugalissa, Suomessa ja Itävallassa (kaikissa alle 10 %)148.
145
Ks. taulukko 4.45, s. 150. 146
Ks. taulukko 4.45, s. 150. 147
Ks. taulukko 4.45, s. 150. 148
Ks. taulukko 4.46, s. 150.
Kun tarkastellaan niiden ihmisten määrää, joilla on vain perusasteen koulutus ("enintään esiasteen, alemman perusasteen tai ylemmän perusasteen koulutus"), alueiden suurimman ja pienimmän arvon välinen ero on suurin Ranskassa (27,2 %), ja sen jälkeen Kreikassa, Espanjassa, Romaniassa ja Saksassa. Sen sijaan ero on pienin Sloveniassa, Irlannissa, Slovakiassa, Itävallassa ja Suomessa149.
Muut keskeiset havainnot
Kansalliset keskiarvot kätkevät usein ikäviä paikallisia ja alueellisia tosiasioita.
Oppimisen alueelliset erot ovat tasapainoisen alueellisen kehityksen ja talouskasvun esteenä.
Koulutuksen alueelliset erot vahvistavat EU:n alueiden eriarvoisuutta. Erot myös edesauttavat osaamisen siirtymistä (aivovientiä) kehittyneemmille ja rikkaammille alueille.
Koulutuksen eriarvoisuuden luonne, mittakaava ja vaikutukset ovat hyvin erilaisia eri EU:n alueilla. Siksi ratkaisumallit on sovitettava kutakin aluetta varten sen sijaan, että ne olisivat yleisiä.
Jäsenvaltiot keräävät tällä hetkellä tietoja aluetasoa alemmalta tasolta sekä yksittäisten koulujen ja luokkahuoneiden tasolta, mutta toimintaa on koordinoitava paremmin ja tiedot on asetettava julkisesti saataville.
Koulutuksen eriarvoisuutta koskevien maantieteellisesti eriteltyjen tietojen kerääminen voi olla tärkeä väline paikallisten vaikutusmahdollisuuksien lisäämiseksi ja hallinnon hajauttamiseksi. Siten saadaan paikallisesti hyödynnettävissä olevia tietoja. Tiedot voivat auttaa kouluja, yhteisöjen elimiä ja kaikkia hallintotasoja sitoutumaan näyttöön perustuvaan suunnitteluun ja päätöksentekoon.
Koulutusmahdollisuuksien alueelliset erot ja oppimistulokset antavat viitteitä myös laajemmasta eriarvoisuudesta. Koulutuspolitiikan toimenpiteet yksin eivät riitä. Toimintatavat, joilla puututaan köyhyyteen ja huono-osaisuuteen liittyviin näkökohtiin syvemmällä tasolla, vaikuttavat alueellisiin koulutusrakenteisiin todennäköisesti paremmin kuin puhtaasti koulutuspoliittiset toimet.
149
Ks. taulukko 4.46, s. 150.
EDUCATION INEQUALITY ACROSS EU REGIONS
33
Összefoglaló
Röviden: Annak ellenére, hogy az uniós tagállamok elkötelezték magukat amellett, hogy az oktatásban és a képzésben előmozdítják a méltányosságot, továbbra is nagy földrajzi egyenlőtlenségek mutathatók ki az oktatási lehetőségek és a tanulási eredmények terén mind a tagállamok között, mind azokon belül.
A jelentés felvázolja az oktatási lehetőségek és a tanulási eredmények terén a egyes uniós tagállamokon belül a régiók között fennálló egyenlőtlenségeket. Célja, hogy támogassa a politikai döntéshozókat arra irányuló erőfeszítéseikben, hogy e különbségek kiküszöbölése érdekében hatékony intézkedéseket hozzanak. A jelentés több mint 100 térképet tartalmaz, melyek vizuálisan is megjelenítik e különbségeket. A térképek bemutatják, hogy az egyes vizsgált mutatókat tekintve mely uniós régiók tartoznak a tíz legmagasabb, illetve legalacsonyabb értéket mutató régió közé. A jelentés legfontosabb üzenetei a következők:
Oktatási egyenlőtlenségek az EU régióiban
Az uniós régiók között jelentős egyenlőtlenségek mutathatók ki az oktatási lehetőségek és a tanulási eredmények terén. A tagállamokon belüli teljesítménybeli különbségek gyakran legalább olyan nagyok – sőt, időnként nagyobbak –, mint a tagállamok közöttiek.
Azok a régiók, ahol az alacsony formális képzettséggel rendelkezők (legfeljebb iskola előtti nevelésben részesülő, az általános iskola alsó vagy felső tagozatát befejező személyek) aránya a legmagasabb, elsősorban a dél-európai – különösen a portugáliai és spanyolországi – régiók közül kerülnek ki. Ezzel szemben főként az Egyesült Királyság, valamint Közép- és Kelet-Európa egyes régióira jellemző a magasabb képzettséggel rendelkezők nagyobb aránya150.
A felsőfokú végzettséggel rendelkezők aránya jellemzően az Egyesült Királyság, Belgium, Hollandia egyes régióiban, valamint Észak-Spanyolországban és Cipruson a legmagasabb. Ezzel szemben ez az arány egyes olaszországi, portugáliai, valamint közép- és kelet-európai régiókban a legalacsonyabb151.
Az EU északi és nyugati tagállamaiban – elsősorban Finnországban, Svédországban, valamint Belgiumban és Dániában – koncentrálódnak azok a régiók, ahol a teljes lakosságra kivetítve a legmagasabb a tanulók és hallgatók aránya az oktatás valamennyi szintjén. Ez az arány többnyire Kelet-Németország, Észak-Olaszország és Délkelet-Európa, valamint Délnyugat-
150
Lásd: 3.17-3.18. táblázat és 3.9. ábra (83–84. oldal). 151
Lásd: 3.11. ábra; 3.21. és 3.22. táblázat (85–86. oldal).
Spanyolország és Portugália egyes régióiban a legalacsonyabb152.
A teljes lakosságra kivetítve az általános iskola alsó vagy felső tagozatán tanulók aránya az Ír Köztársaság, Portugália, Dél-Spanyolország, Hollandia, Dánia és Dél-Svédország egyes régióiban a legmagasabb. Ezzel szemben a legalacsonyabb arány Észak-Olaszországban és Délkelet-Európában figyelhető meg153.
A középfokú oktatásban és a nem felsőfokú posztszekunder képzésben részt vevő tanulók aránya a 15-24 évesekre vetítve főként Olaszország, Belgium, Svédország és Finnország egyes régióiban a legmagasabb, míg Görögország, Spanyolország, Portugália, Románia, Bulgária és Franciaország egyes régióiban a legalacsonyabb154.
A legfeljebb középfokú oktatásban és a nem felsőfokú posztszekunder képzésben képesítést szerző személyek aránya többnyire közép-és kelet-európai régiókban a legmagasabb, míg a legalacsonyabb arány elsősorban dél-európai régiókban mutatható ki155.
Az egész életen át tartó tanulásban részt vevő felnőttek arányát tekintve az EU-n belül jelentős regionális különbségek mutathatók ki. A legtöbb régió, ahol az egész életen át tartó tanulásban való részvétel kiemelkedően magas, az Egyesült Királyságban, Dániában, Finnországban és Svédországban (található), míg a legtöbb olyan régió, ahol az egész életen át tartó tanulásban részt vevők aránya kifejezetten alacsony, Délkelet-Európában van156.
Az uniós régiók között jelentős különbségek adódnak a felsőoktatás földrajzi elérhetősége terén157. Elsősorban Németországban, az Egyesült Királyságban és Hollandiában találhatók a legkedvezőbb földrajzi elérhetőséggel rendelkező régiók. Ezzel szemben a felsőoktatáshoz való földrajzi hozzáférhetőség terén a legrosszabb eredményekkel rendelkező régiók többsége158 Délkelet-Európában, Svédország és Finnország északi részein, a balti államokban, Spanyolországban, Dániában és Franciaországban található.
Regionális különbségek az uniós tagállamokon belül
Ha megvizsgáljuk az egyes tagállamokon belüli, az egyes vizsgált mutatók legnagyobb és legkisebb regionális értékei közötti különbség szerint mért regionális egyenlőtlenségeket159, a teljes lakosságra
152
Lásd: 3.1. ábra, valamint 3.2. és 3.3. táblázat (75. oldal). 153
Lásd: 3.3. ábra, valamint 3.6. és 3.7. táblázat (77. oldal). 154
Lásd: 3.4. ábra, valamint 3.8. és 3.9. táblázat (78. oldal). 155
Lásd: 3.10. ábra; 3.19. és 3.20. táblázat (84–85. o.). 156
Lásd 3.2. ábra, 3.4. és 3.5. táblázat (76. o.). 157
Lásd: 3.6. ábra; 3.12. táblázat (80–81. o.). 158
Az adott régió összlakosságának az a hányada, amely a legközelebbi egyetemtől több mint hatvan percre lakik. 159
A vizsgált mutatókat a 3.1. táblázat mutatja (74. o.).
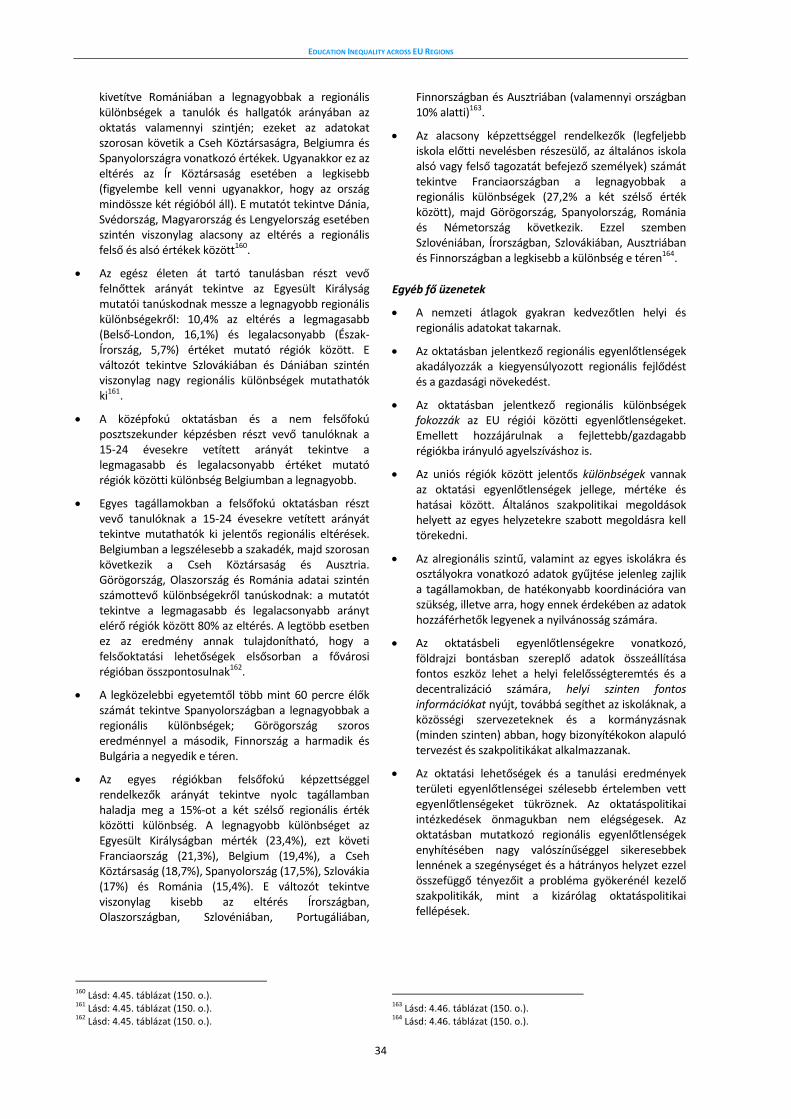
EDUCATION INEQUALITY ACROSS EU REGIONS
34
kivetítve Romániában a legnagyobbak a regionális különbségek a tanulók és hallgatók arányában az oktatás valamennyi szintjén; ezeket az adatokat szorosan követik a Cseh Köztársaságra, Belgiumra és Spanyolországra vonatkozó értékek. Ugyanakkor ez az eltérés az Ír Köztársaság esetében a legkisebb (figyelembe kell venni ugyanakkor, hogy az ország mindössze két régióból áll). E mutatót tekintve Dánia, Svédország, Magyarország és Lengyelország esetében szintén viszonylag alacsony az eltérés a regionális felső és alsó értékek között160.
Az egész életen át tartó tanulásban részt vevő felnőttek arányát tekintve az Egyesült Királyság mutatói tanúskodnak messze a legnagyobb regionális különbségekről: 10,4% az eltérés a legmagasabb (Belső-London, 16,1%) és legalacsonyabb (Észak-Írország, 5,7%) értéket mutató régiók között. E változót tekintve Szlovákiában és Dániában szintén viszonylag nagy regionális különbségek mutathatók ki161.
A középfokú oktatásban és a nem felsőfokú posztszekunder képzésben részt vevő tanulóknak a 15-24 évesekre vetített arányát tekintve a legmagasabb és legalacsonyabb értéket mutató régiók közötti különbség Belgiumban a legnagyobb.
Egyes tagállamokban a felsőfokú oktatásban részt vevő tanulóknak a 15-24 évesekre vetített arányát tekintve mutathatók ki jelentős regionális eltérések. Belgiumban a legszélesebb a szakadék, majd szorosan következik a Cseh Köztársaság és Ausztria. Görögország, Olaszország és Románia adatai szintén számottevő különbségekről tanúskodnak: a mutatót tekintve a legmagasabb és legalacsonyabb arányt elérő régiók között 80% az eltérés. A legtöbb esetben ez az eredmény annak tulajdonítható, hogy a felsőoktatási lehetőségek elsősorban a fővárosi régióban összpontosulnak162.
A legközelebbi egyetemtől több mint 60 percre élők számát tekintve Spanyolországban a legnagyobbak a regionális különbségek; Görögország szoros eredménnyel a második, Finnország a harmadik és Bulgária a negyedik e téren.
Az egyes régiókban felsőfokú képzettséggel rendelkezők arányát tekintve nyolc tagállamban haladja meg a 15%-ot a két szélső regionális érték közötti különbség. A legnagyobb különbséget az Egyesült Királyságban mérték (23,4%), ezt követi Franciaország (21,3%), Belgium (19,4%), a Cseh Köztársaság (18,7%), Spanyolország (17,5%), Szlovákia (17%) és Románia (15,4%). E változót tekintve viszonylag kisebb az eltérés Írországban, Olaszországban, Szlovéniában, Portugáliában,
160
Lásd: 4.45. táblázat (150. o.). 161
Lásd: 4.45. táblázat (150. o.). 162
Lásd: 4.45. táblázat (150. o.).
Finnországban és Ausztriában (valamennyi országban 10% alatti)163.
Az alacsony képzettséggel rendelkezők (legfeljebb iskola előtti nevelésben részesülő, az általános iskola alsó vagy felső tagozatát befejező személyek) számát tekintve Franciaországban a legnagyobbak a regionális különbségek (27,2% a két szélső érték között), majd Görögország, Spanyolország, Románia és Németország következik. Ezzel szemben Szlovéniában, Írországban, Szlovákiában, Ausztriában és Finnországban a legkisebb a különbség e téren164.
Egyéb fő üzenetek
A nemzeti átlagok gyakran kedvezőtlen helyi és regionális adatokat takarnak.
Az oktatásban jelentkező regionális egyenlőtlenségek akadályozzák a kiegyensúlyozott regionális fejlődést és a gazdasági növekedést.
Az oktatásban jelentkező regionális különbségek fokozzák az EU régiói közötti egyenlőtlenségeket. Emellett hozzájárulnak a fejlettebb/gazdagabb régiókba irányuló agyelszíváshoz is.
Az uniós régiók között jelentős különbségek vannak az oktatási egyenlőtlenségek jellege, mértéke és hatásai között. Általános szakpolitikai megoldások helyett az egyes helyzetekre szabott megoldásra kell törekedni.
Az alregionális szintű, valamint az egyes iskolákra és osztályokra vonatkozó adatok gyűjtése jelenleg zajlik a tagállamokban, de hatékonyabb koordinációra van szükség, illetve arra, hogy ennek érdekében az adatok hozzáférhetők legyenek a nyilvánosság számára.
Az oktatásbeli egyenlőtlenségekre vonatkozó, földrajzi bontásban szereplő adatok összeállítása fontos eszköz lehet a helyi felelősségteremtés és a decentralizáció számára, helyi szinten fontos információkat nyújt, továbbá segíthet az iskoláknak, a közösségi szervezeteknek és a kormányzásnak (minden szinten) abban, hogy bizonyítékokon alapuló tervezést és szakpolitikákat alkalmazzanak.
Az oktatási lehetőségek és a tanulási eredmények területi egyenlőtlenségei szélesebb értelemben vett egyenlőtlenségeket tükröznek. Az oktatáspolitikai intézkedések önmagukban nem elégségesek. Az oktatásban mutatkozó regionális egyenlőtlenségek enyhítésében nagy valószínűséggel sikeresebbek lennének a szegénységet és a hátrányos helyzet ezzel összefüggő tényezőit a probléma gyökerénél kezelő szakpolitikák, mint a kizárólag oktatáspolitikai fellépések.
163
Lásd: 4.46. táblázat (150. o.). 164
Lásd: 4.46. táblázat (150. o.).
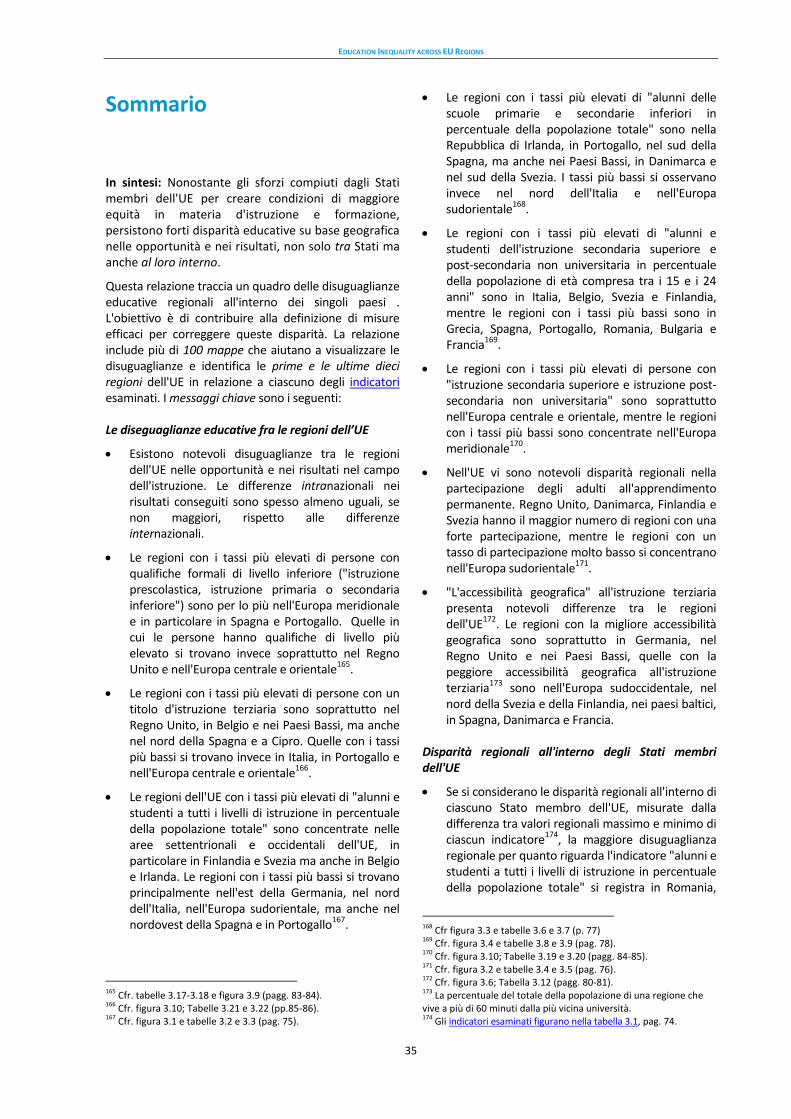
EDUCATION INEQUALITY ACROSS EU REGIONS
35
Sommario
In sintesi: Nonostante gli sforzi compiuti dagli Stati membri dell'UE per creare condizioni di maggiore equità in materia d'istruzione e formazione, persistono forti disparità educative su base geografica nelle opportunità e nei risultati, non solo tra Stati ma anche al loro interno.
Questa relazione traccia un quadro delle disuguaglianze educative regionali all'interno dei singoli paesi . L'obiettivo è di contribuire alla definizione di misure efficaci per correggere queste disparità. La relazione include più di 100 mappe che aiutano a visualizzare le disuguaglianze e identifica le prime e le ultime dieci regioni dell'UE in relazione a ciascuno degli indicatori esaminati. I messaggi chiave sono i seguenti:
Le diseguaglianze educative fra le regioni dell’UE
Esistono notevoli disuguaglianze tra le regioni dell'UE nelle opportunità e nei risultati nel campo dell'istruzione. Le differenze intranazionali nei risultati conseguiti sono spesso almeno uguali, se non maggiori, rispetto alle differenze internazionali.
Le regioni con i tassi più elevati di persone con qualifiche formali di livello inferiore ("istruzione prescolastica, istruzione primaria o secondaria inferiore") sono per lo più nell'Europa meridionale e in particolare in Spagna e Portogallo. Quelle in cui le persone hanno qualifiche di livello più elevato si trovano invece soprattutto nel Regno Unito e nell'Europa centrale e orientale165.
Le regioni con i tassi più elevati di persone con un titolo d'istruzione terziaria sono soprattutto nel Regno Unito, in Belgio e nei Paesi Bassi, ma anche nel nord della Spagna e a Cipro. Quelle con i tassi più bassi si trovano invece in Italia, in Portogallo e nell'Europa centrale e orientale166.
Le regioni dell'UE con i tassi più elevati di "alunni e studenti a tutti i livelli di istruzione in percentuale della popolazione totale" sono concentrate nelle aree settentrionali e occidentali dell'UE, in particolare in Finlandia e Svezia ma anche in Belgio e Irlanda. Le regioni con i tassi più bassi si trovano principalmente nell'est della Germania, nel nord dell'Italia, nell'Europa sudorientale, ma anche nel nordovest della Spagna e in Portogallo167.
165
Cfr. tabelle 3.17-3.18 e figura 3.9 (pagg. 83-84). 166
Cfr. figura 3.10; Tabelle 3.21 e 3.22 (pp.85-86). 167
Cfr. figura 3.1 e tabelle 3.2 e 3.3 (pag. 75).
Le regioni con i tassi più elevati di "alunni delle scuole primarie e secondarie inferiori in percentuale della popolazione totale" sono nella Repubblica di Irlanda, in Portogallo, nel sud della Spagna, ma anche nei Paesi Bassi, in Danimarca e nel sud della Svezia. I tassi più bassi si osservano invece nel nord dell'Italia e nell'Europa sudorientale168.
Le regioni con i tassi più elevati di "alunni e studenti dell'istruzione secondaria superiore e post-secondaria non universitaria in percentuale della popolazione di età compresa tra i 15 e i 24 anni" sono in Italia, Belgio, Svezia e Finlandia, mentre le regioni con i tassi più bassi sono in Grecia, Spagna, Portogallo, Romania, Bulgaria e Francia169.
Le regioni con i tassi più elevati di persone con "istruzione secondaria superiore e istruzione post-secondaria non universitaria" sono soprattutto nell'Europa centrale e orientale, mentre le regioni con i tassi più bassi sono concentrate nell'Europa meridionale170.
Nell'UE vi sono notevoli disparità regionali nella partecipazione degli adulti all'apprendimento permanente. Regno Unito, Danimarca, Finlandia e Svezia hanno il maggior numero di regioni con una forte partecipazione, mentre le regioni con un tasso di partecipazione molto basso si concentrano nell'Europa sudorientale171.
"L'accessibilità geografica" all'istruzione terziaria presenta notevoli differenze tra le regioni dell'UE172. Le regioni con la migliore accessibilità geografica sono soprattutto in Germania, nel Regno Unito e nei Paesi Bassi, quelle con la peggiore accessibilità geografica all'istruzione terziaria173 sono nell'Europa sudoccidentale, nel nord della Svezia e della Finlandia, nei paesi baltici, in Spagna, Danimarca e Francia.
Disparità regionali all'interno degli Stati membri dell'UE
Se si considerano le disparità regionali all'interno di ciascuno Stato membro dell'UE, misurate dalla differenza tra valori regionali massimo e minimo di ciascun indicatore174, la maggiore disuguaglianza regionale per quanto riguarda l'indicatore "alunni e studenti a tutti i livelli di istruzione in percentuale della popolazione totale" si registra in Romania,
168
Cfr figura 3.3 e tabelle 3.6 e 3.7 (p. 77) 169
Cfr. figura 3.4 e tabelle 3.8 e 3.9 (pag. 78). 170
Cfr. figura 3.10; Tabelle 3.19 e 3.20 (pagg. 84-85). 171
Cfr. figura 3.2 e tabelle 3.4 e 3.5 (pag. 76). 172
Cfr. figura 3.6; Tabella 3.12 (pagg. 80-81). 173
La percentuale del totale della popolazione di una regione che vive a più di 60 minuti dalla più vicina università. 174
Gli indicatori esaminati figurano nella tabella 3.1, pag. 74.
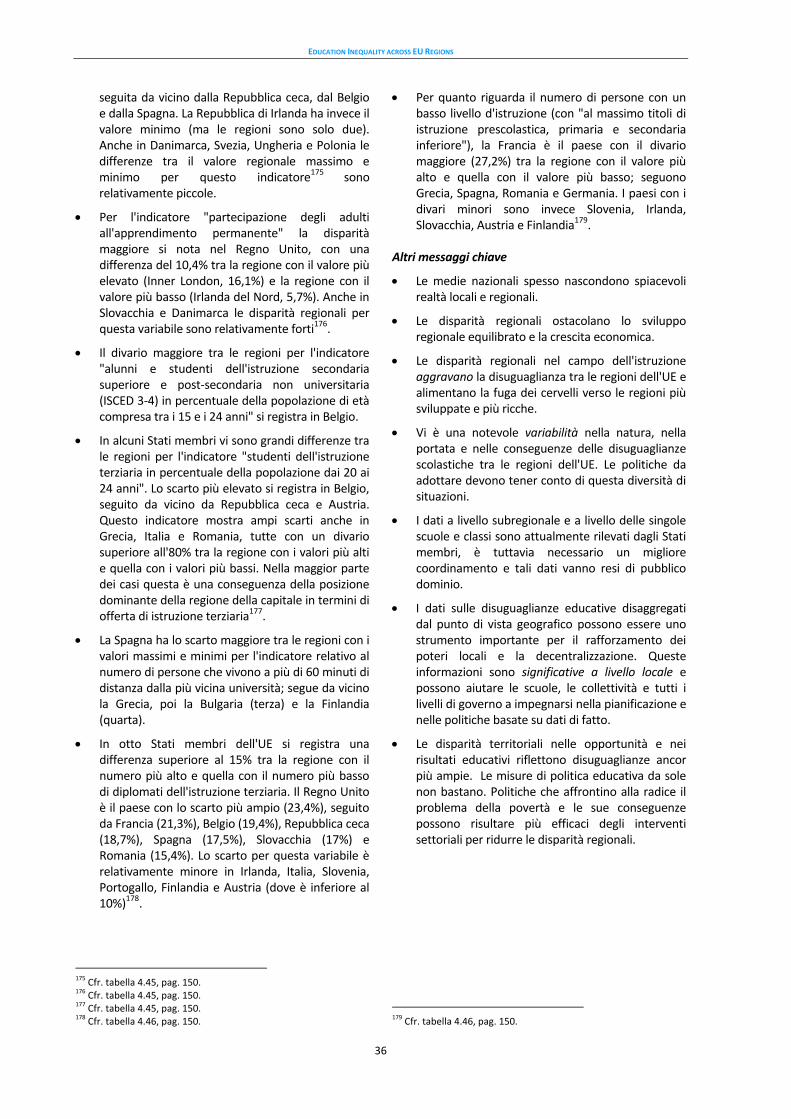
EDUCATION INEQUALITY ACROSS EU REGIONS
36
seguita da vicino dalla Repubblica ceca, dal Belgio e dalla Spagna. La Repubblica di Irlanda ha invece il valore minimo (ma le regioni sono solo due). Anche in Danimarca, Svezia, Ungheria e Polonia le differenze tra il valore regionale massimo e minimo per questo indicatore175
sono relativamente piccole.
Per l'indicatore "partecipazione degli adulti all'apprendimento permanente" la disparità maggiore si nota nel Regno Unito, con una differenza del 10,4% tra la regione con il valore più elevato (Inner London, 16,1%) e la regione con il valore più basso (Irlanda del Nord, 5,7%). Anche in Slovacchia e Danimarca le disparità regionali per questa variabile sono relativamente forti176.
Il divario maggiore tra le regioni per l'indicatore "alunni e studenti dell'istruzione secondaria superiore e post-secondaria non universitaria (ISCED 3-4) in percentuale della popolazione di età compresa tra i 15 e i 24 anni" si registra in Belgio.
In alcuni Stati membri vi sono grandi differenze tra le regioni per l'indicatore "studenti dell'istruzione terziaria in percentuale della popolazione dai 20 ai 24 anni". Lo scarto più elevato si registra in Belgio, seguito da vicino da Repubblica ceca e Austria. Questo indicatore mostra ampi scarti anche in Grecia, Italia e Romania, tutte con un divario superiore all'80% tra la regione con i valori più alti e quella con i valori più bassi. Nella maggior parte dei casi questa è una conseguenza della posizione dominante della regione della capitale in termini di offerta di istruzione terziaria177.
La Spagna ha lo scarto maggiore tra le regioni con i valori massimi e minimi per l'indicatore relativo al numero di persone che vivono a più di 60 minuti di distanza dalla più vicina università; segue da vicino la Grecia, poi la Bulgaria (terza) e la Finlandia (quarta).
In otto Stati membri dell'UE si registra una differenza superiore al 15% tra la regione con il numero più alto e quella con il numero più basso di diplomati dell'istruzione terziaria. Il Regno Unito è il paese con lo scarto più ampio (23,4%), seguito da Francia (21,3%), Belgio (19,4%), Repubblica ceca (18,7%), Spagna (17,5%), Slovacchia (17%) e Romania (15,4%). Lo scarto per questa variabile è relativamente minore in Irlanda, Italia, Slovenia, Portogallo, Finlandia e Austria (dove è inferiore al 10%)178.
175
Cfr. tabella 4.45, pag. 150. 176
Cfr. tabella 4.45, pag. 150. 177
Cfr. tabella 4.45, pag. 150. 178
Cfr. tabella 4.46, pag. 150.
Per quanto riguarda il numero di persone con un basso livello d'istruzione (con "al massimo titoli di istruzione prescolastica, primaria e secondaria inferiore"), la Francia è il paese con il divario maggiore (27,2%) tra la regione con il valore più alto e quella con il valore più basso; seguono Grecia, Spagna, Romania e Germania. I paesi con i divari minori sono invece Slovenia, Irlanda, Slovacchia, Austria e Finlandia179.
Altri messaggi chiave
Le medie nazionali spesso nascondono spiacevoli realtà locali e regionali.
Le disparità regionali ostacolano lo sviluppo regionale equilibrato e la crescita economica.
Le disparità regionali nel campo dell'istruzione aggravano la disuguaglianza tra le regioni dell'UE e alimentano la fuga dei cervelli verso le regioni più sviluppate e più ricche.
Vi è una notevole variabilità nella natura, nella portata e nelle conseguenze delle disuguaglianze scolastiche tra le regioni dell'UE. Le politiche da adottare devono tener conto di questa diversità di situazioni.
I dati a livello subregionale e a livello delle singole scuole e classi sono attualmente rilevati dagli Stati membri, è tuttavia necessario un migliore coordinamento e tali dati vanno resi di pubblico dominio.
I dati sulle disuguaglianze educative disaggregati dal punto di vista geografico possono essere uno strumento importante per il rafforzamento dei poteri locali e la decentralizzazione. Queste informazioni sono significative a livello locale e possono aiutare le scuole, le collettività e tutti i livelli di governo a impegnarsi nella pianificazione e nelle politiche basate su dati di fatto.
Le disparità territoriali nelle opportunità e nei risultati educativi riflettono disuguaglianze ancor più ampie. Le misure di politica educativa da sole non bastano. Politiche che affrontino alla radice il problema della povertà e le sue conseguenze possono risultare più efficaci degli interventi settoriali per ridurre le disparità regionali.
179
Cfr. tabella 4.46, pag. 150.
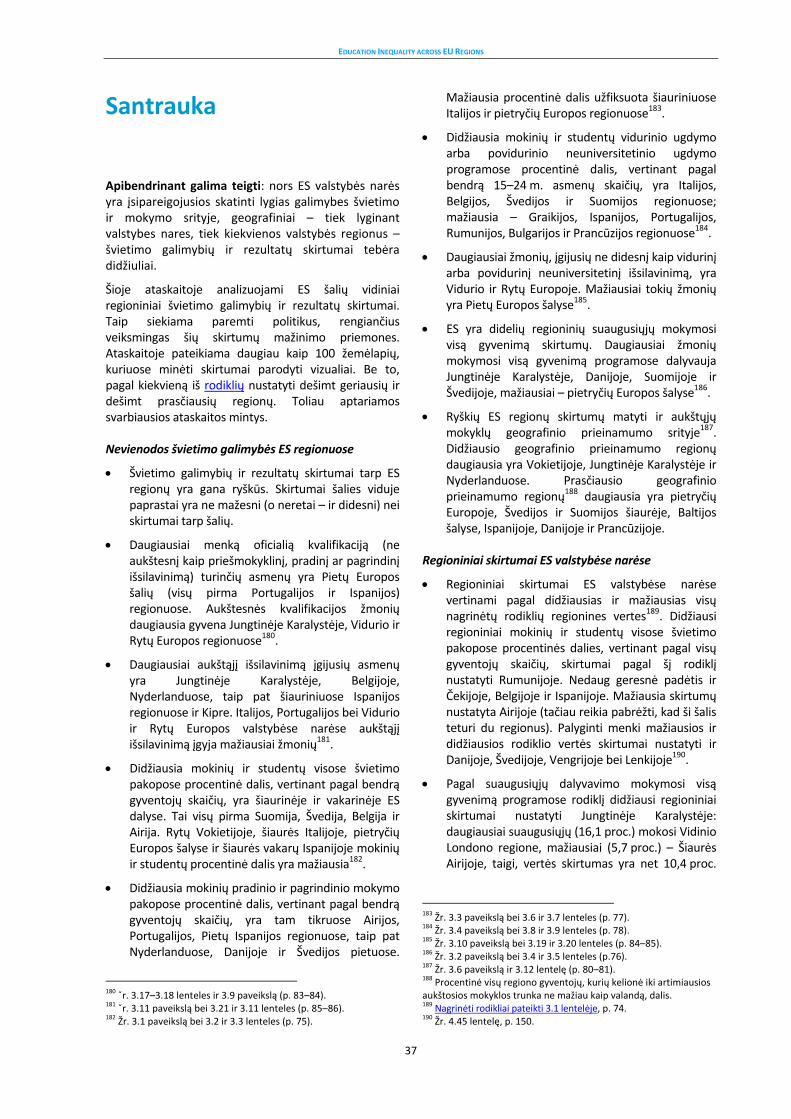
EDUCATION INEQUALITY ACROSS EU REGIONS
37
Santrauka
Apibendrinant galima teigti: nors ES valstybės narės yra įsipareigojusios skatinti lygias galimybes švietimo ir mokymo srityje, geografiniai – tiek lyginant valstybes nares, tiek kiekvienos valstybės regionus – švietimo galimybių ir rezultatų skirtumai tebėra didžiuliai.
Šioje ataskaitoje analizuojami ES šalių vidiniai regioniniai švietimo galimybių ir rezultatų skirtumai. Taip siekiama paremti politikus, rengiančius veiksmingas šių skirtumų mažinimo priemones. Ataskaitoje pateikiama daugiau kaip 100 žemėlapių, kuriuose minėti skirtumai parodyti vizualiai. Be to, pagal kiekvieną iš rodiklių nustatyti dešimt geriausių ir dešimt prasčiausių regionų. Toliau aptariamos svarbiausios ataskaitos mintys.
Nevienodos švietimo galimybės ES regionuose
Švietimo galimybių ir rezultatų skirtumai tarp ES regionų yra gana ryškūs. Skirtumai šalies viduje paprastai yra ne mažesni (o neretai – ir didesni) nei skirtumai tarp šalių.
Daugiausiai menką oficialią kvalifikaciją (ne aukštesnį kaip priešmokyklinį, pradinį ar pagrindinį išsilavinimą) turinčių asmenų yra Pietų Europos šalių (visų pirma Portugalijos ir Ispanijos) regionuose. Aukštesnės kvalifikacijos žmonių daugiausia gyvena Jungtinėje Karalystėje, Vidurio ir Rytų Europos regionuose180.
Daugiausiai aukštąjį išsilavinimą įgijusių asmenų yra Jungtinėje Karalystėje, Belgijoje, Nyderlanduose, taip pat šiauriniuose Ispanijos regionuose ir Kipre. Italijos, Portugalijos bei Vidurio ir Rytų Europos valstybėse narėse aukštąjį išsilavinimą įgyja mažiausiai žmonių181.
Didžiausia mokinių ir studentų visose švietimo pakopose procentinė dalis, vertinant pagal bendrą gyventojų skaičių, yra šiaurinėje ir vakarinėje ES dalyse. Tai visų pirma Suomija, Švedija, Belgija ir Airija. Rytų Vokietijoje, šiaurės Italijoje, pietryčių Europos šalyse ir šiaurės vakarų Ispanijoje mokinių ir studentų procentinė dalis yra mažiausia182.
Didžiausia mokinių pradinio ir pagrindinio mokymo pakopose procentinė dalis, vertinant pagal bendrą gyventojų skaičių, yra tam tikruose Airijos, Portugalijos, Pietų Ispanijos regionuose, taip pat Nyderlanduose, Danijoje ir Švedijos pietuose.
180
ˇr. 3.17–3.18 lenteles ir 3.9 paveikslą (p. 83–84). 181
ˇr. 3.11 paveikslą bei 3.21 ir 3.11 lenteles (p. 85–86). 182
Žr. 3.1 paveikslą bei 3.2 ir 3.3 lenteles (p. 75).
Mažiausia procentinė dalis užfiksuota šiauriniuose Italijos ir pietryčių Europos regionuose183.
Didžiausia mokinių ir studentų vidurinio ugdymo arba povidurinio neuniversitetinio ugdymo programose procentinė dalis, vertinant pagal bendrą 15–24 m. asmenų skaičių, yra Italijos, Belgijos, Švedijos ir Suomijos regionuose; mažiausia – Graikijos, Ispanijos, Portugalijos, Rumunijos, Bulgarijos ir Prancūzijos regionuose184.
Daugiausiai žmonių, įgijusių ne didesnį kaip vidurinį arba povidurinį neuniversitetinį išsilavinimą, yra Vidurio ir Rytų Europoje. Mažiausiai tokių žmonių yra Pietų Europos šalyse185.
ES yra didelių regioninių suaugusiųjų mokymosi visą gyvenimą skirtumų. Daugiausiai žmonių mokymosi visą gyvenimą programose dalyvauja Jungtinėje Karalystėje, Danijoje, Suomijoje ir Švedijoje, mažiausiai – pietryčių Europos šalyse186.
Ryškių ES regionų skirtumų matyti ir aukštųjų mokyklų geografinio prieinamumo srityje187. Didžiausio geografinio prieinamumo regionų daugiausia yra Vokietijoje, Jungtinėje Karalystėje ir Nyderlanduose. Prasčiausio geografinio prieinamumo regionų188 daugiausia yra pietryčių Europoje, Švedijos ir Suomijos šiaurėje, Baltijos šalyse, Ispanijoje, Danijoje ir Prancūzijoje.
Regioniniai skirtumai ES valstybėse narėse
Regioniniai skirtumai ES valstybėse narėse vertinami pagal didžiausias ir mažiausias visų nagrinėtų rodiklių regionines vertes189. Didžiausi regioniniai mokinių ir studentų visose švietimo pakopose procentinės dalies, vertinant pagal visų gyventojų skaičių, skirtumai pagal šį rodiklį nustatyti Rumunijoje. Nedaug geresnė padėtis ir Čekijoje, Belgijoje ir Ispanijoje. Mažiausia skirtumų nustatyta Airijoje (tačiau reikia pabrėžti, kad ši šalis teturi du regionus). Palyginti menki mažiausios ir didžiausios rodiklio vertės skirtumai nustatyti ir Danijoje, Švedijoje, Vengrijoje bei Lenkijoje190.
Pagal suaugusiųjų dalyvavimo mokymosi visą gyvenimą programose rodiklį didžiausi regioniniai skirtumai nustatyti Jungtinėje Karalystėje: daugiausiai suaugusiųjų (16,1 proc.) mokosi Vidinio Londono regione, mažiausiai (5,7 proc.) – Šiaurės Airijoje, taigi, vertės skirtumas yra net 10,4 proc.
183
Žr. 3.3 paveikslą bei 3.6 ir 3.7 lenteles (p. 77). 184
Žr. 3.4 paveikslą bei 3.8 ir 3.9 lenteles (p. 78). 185
Žr. 3.10 paveikslą bei 3.19 ir 3.20 lenteles (p. 84–85). 186
Žr. 3.2 paveikslą bei 3.4 ir 3.5 lenteles (p.76). 187
Žr. 3.6 paveikslą ir 3.12 lentelę (p. 80–81). 188
Procentinė visų regiono gyventojų, kurių kelionė iki artimiausios aukštosios mokyklos trunka ne mažiau kaip valandą, dalis. 189
Nagrinėti rodikliai pateikti 3.1 lentelėje, p. 74. 190
Žr. 4.45 lentelę, p. 150.
EDUCATION INEQUALITY ACROSS EU REGIONS
38
Dideli regioniniai skirtumai pagal šį rodiklį pastebėti ir Slovakijoje bei Danijoje191.
Didžiausi regioniniai Belgijos skirtumai nustatyti pagal mokinių ir studentų dalyvavimo vidurinio ugdymo arba neuniversitetinio povidurinio ugdymo programose procentinės dalies, vertinant pagal bendrą 15–24 m. asmenų skaičių, rodiklį.
Kai kuriose valstybėse narėse yra didelių regioninių aukštųjų mokyklų studentų procentinės dalies, palyginti su visais 20–24 m. amžiaus gyventojais, skirtumų. Didžiausias atotrūkis nustatytas Belgijoje, Čekijoje ir Austrijoje. Nemenki skirtumai pagal šį rodiklį būdingi ir Graikijai, Italijai, Rumunijai – pirmaujančius ir atsiliekančius regionus skiria net 80 proc. atotrūkis. Daugeliu atvejų tokią padėtį lemia tai, kad sostinės regione teikiama daugiausia aukštojo mokslo galimybių192.
Vertinant žmonių, kuriems kelionė iki artimiausios aukštosios mokyklos trunka daugiau kaip valandą, skaičių, didžiausias atotrūkis nustatytas Ispanijos regionuose. Toliau – Graikija, Suomija ir Bulgarija.
Vertinant aukštąjį išslavinimą įgijusių asmenų skaičių, didesnis nei 15 proc. atotrūkis tarp pirmojo ir paskutinio regiono nustatytas aštuoniose ES valstybėse narėse. Didžiausi skirtumai – Jungtinėje Karalystėje (23,4 proc.), Prancūzijoje (21,3 proc.), Belgijoje (19,4 proc.), Čekijoje (18,7 proc.), Ispanijoje (17,5 proc.), Slovakijoje (17 proc.) ir Rumunijoje (15,4 proc.). Palyginti nedidelis – mažesnis kaip 10 proc. – šio rodiklio atotrūkis nustatytas Airijoje, Italijoje, Slovėnijoje, Portugalijoje, Suomijoje ir Austrijoje193.
Vertinant pagal menką (ne didesnį kaip priešmokyklinį, pradinį ar pagrindinį) išsilavinimą turinčių žmonių skaičių, didžiausias regionų atotrūkis nustatytas Prancūzijoje (27,2 proc.), Graikijoje, Ispanijoje, Rumunijoje ir Vokietijoje. Mažiausias atotrūkis šioje srityje nustatytas Slovėnijoje, Airijoje, Slovakijoje, Austrijoje ir Suomijoje194.
Kiti svarbūs ataskaitos aspektai
Nacionaliniai vidurkiai neretai slepia nepalankią vietos ir regionų padėtį.
Švietimo srities regioniniai skirtumai trukdo proporcingam regionų vystymuisi ir ekonomikos augimui.
Švietimo srities regioniniai skirtumai prisideda prie ES regionų nelygybės. Be to, kyla protų nutekėjimo
191
Žr. 4.45 lentelę, p. 150. 192
Žr. 4.45 lentelę, p. 150. 193
Žr. 4.46 lentelę, p. 150. 194
Žr. 4.46 lentelę, p. 150.
į labiau išsivysčiusius ir turtingesnius regionus pavojus.
Švietimo skirtumų ES regionuose pobūdis, mastas ir poveikis smarkiai skiriasi. Todėl politiniai sprendimai turi būti ne bendri, o pritaikyti konkretiems regionams.
Šiuo metu valstybėse narėse renkami subregioninio lygmens ir pavienių mokyklų bei klasių duomenys, tačiau reikėtų užtikrinti geresnį koordinavimą ir šių duomenų viešinimą.
Geografiškai nekonsoliduotų duomenų apie švietimo skirtumus rinkimas gali būti svarbi galios regionams suteikimo ir decentralizavimo priemonė. Taip kaupiama konkrečiam regionui aktuali informacija. Tokie duomenys gali padėti mokykloms, bendruomenės organizacijoms ir visų lygmenų valdžios institucijoms dalyvauti faktais grindžiamoje planavimo ir politikos veikloje.
Regioniniai švietimo galimybių ir rezultatų skirtumai atspindi didesnio masto nelygybę. Vien švietimo politikos priemonių nepakaks. Siekiant pakeisti regioninės nelygybės švietimo srityje tendencijas, politinės priemonės, kuriomis siekiama įveikti skurdą ir jo lemiamą nepalankią padėtį visuomenėje, gali būti kur kas sėkmingesnės nei vien intervencinės švietimo politikos priemonės.
EDUCATION INEQUALITY ACROSS EU REGIONS
39
Kopsavilkums
Īsumā. Lai gan dalībvalstis cenšas veicināt vienlīdzību
izglītības un apmācības jomā, joprojām pastāv lielas
ģeogrāfiskās atšķirības izglītības iespēju un rezultātu ziņā
gan starp ES dalībvalstīm, gan pašu valstu iekšienē.
Šajā ziņojumā ir sniegts ieskats par izglītības iespēju un
rezultātu nevienlīdzību starp katras valsts reģioniem
Eiropas Savienībā. Ziņojuma mērķis ir palīdzēt politikas
veidotājiem centienos izstrādāt iedarbīgus pasākumus šo
atšķirību mazināšanai. Tajā iekļauts vairāk nekā 100 karšu,
kas uzskatami parāda minētās atšķirības. Par pamatu
ņemot katru rādītāju, kas aplūkots ziņojumā, ir noteikti 10
labākie un 10 sliktākie ES reģioni. Turpmāk izklāstītas
ziņojuma galvenās atziņas.
Izglītības nevienlīdzīgā situācija ES reģionos
Starp ES reģioniem pastāv ievērojamas atšķirības
izglītības iespēju un rezultātu ziņā. Valstu iekšienē
vērojamās atšķirības sasnieguma ziņā bieži vien ir
tikpat lielas vai pat lielākas nekā atšķirības valstu
starpā.
Cilvēki ar zemu formālo kvalifikāciju ("tikai
pirmsskolas, sākumskolas vai pamatskolas izglītība")
vislielākā skaitā mīt Dienvideiropas reģionos un it
īpaši Portugālē un Spānijā. Turpretī reģioni, kuros
dzīvo cilvēki ar augstāku kvalifikāciju, galvenokārt
atrodas Apvienotajā Karalistē, kā arī Centrāleiropā un
Austrumeiropā195.
Reģioni ar vislielāko rādītāju augstāko izglītību
ieguvušo cilvēku skaita ziņā galvenokārt atrodas
Apvienotajā Karalistē, Beļģijā un Nīderlandē, kā arī
Spānijas ziemeļos un Kiprā. Savukārt reģioni, kuros šis
rādītājs ir viszemākais, ir Itālijā, Portugālē un ES
centrālajā un austrumu daļā196.
ES reģioni, kuros ir visvairāk "skolēnu un studentu
visu līmeņu izglītības iestādēs procentuāli no visu
iedzīvotāju skaita", atrodas ES ziemeļos un rietumos,
jo īpaši Somijā un Zviedrijā, kā arī Beļģijā un Īrijā.
Reģioni ar viszemākajiem rādītājiem atrodas
galvenokārt Vācijas austrumos, Itālijas ziemeļos un
Eiropas dienvidaustrumos, kā arī Spānijas
ziemeļrietumos un Portugālē197.
Reģioni, kuros ir visvairāk "skolēnu pamatizglītības
iestādēs procentuāli no visu iedzīvotāju skaita",
atrodas Īrijā, Portugālē, Spānijas dienvidos, kā arī
Nīderlandē, Dānijā un Zviedrijas dienvidu daļā.
Turpretī zemākie rādītāji ir vērojami Itālijas ziemeļos
un Eiropas dienvidaustrumos198.
195
Sk. 3.17. un 3.18. tabulu un 3.9. attēlu (83., 84. lpp.) 196
Sk. 3.11. attēlu, 3.21. un 3.22. tabulu (85., 86. lpp.). 197
Sk. 3.1. attēlu un 3.2. un 3.3. tabulu (75. lpp.) 198
Sk. 3.3. attēlu un 3.6. un 3.7. tabulu (77. lpp.)
Reģioni, kuros ir visvairāk "skolēnu un studentu
vidējās izglītības un pēcvidusskolas neterciārās
izglītības iestādēs procentuāli no 15–24 g.v. jauniešu
skaita", galvenokārt atrodas Itālijā, Beļģijā, Zviedrijā
un Somijā, bet lielākā daļa reģionu ar attiecīgi
viszemākajiem rādītājiem atrodas Grieķijā, Spānijā,
Portugālē, Rumānijā, Bulgārijā un Francijā199.
Reģioni ar vislielāko to cilvēku skaitu, kuriem ir "tikai
vidusskolas un pēcvidusskolas neterciārā izglītība",
galvenokārt atrodas Centrāleiropā un Austrumeiropā,
bet reģioni ar attiecīgi viszemākajiem rādītājiem
pārsvarā atrodas Dienvideiropā200.
Lielas reģionālās atšķirības Eiropas Savienībā
vērojamas pieaugušo mūžizglītībā. Lielākā daļa
reģionu ar iedzīvotāju procentuāli nozīmīgu līdzdalību
mūžizglītībā atrodas Apvienotajā Karalistē, Dānijā,
Somijā un Zviedrijā, bet lielākā daļa reģionu ar ļoti
zemiem rādītājiem mūžizglītībā atrodas Eiropas
dienvidaustrumos201.
ES reģionos202 ir vērojamas būtiskas atšķirības
terciārās izglītības "ģeogrāfiskajā pieejamībā". Reģioni
ar vislabāko "ģeogrāfisko pieejamību" galvenokārt ir
Vācijā, Apvienotajā Karalistē un Nīderlandē. Turpretī
lielākā daļa reģionu ar viszemākajiem rādītājiem
terciārās izglītības "ģeogrāfiskās pieejamības"203 ziņā
atrodas Eiropas dienvidaustrumos, Zviedrijas
ziemeļos un Somijā, Baltijas valstīs, Spānijā, Dānijā un
Francijā.
Reģionālās atšķirības ES dalībvalstu iekšienē
Aplūkojot reģionālās atšķirības katras ES dalībvalsts
iekšienē un aprēķinot starpību starp maksimālajām
un minimālajām reģionālajām vērtībām par katru
vērtēto rādītāju204, Rumānija ir valsts ar vislielākajām
reģionālajām atšķirībām attiecībā uz rādītāju "skolēni
un studenti visu līmeņu izglītības iestādēs
proporcionāli no kopējā iedzīvotāju skaita", tai seko
Čehija, Beļģija un Spānija. Turpretim vismazākās
atšķirības ir Īrijā (tomēr jāpiemin, ka Īrijā ir tikai divi
reģioni). Arī Dānijā, Zviedrijā, Ungārijā un Polijā ir
relatīvi mazas atšķirības starp šā rādītāja205
maksimālajām un minimālajām reģionālajām
vērtībām.
Aplūkojot rādītāju "pieaugušo līdzdalība mūžizglītībā",
Apvienotajā Karalistē vērojamas vislielākās reģionālās
atšķirības, jo starpība starp reģionu ar augstāko
rādītāju (Iekšlondona, 16,1 %) un reģionu ar zemāko
rādītāju (Ziemeļīrija, 5,7 %) ir 10,4 %. Slovākijā un
199
Sk. 3.4. attēlu un 3.8. un 3.9. tabulu (78. lpp.) 200
Sk. 3.10. attēlu, 3.19. un 3.20. tabulu (84., 85. lpp.). 201
Sk. 3.2. attēlu un 3.4. un 3.5. tabulu (76. lpp.). 202
Sk. 3.6. attēlu, 3.12. tabulu (80., 81. lpp). 203
Procentuāls skaits no visiem reģiona iedzīvotājiem, kas dzīvo vairāk nekā 60 minūšu attālumā no tuvākās augstskolas. 204
Vērtētie rādītāji ir uzskaitīti 3.1. tabulā 74. lpp. 205
Sk. 4.45. tabulu 150. lpp.
EDUCATION INEQUALITY ACROSS EU REGIONS
40
Dānijā arī pastāv samērā lielas reģionālās atšķirības
attiecībā uz šo mainīgo lielumu206.
Beļģijā ir vislielākā starpība starp saraksta augšgala un
apakšgala reģioniem attiecībā uz rādītāju "skolēni un
studenti vidusskolas un pēcvidusskolas neterciārās
izglītības iestādēs (ISCED 3-4) procentuāli no 15–
24 g.v. jauniešiem)".
Dažās dalībvalstīs pastāv lielas reģionālās atšķirības
attiecībā uz rādītāju "studenti terciārās izglītības
iestādēs procentuāli no 20–24 g.v. jauniešu skaita".
Beļģijā šī starpība ir vislielākā, tai cieši seko Čehija un
Austrija. Turklāt attiecībā uz šo rādītāju liela starpība
ir Grieķijā, Itālijā un Rumānijā, kur tā pārsniedz 80 %,
salīdzinot starp reģioniem, kas šajās valstīs atrodas
saraksta pirmajā un pēdējā vietā. Lielākoties to izraisa
galvaspilsētas reģiona pārsvars terciārās izglītības
iespēju207 ziņā.
Spānijā ir vislielākā starpība starp saraksta augšgala
un apakšgala reģioniem attiecībā uz cilvēkiem, kas
dzīvo vairāk nekā 60 minūšu attālumā no tuvākās
augstskolas, tai cieši seko Grieķija, tad Somija trešajā
vietā un Bulgārija ceturtajā vietā.
Astoņās ES dalībvalstīs starpība starp saraksta
augšgala un apakšgala reģioniem attiecībā uz
cilvēkiem ar pabeigtu augstāko izglītību reģionā
pārsniedz 15 %. Apvienotā Karaliste ir valsts ar
vislielāko starpību (23,4 %), tai seko Francija (21,3 %),
Beļģija (19,4 %), Čehija (18,7 %), Spānija (17,5 %),
Slovākija (17 %) un Rumānija (15,4 %). Starpība
attiecībā uz šo mainīgo lielumu ir relatīvi zemāka Īrijā,
Itālijā, Slovēnijā, Portugālē, Somijā un Austrijā (visās
zem 10 %)208.
Vērtējot cilvēku skaitu ar zemu izglītību (tikai
"pirmsskolas, sākumskolas un pamatskolas izglītība"),
Francijā ir vislielākā starpība starp saraksta pirmajā un
pēdējā pozīcijā ierindotajiem reģioniem (27,2 %
starpība), tai seko Grieķija, Spānija, Rumānija un
Vācija. Turpretī valstis ar viszemāko starpību ir
Slovēnija, Īrija, Slovākija, Austrija un Somija209.
Citas svarīgas atziņas
Vidējie rādītāji valstī ļoti bieži apslēpj nepatīkamo
vietējo un reģionālo situāciju.
Reģionālās atšķirības izglītībā kavē līdzsvarotu
reģionālo attīstību un ekonomikas izaugsmi.
Reģionālās atšķirības izglītības jomā veicina
nevienlīdzību starp ES reģioniem. Tās ir arī iemesls
"smadzeņu aizplūšanai" uz attīstītākiem/bagātākiem
reģioniem.
206
Sk. 4.45. tabulu 150. lpp. 207
Sk. 4.45. tabulu 150. lpp. 208
Sk. 4.46. tabulu 150. lpp. 209
Sk. 4.46. tabulu 150. lpp.
Nevienlīdzība izglītības jomā starp ES reģioniem
ievērojami atšķiras pēc rakstura, mēroga un
ietekmes. Politikas risinājumiem jābūt īpaši
pielāgotiem, nevis universāliem.
Pašlaik dalībvalstīs tiek vākti dati par apakšreģionālo
līmeni un par skolu un klašu līmeni, bet ir
nepieciešama labāka koordinācija un šo datu publiska
pieejamība.
Ģeogrāfiski neapkopotu datu vākšana par izglītības
nevienlīdzību var būt svarīgs instruments vietējo
iestāžu līdzdalības veicināšanai un decentralizācijai.
Tas nodrošinātu vietējā līmenī būtisku informāciju,
varētu palīdzēt skolām, sabiedrības organizācijām un
visu līmeņu pārvaldes iestādēm iesaistīties uz
konkrētiem datiem balstītā plānošanā un politikas
veidošanā.
Izglītības iespēju un rezultātu nevienmērīgā izplatība
liecina par dziļāku nevienlīdzību. Ar izglītības politikas
pasākumiem vien situāciju nav iespējams atrisināt. Lai
ietekmētu izglītības reģionālās nevienlīdzības kopējās
tendences, salīdzinājumā ar klasiskiem izglītības
politikas pasākumiem lielāka iedarbība visticamāk būs
politikas pasākumiem, kas ir vērsti uz nabadzības un
saistīto problēmu risināšanu pašā saknē.
EDUCATION INEQUALITY ACROSS EU REGIONS
41
Sommarju eżekuttiv
Fi ftit kliem: Minkejja l-impenji mill-Istati Membri tal-UE
biex jippromwovu l-ekwità fl-edukazzjoni u t-taħriġ, għad
baqa' differenzi ġeografiċi kbar fl-opportunitajiet u l-eżiti
edukattivi, kemm bejn l-Istati Membri tal-UE kif ukoll fi
ħdanhom.
Dan ir-rapport jagħti stampa tal-inugwaljanzi reġjonali
intranazzjonali fl-opportunitajiet u l-eżiti edukattivi fl-UE.
L-għan tiegħu huwa li jappoġġa lil dawk li jfasslu l-politika
fl-isforzi tagħhom biex ifasslu miżuri effettivi biex jikkoreġu
dawn id-diskrepanzi. Fih iktar minn 100 mappa li jgħinu
biex jiġu viżwalizzati l-inugwaljanzi. Huwa jidentifika l-
aqwa u l-agħar 10 reġjuni tal-UE għal kull wieħed mill-
indikaturi li jifli. Il-messaġġi ewlenin tiegħu huma:
L-inugwaljanzi fl-edukazzjoni bejn ir-reġjuni tal-UE
Hemm inugwaljanzi konsiderevoli fl-opportunitajiet u
l-eżiti edukattivi bejn ir-reġjuni tal-UE. Id-differenzi
intranazzjonali fir-rati ta' suċċess huma ta' spiss
talanqas kbar daqs, u ħafna drabi akbar, mid-
differenzi internazzjonali.
Ir-reġjuni bl-ogħla rata ta' nies bi ftit kwalifiki formali
("bl-akbar kisba edukattiva fil-livell ta' qabel il-
primarja, tal-primarja jew tas-sekondarja inferjuri")
jinsabu l-aktar fin-nofsinhar tal-Ewropa u speċjalment
fil-Portugall u Spanja. B’kuntrast ma’ dan, ir-reġjuni
fejn in-nies għandhom kwalifiki ogħla jinsabu l-aktar
fir-Renju Unit, kif ukoll fl-Ewropa Ċentrali u tal-
Lvant210.
Ir-reġjuni bl-ogħla rata ta' individwi bi kwalifiki tal-
edukazzjoni terzjarja jinsabu l-aktar fir-Renju Unit, fil-
Belġju u fil-Pajjiżi l-Baxxi, iżda wkoll fit-tramuntana ta’
Spanja u f'Ċipru. B’kuntrast ma’ dan, ir-reġjuni bl-
inqas rati jinsabu fl-Italja, fil-Portugall, u fil-pajjiżi tal-
UE ċentrali u tal-lvant211.
Ir-reġjuni tal-UE bl-ogħla rata ta "tfal tal-iskola u
studenti f’kull livell tal-edukazzjoni bħala perċentwal
tal-popolazzjoni totali" huma kkonċentrati fit-
tramuntana u fil-punent tal-UE, speċjalment fil-
Finlandja, fl-Isvezja, iżda wkoll fil-Belġju u l-Irlanda. Ir-
reġjuni bl-inqas rati jinsabu l-aktar fil-lvant tal-
Ġermanja, fit-tramuntana tal-Italja u fix-xlokk tal-
Ewropa, iżda wkoll fil-majjistral ta' Spanja u l-
Portugall212.
Ir-reġjuni bl-ogħla rata ta "studenti fil-primarja u l-
edukazzjoni sekondarja inferjuri bħala perċentwal tal-
popolazzjoni totali" huma osservati f'reġjuni tar-
210 Ara t-Tabelli 3.17-3.18 u l-Figuri 3.9 (pp. 83-84). 211 Ara l-Figura 3.11; It-Tabelli 3.21 u 3.22 (pp.85-86). 212 Ara l-Figura 3.1 u t-Tabelli 3.2 u 3.3 (p. 75).
Repubblika tal-Irlanda, il-Portugall, in-nofsinhar ta'
Spanja, iżda wkoll fil-Pajjiżi l-Baxxi, id-Danimarka u l-
Isvezja tan-nofsinhar. B’kuntrast ma’ dan, huma
osservati rati baxxi fit-tramuntana tal-Italja u fix-xlokk
tal-Ewropa213.
Ir-reġjuni bl-ogħla rata ta "tfal tal-iskola u studenti fl-
iskola sekondarja superjuri u fl-edukazzjoni
postsekondarja mhux terzjarja bħala perċentwal tal-
popolazzjoni ta' età bejn il-15 u l-24 sena" jinsabu l-
aktar fl-Italja, il-Belġju, l-Isvezja u l-Finlandja, filwaqt li
l-biċċa l-kbira tar-reġjuni bl-aktar rati baxxi jinsabu fil-
Greċja, Spanja, il-Portugall, ir-Rumanija, il-Bulgarija u
Franza214.
Ir-reġjuni bl-ogħla rata ta' persuni b'"l-aktar
edukazzjoni għolja tagħhom fil-livell ta' sekondarja
superjuri u edukazzjoni postsekondarja mhux
terzjarja" jinsabu l-aktar fl-Ewropa Ċentrali u tal-
Lvant, filwaqt li r-reġjuni bl-inqas rati jinsabu l-aktar
fin-nofsinhar tal-Ewropa215.
Hemm differenzi reġjonali kbar f'termini tal-
parteċipazzjoni adulta fit-tagħlim tul il-ħajja fl-UE. Ir-
Renju Unit, id-Danimarka, il-Finlandja u l-Isvezja
għandhom l-ogħla għadd ta’ reġjuni b’parteċipazzjoni
qawwija fit-tagħlim tul il-ħajja, filwaqt li l-biċċa l-kbira
tar-reġjuni b'rati baxxi ħafna ta’ parteċipazzjoni fit-
tagħlim tul il-ħajja huma fl-Ewropa tax-Xlokk216.
Hemm differenzi sinifikanti f'"l-aċċessibbiltà
ġeografika" għall-edukazzjoni terzjarja madwar ir-
reġjuni tal-UE217. Ir-reġjuni li għandhom l-aħjar
"aċċessibbiltà ġeografika" jinsabu l-aktar fil-
Ġermanja, ir-Renju Unit u l-Pajjiżi l-Baxxi. B'kuntrast
ma' dan, ħafna mir-reġjuni bl-inqas punteġġi dwar "l-
aċċessibbiltà ġeografika" għall-edukazzjoni terzjarja218
huma fl-Ewropa tax-Xlokk, it-Tramuntana tal-Isvezja u
l-Finlandja, l-Istati Baltiċi, Spanja, id-Danimarka u
Franza.
Id-disparitajiet reġjonali fi ħdan l-Istati Membri tal-UE
Jekk inħarsu lejn id-diskrepanzi reġjonali fi ħdan kull
Stat Membru tal-UE kif imkejla permezz tad-
differenza bejn il-valuri reġjonali massimi u minimi
għal kull indikatur eżaminat219, ir-Rumanija għandha l-
ogħla diverġenza reġjonali rigward l-indikatur "tfal tal-
iskola u studenti f’kull livell tal-edukazzjoni bħala %
tal-popolazzjoni totali", segwita mill-qrib mir-
Repubblika Ċeka, il-Belġju u Spanja. Fit-tarf l-ieħor, ir-
Repubblika tal-Irlanda għandha l-inqas valur (iżda
innota li din għandha biss żewġ reġjuni). Id-
213 Ara l-Figura 3.3 u t-Tabelli 3.6 u 3.7 (p. 77). 214 Ara l-Figura 3.4 u t-Tabelli 3.8 u 3.9 (p. 78). 215 Ara l-Figura 3.10; It-Tabelli 3.19 u 3.20 (pp. 84-85). 216 Ara l-Figura 3.2 u t-Tabelli 3.4 u 3.5 (p.76). 217 Ara l-Figura 3.6; Tabella 3.12 (pp.80-81). 218 Il-% tal-popolazzjoni totali ta’reġjun li tgħix aktar minn 60 minuta bogħod mill-eqreb università. 219 L-indikaturi eżaminati huma murija fit-Tabella 3.1, p. 74.
EDUCATION INEQUALITY ACROSS EU REGIONS
42
Danimarka, l-Isvezja, l-Ungerija u l-Polonja wkoll
jidhru li għandhom relattivament differenzi żgħar
bejn il-valur reġjonali massimu u dak minimu għal dan
l-indikatur220.
Jekk inħarsu lejn l-indikatur "il-parteċipazzjoni tal-
adulti fit-tagħlim tul il-ħajja", ir-Renju Unit għandu bil-
bosta l-akbar diverġenza reġjonali, bid-differenza bejn
ir-reġjun bl-ogħla valur (Inner London, 16.1%) u r-
reġjun bl-anqas valur (l-Irlanda ta' Fuq, 5.7%) fil-livell
ta’ 10.4%. Is-Slovakkja u d-Danimarka għandhom
ukoll differenzi reġjonali relattivament kbar fir-
rigward ta' dan il-varjabbli221.
Il-Belġju għandu l-ogħla differenza bejn l-ogħla
reġjuni tiegħu u dawk l-aktar baxxi f'termini ta' "tfal
tal-iskola u studenti fl-iskola sekondarja għolja u l-
edukazzjoni postsekondarja mhux terzjarja (ISCED 3-
4) bħala perċentwal tal-popolazzjoni ta' età bejn il-15
u l-24 sena".
F'xi Stati Membri, hemm differenzi kbar bejn ir-
reġjuni għall-indikatur "studenti fl-edukazzjoni
terzjarja bħala perċentwal tal-popolazzjoni ta’ età
bejn l-20 l-24 sena". Il-Belġju għandu l-iktar
diskrepanza estensiva, segwit mill-qrib mir-
Repubblika Ċeka u l-Awstrija. Barra minn hekk, il-
Greċja, l-Italja u r-Rumanija kollha għandhom
diskrepanzi kbar għal dan l-indikatur b’differenza ta’
aktar minn 80% bejn l-ogħla reġjun tagħhom u dak l-
aktar baxx. Fil-biċċa l-kbira ta' dawn il-każijiet dan
huwa r-riżultat ta' dominanza mir-reġjun tal-belt
kapitali f'termini ta' opportunitajiet ta' edukazzjoni
terzjarja222.
Spanja għandha l-akbar differenza bejn l-ogħla reġjuni
tagħha u dawk l-aktar baxxi f’termini ta’ għadd ta’
persuni li jgħixu aktar minn 60 minuta 'l bogħod mill-
eqreb Università, segwita mill-qrib mill-Greċja, il-
Finlandja u l-Bulgarija fit-tielet u r-raba’ post
rispettivament.
Tmien Stati Membri tal-UE għandhom differenza ta'
aktar minn 15% bejn l-ogħla reġjuni tagħhom u dawk
l-aktar baxxi f'termini ta' numri ta' gradwati fl-
edukazzjoni terzjarja f’kull reġjun. Ir-Renju Unit huwa
l-pajjiż bl-akbar diskrepanza (23.4%), segwit minn
Franza (21.3%), il-Belġju (19.4%), ir-Repubblika Ċeka
(18.7%), Spanja (17,5%), is-Slovakkja (17%) u r-
Rumanija (15.4%). Id-distakk għal dan il-varjabbli
huwa relattivament iżgħar fl-Irlanda, l-Italja, is-
Slovenja, il-Portugall, il-Finlandja u l-Awstrija (kollha
taħt l-10%)223.
Jekk inħarsu lejn l-għadd ta' nies li għandhom
kwalifiki ta’ edukazzjoni baxxi ("l-aktar kwalifika
għolja tkun qabel il-primarja, primarja u sekondarja
220 Ara t-Tabella 4.45, p. 150. 221 Ara t-Tabella 4.45, p. 150. 222 Ara t-Tabella 4.45, p. 150. 223 Ara t-Tabella 4.46, p. 150.
inferjuri"), Franza għandha l-ogħla disparità bejn l-
ogħla reġjuni tagħha u dawk l-aktar baxxi (distakk ta'
27.2%), segwita mill-Greċja, Spanja, ir-Rumanija u l-
Ġermanja. B’kuntrast, il-pajjiżi bl-inqas disparità
huma s-Slovenja, l-Irlanda, is-Slovakkja, l-Awstrija u l-
Finlandja224.
Messaġġi ewlenin oħra
Il-medji nazzjonali ħafna drabi jostru r-realtajiet lokali
u reġjonali mhux mixtieqa.
Id-disparitajiet reġjonali fit-tagħlim ifixklu l-iżvilupp
reġjonali u t-tkabbir ekonomiku bbilanċjat.
Id-disparitajiet reġjonali fl-edukazzjoni ikomplu
jikkumplikaw l-inugwaljanza bejn ir-reġjuni tal-UE.
Iħeġġu wkoll lil dawk l-aktar edukati jemigraw lejn ir-
reġuni l-aktar żviluppati jew għanja.
Hemm varjazzjoni konsiderevoli fin-natura, l-iskala u
l-effetti tal-inugwaljanzi edukattivi fost ir-reġjuni tal-
UE. Is-soluzzjonijiet politiċi għandhom jiġu mfassla
apposta aktar milli jkunu ta' natura ġenerika.
Bħalissa qed tinġabar dejta fuq il-livell subreġjonali u
fil-livell ta’ skejjel u klassijiet individwali fi ħdan l-Istati
Membri, iżda hemm bżonn ta’ koordinazzjoni aħjar u
li din id-dejta ssir disponibbli fid-dominju pubbliku.
Il-kompilazzjoni ta’ dejta diżaggregata
ġeografikament dwar l-inugwaljanza fl-edukazzjoni
tista’ tkun strument importanti għad-
deċentralizzazzjoni u l-emanċipazzjoni lokali. Din
tiġġenera informazzjoni ta’ relevanza lokali. Tista’
tgħin lill-iskejjel, l-organizzazzjonijiet komunitarji u l-
livelli kollha tal-gvern biex jipparteċipaw fi ppjanar u
politika msejsa fuq l-evidenza.
Id-disparitajiet ġeografiċi tal-opportunitajiet u l-eżiti
edukattivi jirriflettu inugwaljanzi usa'. Il-miżuri tal-
politika edukattiva waħedhom mhumiex biżżejjed. Il-
politiki li jindirizzaw l-għeruq tal-faqar u tal-aspetti
żvantaġġanti relatati x'aktarx li jirnexxu aktar minn
interventi ta' politika purament edukattiva fil-mod kif
jinfluwenzaw ix-xejriet kumplessivi tal-inugwaljanza
edukattiva reġjonali.
224 Ara t-Tabella 4.46, p. 150.
EDUCATION INEQUALITY ACROSS EU REGIONS
43
Samenvatting
In het kort: ondanks de toezeggingen van de
EU-lidstaten dat zij de kansengelijkheid in onderwijs en
opleiding zouden bevorderen, blijven er zowel tussen
maar ook binnen de EU-lidstaten grote geografische
verschillen in onderwijskansen en -resultaten bestaan.
Dit verslag geeft een beeld van de regionale ongelijkheden
binnen de afzonderlijke EU-lidstaten wat de onderwijs-
kansen en –resultaten betreft. Beoogd wordt de
beleidsmakers te ondersteunen in hun inspanningen om
doeltreffende maatregelen te nemen die deze verschillen
moeten wegwerken. Het bevat meer dan 100 kaarten die
de ongelijkheden helpen visualiseren. Voor elk van de
indicatoren die erin aan bod komen, noemt het verslag de
10 EU-regio's die respectievelijk het best en het slechtst
scoren. Dit zijn de belangrijkste boodschappen:
Ongelijkheden op het gebied van onderwijs in de
verschillende regio's van de EU
De onderwijskansen en –resultaten verschillen
aanzienlijk tussen de EU-regio's. De verschillen in
prestaties zijn tussen de regio's van eenzelfde lidstaat
vaak minstens zo groot als en soms zelfs groter dan
tussen verschillende lidstaten.
De regio's met de hoogste percentages personen met
lage formele kwalificaties ("hoogstens lager
middelbaar onderwijs") bevinden zich vooral in Zuid-
Europa en in het bijzonder in Portugal en Spanje. De
regio's waar de bevolking hoger gekwalificeerd is,
bevinden zich daarentegen vooral in het VK en in
Midden- en Oost-Europa225.
De regio's waar het grootste percentage van de
bevolking tertiair onderwijs heeft genoten, bevinden
zich vooral in het Verenigd Koninkrijk, België en
Nederland, maar ook in Noord-Spanje en in Cyprus.
De regio's met de laagste percentages daarentegen
bevinden zich in Italië, Portugal, en in het midden en
het oosten van de EU226.
De EU-regio's met de hoogste percentages
"leerlingen en studenten in alle onderwijsniveaus als
percentage van de totale bevolking" zijn
geconcentreerd in het noorden en westen van de EU,
en in het bijzonder in Finland en Zweden, maar ook in
België en Ierland. De regio's met de laagste
percentages bevinden zich vooral in het oosten van
Duitsland, in het noorden van Italië en in het
zuidoosten van Europa, maar ook in het noordwesten
van Spanje en in Portugal227.
225
Zie de tabellen 3.17 en 3.18 en figuur 3.9 (blz. 83-84). 226
Zie figuur 3.11 en de tabellen 3.21 en 3.22 (blz.85-86). 227
Zie figuur 3.1 en de tabellen 3.2 en 3.3 (blz. 75).
De regio's met de hoogste percentages "leerlingen in
het lager en lager middelbaar onderwijs als
percentage van de totale bevolking" bevinden zich in
Ierland, Portugal, Zuid-Spanje, maar ook in
Nederland, Denemarken en Zuid-Zweden. De laagste
percentages daarentegen komen voor in Noord-Italië
en Zuidoost-Europa228.
De regio's met de hoogste percentages "leerlingen en
studenten in het hoger middelbaar en postsecundair
niet-tertiair onderwijs in procent van de bevolkings-
groep 15-24 jaar" bevinden zich vooral in Italië,
België, Zweden en Finland, terwijl de regio's met de
laagste percentages zich in Griekenland, Spanje,
Portugal, Roemenië, Bulgarije en Frankrijk
bevinden229.
De regio's met de hoogste percentages personen met
"hoogstens hoger middelbaar en postsecundair niet-
tertiair onderwijs" bevinden zich hoofdzakelijk in
Midden- en Oost-Europa, terwijl de regio's met de
laagste percentages zich meestal in Zuid-Europa
bevinden230.
Er zijn in de EU grote regionale verschillen wat de
participatie van volwassenen in een leven lang leren
betreft. Het Verenigd Koninkrijk, Denemarken,
Finland en Zweden hebben het hoogste aantal regio's
met een hoge participatie in een leven lang leren,
terwijl de meeste regio's met een heel lage
participatie in een leven lang leren zich in Zuidoost-
Europa bevinden231.
Naar gelang van de EU-regio zijn er aanzienlijke
verschillen in de "geografische toegankelijkheid" van
het tertiair onderwijs232. De regio's met de beste
"geografische toegankelijkheid" bevinden zich
hoofdzakelijk in Duitsland, het Verenigd Koninkrijk en
Nederland. De meeste regio's met de laagste scores
voor "geografische toegankelijkheid" van het tertiair
onderwijs233 bevinden zich daarentegen in Zuidoost-
Europa, het noorden van Zweden en van Finland, de
Baltische Staten, Spanje, Denemarken en Frankrijk.
Regionale verschillen binnen de EU-lidstaten
Wat de regionale verschillen binnen elke EU-lidstaat
betreft, gemeten aan de hand van het verschil tussen
de hoogste en de laagste regionale waarden voor
elke indicator234, vertoont Roemenië het grootste
regionale verschil voor de indicator "leerlingen en
studenten in alle onderwijsniveaus in procent van de
totale bevolking". Het wordt op de voet gevolgd door
228
Zie figuur 3.3 en de tabellen 3.6 en 3.7 (blz. 77). 229
Zie figuur 3.4 en de tabellen 3.8 en 3.9 (blz. 78). 230
Zie figuur 3.10 en de tabellen 3.19 en 3.20 (blz. 84-85). 231
Zie figuur 3.2 en de tabellen 3.4 en 3.5 (blz. 76). 232
Zie figuur 3.6 en tabel 3.12 (blz. 80-81). 233
Het percentage van de totale bevolking van een regio dat op meer dan 60 minuten van de dichtstbijzijnde universiteit woont. 234
De verschillende indicatoren zijn opgenomen in tabel 3.1, blz. 74.
EDUCATION INEQUALITY ACROSS EU REGIONS
44
Tsjechië, België en Spanje. Ierland heeft de laagste
waarde (het land telt slechts twee regio's). Ook
Denemarken, Zweden, Hongarije en Polen blijken
relatief kleine verschillen te kennen tussen de
regionale maximum- en minimumwaarde voor deze
indicator235.
Voor de indicator "participatie van volwassenen in
een leven lang leren" vertoont het Verenigd
Koninkrijk veruit de grootste variatie: de discrepantie
tussen de regio met de hoogste waarde (het centrum
van Londen, 16,1 %) en de regio met de laagste
waarde (Noord-Ierland, 5,7 %) bedraagt er 10,4 %.
Slowakije en Denemarken vertonen eveneens vrij
grote regionale verschillen voor deze waarde236.
België vertoont het grootste verschil tussen zijn
regio's met respectievelijk de hoogste en de laagste
waarde voor "leerlingen en studenten in het hoger
middelbaar en postsecundair niet-tertiair onderwijs
(ISCED 3-4) als percentage van de bevolkingsgroep
15-24 jaar".
In een aantal lidstaten zijn er grote verschillen tussen
de regio's voor de indicator "studenten in het tertiair
onderwijs als percentage van de bevolkingsgroep 15-
24 jaar". De kloof is het grootst in België, onmiddellijk
gevolgd door Tsjechië en Oostenrijk. Voorts vertonen
ook Griekenland, Italië en Roemenië tussen hun
regio's met respectievelijk de hoogste en de laagste
waarden voor deze indicator grote kloven van zelfs
meer dan 80 %. In de meeste gevallen is dit toe te
schrijven aan het overwicht van de hoofdstedelijke
regio wat de kansen op tertiair onderwijs betreft237.
Spanje vertoont de grootste kloof tussen zijn regio's
met respectievelijk de hoogste en de laagste waarde
wat het aantal personen betreft dat op meer dan 60
minuten van de dichtstbijzijnde universiteit woont, en
wordt onmiddellijk gevolgd door Griekenland. Finland
komt op de derde en Bulgarije op de vierde plaats.
Acht EU-lidstaten vertonen voor het aantal
afgestudeerden in het tertiair onderwijs een verschil
van meer dan 15 % tussen hun regio's met
respectievelijk de hoogste en de laagste waarde. Het
Verenigd Koninkrijk is het land met de grootste kloof
(23,4 %), gevolgd door Frankrijk (21,3 %), België
(19,4 %), Tsjechië (18,7 %), Spanje (17,5 %), Slowakije
(17 %) en Roemenië (15,4 %). Voor deze indicator is
de kloof relatief kleiner in Ierland, Italië, Slovenië,
Portugal, Finland en Oostenrijk (telkens minder dan
10 %)238.
Wat het aantal personen met lage onderwijs-
kwalificaties ("hoogstens lager middelbaar
onderwijs") betreft, zijn in Frankrijk de verschillen
235
Zie tabel 4.45, blz. 150. 236
Zie tabel 4.45, blz. 150. 237
Zie tabel 4.45, blz. 150. 238
Zie tabel 4.46, blz. 150.
tussen de regio met de hoogste en de regio met de
laagste waarde het grootst (een kloof van 27,2 %).
Daarna komen Griekenland, Spanje, Roemenië en
Duitsland. De landen waar de verschillen het kleinst
zijn, zijn Slovenië, Ierland, Slowakije, Oostenrijk en
Finland239.
Andere belangrijke boodschappen
Nationale gemiddelden verbergen vaak
onaangename plaatselijke en regionale situaties.
Regionale verschillen in leren vormen een
belemmering voor een evenwichtige regionale
ontwikkeling en economische groei.
Regionale verschillen in onderwijs versterken de
ongelijkheid tussen EU-regio's. Zij werken ook de
braindrain naar de meer ontwikkelde/rijkere regio's
in de hand.
Er is heel wat variatie in de aard, de schaal en de
effecten van ongelijkheden op onderwijsgebied in de
verschillende EU-regio's. De beleidsoplossingen
mogen niet algemeen zijn, maar moeten op maat
gesneden zijn.
Binnen de lidstaten worden momenteel gegevens op
subregionaal niveau en op het niveau van individuele
scholen en klassen verzameld, maar er is behoefte
aan meer coördinatie. Ook moeten deze gegevens
publiek beschikbaar worden.
De compilatie van gegevens over ongelijkheden op
onderwijsgebied die per regio worden uitgesplitst,
kan voor een regio een belangrijk instrument zijn
voor decentralisatie en om voor zijn rechten op te
komen. Het genereert informatie die voor het lokale
niveau relevant is. Het reikt scholen, maat-
schappelijke organisaties en alle beleidsniveaus feiten
aan waarop zij hun planning en beleid kunnen
baseren.
Ruimtelijke ongelijkheden in onderwijskansen en –
resultaten weerspiegelen bredere ongelijkheden.
Beleidsmaatregelen op onderwijsgebied alleen
volstaan niet. Beleidsmaatregelen die armoede en
daarmee verband houdende aspecten van
achterstelling bij de wortel aanpakken, hebben meer
kans op succes dan maatregelen die enkel op
onderwijs gericht zijn – wanneer het erop aankomt
algemene patronen van regionale ongelijkheden op
onderwijsgebied te beïnvloeden.
239
Zie tabel 4.46, blz. 150.
EDUCATION INEQUALITY ACROSS EU REGIONS
45
Streszczenie
W skrócie: Pomimo zobowiązania się państw członkowskich UE do promowania równości szans w zakresie kształcenia i szkoleń, nadal utrzymują się wielkie geograficzne różnice w możliwościach edukacyjnych i osiąganych rezultatach zarówno między poszczególnymi państwami, jak i wewnątrz państw członkowskich UE.
Niniejsze sprawozdanie opisuje regionalne nierówności wewnątrz państw UE w dziedzinie możliwości edukacyjnych i osiąganych rezultatów. Celem sprawozdania jest wsparcie decydentów w wysiłkach na rzecz opracowania skutecznych środków w celu zlikwidowania tych różnic. Zawiera ono ponad 100 map, które pomagają zobrazować nierówności. Określa ono dziesięć przodujących regionów UE dla każdego z badanych wskaźników i dziesięć regionów o najgorszych wynikach. Kluczowe kwestie jego przesłania to:
Nierówności w edukacji we wszystkich regionach UE
Między regionami UE istnieją znaczne różnice w możliwościach edukacyjnych i osiąganych rezultatach. Różnice w osiąganych wynikach wewnątrz poszczególnych państw w porównaniu z różnicami między państwami są często co najmniej równie duże, a nawet większe.
Regiony z najwyższym odsetkiem osób o niskich kwalifikacjach („co najwyżej wykształcenie niższe niż podstawowe, podstawowe lub średnie I stopnia”) znajdują się głównie w Europie Południowej, szczególnie w Portugalii i Hiszpanii. Regiony, gdzie ludność posiada wysokie kwalifikacje znajdują się natomiast głównie w Zjednoczonym Królestwie, jak również w Europie Środkowej i Wschodniej240.
Regiony z najwyższym odsetkiem osób posiadających wyższe wykształcenie można znaleźć głównie w Zjednoczonym Królestwie, Belgii i Holandii, ale również w północnej Hiszpanii i na Cyprze. Regiony o najniższych wskaźnikach znajdują się natomiast we Włoszech, Portugalii oraz w centralnej i wschodniej części UE241.
Regiony UE o najwyższym wskaźniku „uczniów i studentów na wszystkich poziomach kształcenia, liczonym jako odsetek całej populacji” koncentrują się w północnej i zachodniej części UE, zwłaszcza w Finlandii, Szwecji, ale także w Belgii i Irlandii. Regiony o najniższych wskaźnikach znajdują się głównie na wschodzie Niemiec, na północy Włoch i w południowo-wschodniej Europie, ale również w północno-zachodniej Hiszpanii i Portugalii242.
240
Zob. tabele 3.17-3.18 i rysunek 3.9. (s. 83 – 84). 241
Zob. wykres 3.11; Tabele 3.21 i 3.22 (s.85-86). 242
Zob. rys. 3.1 i tabele 3.2 i 3.3 (s. 75).
Regiony o najwyższym wskaźniku „uczniów szkół podstawowych i średnich I stopnia, liczonym jako odsetek całej populacji” znaleźć można w Republice Irlandii, w Portugalii, w południowej Hiszpanii, ale również w Niderlandach, w Danii i w południowej Szwecji. Najniższe wskaźniki odnotowano natomiast na północy Włoch i w Europie Południowo-Wschodniej243.
Regiony o najwyższym wskaźniku „uczniów i studentów szkół średnich II stopnia i policealnych, liczonym jako odsetek populacji w wieku 15 – 24 lat” znaleźć można głównie we Włoszech, Belgii, Szwecji i Finlandii, natomiast większość regionów o wskaźniku najniższym znajduje się w Grecji, Hiszpanii, Portugalii, Rumunii, Bułgarii i Francji244.
Regiony o najwyższym wskaźniku osób z "ukończoną, co najwyżej szkołą średnią II stopnia lub policealną" znajdują się głównie w Europie Środkowej i Wschodniej, natomiast regiony o najniższym wskaźniku występują głównie w Europie Południowej245.
W UE istnieją duże dysproporcje regionalne w dziedzinie uczestnictwa dorosłych w uczeniu się przez całe życie. Zjednoczone Królestwo , Dania, Finlandia i Szwecja mają najwięcej regionów z wysokim poziomem uczestnictwa w procesie uczenia się przez całe życie, natomiast większość regionów, w których ten poziom jest bardzo niski, leży w Europie Południowo-Wschodniej246.
Pomiędzy regionami UE istnieją znaczne różnice w dostępności geograficznej do szkolnictwa wyższego247. Regiony o najlepszej dostępności geograficznej znajdują się przede wszystkim w Niemczech, Zjednoczonym Królestwie i Holandii. Natomiast większość regionów o najniższej punktacji pod względem dostępności geograficznej do szkolnictwa wyższego248 leży w Europie Południowo-Wschodniej, północnej Szwecji i Finlandii, państwach bałtyckich, Hiszpanii, Danii i Francji.
Dysproporcje regionalne wewnątrz państw członkowskich UE
Jeśli wziąć pod uwagę różnice regionalne w każdym państwie członkowskim UE mierzone jako różnica między największą i najmniejszą wartością na poziomie regionalnym dla każdego badanego wskaźnika249, Rumunia ma największe regionalne zróżnicowanie w odniesieniu do wskaźnika „uczniów i studentów na wszystkich szczeblach edukacji, liczonego jako odsetek łącznej liczby ludności”.
243
Zob. rys. 3.3 i tabele 3.6 i 3.7 (s. 77). 244
Zob. rys. 3.4 i tabele 3.8 i 3.9 (s. 78). 245
Zob. wykres 3.10; Tabele 3.19 i 3.20 (s. 84-85). 246
Zob. rys. 3.2 i tabele 3.4 i 3.5 (s. 76). 247
Zob. wykres 3.6; Tabela 3.12 (s. 80-81). 248
Odsetek całkowitej liczby ludności regionu mieszkającej ponad 60 minut od najbliższego uniwersytetu. 249
Badane wskaźniki dostępne są w tabeli 3.1, s. 74.
EDUCATION INEQUALITY ACROSS EU REGIONS
46
Nieznacznie mniejsze regionalne zróżnicowanie występuje w Republice Czeskiej, Belgii i Hiszpanii. Na drugim końcu plasuje się Republika Irlandii z najniższym wskaźnikiem (pamiętać jednak należy, że posiada ona tylko dwa regiony). Również w Danii, Szwecji, na Węgrzech i w Polsce różnice między najwyższą a najniższą regionalną wartością tego wskaźnika250 wydają się być stosunkowo niewielkie.
Jeśli chodzi o wskaźnik „uczestnictwo dorosłych w uczeniu się przez całe życie”, największe regionalne zróżnicowanie występuje zdecydowanie w Zjednoczonym Królestwie, z różnicą wynoszącą 10,4 % między regionem o najwyższej wartości - Inner London (16,1 %), a regionem o najniższej wartości - Irlandia Północna, (5,7 %). Również w Słowacji i w Danii istnieją względnie duże dyspro-porcje regionalne w odniesieniu do tej zmiennej251.
W Belgii odnotowano największą różnicę między najwyższymi i najniższymi regionalnymi wartościami wskaźnika „uczniowie i studenci szkół średnich II stopnia i policealnych (ISCED 3-4) jako procent ogółu populacji w wieku 15 – 24 lat”.
W niektórych państwach członkowskich istnieją duże różnice między regionami dla wskaźnika „studenci wyższych uczelni jako procent ludności w wieku 20-24 lat”. Największą taka różnica występuje w Belgii, a nieznacznie mniejsze różnice odnotowano w Republice Czeskiej i w Austrii. Również w Grecji, we Włoszech i w Rumunii odnotowano znaczne różnice dla tego wskaźnika, dochodzące nawet do ponad 80 % między regionami o najwyższych i najniższych wartościach. W większości tych przypadków jest to wynik dominacji regionu stołecznego w dziedzinie szkolnictwa wyższego252.
Największą różnicę między regionami o najwyższych i najniższych wartościach co do liczby osób żyjących w miejscach oddalonych o ponad 60 minut drogi od najbliższego uniwersytetu odnotowano w Hiszpanii, nieznacznie mniejsze różnice pod tym względem odnotowano kolejno w Grecji, Finlandii i Bułgarii.
Osiem państw członkowskich UE wykazuje różnicę wynoszącą ponad 15 %, między przodującymi i znajdującymi się najniżej w klasyfikacji regionami w zakresie liczby absolwentów szkół wyższych w danym regionie. Państwem o największej dysproporcji (23,4 %) jest Zjednoczone Królestwo, a kolejne miejsca zajmują: Francja (21,3 %), Belgia (19,4 %), Republika Czeska (18,7 %), Hiszpania (17,5 %), Słowacja (17 %) i Rumunia (15,4 %). Różnica między wartościami tej zmiennej jest stosunkowo mniejsza w Irlandii, we Włoszech, w Słowenii, Portugalii, Finlandii i Austrii (we wszystkich poniżej 10 %)253.
250
Zob. tabela 4.45, s. 150. 251
Zob. tabela 4.45, s. 150. 252
Zob. tabela 4.45, s. 150. 253
Zob. tabela 4.46, s. 150.
Biorąc pod uwagę liczbę osób o niskim poziomie wykształcenia ("co najwyżej niższe niż podstawowe, podstawowe i średnie II stopnia"), największe rozbieżności między przodującymi i znajdującymi się najniżej w klasyfikacji regionami odnotowano we Francji (27,2 %), a za nią plasują się Grecja, Hiszpania, Rumunia i Niemcy. Natomiast państwa o najmniejszych różnicach to Słowenia, Irlandia, Słowacja, Austria i Finlandia254.
Inne ważne przesłania
Za średnimi krajowymi często kryją się negatywne realia lokalne i regionalne.
Regionalne dysproporcje w kształceniu utrudniają zrównoważony rozwój regionalny i wzrost gospodarczy.
Regionalne dysproporcje w edukacji potęgują nierówności między regionami UE. Stymulują one również drenaż mózgów w kierunku bardziej rozwiniętych/bogatszych regionów.
We wszystkich regionach UE istnieje znaczne zróżnicowanie pod względem charakteru, skali i skutków nierówności edukacyjnych. Rozwiązania polityczne muszą raczej być dostosowywane do konkretnych przypadków, a nie standardowe.
W państwach członkowskich gromadzone są obecnie dane na szczeblu podregionu oraz na poziomie poszczególnych szkół i klas, konieczna jest jednak lepsza koordynacja oraz dostępność tych danych na forum publicznym.
Opracowywanie zdezagregowanych pod względem geograficznym danych na temat nierówności edukacyjnych może być ważnym narzędziem zwiększania kompetencji na szczeblu lokalnym i decentralizacji. Generuje ono informacje o ważnym znaczeniu lokalnym. Może ono pomóc szkołom, organizacjom społecznym i władzy na wszystkich szczeblach w planowaniu i prowadzeniu polityki na podstawie faktów.
Różnice geograficzne dotyczące szans edukacyjnych i osiąganych wyników odzwierciedlają szerszy zakres nierówności. Stosowanie w dziedzinie edukacji samych środków politycznych nie jest wystarczające. Polityka podejmująca u źródeł walkę z ubóstwem oraz powiązanymi z nim aspektami nierówności społecznej może być bardziej skuteczna w celu poprawy ogólnego stanu regionalnych nierówności w edukacji, niż czysto polityczne działania w tej dziedzinie.
254
Zob. tabela 4.46, s. 150.
EDUCATION INEQUALITY ACROSS EU REGIONS
47
Síntese
Resumo: Apesar dos compromissos assumidos pelos
Estados-Membros da UE para promover a equidade nos
sistemas de educação e formação, continuam a verificar-
se grandes disparidades geográficas nas oportunidades e
nos resultados educativos entre os Estados-Membros da
UE e no interior de cada um deles.
O presente relatório traça uma panorâmica das
desigualdades regionais existentes nos países da UE, em
termos de oportunidades e resultados educativos. É seu
objetivo apoiar os esforços dos responsáveis políticos para
corrigir eficazmente estas diferenças. Contém mais de 100
mapas que permitem visualizar as desigualdades e
identifica as 10 regiões mais avançadas e as 10 menos
avançadas relativamente a cada um dos indicadores
examinados. As principais conclusões são:
Desigualdades na educação entre as regiões da União
Europeia
Existem grandes desigualdades entre as
oportunidades e os resultados educativos das regiões
da UE. As diferenças nos resultados a nível nacional
são frequentemente tão grandes ou maiores que as
diferenças internacionais.
As regiões com as percentagens mais elevadas de
pessoas com reduzidas qualificações formais (pelo
menos, educação pré-escolar, básica e secundária)
são sobretudo as do sul da Europa e, em especial, em
Portugal e Espanha. Em contrapartida, as regiões
onde as pessoas são mais qualificadas são sobretudo
as do Reino Unido, bem como da Europa Central e
Oriental255.
As regiões com as percentagens mais elevadas de
pessoas com habilitações superiores situam-se
sobretudo no Reino Unido, na Bélgica e nos Países
Baixos, mas também no norte de Espanha e em
Chipre. Em contrapartida, as regiões com as taxas
mais baixas registam-se em Itália, Portugal, e UE
central e oriental256.
As regiões da UE com as taxas mais elevadas de
«alunos e estudantes em todos os níveis do sistema
educativo em percentagem da população total»
estão concentradas no norte e oeste da UE,
especialmente Finlândia, Suécia, e mesmo Bélgica e
Irlanda. As regiões com as taxas mais baixas
encontram-se principalmente no leste da Alemanha,
no norte de Itália e sudeste da Europa, mas também
no noroeste de Espanha e Portugal257.
255
Ver quadros 3.17-3.18 e gráfico 3.9 (pp. 83-84). 256
Ver gráfico 3.11. Quadros 3.21 e 3.22 (pp.85-86). 257
Ver gráfico 3.1 e quadros 3.2 e 3.3 (p. 75).
As regiões com as percentagens mais elevadas de
«alunos no ensino primário e secundário inferior em
percentagem da população total» situam-se na
República da Irlanda, em Portugal e no sul de
Espanha, mas também nos Países Baixos, na
Dinamarca e no sul da Suécia. Em contrapartida, as
taxas mais baixas observam-se no norte de Itália e
sudeste da Europa258.
As regiões com as percentagens mais elevadas de
«alunos e estudantes no ensino secundário e pós-
secundário não superior em percentagem da
população com idade entre os 15-24 anos»
encontram-se principalmente em Itália, Bélgica,
Suécia e Finlândia, ao passo que a maioria das regiões
com as taxas mais baixas se encontram na Grécia,
Espanha, Portugal, Roménia, Bulgária e França259.
As regiões com as percentagens mais elevadas de
pessoas com «no máximo, o ensino secundário e pós-
secundário não superior» situam-se sobretudo na
Europa central e oriental, enquanto as regiões com as
taxas mais baixas se registam sobretudo no sul da
Europa260.
Na UE, existem grandes diferenças regionais em
termos de participação dos adultos na aprendizagem
ao longo da vida. O Reino Unido, a Dinamarca, a
Finlândia e a Suécia têm o maior número de regiões
com forte participação na aprendizagem ao longo da
vida, enquanto a maioria das regiões com taxas de
participação muito baixas neste tipo de
aprendizagem se situam no sudeste da Europa261.
Há diferenças significativas de «acessibilidade
geográfica» ao ensino superior entre as regiões da
UE262. As regiões com a melhor «acessibilidade
geográfica» são, na sua maioria, da Alemanha, do
Reino Unido e dos Países Baixos. Em contrapartida, a
maioria das regiões com os resultados mais baixos de
«acessibilidade geográfica» ao ensino superior263
situam-se no sudeste da Europa, no norte da Suécia e
Finlândia, nos Estados bálticos, em Espanha, na
Dinamarca e em França.
Disparidades regionais no interior dos Estados-Membros
da UE
Se tivermos em conta as disparidades regionais
existentes dentro de cada Estado-Membro da UE,
medidas pela diferença entre os valores regionais
máximos e mínimos de cada indicador analisado264, a
258
Ver gráfico 3.3 e quadros 3.6 e 3.7 (p. 77). 259
Ver gráfico 3.4 e quadros 3.8 e 3.9 (p. 78). 260
Ver gráfico 3.10. quadros 3.19 e 3.20 (pp. 84-85). 261
Ver gráfico 3.2 e quadros 3.4 e 3.5 (p.76). 262
Ver gráfico 3.6 e quadro 3.12 (pp.80-81). 263
Percentagem da população total de uma região que vive a mais de 60 minutos da universidade mais próxima. 264
Os indicadores analisados encontram-se referidos no quadro 3.1, p. 74.
EDUCATION INEQUALITY ACROSS EU REGIONS
48
Roménia tem a maior disparidade regional no que
respeita ao indicador «alunos e estudantes de todos
os níveis de ensino em % da população total»,
seguida de perto pela República Checa, a Bélgica e a
Espanha. No outro extremo, a República da Irlanda
apresenta os mais baixos números (mas note-se que
tem apenas duas regiões). A Dinamarca, a Suécia, a
Hungria e a Polónia também apresentam diferenças
relativamente pequenas entre o valor regional
máximo e mínimo deste indicador265.
Tendo em conta o indicador «participação dos
adultos na aprendizagem ao longo da vida», o Reino
Unido tem, de longe, a maior disparidade regional,
apresentando em Inner London (16,1 %) o valor mais
elevado e na Irlanda do Norte (5,7 %) o mais baixo. A
Eslováquia e a Dinamarca também apresentam
grandes disparidades regionais no que respeita a esta
variável266.
A Bélgica tem a maior diferença entre as regiões mais
avançadas e mais atrasadas, em termos de «alunos e
estudantes no ensino secundário e pós-secundário
não superior (CITE 3-4) em percentagem da
população com idade entre os 15-24 anos».
Alguns Estados-Membros têm grandes diferenças
entre regiões, no que toca ao indicador «estudantes
no ensino superior em percentagem da população
entre 20-24 anos». A Bélgica regista a maior
diferença, seguida de perto pela República Checa e a
Áustria. Além disso, a Grécia, a Itália e a Roménia
registam disparidades consideráveis no que toca a
este indicador, com uma diferença superior a 80 %
entre as regiões do topo e da base da tabela. Na
maior parte dos casos, tal é o resultado da
dominância da região da capital em termos de
oportunidades de ensino superior267.
A Espanha apresenta a maior diferença entre as
regiões mais e menos avançadas em termos do
número de pessoas que vivem a mais de 60 minutos
de distância da universidade mais próxima, seguida
de perto pela Grécia, a Finlândia, em terceiro lugar, e
a Bulgária, em quarto.
Oito Estados-Membros da UE registam uma diferença
superior a 15 pontos percentuais entre as regiões
mais e menos avançadas, em termos de número de
diplomados do ensino superior. O Reino Unido é o
país com a maior diferença (23,4 %), seguido de
França (21,3 %), Bélgica (19,4 %), República Checa
(18,7 %), Espanha (17,5 %), Eslováquia (17 %) e
Roménia (15,4 %). A diferença apresentada por esta
variável é relativamente mais pequena na Irlanda,
265
Ver quadro 4.45, p. 150. 266
Ver quadro 4.45, p. 150. 267
Ver quadro 4.45, p. 150.
Itália, Eslovénia, Portugal, Finlândia e Áustria (todos
abaixo de 10 %)268.
Em termos do número de pessoas com poucas
habilitações (no máximo, educação pré-escolar,
básica e secundária), França apresenta a maior
diferença (27,2 %) entre as suas regiões, seguida pela
Grécia, Espanha, Roménia e Alemanha. Em
contrapartida, os países com a diferença mais
pequena são a Eslovénia, Irlanda, Eslováquia, Áustria
e Finlândia269.
Outras conclusões importantes
As médias nacionais escondem muitas vezes
realidades locais e regionais difíceis.
As disparidades regionais em termos de educação
impedem o desenvolvimento regional equilibrado e o
crescimento económico.
As disparidades regionais em termos de educação são
uma componente das desigualdades entre as regiões
da UE. Por outro lado, alimentam a fuga de cérebros
para as regiões mais desenvolvidas/ricas.
Existe uma variação considerável na natureza, na
escala e nos efeitos das desigualdades, em termos de
educação, consoante as regiões da União Europeia.
As soluções políticas devem ser especificamente
adaptadas e não genéricas.
Os dados ao nível sub-regional, bem como ao nível
das escolas e salas de aulas individuais estão
atualmente a ser recolhidos nos Estados-Membros,
mas carecem de mais coordenação e divulgação.
A compilação de dados discriminados
geograficamente sobre as desigualdades educativas
pode ser um instrumento importante para a
responsabilização local e a descentralização. Gera
informações pertinentes ao nível local. Pode ajudar as
escolas, as organizações comunitárias e os governos,
a todos os níveis, a fazer planeamento e política com
bases concretas.
As disparidades entre locais, em termos de
oportunidades e resultados educativos, refletem
desigualdades bem mais vastas. As medidas relativas
à política de ensino não são suficientes só por si. As
políticas que combatem a pobreza e os seus efeitos
na fonte são suscetíveis de ter mais impacto nas
desigualdades educativas regionais do que as meras
intervenções de política educativa.
268
Ver quadro 4.6, p. 150. 269
Ver quadro 4.6, p. 150.
EDUCATION INEQUALITY ACROSS EU REGIONS
49
Rezumat
Pe scurt: În pofida angajamentelor asumate de statele membre ale UE în vederea promovării echității în domeniul educației și formării profesionale, continuă să existe disparități geografice mari în ceea ce privește oportunitățile și rezultatele educaționale, de la un stat membru la altul, dar și pe teritoriul aceluiași stat membru.
Prezentul raport oferă o imagine a inegalităților regionale intra-naționale la nivelul oportunităților și rezultatelor educaționale din UE. Scopul său este de a sprijini factorii de decizie în eforturile lor de a concepe măsuri eficiente pentru a remedia aceste disparități. Raportul conține peste 100 de hărți care permit vizualizarea inegalităților. El identifică un top al primelor 10 și al ultimelor 10 regiuni ale UE cu privire la fiecare dintre indicatorii examinați. Mesajele esențiale sunt următoarele:
Inegalități în materie de educație între regiunile din UE
Există inegalități considerabile între regiunile din UE în ceea ce privește oportunitățile și rezultatele educaționale. Diferențele intra-naționale în materie de performanțe sunt în mod frecvent cel puțin la fel de mari, și adesea mult mai mari, în comparație cu diferențele inter-naționale.
Regiunile care înregistrează proporția cea mai ridicată de persoane cu un nivel scăzut de calificare formală („cel mult învățământ preșcolar, primar sau secundar inferior”) se situează, în cea mai mare parte, în Europa de Sud și, în special, în Portugalia și Spania. În schimb, regiunile în care oamenii dispun de un nivel superior de calificare se situează, în cea mai mare parte, în Regatul Unit, precum și în Europa Centrală și de Est270.
Regiunile care înregistrează proporția cea mai ridicată de persoane cu calificări în învățământul terțiar se situează, în cea mai mare parte, în Regatul Unit, Belgia și Țările de Jos, dar și în nordul Spaniei și în Cipru. În schimb, regiunile cu proporția cea mai scăzută se situează în Italia, Portugalia și în centrul și estul Uniunii Europene271.
Regiunile UE cu proporția cea mai ridicată de „elevi și studenți înscriși la toate nivelurile de învățământ, ca procentaj din populația totală” sunt concentrate în nordul și vestul UE, în special în Finlanda, Suedia, dar și în Belgia și Irlanda. Regiunile care înregistrează proporția cea mai scăzută se situează, în special, în partea de est a Germaniei, în nordul Italiei și în Europa de Sud-Est, dar și în nord-vestul Spaniei și în Portugalia272.
Regiunile care înregistrează proporția cea mai ridicată de „elevi înscriși în învățământul primar și secundar
270
A se vedea tabelele 3.17-3.18 și figura 3.9 (pp. 83-84). 271
A se vedea figura 3.11, tabelele 3.21 și 3.22 (pp.85-86). 272
A se vedea figura 3.1 și tabelele 3.2 și 3.3 (p. 75).
inferior, ca procentaj din populația totală” se situează în zone din Irlanda, Portugalia, sudul Spaniei, dar și în Țările de Jos, Danemarca și în sudul Suediei. În schimb, proporția cea mai scăzută se observă în nordul Italiei și în Europa de Sud-Est273.
Regiunile cu proporția cea mai ridicată de „elevi și studenți înscriși în învățământul secundar superior și în învățământul postsecundar neuniversitar, ca procentaj din populația cu vârsta cuprinsă între 15 și 24 de ani” se situează, în cea mai mare parte, în Italia, Belgia, Suedia și Finlanda, în timp ce majoritatea regiunilor cu proporția cea mai scăzută se află în Grecia, Spania, Portugalia, România, Bulgaria și Franța274.
Regiunile cu proporția cea mai ridicată de persoane cu studii de „cel mult învățământ secundar superior și învățământ postsecundar neuniversitar” se află, în cea mai mare parte, în Europa Centrală și de Est, în timp ce regiunile cu proporția cea mai scăzută se situează, în cea mai mare parte, în Europa de Sud275.
Există disparități regionale mari în UE în ceea ce privește participarea adulților la învățarea pe tot parcursul vieții. Regatul Unit, Danemarca, Finlanda și Suedia au cel mai mare număr de regiuni cu o participare puternică la procesul de învățare pe tot parcursul vieții, în timp ce majoritatea regiunilor care înregistrează un nivel de participare foarte redus la procesul de învățare pe tot parcursul vieții se află în Europa de Sud- Est276.
Există diferențe semnificative între regiunile din UE în ceea ce privește „accesibilitatea geografică” la învățământul terțiar277. Regiunile cu cea mai bună "accesibilitate geografică” se află, în principal, în Germania, Regatul Unit și Țările de Jos. În schimb, majoritatea regiunilor cu cele mai slabe rezultate obținute la capitolul „accesibilitate geografică” la învățământul terțiar278 se situează în Europa de Sud-Est, partea de nord din Suedia și Finlanda, statele baltice, Spania, Danemarca și Franța.
Disparitățile regionale de pe teritoriul fiecărui stat membru al UE
Luând în considerare disparitățile regionale de pe teritoriul fiecărui stat membru al UE, măsurate prin calcularea diferenței dintre valorile regionale maxime și valorile minime pentru fiecare indicator analizat279, România cunoaște cele mai mari disparități regionale în ceea ce privește indicatorul „elevi și studenți înscriși la toate nivelurile de învățământ, ca % din totalul populației”, urmată îndeaproape de Republica
273
A se vedea figura 3.3 și tabelele 3.6 și 3.7 (p. 77). 274
A se vedea figura 3.4 și tabelele 3.8 și 3.9 (p. 78). 275
A se vedea figura 3.10, tabelele 3.19 și 3.20 (pp. 84-85). 276
A se vedea figura 3.2 și tabelele 3.4 și 3.5 (p. 76). 277
A se vedea figura 3.6, tabelul 3.12 (pp.80-81). 278
% de persoane din populația totală a unei regiuni care locuiesc la peste 60 de minute de cea mai apropiată universitate. 279
Indicatorii analizați sunt prezentați în tabelul 3.1, p. 74.
EDUCATION INEQUALITY ACROSS EU REGIONS
50
Cehă, Belgia și Spania. La capătul opus, Irlanda înregistrează valoarea cea mai mică (însă trebuie remarcat faptul că aceasta are numai două regiuni). Danemarca, Suedia, Ungaria și Polonia par, de asemenea, să înregistreze diferențe relativ mici între valoarea regională maximă și valoarea minimă pentru acest indicator280.
În ceea ce privește indicatorul „participarea adulților la învățarea pe tot parcursul vieții”, Regatul Unit înregistrează, de departe, cele mai mari disparități regionale, diferența între regiunea cu valoarea cea mai ridicată (zona Inner London, 16,1%) și regiunea cu valoarea cea mai redusă (Irlanda de Nord, 5,7%) fiind de 10,4%. Slovacia și Danemarca înregistrează, de asemenea, disparități regionale relativ mari în ceea ce privește această variabilă281.
Belgia cunoaște cea mai mare diferență între regiunile fruntașe și regiunile cu cele mai slabe rezultate în ceea ce privește „elevii și studenții înscriși în învățământul secundar superior și învățământul postsecundar neuniversitar (ISCED 3-4), ca procentaj din populația cu vârsta cuprinsă între 15 și 24 de ani”.
În unele state membre, există diferențe mari între regiuni în ceea ce privește indicatorul „studenți din învățământul terțiar, ca procentaj din populația cu vârsta cuprinsă între 20 și 24 ani”. Belgia înregistrează diferența cea mai accentuată, urmată îndeaproape de Republica Cehă și Austria. În plus, Grecia, Italia și România cunosc discrepanțe mari în ceea ce privește acest indicator, înregistrând o diferență de peste 80% între regiunea fruntașă și regiunea cu cele mai slabe rezultate. În majoritatea cazurilor, aceasta se întâmplă din cauza dominanței regiunii capitalei în ceea ce privește oportunitățile în materie de învățământ terțiar282.
Spania înregistrează cea mai mare diferență între regiunile fruntașe și regiunile cu cele mai slabe rezultate în ceea ce privește numărul de persoane care locuiesc la peste 60 de minute distanță de cea mai apropiată universitate, urmată îndeaproape de Grecia, de Finlanda pe locul al treilea și de Bulgaria pe locul al patrulea.
Opt state membre ale UE înregistrează o diferență de peste 15% între regiunile fruntașe și regiunile cu cele mai slabe rezultate în ceea ce privește numărul de absolvenți de învățământ terțiar dintr-o regiune. Regatul Unit este țara care înregistrează cea mai mare diferență (23,4%), urmată de Franța (21,3%), Belgia (19,4%), Republica Cehă (18,7%), Spania (17,5%), Slovacia (17%) și România (15,4%). Diferența pentru această variabilă este relativ mai mică în Irlanda, Italia, Slovenia, Portugalia, Finlanda și Austria (toate sub 10%)283.
280
A se vedea tabelul 4.45, p. 150. 281
A se vedea tabelul 4.45, p. 150. 282
A se vedea tabelul 4.45, p. 150. 283
A se vedea tabelul 4.46, p. 150.
În ceea ce privește numărul de persoane cu un nivel scăzut de educație („cel mult învățământ preșcolar, primar sau secundar inferior”), Franța înregistrează gradul cel mai înalt de disparitate între regiunile sale fruntașe și regiunile sale cu cele mai slabe rezultate (o diferență de 27,2%), urmată de Grecia, Spania, România și Germania. În schimb, țările care înregistrează gradul cel mai redus de disparitate sunt Slovenia, Irlanda, Slovacia, Austria și Finlanda284.
Alte mesaje esențiale
Mediile naționale adesea ascund realități neplăcute la nivel local și regional.
Disparitățile regionale în ceea ce privește învățarea constituie un obstacol în calea dezvoltării regionale și a creșterii economice.
Disparitățile regionale în domeniul educației înrăutățesc inegalitățile între regiunile UE. Ele contribuie, de asemenea, la „exportul de inteligență” în regiunile mai dezvoltate/mai bogate.
Există o variație considerabilă în ceea ce privește natura, amploarea și efectele inegalităților educaționale între regiunile din UE. Soluțiile politice trebuie să fie mai degrabă adaptate nevoilor locale decât generice.
În cadrul statelor membre sunt colectate, în prezent, date la nivel subregional și la nivelul școlilor individuale și al claselor, însă este nevoie de o mai bună coordonare și este necesar ca aceste date să fie făcute publice.
Compilarea datelor defalcate din punct de vedere geografic privind inegalitățile educaționale poate constitui un instrument important pentru o mai mare responsabilizare la nivel local și pentru descentralizare. Aceasta generează informații relevante la nivel local. Astfel li se poate permite școlilor, organizațiilor comunitare și autorităților de la toate nivelurile să se implice într-un proces de planificare și formulare de politici pe baza unor elemente concrete.
Disparitățile spațiale în ceea ce privește oportunitățile și rezultatele educaționale reflectă inegalități mai mari. Doar măsurile în materie de politică educațională nu sunt suficiente. Este probabil că politicile care combat sărăcia și aspectele legate de defavorizare la rădăcina acestora sunt mai eficiente decât intervențiile care țin numai de politica în domeniul educației în ceea ce privește influențarea structurii globale a inegalității educaționale la nivel regional.
284
A se vedea tabelul 4.46, p. 150.
EDUCATION INEQUALITY ACROSS EU REGIONS
51
Zhrnutie
Krátke zhrnutie: Napriek záväzkom členských štátov EÚ
presadzovať spravodlivosť vo vzdelávaní a v odbornej
príprave, ešte stále pretrvávajú veľké geografické
rozdiely v príležitostiach na vzdelávanie a jeho
výsledkoch medzi členskými štátmi EÚ, ale aj v rámci
nich.
Táto správa vykresľuje vnútroštátne rozdiely v jednotlivých
regiónoch EÚ, čo sa týka príležitostí na vzdelávanie a ich
výsledkov. Jej cieľom je podporiť tvorcov politík v ich
snahách o vytvorenie účinných opatrení na nápravu týchto
rozdielov. Obsahuje viac než 100 máp, ktoré pomáhajú
uvedomiť si tieto nezrovnalosti. Vymedzuje 10 najvyššie
umiestnených regiónov, ako aj 10 najnižšie umiestnených
regiónov pre každý ukazovateľ, ktorý skúma. Jej kľúčové
odkazy sú:
Nerovnosti vo vzdelávaní v regiónoch EÚ
Medzi regiónmi EÚ existujú značné nerovnosti v
príležitostiach na vzdelávanie a jeho výsledkoch.
Vnútroštátne rozdiely v dosahovaní výsledkov vo
vzdelávaní sú často minimálne rovnako veľké, a
mnoho krát ešte väčšie, ako sú rozdiely medzi
jednotlivými krajinami.
Regióny, ktoré majú najvyšší pomer ľudí s nízkym
vzdelaním (predovšetkým so základným vzdelaním a
nižším stredoškolským vzdelaním), sa nachádzajú
väčšinou v južnej Európe, a to predovšetkým v
Portugalsku a Španielsku. Naopak regióny, v ktorých
majú ľudia vyššie vzdelanie, sa nachádzajú väčšinou
vo Veľkej Británii, ako aj v strednej a východnej
Európe285.
Regióny s najvyššším pomerom jednotlivcov, ktorí
majú terciárne vzdelanie, možno nájsť predovšetkým
vo Veľkej Británii, Belgicku a Holandsku, ale aj v
severnom Španielsku a na Cypre. Naopak regióny s
najnižším pomerom sa nachádzajú v Taliansku,
Portugalsku a v štátoch strednej a východnej časti
EÚ286.
Regióny EÚ s najvyšším pomerom žiakov a študentov
na všetkých úrovniach vzdelávania ako percento z
celkovej populácie sa sústreďujú na severe a západe
EÚ, predovšetkým vo Fínsku, Švédsku, ale aj v
Belgicku a Írsku. Regióny s najnižším pomerom možno
nájsť najmä na východe Nemecka, severe Talianska a
v juhovýchodnej Európe, ale aj na severozápade
Španielska a Portugalska287.
285
Pozri tabuľky 3.17-3.18 a obrázok 3.9 (s. 83-84). 286
Pozri obrázok 3.11; tabuľky 3.21 a 3.22 (str. 85-86). 287
Pozri obrázok 3.1 a tabuľky 3.2 a 3.3 (s. 75).
Regióny s najvyšším pomerom žiakov v procese
základného a nižšieho sekundárneho vzdelávania ako
percento z celkovej populácie možno pozorovať v
Írsku, Portugalsku, južnom Španielsku, ale aj v
Holandsku, Dánsku a južnom Švédsku. Naopak
najnižší pomer pozorujeme na severe Talianska a v
juhovýchodnej Európe288.
Regióny s najvyšším pomerom žiakov a študentov vo
vyššom sekundárnom vzdelávaní a postsekundárnom
vzdelávaní (mimo terciárneho) ako percento z
populácie vo veku 15 – 24 rokov sú najmä v Taliansku,
Belgicku, Švédsku a Fínsku, kým väčšina regiónov s
najnižším pomerom je v Grécku, Španielsku,
Portugalsku, Rumunsku, Bulharsku a vo
Francúzsku289.
Regióny s najvyšším pomerom ľudí nanajvýš s vyšším
sekundárnym vzdelaním a postsekundárnym
vzdelaním (mimo terciárneho) sú väčšinou v
strednej a východnej Európe, kým regióny s
najnižším pomerom možno nájsť predovšetkým v
južnej Európe290.
Existujú veľké rozdiely medzi jednotlivými regiónmi
EÚ, čo sa týka účasti dospelej populácie na
celoživotnom vzdelávaní. Vo Veľkej Británii, Dánsku,
Fínsku a Švédsku je najväčší počet regiónov, kde je
silná účasť na celoživotnom vzdelávaní, kým vo
väčšine regiónov v juhovýchodnej Európe je veľmi
nízky pomer účasti na celoživotnom vzdelávaní291.
V regiónoch EÚ existujú významné rozdiely v
geografickej prístupnosti k terciárnemu
vzdelávaniu292. Regióny s najlepšou geografickou
prístupnosťou sú väčšinou v Nemecku, Veľkej Británii
a Holandsku. Naopak väčšina regiónov s najnižším
„počtom bodov za geografickú prístupnosť” k
terciárnemu vzdelávaniu293 je v juhovýchodnej
Európe, severnom Švédsku a vo Fínsku, v baltských
štátoch, Španielsku, Dánsku a vo Francúzsku.
Regionálne rozdiely v rámci členských štátov EÚ
Hľadiac na regionálne rozdiely v rámci každého
členského štátu EÚ, ktoré sú merané ako rozdiel
medzi maximálnymi a minimálnymi regionálnymi
hodnotami pre každý skúmaný ukazovateľ294, má
najväčšie rozdiely medzi regiónmi, čo sa týka
ukazovateľa „žiaci a študenti na všetkých úrovniach
vzdelávania ako percento z celkovej populácie”
Rumunsko, a hneď po ňom nasleduje Česká
republika, Belgicko a Španielsko. Na druhej strane má
288
Pozri obrázok 3.3 a tabuľky 3.6 a 3.7 (s. 77). 289
Pozri obrázok 3.4 a tabuľky 3.8 a 3.9 (s. 78). 290
Pozri obrázok 3.10; Tabuľky 3.19 a 3.20 (s. 84 – 85). 291
Pozri obrázok 3.2 a tabuľky 3.4 a 3.5 (s. 76). 292
Pozri obrázok 3.6; Tabuľka 3.12 (s. 80 – 81). 293
% celkovej populácie regiónu, ktorej bydlisko je vzdialené viac než 60 minút od najbližšej univerzity. 294
Skúmané ukazovatele sú v tabuľke 3.1, s. 74.
EDUCATION INEQUALITY ACROSS EU REGIONS
52
najnižšie hodnoty Írsko (treba však pripomenúť, že
má len dva regióny). Zdá sa, že v Dánsku, Švédsku,
Maďarsku a Poľsku sú tiež pomerne malé rozdiely
medzi maximálnymi a minimálnymi hodnotami v
jednotlivých regiónoch, čo sa týka tohto
ukazovateľa295.
Hľadiac na ukazovateľ „účasť dospelej populácie na
celoživotnom vzdelávaní” sú zďaleka najväčšie
rozdiely medzi regiónmi vo Veľkej Británii, kde je
rozdiel medzi regiónom s najvyššou hodnotou
(Vnútorný Londýn 16,1 %) a regiónom s najnižšou
hodnotou (Severné Írsko 5,7 %) na úrovni 10,4 %.
Slovensko a Dánsko majú tiež pomerne veľké rozdiely
v jednotlivých regiónoch, čo sa týka tohto
ukazovateľa296.
V Belgicku sú najväčšie rozdiely medzi regiónmi s
najvyššími a najnižšími hodnotami, čo sa týka žiakov a
študentov vo vyššom sekundárnom vzdelávaní a
postsekundárnom vzdelávaní (mimo terciárneho)
(ISCED 3-4) ako percento populácie vo veku 15 – 24
rokov.
V niektorých členských štátoch sú veľké rozdiely
medzi jednotlivými regiónmi, čo sa týka ukazovateľa
„študenti v terciárnom vzdelávaní ako percento
populácie vo veku 20 – 24 rokov”. Najväčšie rozdiely
sú v Belgicku, po ktorom tesne nasleduje Česká
republika a Rakúsko. Okrem toho v Grécku, Taliansku
a Rumunsku sú veľké rozdiely, čo sa týka tohto
ukazovateľa, kde je medzi regiónmi s najvyššími a
najnižšími hodnotami rozdiel až 80 %. Vo väčšine
týchto prípadov je to následkom prevahy regiónu
hlavného mesta, čo sa týka príležitostí na terciárne
vzdelávanie297.
V Španielsku sú najväčšie rozdiely medzi regiónmi s
najvyššími a najnižšími hodnotami, čo sa týka počtu
ľudí, ktorých bydlisko je vzdialené viac než 60 minút
od najbližšej univerzity, a hneď po ňom nasleduje
Grécko, tretie je Fínsko a na štvrtom mieste je
Bulharsko.
V ôsmich členských štátoch EÚ je rozdiel viac než
15 % medzi ich regiónmi s najvyššími a najnižšími
hodnotami, čo sa týka počtu absolventov terciárneho
vzdelávania v regióne. Spojené kráľovstvo je krajina s
najväčším rozdielom (23,4 %), po ktorej nasleduje
Francúzsko (21,3 %), Belgicko (19,4 %), Česká
republika (18,7 %), Španielsko (17,5 %), Slovensko
(17 %) a Rumunsko (15,4 %). Rozdiely týkajúce sa
tohto ukazovateľa sú pomerne malé v Írsku,
Taliansku, Slovinsku, Portugalsku, Fínsku a Rakúsku (u
všetkých menej než 10 %)298.
295
Pozri tabuľku č. 4.45, s. 150. 296
Pozri tabuľku č. 4.45, s. 150. 297
Pozri tabuľku č. 4.45, s. 150. 298
Pozri tabuľku č. 4.46, s. 150.
Hľadiac na počet ľudí, ktorí majú nízke vzdelanie
(najviac základné a nižšie stredné vzdelanie), má
Francúzsko najväčšie rozdiely medzi svojimi regiónmi
s najvyššími a najnižšími hodnotami (rozdiel 27,2 %),
po ktorom nasleduje Grécko, Španielsko, Rumunsko a
Nemecko. Naopak krajiny s najmenšími rozdielmi sú
Slovinsko, Írsko, Slovensko, Rakúsko a Fínsko299.
Ďalšie kľúčové odkazy
Vnútroštátne priemery často zakrývajú nepríjemnú
realitu, ktorá je prítomná na miestnej a regionálnej
úrovni.
Regionálne rozdiely vo vzdelávaní bránia vyváženému
regionálnemu rozvoju a hospodárskemu rastu.
Regionálne rozdiely vo vzdelávaní ešte zhoršujú
nerovnosť medzi regiónmi EÚ. Tiež podporujú únik
mozgov do rozvinutejších alebo bohatších regiónov.
Existuje značná rôznorodosť čo sa týka povahy,
rozsahu a vplyvu nerovností vo vzdelávaní v
regiónoch EÚ. Reformné riešenia musia byť presne
zamerané a nie plošné. .
V súčasnosti sa v členských štátoch zbierajú
informácie na subregionálnej úrovni a na úrovni
jednotlivých škôl a tried, potrebná je však lepšia
koordinácia a sprístupnenie týchto informácií
verejnosti.
Zozbieranie údajov o nerovnostiach vo vzdelávaní,
ktoré sú geograficky členené, môže byť dôležitým
nástrojom posilnenia právomocí na miestnej úrovni a
decentralizácie. Poskytuje relevantné údaje pre
miestnu úroveň. Môže to pomôcť školám, miestnym
organizáciám a vláde uplatňovať také plánovanie a
politiku na všetkých úrovniach, ktoré bude založené
na faktoch.
Územné rozdiely v príležitostiach na vzdelávanie a
jeho výsledkoch odrážajú širšie nerovnosti. Opatrenia
len v oblasti politiky vzdelávania nie sú postačujúce.
Je pravdepodobné, že politiky, ktoré sa zaoberajú
chudobou a s tým spojenými oblasťami
znevýhodnenia už pri ich výskyte, budú pri
ovplyvňovaní celkových modelov nerovností vo
vzdelávaní na regionálnej úrovni úspešnejšie než len
zásahy výlučne upravujúce politiky vzdelávania.
299
Pozri tabuľku č. 4.46, s. 150.
EDUCATION INEQUALITY ACROSS EU REGIONS
53
Povzetek
Na kratko: Kljub zavezi držav članic EU k spodbujanju pravičnosti v izobraževanju in usposabljanju se možnosti in rezultati izobraževanja med državami članicami in znotraj njihovih nacionalnih meja z geografskega vidika še vedno precej razlikujejo.
To poročilo prikazuje regionalne neenakosti v možnostih in rezultatih izobraževanja znotraj nacionalnih meja držav članic EU. Namen poročila je podpreti oblikovalce politik pri njihovih prizadevanjih za oblikovanje učinkovitih ukrepov za odpravo teh razlik. Vsebuje več kot 100 zemljevidov za boljšo predstavo o neenakostih. Za vsak kazalnik opredeljuje 10 najbolj in 10 najmanj uspešnih regij EU. V nadaljevanju so navedena glavne ugotovitve poročila.
Razlike v izobraževanju v regijah EU
Med regijami EU so precejšnje razlike v možnostih za izobraževanje. Razlike v izobraževalnih dosežkih znotraj nacionalnih meja so večkrat prav tako velike, pogosto pa celo večje od razlik med posameznimi državami.
Regije z največjim deležem ljudi z nizkimi formalnimi kvalifikacijami („največ predšolska vzgoja ali osnovnošolsko izobraževanje"), so večinoma v južni Evropi, zlasti pa na Portugalskem in v Španiji. V nasprotju z njimi so regije, v katerih imajo prebivalci višje kvalifikacije, večinoma v Združenem Kraljestvu ter v srednji in vzhodni Evropi300.
Regije z najvišjim deležem oseb z dokončano terciarno izobrazbo so večinoma v Združenem Kraljestvu, Belgiji in na Nizozemskem, pa tudi v severni Španiji in na Cipru. Najnižji delež takih oseb je v regijah v Italiji, na Portugalskem ter v srednji in vzhodni Evropi301.
Regije EU z najvišjimi deleži „učencev, dijakov in študentov na vseh ravneh izobraževanja kot odstotek celotne populacije“ so skoncentrirane na severu in zahodu EU, zlasti na Finskem, Švedskem, pa tudi v Belgiji in na Irskem. Najnižji deleži te populacije so večinoma v vzhodni Nemčiji, severni Italiji in jugovzhodni Evropi, pa tudi v severozahodni Španiji in na Portugalskem302.
Regije z najvišjim deležem „učencev v osnovnošolskem izobraževanju kot odstotek celotnega prebivalstva“ so na Irskem,
300
Glej preglednici 3.17 in 3.18 ter sliko 3.9 (str. 83–84). 301
Glej sliko 3.11 in preglednici 3.21 in 3.22 (str. 85–86). 302
Glej sliko 3.1 in preglednici 3.2 in 3.3 (str. 75).
Portugalskem, v južni Španiji, pa tudi na Nizozemskem, Danskem in jugu Švedske. V nasprotju z njimi je ta delež najnižji v severni Italiji in jugovzhodni Evropi303.
Regije z najvišjim deležem „dijakov in študentov v srednješolskem in višjem strokovnem izobraževanju kot odstotek prebivalcev, starih od 15 do 24 let“ so večinoma v Italiji, Belgiji, na Švedskem in Finskem; večina regij, v katerih je ta delež najnižji, pa je v Grčiji, Španiji, na Portugalskem, v Romuniji, Bolgariji in Franciji304.
Regije z najvišjim deležem ljudi z „največ srednješolsko in višjo strokovno izobrazbo" so večinoma v srednji in vzhodni Evropi, regije z najnižjim deležem pa večinoma v južni Evropi305.
V EU obstajajo velike regionalne razlike glede sodelovanja odraslih v vseživljenjskem učenju. V Združenem Kraljestvu, na Danskem, Finskem in Švedskem je največje število regij z visoko udeležbo v vseživljenjskem učenju, večina regij z zelo nizkim deležem sodelovanja v vseživljenjskem učenju pa je v jugovzhodni Evropi306.
Razlike v „geografski dostopnosti“ visokošolskega izobraževanja so med regijami EU zelo velike307. Tiste z najboljšo „geografsko dostopnostjo“ so večinoma v Nemčiji, Združenem Kraljestvu in na Nizozemskem, večina regij z najslabšo „geografsko dostopnostjo“ visokošolskega izobraževanja308 pa je v jugovzhodni Evropi, na severu Švedske in Finske, v baltskih državah, Španiji, na Danskem in v Franciji.
Regionalne razlike znotraj držav članic EU
Regionalne razlike znotraj držav članic EU, izražene kot razlika med najvišjimi in najnižjimi regionalnimi vrednostmi za vsak obravnavan kazalnik309, so glede na kazalnik „delež učencev, dijakov in študentov na vseh ravneh izobraževanja kot odstotek celotnega prebivalstva“ največje v Romuniji, tesno pa ji sledijo Češka, Belgija in Španija. Na drugi strani je ta razlika najmanjša na Irskem (ki pa ima samo dve regiji). Raziskave kažejo, da so razlike med regionalnimi najvišjimi in najnižjimi vrednostmi za ta kazalnik razmeroma majhne tudi na Danskem, Švedskem, Madžarskem in Poljskem.
303
Glej sliko 3.3 in preglednici 3.6 in 3.7 (str. 77). 304
Glej sliko 3.4 in preglednici 3.8 in 3.9 (str. 78). 305
Glej sliko 3.10 in preglednici 3.19 in 3.20 (str. 84–85). 306
Glej sliko 3.2 in preglednici 3.4 in 3.5 (str. 76). 307
Glej sliko 3.6 in tabelo 3.12 (str. 80-81). 308
Odstotek vseh prebivalcev regije, ki živi več kot 60 minut od najbližje univerze. 309
Obravnavani kazalniki so prikazani v preglednici 3.1, str. 74.
EDUCATION INEQUALITY ACROSS EU REGIONS
54
Glede na kazalnik „vključenost odraslih v vseživljenjskem učenju“ so zdaleč največje regionalne razlike v Združenem Kraljestvu, kjer je razlika med regijo z najvišjim deležem (Inner London, 16,1 %) in regijo z najnižjo deležem (Severna Irska, 5,7 %) 10,4 %. Tudi na Slovaškem in Danskem so regionalne razlike glede na ta kazalnik razmeroma velike310.
Najvišja razlika med najbolj in najmanj uspešno regijo glede na kazalnik „dijaki in študenti v srednješolskem in višjem strokovnem izobraževanju (ISCED 3-4) kot odstotek prebivalstva, starega od 15 do 24 let“ je v Belgiji.
V nekaterih državah članicah so med regijami velike razlike glede na kazalnik „študenti v visokošolskem izobraževanju kot odstotek prebivalstva, starega od 20 do 24 let“. Največje so v Belgiji, tesno pa ji sledita Češka in Avstrija. Poleg tega so po tem kazalniku velike razlike tudi v Grčiji, Italiji in Romuniji, saj se njihove najboljše in najslabše regije razlikujejo za več kot 80 %. V večini teh primerov je to posledica prevladujočega položaja regije glavnega mesta glede možnosti za visokošolsko izobraževanje311.
Največji razkorak med najbolj in najmanj uspešnimi regijami po številu ljudi, ki živijo več kot 60 minut od najbližje univerze, je v Španiji, sledijo pa ji Grčija, Finska in Bolgarija.
V osmih državah članicah EU je razlika med najbolj in najmanj uspešnimi regijami glede na število ljudi v regiji z zaključeno terciarno izobrazbo večja od 15 %. Največji razkorak je v Združenem Kraljestvu (23,4 %), sledijo pa mu Francija (21,3 %), Belgija (19,4 %), Češka (18,7 %), Španija (17,5 %), Slovaška (17 %) in Romunija (15,4 %). Za to spremenljivko je razkorak razmeroma majhen na Irskem, v Italiji, Sloveniji, na Portugalskem, Finskem in v Avstriji (povsod manj kot 10 %)312.
Upoštevajoč število ljudi z nizko izobrazbo („največ predšolska vzgoja ali osnovnošolsko izobrazba“) je največja razlika med najboljšo in najslabšo regijo v Franciji (27,2 %), sledijo pa ji Grčija, Španija, Romunija in Nemčija. Ta razlika je najmanjša v Sloveniji, na Irskem, Slovaškem, v Avstriji in na Finskem313.
310
Glej preglednico 4.45, str. 150. 311
Glej preglednico 4.45, str. 150. 312
Glej preglednico 4.46, str. 150. 313
Glej preglednico 4.46, str. 150.
Druge ključne ugotovitve
Nacionalna povprečja pogosto zakrivajo nespodbudne lokalne in regionalne razmere.
Regionalne razlike v učenju ovirajo uravnotežen regionalni razvoj in gospodarsko rast.
Regionalne razlike v izobraževanju povečujejo neenakosti med regijami EU. Pospešujejo tudi beg možganov v bolj razvite/bogatejše regije.
Narava, obseg in posledice neenakosti v izobraževanju se med regijami EU precej razlikujejo. Politične rešitve morajo biti prilagojene, ne pa splošne.
Podatke na podregionalni ravni ter na ravni posameznih šol in razredov zdaj zbirajo v državah članicah, vendar je treba zagotoviti boljše usklajevanje zbiranja teh podatkov in njihovo dostopnost javnosti.
Priprava geografsko razčlenjenih podatkov o neenakosti v izobraževanju je lahko pomembno orodje za krepitev lokalnega vpliva in decentralizacijo. Taki podatki so pomembni za posamezne skupnosti. Šolam, organizacijam posameznih skupnosti in javnim upravam na vseh ravneh oblasti lahko pomagajo sodelovati pri načrtovanju in oblikovanju politik na podlagi dejstev.
Geografske razlike v možnostih in rezultatih izobraževanja kažejo na neenakosti v širšem smislu. Samo ukrepi na področju politike izobraževanja ne zadostujejo. Politike, ki revščino in z njo povezane vidike prikrajšanosti obravnavajo pri njihovih koreninah, imajo pri vplivanju na splošne vzorce regionalnih neenakosti v izobraževanju večjo možnost za uspeh kot zgolj ukrepi na področju politike izobraževanja.
EDUCATION INEQUALITY ACROSS EU REGIONS
55
Sammanfattning
Kort sagt: Trots EU-ländernas uttalade vilja att verka för
lika chanser inom utbildningen finns det fortfarande
stora geografiska skillnader i fråga om möjligheter och
resultat både mellan och inom länderna.
Rapporten riktar uppmärksamheten mot regionala
skillnader inom länderna i fråga om möjligheter och
resultat i utbildningen i EU. Syftet är att hjälpa
beslutsfattarna att utforma effektiva åtgärder mot
skillnaderna. Rapporten innehåller mer än 100 kartor för
att illustrera klyftorna, och presenterar de tio bästa och
sämsta EU-regionerna för de indikatorer som granskas.
Rapportens huvudbudskap är följande:
Ojämlik utbildning mellan EU:s regioner
Det råder avsevärd ojämlikhet i fråga om möjligheter
och resultat inom utbildningen mellan regionerna i
EU. Skillnaderna inom länderna i resultat är ofta minst
lika stora och ibland större än skillnaderna mellan
länderna.
Regionerna med högst andel personer med låga
formella kvalifikationer (högst grundskola) ligger
främst i södra Europa, särskilt Portugal och Spanien.
De regioner där flest människor har uppnått högre
kvalifikationer finns främst i Förenade kungariket och
Central- och Östeuropa314.
Regionerna med flest personer med högskoleexamen
finns främst i Förenade kungariket, Belgien och
Nederländerna, men även i norra Spanien och
Cypern. Italien, Portugal och Central- och
Östeuropa315 har däremot regionerna med lägst
andel högskoleutbildade.
De EU-regioner med störst andel studerande inom
alla nivåer av utbildningen som andel av den totala
befolkningen finns främst i norra och västra EU,
särskilt Finland, Sverige, Belgien och Irland.
Regionerna med lägst andel finns främst i östra
Tyskland, norra Italien och sydöstra EU, men även i
nordvästra Spanien och i Portugal316.
Regionerna med flest elever i grundskolan som andel
av den totala befolkningen finns i Irland, Portugal,
södra Spanien, Nederländerna, Danmark och södra
Sverige. De lägsta andelarna förekommer i norra
Italien och i sydöstra Europa317.
314
Se tabellerna 3.17–3.18 och figur 3.9 (s. 83–84). 315
Se figur 3.11 och tabellerna 3.21 och 3.22 (s. 85–86). 316
Se figur 3.1 och tabellerna 3.2 och 3.3 (s. 75). 317
Se figur 3.3 och tabellerna 3.6 och 3.7 (s. 77).
Regionerna med högst andel studerande på
gymnasium och postgymnasial utbildning under
högskolenivå som andel av befolkningen i åldrarna
15–24 finns främst i Italien, Belgien, Sverige och
Finland, medan regionerna med lägst andel finns
främst i Grekland, Spanien, Portugal, Rumänien,
Bulgarien och Frankrike318.
Regionerna med störst andel personer med upp till
gymnasial eller postgymnasial utbildning under
högskolenivå finns främst i Central- och Östeuropa,
medan regionerna med lägst andel främst ligger i
södra Europa319.
Det finns stora regionala skillnader i vuxnas
deltagande i livslångt lärande i EU. Förenade
kungariket, Danmark, Finland och Sverige har det
största antalet regioner med omfattande deltagande i
vuxenutbildning, medan de regioner med mycket lågt
deltagande främst ligger i sydöstra Europa320.
Det råder stora skillnader i den geografiska
tillgängligheten till högre utbildning mellan EU:s
regioner321. Regionerna med bäst geografisk
tillgänglighet ligger främst i Tyskland, Förenade
kungariket och Nederländerna. De regioner som
ligger sämst till i fråga om geografisk tillgänglighet till
högre utbildning322 ligger i sydöstra Europa, norra
Sverige och Finland, Baltikum, Spanien, Danmark och
Frankrike.
Regionala skillnader inom EU-länderna
När det gäller regionala skillnader inom EU-länderna,
uttryckt som differensen mellan största och minsta
regionala värden för varje indikator323, har Rumänien
den största regionala klyftan för indikatorn
"studerande på alla utbildningsnivåer som andel av
den totala befolkningen", tätt följt av Tjeckien,
Belgien och Spanien. I skalans andra ände har Irland
det lägsta värdet (men man bör ha i åtanke att Irland
bara har två regioner). Danmark, Sverige, Ungern och
Polen förefaller också ha små skillnader mellan de
största och minsta regionala värdena på denna
indikator324.
För indikatorn "vuxnas deltagande i livslångt lärande"
har Förenade kungariket de överlägset största
regionala skillnaderna: regionen med det högsta
värdet (centrala London, 16,1 %) och det lägsta
(Nordirland, 5,7 %) skiljer sig åt med
10,4 procentenheter. Slovakien och Danmark har
318
Se figur 3.4 och tabellerna 3.8 och 3.9 (s. 78). 319
Se figur 3.10 och tabellerna 3.19 och 3.20 (s. 84–85). 320
Se figur 3.2 och tabellerna 3.4 och 3.5 (s. 76). 321
Se figur 3.6 och tabell 3.12 (s. 80–81). 322
Andel av regionens totala befolkning som bor mer än 60 minuters resväg från närmsta högskola. 323
Indikatorerna visas i tabell 3.1, s. 74. 324
Se tabell 4.45, s. 150.
EDUCATION INEQUALITY ACROSS EU REGIONS
56
också stora regionala skillnader för denna
indikator325.
Belgien uppvisar den största skillnaden mellan bästa
och sämsta regioner för indikatorn "studerande på
gymnasium och postgymnasial utbildning utom
högskola" (ISCED 3-4) som andel av befolkningen i
åldrarna 15–24.
I några medlemsstater råder stora skillnader mellan
regionerna för indikatorn "högskolestuderande som
andel av befolkningen i åldrarna 20–24". Belgien har
det största gapet, tätt följt av Tjeckien och Österrike.
Dessutom uppvisar Grekland, Italien och Rumänien
alla stora klyftor för denna indikator med en
spridning på över 80 procentenheter mellan den
bästa och den sämsta regionen. Mestadels beror det
på att huvudstadsregionen dominerar utbudet av
högre utbildning326.
Spanien har det största gapet mellan bästa och
sämsta region i andel av befolkningen som bor med
mer än 60 minuters resväg från närmsta högskola,
följt av Grekland, med Finland på tredje plats och
Bulgarien på fjärde plats.
Åtta EU-länder har en skillnad på över
15 procentenheter mellan bästa och sämsta region
vad gäller antalet högskoleutexaminerade i regionen.
Förenade kungariket har det största gapet (23,4 %),
följt av Frankrike (21,3 %), Belgien (19,4 %), Tjeckien
(18,7 %), Spanien (17,5 %), Slovakien (17 %) och
Rumänien (15,4 %). Skillnaden i denna indikator är
lägre i Irland, Italien, Slovenien, Portugal, Finland och
Österrike (samtliga lägre än 10 %)327.
När det gäller lågutbildade (dvs. personer med högst
förskola eller grundskola) har Frankrike den största
skillnaden mellan bästa och sämsta region (på
27,2 %), följt av Grekland, Spanien, Rumänien och
Tyskland. Länderna med minst skillnader är däremot
Slovenien, Irland, Slovakien, Österrike och Finland328.
Andra viktiga budskap
Nationella medelvärden döljer ofta ogynnsamma
lokala och regionala förhållanden.
Regionala skillnader i lärande hindrar en balanserad
regional utveckling och ekonomisk tillväxt.
Regionala skillnader inom utbildningen förvärrar
ojämlikheterna mellan EU:s regioner. De underblåser
också kompetensflykt till mer utvecklade, rikare
regioner.
325
Se tabell 4.45, s. 150. 326
Se tabell 4.45, s. 150. 327
Se tabell 4.46, s. 150. 328
Se tabell 4.46, s. 150.
Ojämlikheterna i utbildningen varierar avsevärt till sin
natur, omfattning och inverkan mellan EU:s regioner.
De politiska lösningarna måste därför vara
skräddarsydda, inte standardiserade.
Det förekommer att uppgifter samlas in på
underregional nivå och för enskilda skolor och klasser
i medlemsstaterna, men det behövs bättre
samordning och uppgifterna bör offentliggöras.
Sammanställningar av geografiskt isolerade uppgifter
om ojämlikheter i utbildningen kan vara viktiga
verktyg för lokalt självstyre och decentralisering. De
ger lokalt relevant information och kan hjälpa skolor,
lokala organisationer och myndigheter på alla nivåer
att bedriva planering och politik grundad på fakta.
Geografiska ojämlikheter i fråga om möjligheter och
resultat i utbildningen är tecken på större
ojämlikheter. Det räcker inte med bara
utbildningspolitiska åtgärder. Grundläggande
åtgärder mot orsakerna till fattigdom och
utanförskap har större möjligheter att kunna påverka
de stora mönstren inom regionala
utbildningsskillnader än rent utbildningspolitiska
insatser.
EDUCATION INEQUALITY ACROSS EU REGIONS
57
Chapter One. Introduction
Opportunities for and benefits from learning are far from equally distributed across EU regions.
Where you live in Europe can strongly influence your educational opportunities and prospects in
life. Access to quality learning opportunities, success at school, chances of higher education and
further learning or second chance provision all remain socially and spatially divided. Major
geographic disparities persist across but also within EU Member States and regions. The evidence
of continuing and even growing inequalities of educational access and success across EU regions,
and their consequences, continues to mount. This report contributes to showing the scale and
significance of these disparities.
Intra-national differences matter
EU Member States are far from homogeneous. Aggregate national statistics obscure considerable
spatial variations in terms of educational opportunities and outcomes. Often these differences
are most marked in remote rural areas or in urban or suburban locations where educational dis-
advantage reflects, and compounds, the effects of wider socio-economic disadvantage.
Therefore there is a need to construct geographically disaggregated data that reveal the spatial
distribution of educational inequality within a country. Such data sets allow the visualization of
inequality across space, encourage visual comparison and make it easier to look for spatial trends
or patterns.
Compiling disaggregated information on educational inequality generates locally-relevant
information. It can provide a resource to help schools, community organisations and government
at all levels to engage in evidence-based planning, policy development and implementation.
Inequality maps can also support local stakeholders in local decision making and in negotiation
with government agencies. They are an important tool for local empowerment and decentre-
lization. This report is an effort to produce such maps. These maps are shown in chapters 3 and 4.
The evidence set out in this report shows that levels of educational inequality in the EU do vary
greatly between sub-national regions as well as between whole Member States. This is hugely
important for a number of reasons, but most immediately because these intra-national
differences of achievement are frequently at least as large, and often larger, than inter-national
differences. And the most immediate consequence of this for policy is that if the scale at which
the most important differences are found should constitute the main target for intervention to
overcome inequalities then it should be the regional and not the national level -certainly not the
national alone- that should be targeted. Continuing to ignore the nature and extent of intra-
national disparities will merely perpetuate and extend the inequalities they enshrine.
This report seeks to reveal the nature and extent of intra-national regional differences in
educational opportunity and achievement in the EU and to support policy makers in their efforts
to design effective and targeted measures to redress them.
This is by no means an easy or straightforward undertaking, for a number of reasons. The great
majority of analyses of educational inequality are nationally based and aimed at addressing and
redressing inequalities and their consequences at national level. National averages are usually
used to compare the performance of national education systems. In fact, such inter-national
comparisons lie at the heart of the EU’s own accounting of its aggregate educational performance,
with the emphasis on the best and worst -national- performers on a range of measures of
educational achievement.
EDUCATION INEQUALITY ACROSS EU REGIONS
58
Beyond methodological nationalism
It is sub-national rather than trans-national differences that concern us in this report. It is not just
between countries that we see significant differences in educational achievement and associated
forms of disadvantage, but also between regions within countries, across almost the whole of the
EU. This is not merely an education policy problem.
The sources, nature, extent and consequences of regional disadvantage in Europe have become
increasingly evident over the past three decades. Despite very large regional policy expenditures,
regional disparities have shown little sign of narrowing. Income differences between states have
fallen, but those between regions within states have risen, and European regions have become
increasingly polarized in their unemployment rates. This has led to an increased focus on the part
of researchers and policy makers on identifying crucial differentiating regional characteristics and
on producing indicators to provide information about the spatial distribution of inequality within a
country.
However, while the spatial element of social inequality has been increasingly recognized in
geographic and economic analyses, there has been less attention paid to the social structures,
processes and experiences that generate and shape educational disparities at a regional level, and
of the consequences of these disparities. "Regional" introduces a key and neglected dimension to
the study of educational inequality in the EU. Comparison at the level of the region both gets
closer to the most badly affected places, and enables a clearer view of the wider effects of socio-
economic policy and possibilities for education policy.
It thus overcomes some of the problems of methodological nationalism -the identification of
"societies" with nation-states- on the one hand, and the tendency to perceive "local" problems in
parochial and exclusive ways, on the other. Methodological nationalism privileges the national
level as not only the most important level -which for many purposes it is- but also as effectively
the only level of analysis, and of the production of statistics, for instance -which, as will be shown
in this report, is a major cause of the neglect of regionally based differences in educational
opportunities and outcomes. However, while we need both national and local/neighbourhood
studies, we cannot assume that they "join up" in the middle in ways that make investigating an
intermediate "regional" level unnecessary. Nor, crucially in policy terms, can we assume that a
simple rescaling of policy responses will be sufficient to mitigate regional differences.
The need for better data
Our intentions can be achieved only as far as the available data make it possible. The main
sources of data are available only at the level of NUTS2. This represents a major limitation on the
kinds of analysis we are able to provide, since: (a) it is at NUTS3 level that we would expect to find
the most important evidence for a clear understanding of the structures and processes at work in
causing and maintaining spatially based inequalities; and (b) the categorisations of regions are
based on statistical or administrative concepts. There is a need for data collection and sharing at
NUTS3 and at the level of individual schools and classrooms. A lot of these data is being collected
at national level across the EU, but there is a need for better coordination and for this data to
become available in the public domain through Eurostat.
EDUCATION INEQUALITY ACROSS EU REGIONS
59
Our approach
The approach we adopt in this report is based on two main components. The first is a review of
the theoretical and empirical work available. The second is an empirical investigation into the sub-
national patterns of regional difference. This draws on extensive data sets that enable us to -
literally- map the scale and patterns of regional inequalities and the nature and scale of
educational disparities at sub-national level across the EU, using advanced mapping techniques
that allow the visualization of inequality across space.
Following this Introduction, in Chapter 2, we set out to elaborate the nature of the relationship
between regions and educational inequality. In a sense, this is also intended to provide an
"interpretive companion" to the geographical and mapping evidence that is presented in the
following chapters. Drawing on relevant sociological literature and on literature from the
economics of education, and recognizing that the causes of inequalities manifested at regional
level are structural rather than spatial329, we will discuss the causes and consequences of these
disparities, what they mean, the forms they take, the groups they affect.
Chapter 3 provides a mapping of educational inequalities across EU regions in 21 of the 27 EU
Member States which have two or more NUTS2 regions. Cyprus, Estonia, Latvia, Lithuania,
Luxembourg and Malta are EU NUTS2 regions themselves and as a result are not discussed in this
report due to lack of suitable data.
Using GIS mapping techniques that allow the visualization of inequality across space, Chapter 4
provides a mapping of the nature and scale of educational disparities within each EU Member
State which has two or more NUTS2 regions. It paints a picture - to the degree that this is possible
on the basis of publicly available data- of patterns of educational opportunities and outcomes and
their geographic and regional variations across EU regions.
Finally, Chapter 5 illustrates the possibilities created by analyses of regional inequalities in
education that are able to draw on NUTS3 level data available for the city of Sheffield, UK, and a
series of studies drawing on NUTS 3 level data for the whole of Greece.
The final pages of the report (Annex) provide the population cartogram versions (population-
density visualisations) of the conventional maps used in Chapter 3 to help readers visualise more
accurately the distribution of education inequalities across EU regions.
329 The majority of studies regarding regions and more locally neighbourhoods show that inequalities in education are both
an indicator of existing deeper social inequalities and the cause of further inequality with socioeconomic segregation being the root of the problem rather than their spatial contexts and outcomes.

EDUCATION INEQUALITY ACROSS EU REGIONS
60

EDUCATION INEQUALITY ACROSS EU REGIONS
61
Chapter Two. Regional inequalities in education: causes, consequences and policy challenges
2.1. Introduction
Educational outcomes within countries are spatially patterned, with young people in richer
neighbourhoods, cities, counties and regions tending to participate in education for longer and
achieve higher qualifications than those in poorer areas. This concerns governments of varying
political complexions on grounds both of individual treatment (with concerns around justice,
fairness, equality of opportunity and social mobility) and economic progress, on the basis that in
knowledge economies poorly educated populations hold back inward investment and economic
growth.
In some countries governments address spatial inequalities through redistributive funding systems
that target more resources towards schools and other educational institutions in disadvantaged
areas as a matter of regular mainstream allocation. Some have also developed targeted
programmes aimed at particular areas and providing locally developed and tailored interventions,
for example Zones d’Education Prioritaires (ZEPs) in France, Territórios Educativos de Intervenção
Prioritária in Portugal, Education Action Zones and City Challenges in England. Attention has
tended to be given to neighbourhood-level inequalities, although arguably there is a case for
simultaneous interventions at a number of different sub-national spatial scales, including city-
regions and regions. Governments in some countries (such as Sweden and the Czech Republic)
have targeted minority groups who tend to be clustered in particular areas, thus addressing one of
the causes of spatial inequalities without taking an explicitly spatial approach.
The variety of approaches suggests that making effective interventions at the appropriate sub-
national level requires not only evidence of where the problems lie, but an understanding of
their causes and consequences and the spatial scales at which these operate. In this chapter we
briefly review what is known about spatial inequalities in education, focusing mainly on the
regional level, and reflect on the implications for education policy, before moving on to describe
current patterns in the EU in Chapter 3.
2.2. Causes of Regional Educational Inequalities
Why do some regions have highly educated populations and others not? Why is progress greater
in some regions than others? Why is there sometimes more similarity between regions in different
countries than regions within the same country, even when education systems are ostensibly the
same country-wide? To what extent can education policy impact on these regional disparities, or
how much are they caused by wider economic conditions, demographic chara-cteristics and
population movements?
The Wider Causes of Regional Inequalities
Spatial disparities in educational attainment can largely be seen as the geographical
manifestations of deeper divisions in income, wealth, power and recognition that historically and
contemporaneously govern which groups have access to educational provision and the economic,
social and cultural capitals to exploit it. Data from the Programme for International Student
Assessment (OECD, 2008) shows that learners from poor backgrounds attain less well in all OECD
countries. The problem is more acute in more unequal societies (Wilkinson & Pickett, 2009).
EDUCATION INEQUALITY ACROSS EU REGIONS
62
Social and economic inequalities translate into educational disparities through a complex set of
mechanisms, interacting over the life course. These include:
Material inequalities, manifesting in differential access to some of the perquisites of
learning such as food, sleep, clothing, adequate housing and stability, emotional security,
books, computers, space and quiet, and transport, as well as requirements to earn and
contribute to family income.
Educational expectations, desires, and dispositions: the status and meaning of education
and whether it is seen as being for "people like us".
Social and cultural capital; social networks, "system knowledge" and the ability to "speak
the right language" to negotiate access to education and relationships with other
students, teachers and tutors, and to translate educational qualifications into jobs and
earnings330.
The privileging, by educational institutions, of some forms of knowledge, and some ways
of knowing and behaving, over others331.
The ways that institutions reinforce social divisions as they group students into classes,
subjects and streams332, or fail to compensate for material inequalities, so that equal
access to education does not provide the equalising effect on outcomes that might be
expected.
In these ways, educational disparities between social and ethnic groups arise from a combination
of their economic and social position and the design and functioning of the education systems
available to them. These differ from country to country and are historically conditioned, as well as
being mediated by the different roles that states have played in smoothing inequalities through
legislation, fiscal policies and transfers. Ethnicity and migration status as well as material
circumstances are important. Ethnic minorities in most EU countries tend to be disadvantaged by
their lack of inherited wealth, status and connections, as well as (in some countries) by histories of
colonial oppression and racial discrimination, although this does differ from one country to
another. Countries clearly differ in the extent of privatisation and selection within their education
systems, and in their attempts to deliver equality of provision in all areas. So inter-national
differences will be highly influential on educational disparities, but for the same reasons we can
also expect differences between regions arising from what may be described as compositional
factors i.e. who lives there and their historic and current relationships with education.
Area Effects
This interpretation -that regional differences are simply a manifestation of wider structural
differences- rests somewhat on the idea of the region (or space in general) as a blank canvas or
container of people, having no effect of its own. In recent years, this has been challenged to some
extent by a "spatial turn" in educational theory and research, with more interest from
geographers in the field of education (Gulson and Symes, 2007).
This development is important in two main ways. Firstly it has drawn attention to the spatial
patterning of educational resources and its effect (e.g. Taylor, 2001). Countries vary in the extent
to which their education systems are centrally, regionally and locally controlled, giving rise to
different degrees of local variation in investment in education and different decisions about the
kinds of schools and colleges provided. For example, in England, although curriculum is centrally
controlled, local authorities decide on the provision of school places. Some have made historic
decisions to provide education for 16-18 year-olds in local schools, while others provide this in
330
Bourdieu 1984; Bernstein 1975. 331
Young, 1971. 332
Willis 1977; Ball 1981.
EDUCATION INEQUALITY ACROSS EU REGIONS
63
large further education or sixth form colleges: a decision which affects the accessibility of
continuing education and participation rates.
Another important factor is the extent of selection and social and ethnic segregation between
schools. Work on this issue in the UK and elsewhere has suggested that the extent of segregation
varies between regions and also within regions, with more segregation in urban areas. Johnston
et al. (2006a) also suggest that segregation in schools is greater than that in neighbourhoods,
which opens up the question of whether this issue is best tackled through mixed community
policies which aim to achieve less residential segregation, by housing voucher programmes which
help individuals change neighbour-hood or by school admission policies. In the UK, recent findings
from a school admissions lottery programme (Allen et al. 2010) have found that it had little effect
on social segregation, since admissions also remained linked to residential "catchment areas".
From the US, Deluca and Dayton (2009) compared young people who changed school and
neighbour-hoods through housing policy and school voucher programmes. They suggested that
housing programmes had assisted poor families to move to less segregated neighbourhoods
which in some cases were also linked to early educational benefits. On the other hand, they
suggested that school voucher programmes have given the opportunity to disadvantaged young
people to "attend higher-performing private schools in less segregated environments with more
middle-class peers" (DeLuca & Dayton, 2009:457). The overall point is that sub-national patterns
of provision and policy intervention matter. Regional disparities in educational outcomes are not
solely manifestations of wider structural inequalities.
The second important insight for education provided by the spatial approach is that places are not
merely containers of people – backdrops to human activity. Their characteristics are shaped in
part by the people who live in them, and their meaning is socially constructed, produced by the
social relations, activities and imaginaries of people within and outside them (Lefebvre, 1991). At
different times, and in relation to other places, cities, regions and neighbourhoods can take on
meanings as places of decline, conflict, danger, community, excitement, culture, growth, or
innovation (Taylor et al., 1996). These meanings and understandings of place can themselves
shape identities, aspirations and values around education. For example, what it means to be poor
or a migrant in terms of education and what constitutes valid and useful knowledge might well be
different from one region to another and from one place to another within a region. This is well
illustrated in qualitative studies, which tend for methodological reasons to focus on particular
neighbourhoods and schools rather than at the regional level.
For example, Dillabough et al. (2007) describe how an inner urban neighbourhood in a major
North American city, adjacent to areas being gentrified by the influx of international capital,
provides a sense of marginality for young people, exacerbated by their segregation within
"demonised" schools abandoned by more advantaged families. Rather than utilising education as
a tool to grasp the opportunity of social mobility created by these global and local political and
economic forces, some of the young people resist "good girl" expectations around education in
order to craft an identity and place for themselves in this changing arena. Thomson (2002), in an
Australian study, points to the ways in which through neighbourhood issues, narratives and
resources influence the work of schools as well as (and partly because of) the identities and
attitudes of students. Teachers and principals are also involved in working out the meaning of
formal education and qualifications in economically marginalised former industrial working class
neighbourhoods, while tackling the material and emotional consequences of poverty and long
term unemployment. Local, regional, national and global changes come together in the schools,
as Thomson puts it as "spatially distributed material and cultural resources and as possibilities for
action" (Thomson, 2002). Thrupp (1999) has demonstrated how local contexts have implications
for school management and organisation of schools and for approaches to curriculum and
pedagogy, as well as for peer relations.

EDUCATION INEQUALITY ACROSS EU REGIONS
64
In practical terms this means that while we can expect to derive a great deal of the explanation for
spatial disparities in education simply by reading off the spatial patterning of wider structural
inequalities, two other things are also likely to be important. One is how particular spatial
characteristics manifest in particular places -distinct geographies and topographies, local histories,
identities and social relations, forms of industrial or agrarian organisation and ownership, as well
as politics, cultural resources, facilities and services. The other is the ways in which these
combinations of national, region and local circumstances combine to shape material inequalities,
forms of capital, educational habitus, and issues of recognition and status, as well as having direct
influences on opportunities to learn.
Understanding the balance between local factors and wider structural influences is not
straightforward. There is an extensive literature which has attempted, using quantitative
methodologies, to investigate these relationships, and the existence and size of "area effects" on
education333. A review by Lupton and Kintrea (2011) suggests that overall, and despite some
contradictory findings, the conclusion of this body of work is that there are demonstrable area
effects: the characteristics of places do matter for child development in the early years, school
attainment and school drop-out rates. These effects tend to be smaller than the effects of
individual characteristics and abilities, parental characteristics and family influences, but they are
not insignificant (Galster et al. 2007). In policy terms this would tend to suggest that location-
specific interventions designed either to improve neighbourhoods by changing population mix or
improving local conditions and services are valuable and can make some difference, although in
themselves they are unlikely to be wholly transformative.
The quantitative literature to date leaves some important issues unresolved. One is that most
work to date has concentrated on identifying evidence of effects rather than testing which
mechanisms are at work, and many studies use single or very limited indicators of neighbour-hood
characteristics (such as overall poverty or unemployment rates). Galster (2010) identifies fifteen
different kinds of causal mechanisms by which neighbourhoods might have an effect. He groups
these into four categories: social interactive, environmental, geographic and institutional, and
points to the need to test these explicitly. The analysis suggested that neighbourhood
characteristics had a very strong and significant impact upon educational outcomes. Andersson
and Subramanian (2006) explored the impact of neighbourhood characteristics on the educational
outcome of adolescents in Sweden. Their analysis suggested that neighbourhood characteristics
related to socio-economic resources and demographic stability had a strong association with
individual educational outcomes. They also found a strong association between neighbour-hood
socio-cultural capital variables and educational outcomes.
A specific and important example of the difficulty in identifying what it is about neighbourhoods
that matter is the failure of many studies to separate school effects from other neighbourhood
factors. This makes it difficult to distinguish whether all the neighbourhood effects observed are
in fact school effects, or the extent to which investments in school quality can offset the effects of
environmental or economic characteristics. Sykes and Musterd (2010) examined both school and
neighbourhood effects upon academic achievement in secondary school, using Dutch longitudinal
data. Their analysis suggested a strong and statistically significant relationship between school
characteristics and achievement, but the respective association with neighbourhood chara-
cteristics was not significant. The relatively greater importance of school than neighbourhood
factors is also suggested by the results of the Moving to Opportunity programme in the US
(Sanbonmatsu et al. 2006).
333 For reviews of the literature, see, e.g. Blasius et al, 2007; Ellen and Turner, 2003; Jencks and Mayer, 1990; Leventhal and Brooks-Gunn, 2000; Sampson, 2001; Sampson et al, 2002.
EDUCATION INEQUALITY ACROSS EU REGIONS
65
A final issue, and perhaps the most important one in this context, is that of spatial scale. The
complexity of spatial meanings and relationships implies that different issues operate at different
spatial scales from the regional (connectivity, economic function, political history and governance)
to the street or block (housing and environ-mental management, peer effects). However, studies
have tended to be driven by the availability of data, and the terms “area effects” and
"neighbourhood effects" are used loosely to describe place effects at a wide range of scales.
Lupton and Kneale (2011) have pointed to the need to take a more theoretically informed
approach to selecting the right scale for specific mechanisms (for example, labour market effects
on teenage outcomes should not in theory be measured at the neighbourhood level, although
peer effects might be), although their paper also demonstrates how difficult it is to do this in
practice.
At this stage much existing research points to the importance of spatial effects on education,
although the scale at which these effects operate is not entirely clear. In the context of this
report, this should caution us against the assumption that because differences exist at the regional
level, their causes must also be found at this level. Many of the studies referred to above, and
some of our own illustrations later in this report, show acute intra-region differences. Regional
aggregate figures may well conceal important differences within regions, caused by local
mechanisms and demanding local action. However, just as an exclusive focus on the national can
obscure large differences in experience within countries, an exclusive focus on the sub-regional,
local or neighbourhood levels can tend to obscure the importance of regional economic factors in
favour of the local dynamics of housing markets, resource provision or cultural relations. A
regional focus opens up the possibility of understanding sub-national causes of educational
disparities, while not losing sight of major economic driving forces. It provides a particular window
for observation, understanding and action.
2.3 Consequences of regional educational inequalities
The region is also an important spatial scale for understanding the consequences of educational
disparities. For the reasons described above, regional inequalities in education will tend to
reinforce inequalities between regions in incomes, wealth and social status, contributing to
persistent inter-regional disparities which are resilient to purely economic interventions. Indeed
regional educational disparities may exacerbate such inequalities over time as well-educated
people leave less advantaged regions while less well educated people stay.
A number of studies in Europe (e.g. Rodríguez-Pose and Tselios (2009), López-Bazo and Motellón
(2009) and Duranton and Monastiriotis (2001 & 2002) demonstrate the relationship between
educational inequality and income inequality at the regional level. Rodríguez-Pose and Tselios
(2009) use the European Community Household Panel dataset for 102 European Union regions
over the period 1995–2000 and show how changes in human capital distribution affect income
inequality. Their analysis suggests that high levels of inequality in educational attainment have a
strong and statistically significant association with higher income inequality. López-Bazo and
Motellón (2009) present an analysis of the effect of human capital on regional wage inequality in
Spanish regions. Their results show that Spanish regions differ in the endowment of human
capital as well as the return that individuals obtain from it and there are strong regional
differences. They also conclude that regional differences in human capital endowment have a
significant impact on regional wage gaps. Duranton and Monastiriotis (2001) analyse a database
that includes information on earnings and education across regions in the United Kingdom over 15
years (1982-1997) and point out that there had been a worsening of UK regional inequalities and a
rise in the North-South divide in the country. Their analysis also suggests that regions in the south
of the country (e.g. London) gained in terms of income over the period because their workforce
became more educated. In addition, they point out that during their study period income returns
to education increased nationwide and this further favoured regions such as London and the
EDUCATION INEQUALITY ACROSS EU REGIONS
66
south-east that had higher rates of people with educational qualifications. Duranton and
Monastiriotis (2002) built further on this analysis by exploring the degree to which similar
individuals (including in terms of educational qualifications) have the same wage across regions
and how differences evolved over a 20-year period. A similar study of regions outside Europe that
is worth mentioning is the work of Azzoni and Servo (2002) on education and wage inequality in
Brazilian regions. They discovered that the most important of the control variables for explaining
wage inequalities in Brazil is education, while variables such as region, experience and race follow.
The relationship between education levels and the capacities of different regions to produce
strong economic performance and growth has two important dimensions, with different
implications for how we conceptualise and measure "educational disadvantage" and for policy
interventions.
The first is the relationship between current levels of human capital and current levels of
economic performance as well as the potential for future economic growth. A number of studies
demonstrate that higher human capital is associated with higher performance and that the
presence of skilled and educated workers can attract firms and enhance productivity. For example
López-Bazo and Moreno Serrano (2008) looked at the relationship between human capital and
regional growth in Spain. Their analysis suggested that human capital has an indirect effect of
making private capital investment more attractive. Regions with high rates of workers with higher
level skills offered higher returns to be extracted from investment in physical capital. Another
study of regional economic performance and human capital in Spain that is worth noting is the
work of Serrano and Cabrer (2004). They suggested that local sector human capital and
specialisation patterns, public R&D efforts (local and from other regions) and international techno-
logical imports reduced growth differentials in Spanish regions. This kind of analysis can also be
further disaggregated geographically (when suitable data are available) and a good example of
this is the work of Eriksson (2004) who presents a more localised study of Swedish data, showing
how proximity to workers with high levels of skills and education has a very strong positive
influence on plants.
This implies that increasing inequalities in human capital between regions are likely to be
associated with increasing economic inequalities. Thus in countries where regional economic
disparities are widening, investment in education and training in weaker regions may play a part
in achieving more even growth. Lackenbauer (2004a and 2004b) for example, points to the
uneven spatial impact of intense economic reforms and integration with Western Europe, in
Eastern European countries and that in particular, only a small number of metropolitan areas and
regions bordering the EU have benefited from the transition process. For this reason Lackenbauer
(2004a and 2004b) calls for additional funding in support of some promising EU programmes and
for regional policies such as R&D investment, investment in education and ICT infra-structure, in
order to reduce the cost of and increase the diffusion of innovation.
The case for regional investment in education is well made in numerous European studies.
Ciccone et al. (2004) explore individual and social returns to schooling in macro-regions of Italy
(North West, North East, Centre and South). Their analysis, which includes estimates such as the
effects of schooling on net wages by region, suggests that individual returns to schooling compare
favourably to the return to financial assets, especially in the South of the country and that the
social returns to schooling exceeds that to infrastructures in the South. Mendolicchio (2006) also
looks at individual returns of education in Italy at the macro-region level as well as for the 20
smaller regions of Italy. According to a simulation that Mendolicchio (2006:19) calls "the basic
scenario", the positive effects of education seem to be more important than the negative effects
of taxes and unemployment benefits.
EDUCATION INEQUALITY ACROSS EU REGIONS
67
The case for investment in education and human capital is put forward in a report by de la Fuente
and Ciccone (2002) who reconfirmed that human resources investment can be profitable, that it
promotes economic and productivity growth, as well as technological change and diffusion,
increasing social cohesion. De la Fuente (2003) also looked at the effect of structural fund
spending on Spanish regions, as well as (2009) social cohesion in Spanish regions. The results are
encouraging for the period 1994-2000 with the creation of new jobs and the decrease of the initial
gap in income per capita between regions that received funding and the rest of the country. The
same applies to more recent results (de la Fuente, 2009) that highlight the positive impact of
cohesion support policies. In addition, de la Fuente Moreno (2009) explores whether investment
in human capital could reduce regional disparities in Spain by quantifying the importance of
education as a source of regional income disparities and estimating the social return to
investment. He concluded that education is an important source of regional income disparities
and also that changes in investment patterns may reduce internal inequalities and speed up the
growth of the country as a whole.
Rodríguez-Pose and Fratesi (2004) included education in a discussion of the impact of structural
funds on EU regional growth. They discovered that among criticisms of European development
policies, investment in education and human capital - compared to infrastructure business
support and agriculture - is the only area with significant medium-term and positive returns and
they called for more innovative and region-specific development strategies. Wostner and Šlander
(2009) also discussed education in the context of European Cohesion Policy. In a review of the
literature on the role of public expenditure in relation to economic growth, they arrived at similar
results as Rodríguez-Pose and Fratesi (2004). Although the overall impact of fiscal policies on
long-term economic growth was generally weak, there was a robust effect of investment in
education and infrastructure. Especially with regard to education, ninety percent of the studies
reviewed point to the statistically significant positive impact of such investments for the period
1983-1988. The same applies to the period from 1971 to 2006 with studies on "structural" or
"development" spending concluding that public spending on education has a particularly
significant positive effect.
Thus, the overwhelming majority of studies suggest that investment in education, training and
infrastructure is invaluable and has a positive impact on regions and individuals. However, there
are a number of caveats. Firstly, other studies caution against a simple model of "increasing
stocks of human capital lead to stronger economic performance" suggesting that other factors
matter too, including accessibility and demographic factors, and the need to match supply and
demand. Rodríguez-Pose and Vilalta-Bufi (2005) have investigated the links between human
capital and regional economic performance in the EU. Their analysis suggests that the economic
performance of European regions is generally associated with differences in human capital. But
they also suggest that, in contrast to other studies in this field, factors such as matching
educational supply and local labour market needs as well as job satisfaction and migration may
actually have a stronger relationship with economic performance, rather than traditional
measures of "educational stock". Returns to education may differ in different regions. De la
Fuente and Vives (1995) discuss the role of infrastructure and education as instruments of
regional policy, presenting evidence from Spain. They argue that theoretically, public investment
in education reduces regional disparities; however, in practice it depends on the overall volume of
the investment and the extent to which its regional allocation varies with regional need. De la
Croix and Vandenberghe (2004) present a very interesting study of the spatial distribution of
human capital in Belgian regions and its impact on economic growth. Their analysis includes a
number of educational attainment measures that enables them to explore issues of regional
convergence in Belgium. They also present estimates of the effects of schooling on wages and
employment and report strong regional variation of the effect of education on employment, with
stronger effects in regions where the average employment rate is low.
EDUCATION INEQUALITY ACROSS EU REGIONS
68
Secondly, investment in human capital does not necessarily have a direct relationship either with
human capital stocks or economic performance. Dreger et al. (2009) looked at EU regional data
on human capital and regional economic performance. Their analysis suggests that although
"schooling and human resources in science and technology explain some part of the regional
human capital stock, they cannot explain the bulk of the experience". One factor is migration -
investment in "home-grown" talent may be less important for growth than in-migration of highly
skilled workers educated and trained elsewhere, while a variety of factors may lead to out-
migration of highly educated people. One line of argument is that while high levels of education in
the home population may support employment and wage levels in the general population, within
knowledge economies it is the locational decisions of key highly skilled individuals which creates
clusters of innovation, activity and inward investment and fuels growth. For example Maier et al.
(2007) explored the impact of the spatial distribution of "star scientists" upon regional
development. In particular they argued that knowledge and highly skilled individuals play a key
role in the development and growth of cities. Their analysis empirically tested this hypothesis and
showed that the mobility patterns of so called "star scientists" had a highly uneven nature in
favour of a limited set of countries and regions that were capable to act as magnets for scientific
talent benefit. Florida (2002) has influentially argued that the capacities of cities to attract “the
creative class” is critical to their economic development and that what attracts such people is
investment in culture and support for diversity – the creation of "Bohemian" spaces where
creative people can be themselves and indulge their leisure interests. This is not unrelated to
education. University towns are often associated with such cultural spaces, as well as being able
to attract intelligent young people at the start of their careers. Understanding migration patterns
and motivations is therefore a critical element in understanding relationships between education,
human capital and regional economic performance. One study which attempts this is the work of
Champion and Coombes (2007) which looked at human capital movement affecting 27 British city
regions using British 2001 Census data. The analysis includes the performance of all city regions in
terms of in and out-migration of human capital and confirms the findings of previous studies
about the dominant role of the city region of London in the British migration system.
Thirdly, where educational levels are implicated as an important factor in regional economic
performance, the literature suggests that it is levels of tertiary education that are most strongly
linked with stronger performance. In other words, human capital counts most at higher levels. For
example, Ramos et al. (2009) explored the distribution of human capital in relation to productivity
and regional inequalities in Spain. In particular, they investigated the influence of different levels
of schooling on regional productivity and growth and also analysed whether there were any
differences in the effects of this human capital on neighbouring regions reflecting its composition.
Their analysis suggests that the composition of human capital improves regional productivity and
growth and that tertiary studies especially have a significant positive effect on regional
productivity. Similarly they found that secondary studies also have a significant positive impact on
regional growth, but that was not the case for primary studies which had no effect on the
variables they considered. Tondl and Vuksic (2003) looked at regions in central and eastern
Europe and highlighted the role of foreign direct investment, human resources and geography.
They suggested that the high level of secondary education in eastern European regions played no
role with regard to growth but that higher education, in contrast, served to facilitate technology
transfer. This would suggest that while overall levels of rates of primary and secondary education
may be important building blocks (and important for social reasons) rates of progression of
students into tertiary education are critical for economic performance, as well the ability to attract
students into tertiary education from elsewhere, and retain them following their studies.
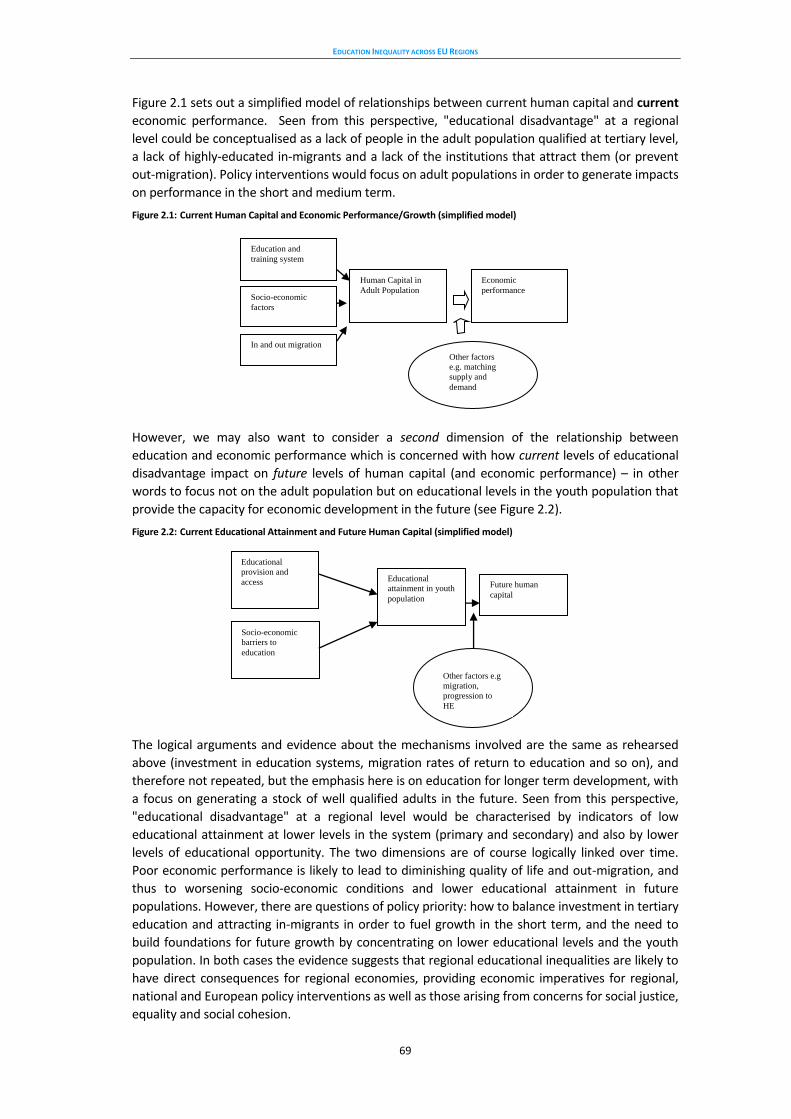
EDUCATION INEQUALITY ACROSS EU REGIONS
69
Figure 2.1 sets out a simplified model of relationships between current human capital and current
economic performance. Seen from this perspective, "educational disadvantage" at a regional
level could be conceptualised as a lack of people in the adult population qualified at tertiary level,
a lack of highly-educated in-migrants and a lack of the institutions that attract them (or prevent
out-migration). Policy interventions would focus on adult populations in order to generate impacts
on performance in the short and medium term.
Figure 2.1: Current Human Capital and Economic Performance/Growth (simplified model)
However, we may also want to consider a second dimension of the relationship between
education and economic performance which is concerned with how current levels of educational
disadvantage impact on future levels of human capital (and economic performance) – in other
words to focus not on the adult population but on educational levels in the youth population that
provide the capacity for economic development in the future (see Figure 2.2).
Figure 2.2: Current Educational Attainment and Future Human Capital (simplified model)
The logical arguments and evidence about the mechanisms involved are the same as rehearsed
above (investment in education systems, migration rates of return to education and so on), and
therefore not repeated, but the emphasis here is on education for longer term development, with
a focus on generating a stock of well qualified adults in the future. Seen from this perspective,
"educational disadvantage" at a regional level would be characterised by indicators of low
educational attainment at lower levels in the system (primary and secondary) and also by lower
levels of educational opportunity. The two dimensions are of course logically linked over time.
Poor economic performance is likely to lead to diminishing quality of life and out-migration, and
thus to worsening socio-economic conditions and lower educational attainment in future
populations. However, there are questions of policy priority: how to balance investment in tertiary
education and attracting in-migrants in order to fuel growth in the short term, and the need to
build foundations for future growth by concentrating on lower educational levels and the youth
population. In both cases the evidence suggests that regional educational inequalities are likely to
have direct consequences for regional economies, providing economic imperatives for regional,
national and European policy interventions as well as those arising from concerns for social justice,
equality and social cohesion.
Human Capital in
Adult Population
Economic
performance
In and out migration
Education and
training system
Socio-economic
factors
Other factors
e.g. matching
supply and
demand
Future human
capital
Educational
attainment in youth
population
Educational
provision and
access
Socio-economic
barriers to
education
Other factors e.g
migration,
progression to
HE
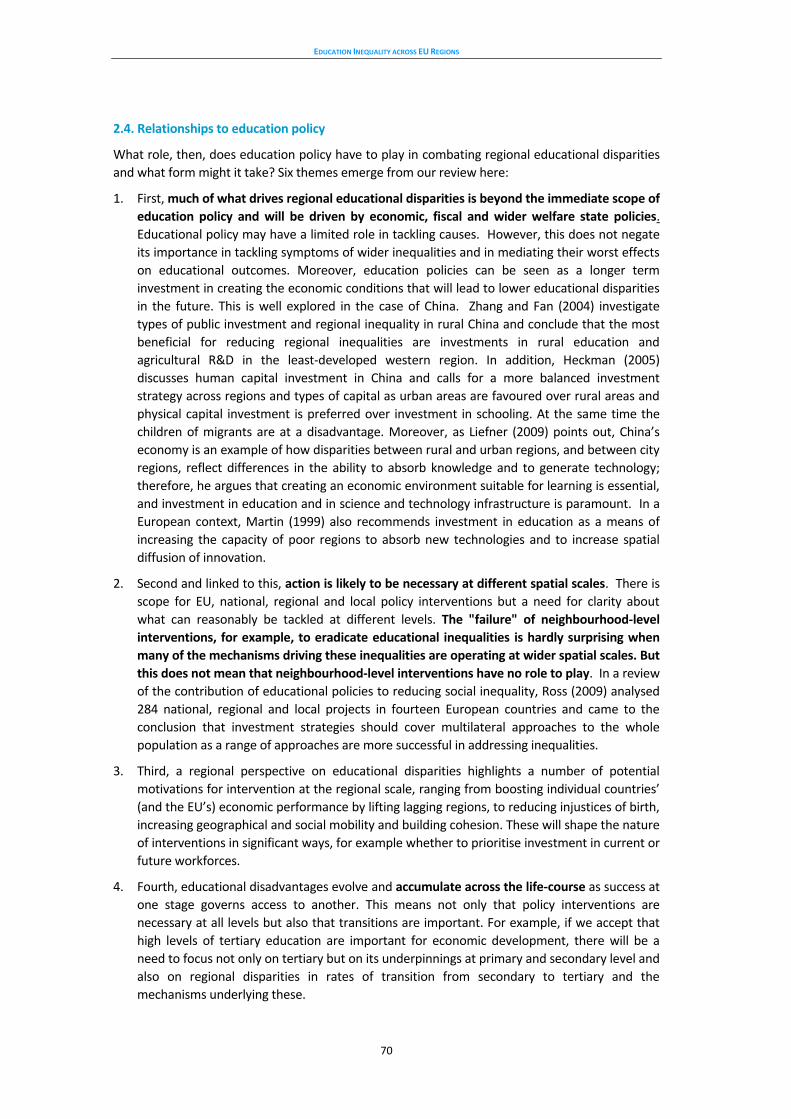
EDUCATION INEQUALITY ACROSS EU REGIONS
70
2.4. Relationships to education policy
What role, then, does education policy have to play in combating regional educational disparities
and what form might it take? Six themes emerge from our review here:
1. First, much of what drives regional educational disparities is beyond the immediate scope of
education policy and will be driven by economic, fiscal and wider welfare state policies.
Educational policy may have a limited role in tackling causes. However, this does not negate
its importance in tackling symptoms of wider inequalities and in mediating their worst effects
on educational outcomes. Moreover, education policies can be seen as a longer term
investment in creating the economic conditions that will lead to lower educational disparities
in the future. This is well explored in the case of China. Zhang and Fan (2004) investigate
types of public investment and regional inequality in rural China and conclude that the most
beneficial for reducing regional inequalities are investments in rural education and
agricultural R&D in the least-developed western region. In addition, Heckman (2005)
discusses human capital investment in China and calls for a more balanced investment
strategy across regions and types of capital as urban areas are favoured over rural areas and
physical capital investment is preferred over investment in schooling. At the same time the
children of migrants are at a disadvantage. Moreover, as Liefner (2009) points out, China’s
economy is an example of how disparities between rural and urban regions, and between city
regions, reflect differences in the ability to absorb knowledge and to generate technology;
therefore, he argues that creating an economic environment suitable for learning is essential,
and investment in education and in science and technology infrastructure is paramount. In a
European context, Martin (1999) also recommends investment in education as a means of
increasing the capacity of poor regions to absorb new technologies and to increase spatial
diffusion of innovation.
2. Second and linked to this, action is likely to be necessary at different spatial scales. There is
scope for EU, national, regional and local policy interventions but a need for clarity about
what can reasonably be tackled at different levels. The "failure" of neighbourhood-level
interventions, for example, to eradicate educational inequalities is hardly surprising when
many of the mechanisms driving these inequalities are operating at wider spatial scales. But
this does not mean that neighbourhood-level interventions have no role to play. In a review
of the contribution of educational policies to reducing social inequality, Ross (2009) analysed
284 national, regional and local projects in fourteen European countries and came to the
conclusion that investment strategies should cover multilateral approaches to the whole
population as a range of approaches are more successful in addressing inequalities.
3. Third, a regional perspective on educational disparities highlights a number of potential
motivations for intervention at the regional scale, ranging from boosting individual countries’
(and the EU’s) economic performance by lifting lagging regions, to reducing injustices of birth,
increasing geographical and social mobility and building cohesion. These will shape the nature
of interventions in significant ways, for example whether to prioritise investment in current or
future workforces.
4. Fourth, educational disadvantages evolve and accumulate across the life-course as success at
one stage governs access to another. This means not only that policy interventions are
necessary at all levels but also that transitions are important. For example, if we accept that
high levels of tertiary education are important for economic development, there will be a
need to focus not only on tertiary but on its underpinnings at primary and secondary level and
also on regional disparities in rates of transition from secondary to tertiary and the
mechanisms underlying these.
EDUCATION INEQUALITY ACROSS EU REGIONS
71
5. Fifth, migration is a key factor in policy priorities and evaluation. Clearly, neither policies to
tackle socio-economic disadvantage nor policies of educational investment will lead to greater
future human capital in the event of high out-migration from a region. For instance, a recent
study by Labrianidis (2011), entitled "Investing in Leaving", investigates and highlights the
extent as well as the causes (and impacts) of brain drain outflows from Greece. In addition,
Martin (1998) provides an interesting discussion of the role of regional policies in Europe,
including educational policies. He highlights the migration of human capital, which means that
increasing education infrastructure in poorer regions indirectly benefits the richest regions in
a country. In the same vein, Suedekum (2005) provides an overview of what he calls the
"pitfalls of regional education policy", namely the brain drain of recipient areas of education
subsidies due to the increase of geographic mobility that is associated with personal skill level.
On the other hand, as de la Fuente Moreno (2009) argues, this may only cause some concern
if the focus is on regions as such. He advocates that the focus should be on the people and on
regional investment that will benefit the country as a whole, and in that case the degree of
mobility of the populations of low-income regions should not affect educational investment.
On the other hand, if higher level qualifications are what counts in economic growth (and
some studies point to the importance of very small numbers of very highly qualified and
specialised individuals) then attracting highly-qualified in-migrants may be as important as
investment in lower strata of education. The presence of universities will be a key issue334.
6. Sixth, educational provision cannot be assumed to be a neutral force. Modes of provision,
access and regulation can all produce educational inequalities as well as reducing them, as a
vast body of work in educational sociology demonstrates.
Perhaps most fundamentally, the material in this chapter suggests that policy should be based on
a close understanding of causes and consequences of particular observed regional disparities,
identifying:
Compositional factors leading to particular regional manifestations of wider structural forces.
Spatial factors at the regional level that shape particular regional experiences (such as political
economy, history, location).
The relative size and importance of regional disparities compared to inter-national and intra-
regional differences.
The extent and nature of regional differences in education systems.
The data presented in Chapters 3 and 4 provide a platform for such further detailed analysis.
334
It is also interesting to note that there have been good case studies of the local regional impacts of Universities which could be the basis for further work (e.g. see Armstrong, 1993; Armstrong et al., 1997; Labrianidis, 1995).

EDUCATION INEQUALITY ACROSS EU REGIONS
73
Chapter Three. Mapping educational inequality across EU regions
This chapter provides a (literal) "mapping" of educational inequalities across the EU, painting a picture - to the degree that this is possible on the basis of publicly available data for EU regions - of patterns of educational opportunities and outcomes and their geographic and regional variations.
As noted in the introductory chapter, there is a general paucity of research into the geographic dimension of educational inequalities across the EU, with most studies focusing on differences between countries rather than regions. This paucity may be attributed to some extent to social science (and in particular educational) researchers’ unfamiliarity with geographic data and methods as well as the general lack of good quality geographic data on education-related variables at the regional and local level. On the other hand, most human geographers with expertise in Geographical Information Systems and relevant data and methods do not have adequate knowledge of education theory and policy. There is therefore a need for complementarity of expertise between researchers working in fields such as human geography, education economics, and sociology of education, given the interdisciplinary nature of this subject. Achieving such a complementarity is a challenge that we have attempted to take up in this report, and that we seek to realise in this chapter.
Ideally, in order to address the geographical dimension of the issues discussed in Chapter 2 in the EU, we would need to have at our disposal data on all aspects of the models set out in Figures 2.1 and 2.2.
Thus in relation to current differences in human capital, we would want measures of skills and qualifications in the adult population, particularly at tertiary level, and perhaps indicators of migration patterns of highly-educated adults or (as a proxy) the institutions that attract them.
In relation to future differences in human capital we would want to look at measures of educational attainment in the current youth population, and rates of progression to higher education. Since this report focuses on education policy rather than investments in policies to tackle socio-economic disadvantage, we would also want to look at measures of educational opportunity, access and participation.
It should be noted that there is considerable variation in the educational data availability, quality and geo-graphical aggregation (or disaggregation) across EU member states. For instance, as seen in Chapter 2 (and as will be illustrated in Chapter 5), there is (NUTS3) data on educational attainment as well as outcomes at very local levels in Britain (Thomas et al., 2009) and at small regional (prefecture) level in Greece (KANEP/GSEE, 2010). It should also be noted that there are on-going efforts by Eurostat to bring such regional data together in one database (e.g. see European Commission, 2009 and 2010), but not all such data is readily available for researchers interested in performing analysis at the EU level.
In the context of this study, we conducted a review of all education-related variables in the EU which were available through Eurostat’s web-site at the time of conducting the research for this report and we extracted a selection of datasets that were available at the geographic level of NUTS 1 and NUTS2 and we then further analysed them and put them together in a geographical data-base that can be used for mapping and analysis. We explored all datasets readily available to researchers by Eurostat, trying to identify variables that are available at NUTS2 level or smaller. Table 3.1 (next page) lists the education-related variables (indicators) that we included in our database. These can be distinguished between:
a. educational target groups and opportunity indicators; and
b. outcome and performance indicators.
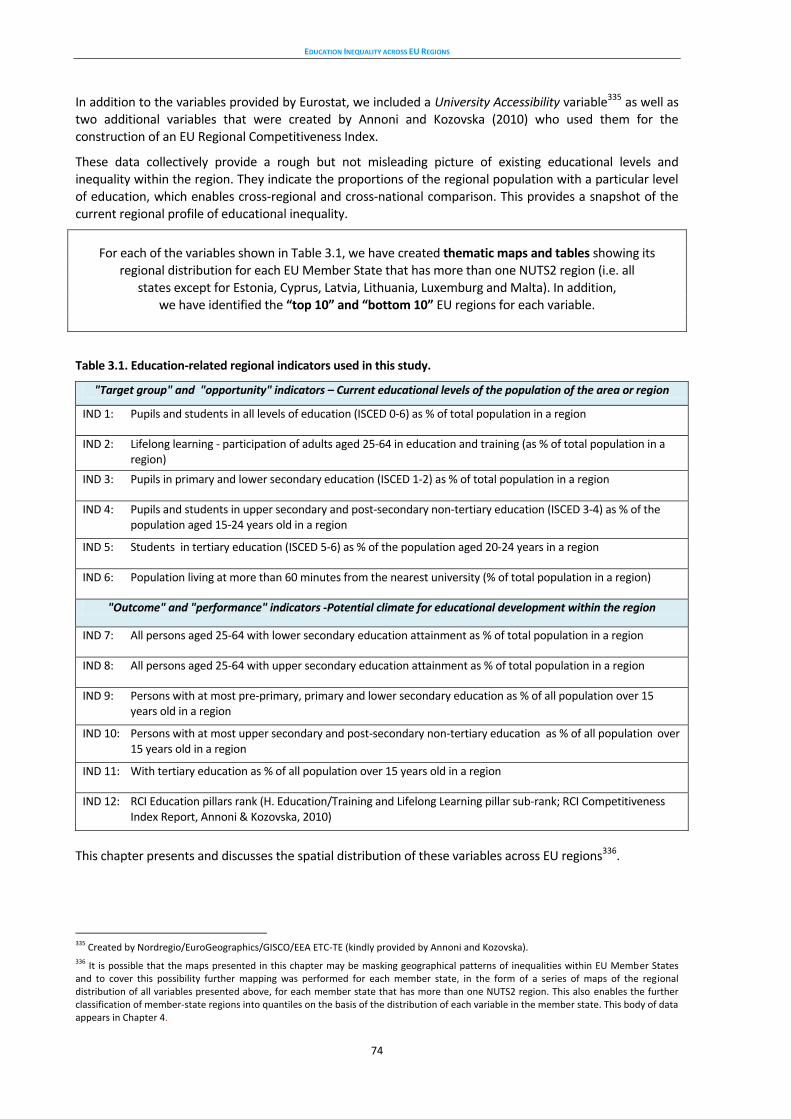
EDUCATION INEQUALITY ACROSS EU REGIONS
74
In addition to the variables provided by Eurostat, we included a University Accessibility variable335 as well as two additional variables that were created by Annoni and Kozovska (2010) who used them for the construction of an EU Regional Competitiveness Index.
These data collectively provide a rough but not misleading picture of existing educational levels and inequality within the region. They indicate the proportions of the regional population with a particular level of education, which enables cross-regional and cross-national comparison. This provides a snapshot of the current regional profile of educational inequality.
For each of the variables shown in Table 3.1, we have created thematic maps and tables showing its regional distribution for each EU Member State that has more than one NUTS2 region (i.e. all
states except for Estonia, Cyprus, Latvia, Lithuania, Luxemburg and Malta). In addition, we have identified the “top 10” and “bottom 10” EU regions for each variable.
Table 3.1. Education-related regional indicators used in this study.
"Target group" and "opportunity" indicators – Current educational levels of the population of the area or region
IND 1: Pupils and students in all levels of education (ISCED 0-6) as % of total population in a region
IND 2: Lifelong learning - participation of adults aged 25-64 in education and training (as % of total population in a region)
IND 3: Pupils in primary and lower secondary education (ISCED 1-2) as % of total population in a region
IND 4: Pupils and students in upper secondary and post-secondary non-tertiary education (ISCED 3-4) as % of the population aged 15-24 years old in a region
IND 5: Students in tertiary education (ISCED 5-6) as % of the population aged 20-24 years in a region
IND 6: Population living at more than 60 minutes from the nearest university (% of total population in a region)
"Outcome" and "performance" indicators -Potential climate for educational development within the region
IND 7: All persons aged 25-64 with lower secondary education attainment as % of total population in a region
IND 8: All persons aged 25-64 with upper secondary education attainment as % of total population in a region
IND 9: Persons with at most pre-primary, primary and lower secondary education as % of all population over 15 years old in a region
IND 10: Persons with at most upper secondary and post-secondary non-tertiary education as % of all population over 15 years old in a region
IND 11: With tertiary education as % of all population over 15 years old in a region
IND 12: RCI Education pillars rank (H. Education/Training and Lifelong Learning pillar sub-rank; RCI Competitiveness Index Report, Annoni & Kozovska, 2010)
This chapter presents and discusses the spatial distribution of these variables across EU regions336.
335
Created by Nordregio/EuroGeographics/GISCO/EEA ETC-TE (kindly provided by Annoni and Kozovska). 336
It is possible that the maps presented in this chapter may be masking geographical patterns of inequalities within EU Member States and to cover this possibility further mapping was performed for each member state, in the form of a series of maps of the regional distribution of all variables presented above, for each member state that has more than one NUTS2 region. This also enables the further classification of member-state regions into quantiles on the basis of the distribution of each variable in the member state. This body of data appears in Chapter 4.
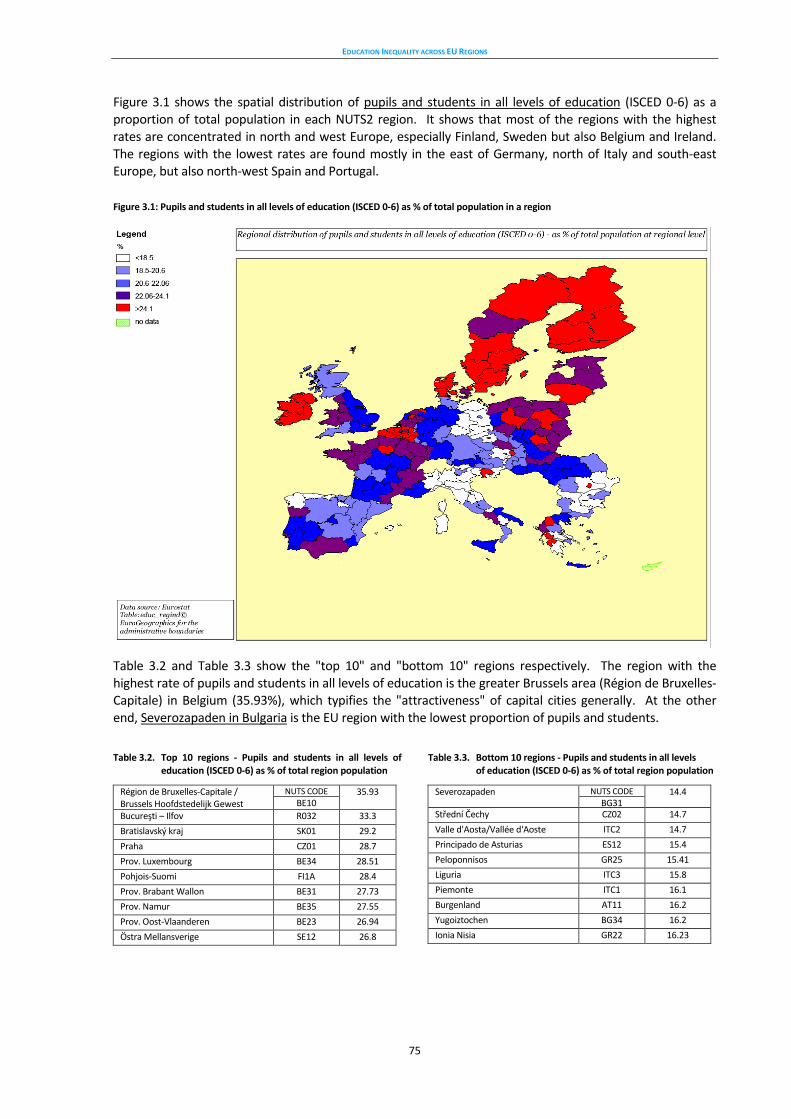
EDUCATION INEQUALITY ACROSS EU REGIONS
75
Figure 3.1 shows the spatial distribution of pupils and students in all levels of education (ISCED 0-6) as a proportion of total population in each NUTS2 region. It shows that most of the regions with the highest rates are concentrated in north and west Europe, especially Finland, Sweden but also Belgium and Ireland. The regions with the lowest rates are found mostly in the east of Germany, north of Italy and south-east Europe, but also north-west Spain and Portugal.
Figure 3.1: Pupils and students in all levels of education (ISCED 0-6) as % of total population in a region
Table 3.2 and Table 3.3 show the "top 10" and "bottom 10" regions respectively. The region with the highest rate of pupils and students in all levels of education is the greater Brussels area (Région de Bruxelles-Capitale) in Belgium (35.93%), which typifies the "attractiveness" of capital cities generally. At the other end, Severozapaden in Bulgaria is the EU region with the lowest proportion of pupils and students.
Table 3.2. Top 10 regions - Pupils and students in all levels of education (ISCED 0-6) as % of total region population
Région de Bruxelles-Capitale / Brussels Hoofdstedelijk Gewest
NUTS CODE 35.93 BE10
Bucureşti – Ilfov R032 33.3
Bratislavský kraj SK01 29.2
Praha CZ01 28.7
Prov. Luxembourg BE34 28.51
Pohjois-Suomi FI1A 28.4
Prov. Brabant Wallon BE31 27.73
Prov. Namur BE35 27.55
Prov. Oost-Vlaanderen BE23 26.94
Östra Mellansverige SE12 26.8
Table 3.3. Bottom 10 regions - Pupils and students in all levels of education (ISCED 0-6) as % of total region population
Severozapaden
NUTS CODE 14.4
BG31
Střední Čechy CZ02 14.7
Valle d'Aosta/Vallée d'Aoste ITC2 14.7
Principado de Asturias ES12 15.4
Peloponnisos GR25 15.41
Liguria ITC3 15.8
Piemonte ITC1 16.1
Burgenland AT11 16.2
Yugoiztochen BG34 16.2
Ionia Nisia GR22 16.23
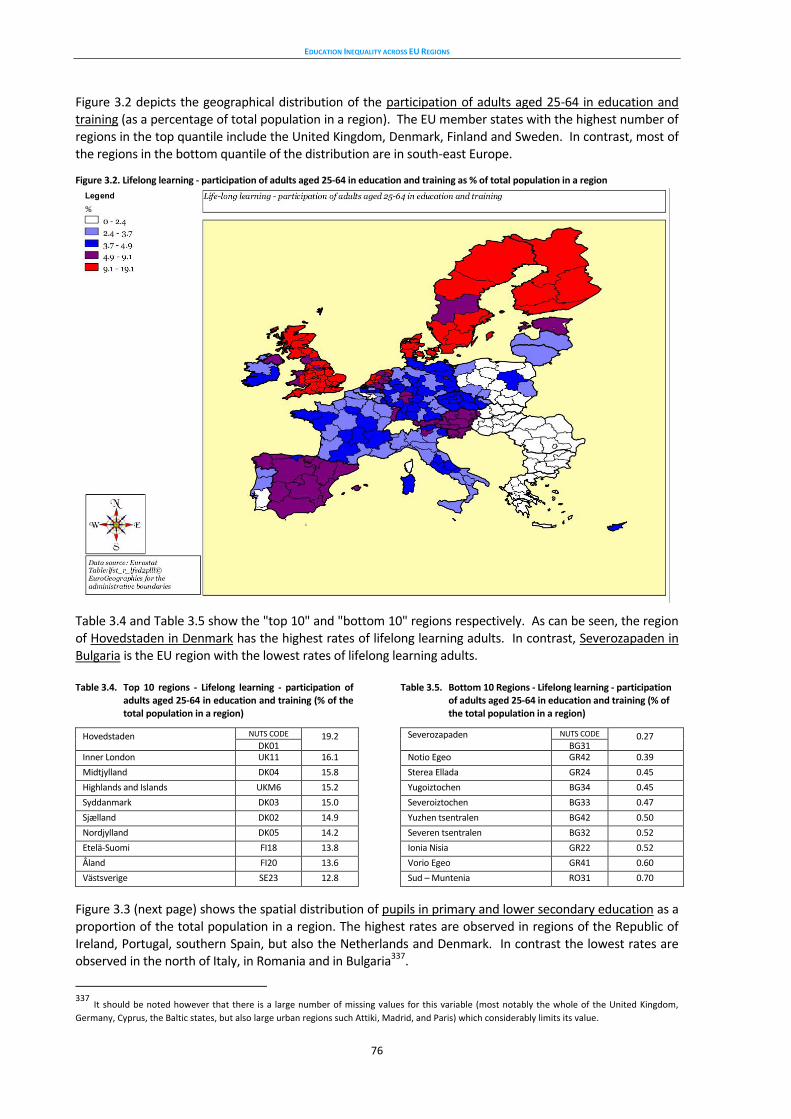
EDUCATION INEQUALITY ACROSS EU REGIONS
76
Figure 3.2 depicts the geographical distribution of the participation of adults aged 25-64 in education and training (as a percentage of total population in a region). The EU member states with the highest number of regions in the top quantile include the United Kingdom, Denmark, Finland and Sweden. In contrast, most of the regions in the bottom quantile of the distribution are in south-east Europe.
Figure 3.2. Lifelong learning - participation of adults aged 25-64 in education and training as % of total population in a region
Table 3.4 and Table 3.5 show the "top 10" and "bottom 10" regions respectively. As can be seen, the region of Hovedstaden in Denmark has the highest rates of lifelong learning adults. In contrast, Severozapaden in Bulgaria is the EU region with the lowest rates of lifelong learning adults. Table 3.4. Top 10 regions - Lifelong learning - participation of adults aged 25-64 in education and training (% of the total population in a region)
Hovedstaden NUTS CODE 19.2 DK01
Inner London UK11 16.1
Midtjylland DK04 15.8
Highlands and Islands UKM6 15.2
Syddanmark DK03 15.0
Sjælland DK02 14.9
Nordjylland DK05 14.2
Etelä-Suomi FI18 13.8
Åland FI20 13.6
Västsverige SE23 12.8
Table 3.5. Bottom 10 Regions - Lifelong learning - participation of adults aged 25-64 in education and training (% of the total population in a region)
Severozapaden NUTS CODE 0.27 BG31
Notio Egeo GR42 0.39
Sterea Ellada GR24 0.45
Yugoiztochen BG34 0.45
Severoiztochen BG33 0.47
Yuzhen tsentralen BG42 0.50
Severen tsentralen BG32 0.52
Ionia Nisia GR22 0.52
Vorio Egeo GR41 0.60
Sud – Muntenia
RO31 0.70
Figure 3.3 (next page) shows the spatial distribution of pupils in primary and lower secondary education as a proportion of the total population in a region. The highest rates are observed in regions of the Republic of Ireland, Portugal, southern Spain, but also the Netherlands and Denmark. In contrast the lowest rates are observed in the north of Italy, in Romania and in Bulgaria337.
337 It should be noted however that there is a large number of missing values for this variable (most notably the whole of the United Kingdom,
Germany, Cyprus, the Baltic states, but also large urban regions such Attiki, Madrid, and Paris) which considerably limits its value.
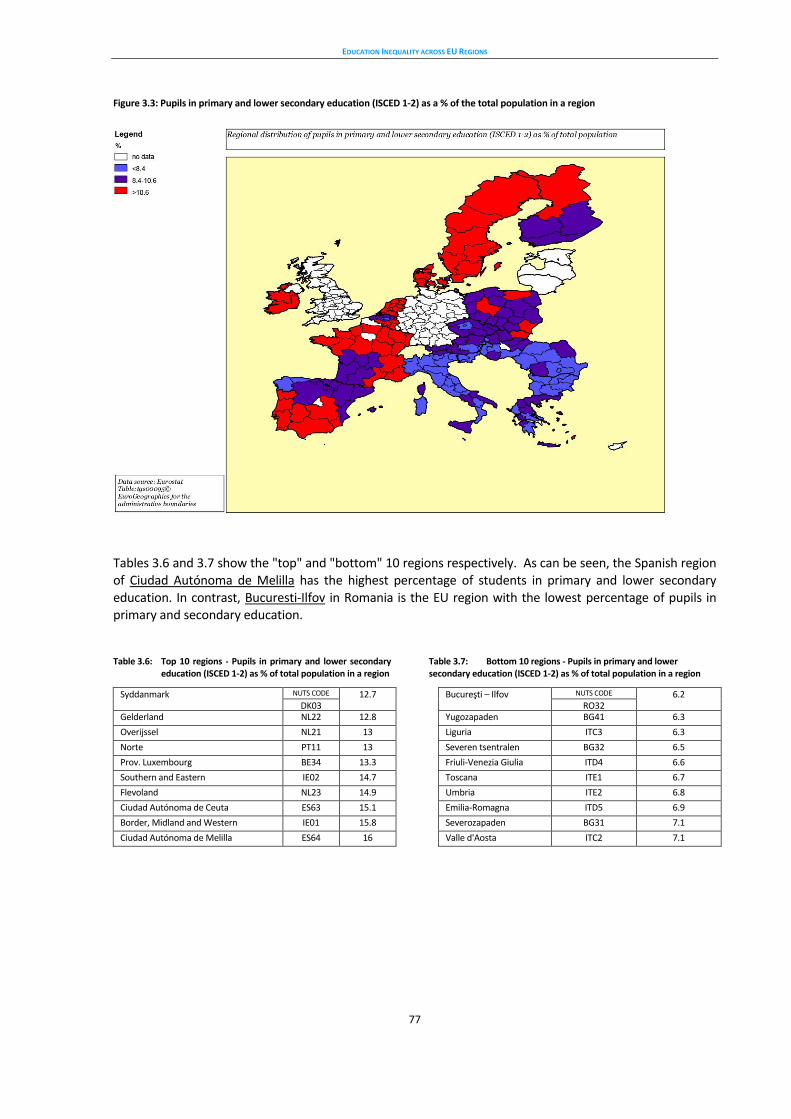
EDUCATION INEQUALITY ACROSS EU REGIONS
77
Figure 3.3: Pupils in primary and lower secondary education (ISCED 1-2) as a % of the total population in a region
Tables 3.6 and 3.7 show the "top" and "bottom" 10 regions respectively. As can be seen, the Spanish region of Ciudad Autónoma de Melilla has the highest percentage of students in primary and lower secondary education. In contrast, Bucuresti-Ilfov in Romania is the EU region with the lowest percentage of pupils in primary and secondary education.
Table 3.6: Top 10 regions - Pupils in primary and lower secondary education (ISCED 1-2) as % of total population in a region
Syddanmark NUTS CODE 12.7 DK03
Gelderland NL22 12.8
Overijssel NL21 13
Norte PT11 13
Prov. Luxembourg BE34 13.3
Southern and Eastern IE02 14.7
Flevoland NL23 14.9
Ciudad Autónoma de Ceuta ES63 15.1
Border, Midland and Western IE01 15.8
Ciudad Autónoma de Melilla ES64 16
Table 3.7: Bottom 10 regions - Pupils in primary and lower secondary education (ISCED 1-2) as % of total population in a region
Bucureşti – Ilfov NUTS CODE 6.2 RO32
Yugozapaden BG41 6.3
Liguria ITC3 6.3
Severen tsentralen BG32 6.5
Friuli-Venezia Giulia ITD4 6.6
Toscana ITE1 6.7
Umbria ITE2 6.8
Emilia-Romagna ITD5 6.9
Severozapaden BG31 7.1
Valle d'Aosta ITC2 7.1
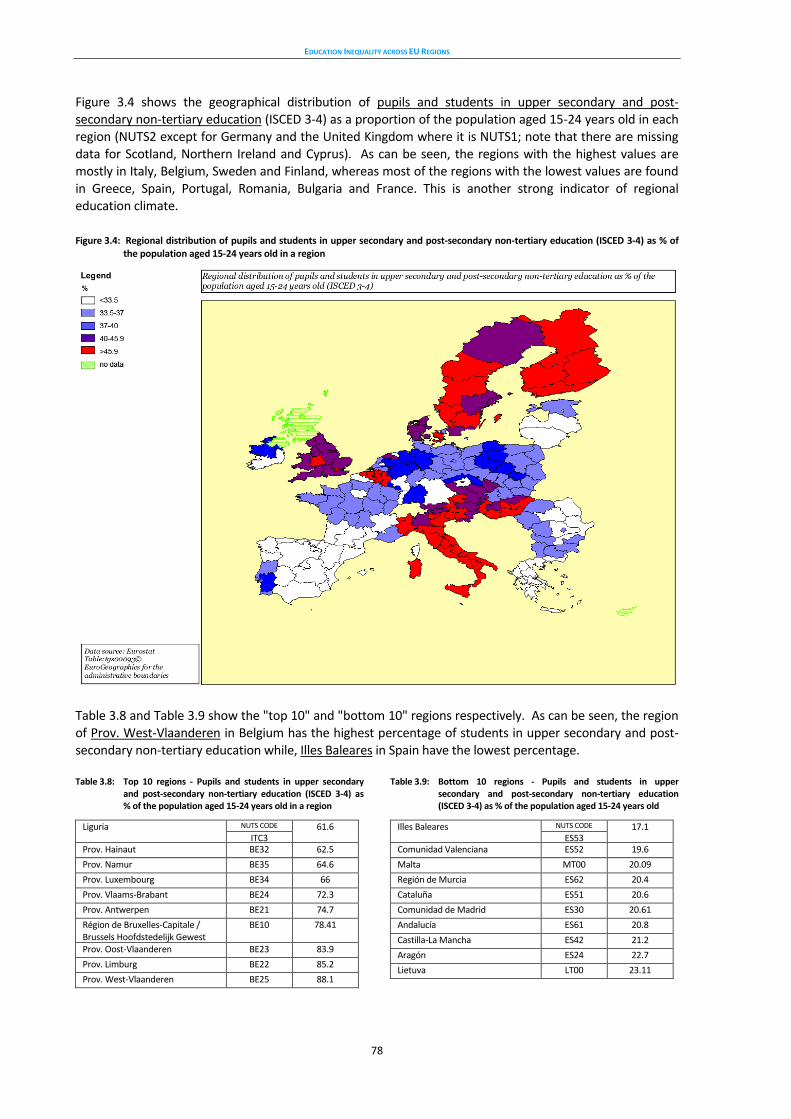
EDUCATION INEQUALITY ACROSS EU REGIONS
78
Figure 3.4 shows the geographical distribution of pupils and students in upper secondary and post-secondary non-tertiary education (ISCED 3-4) as a proportion of the population aged 15-24 years old in each region (NUTS2 except for Germany and the United Kingdom where it is NUTS1; note that there are missing data for Scotland, Northern Ireland and Cyprus). As can be seen, the regions with the highest values are mostly in Italy, Belgium, Sweden and Finland, whereas most of the regions with the lowest values are found in Greece, Spain, Portugal, Romania, Bulgaria and France. This is another strong indicator of regional education climate.
Figure 3.4: Regional distribution of pupils and students in upper secondary and post-secondary non-tertiary education (ISCED 3-4) as % of the population aged 15-24 years old in a region
Table 3.8 and Table 3.9 show the "top 10" and "bottom 10" regions respectively. As can be seen, the region of Prov. West-Vlaanderen in Belgium has the highest percentage of students in upper secondary and post-secondary non-tertiary education while, Illes Baleares in Spain have the lowest percentage. Table 3.8: Top 10 regions - Pupils and students in upper secondary and post-secondary non-tertiary education (ISCED 3-4) as % of the population aged 15-24 years old in a region
Liguria NUTS CODE 61.6 ITC3
Prov. Hainaut BE32 62.5
Prov. Namur BE35 64.6
Prov. Luxembourg BE34 66
Prov. Vlaams-Brabant BE24 72.3
Prov. Antwerpen BE21 74.7
Région de Bruxelles-Capitale / Brussels Hoofdstedelijk Gewest
BE10 78.41
Prov. Oost-Vlaanderen BE23 83.9
Prov. Limburg BE22 85.2
Prov. West-Vlaanderen BE25 88.1
Table 3.9: Bottom 10 regions - Pupils and students in upper secondary and post-secondary non-tertiary education (ISCED 3-4) as % of the population aged 15-24 years old
Illes Baleares NUTS CODE 17.1 ES53
Comunidad Valenciana ES52 19.6
Malta MT00 20.09
Región de Murcia ES62 20.4
Cataluña ES51 20.6
Comunidad de Madrid ES30 20.61
Andalucía ES61 20.8
Castilla-La Mancha ES42 21.2
Aragón ES24 22.7
Lietuva LT00 23.11
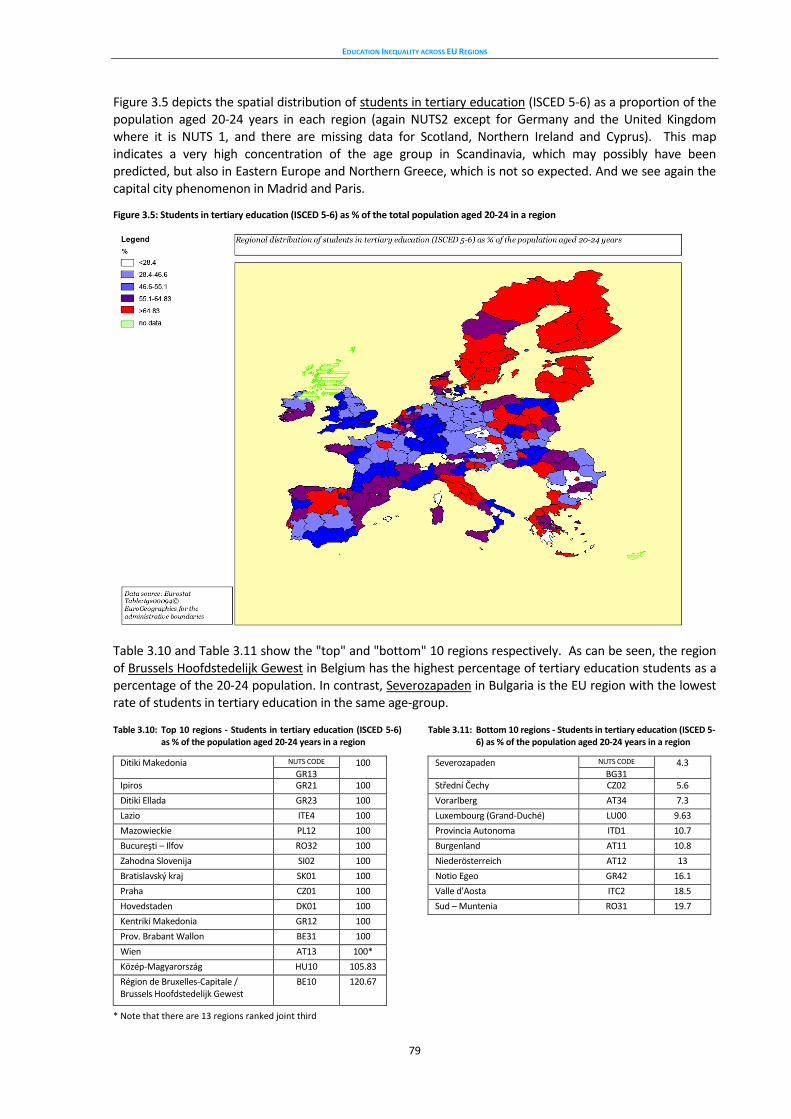
EDUCATION INEQUALITY ACROSS EU REGIONS
79
Figure 3.5 depicts the spatial distribution of students in tertiary education (ISCED 5-6) as a proportion of the population aged 20-24 years in each region (again NUTS2 except for Germany and the United Kingdom where it is NUTS 1, and there are missing data for Scotland, Northern Ireland and Cyprus). This map indicates a very high concentration of the age group in Scandinavia, which may possibly have been predicted, but also in Eastern Europe and Northern Greece, which is not so expected. And we see again the capital city phenomenon in Madrid and Paris.
Figure 3.5: Students in tertiary education (ISCED 5-6) as % of the total population aged 20-24 in a region
Table 3.10 and Table 3.11 show the "top" and "bottom" 10 regions respectively. As can be seen, the region of Brussels Hoofdstedelijk Gewest in Belgium has the highest percentage of tertiary education students as a percentage of the 20-24 population. In contrast, Severozapaden in Bulgaria is the EU region with the lowest rate of students in tertiary education in the same age-group. Table 3.10: Top 10 regions - Students in tertiary education (ISCED 5-6) as % of the population aged 20-24 years in a region
Ditiki Makedonia NUTS CODE 100 GR13
Ipiros GR21 100
Ditiki Ellada GR23 100
Lazio ITE4 100
Mazowieckie PL12 100
Bucureşti – Ilfov RO32 100
Zahodna Slovenija SI02 100
Bratislavský kraj SK01 100
Praha CZ01 100
Hovedstaden DK01 100
Kentriki Makedonia GR12 100
Prov. Brabant Wallon BE31 100
Wien AT13 100*
Közép-Magyarország HU10 105.83
Région de Bruxelles-Capitale / Brussels Hoofdstedelijk Gewest
BE10 120.67
* Note that there are 13 regions ranked joint third
Table 3.11: Bottom 10 regions - Students in tertiary education (ISCED 5- 6) as % of the population aged 20-24 years in a region
Severozapaden NUTS CODE 4.3 BG31
Střední Čechy CZ02 5.6
Vorarlberg AT34 7.3
Luxembourg (Grand-Duché) LU00 9.63
Provincia Autonoma Bolzano/Bozen
ITD1 10.7
Burgenland AT11 10.8
Niederösterreich AT12 13
Notio Egeo GR42 16.1
Valle d'Aosta ITC2 18.5
Sud – Muntenia RO31 19.7
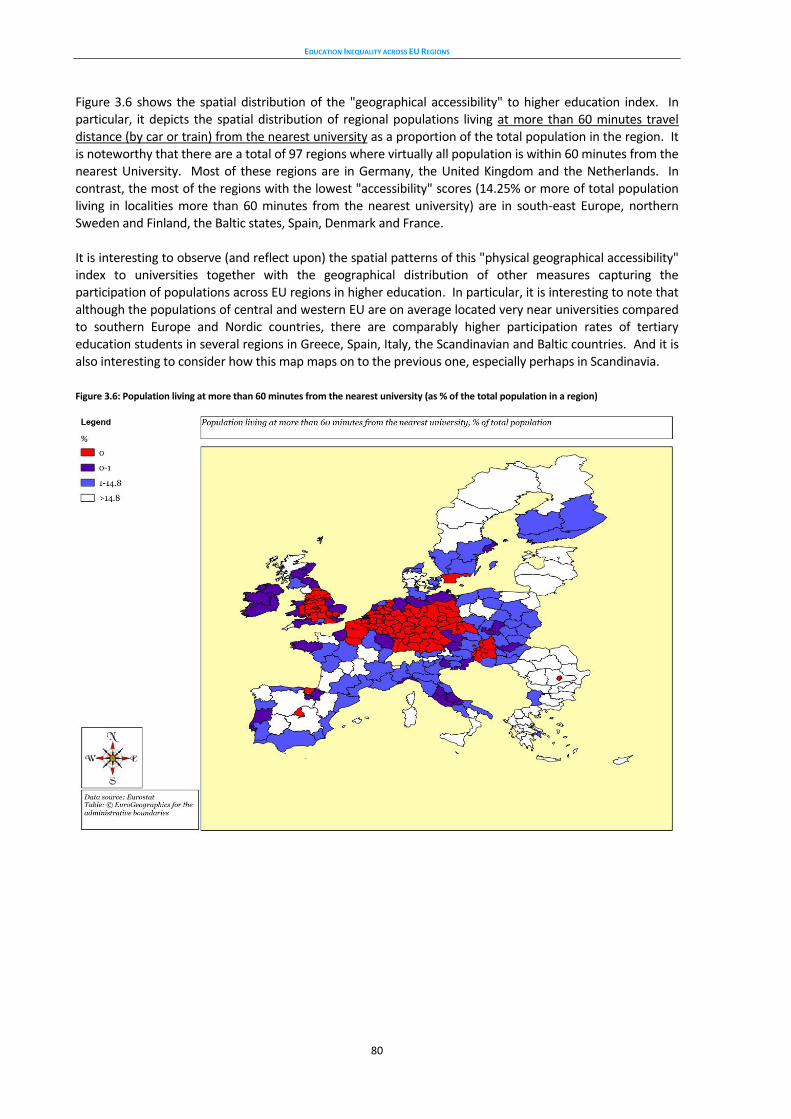
EDUCATION INEQUALITY ACROSS EU REGIONS
80
Figure 3.6 shows the spatial distribution of the "geographical accessibility" to higher education index. In particular, it depicts the spatial distribution of regional populations living at more than 60 minutes travel distance (by car or train) from the nearest university as a proportion of the total population in the region. It is noteworthy that there are a total of 97 regions where virtually all population is within 60 minutes from the nearest University. Most of these regions are in Germany, the United Kingdom and the Netherlands. In contrast, the most of the regions with the lowest "accessibility" scores (14.25% or more of total population living in localities more than 60 minutes from the nearest university) are in south-east Europe, northern Sweden and Finland, the Baltic states, Spain, Denmark and France. It is interesting to observe (and reflect upon) the spatial patterns of this "physical geographical accessibility" index to universities together with the geographical distribution of other measures capturing the participation of populations across EU regions in higher education. In particular, it is interesting to note that although the populations of central and western EU are on average located very near universities compared to southern Europe and Nordic countries, there are comparably higher participation rates of tertiary education students in several regions in Greece, Spain, Italy, the Scandinavian and Baltic countries. And it is also interesting to consider how this map maps on to the previous one, especially perhaps in Scandinavia.
Figure 3.6: Population living at more than 60 minutes from the nearest university (as % of the total population in a region)
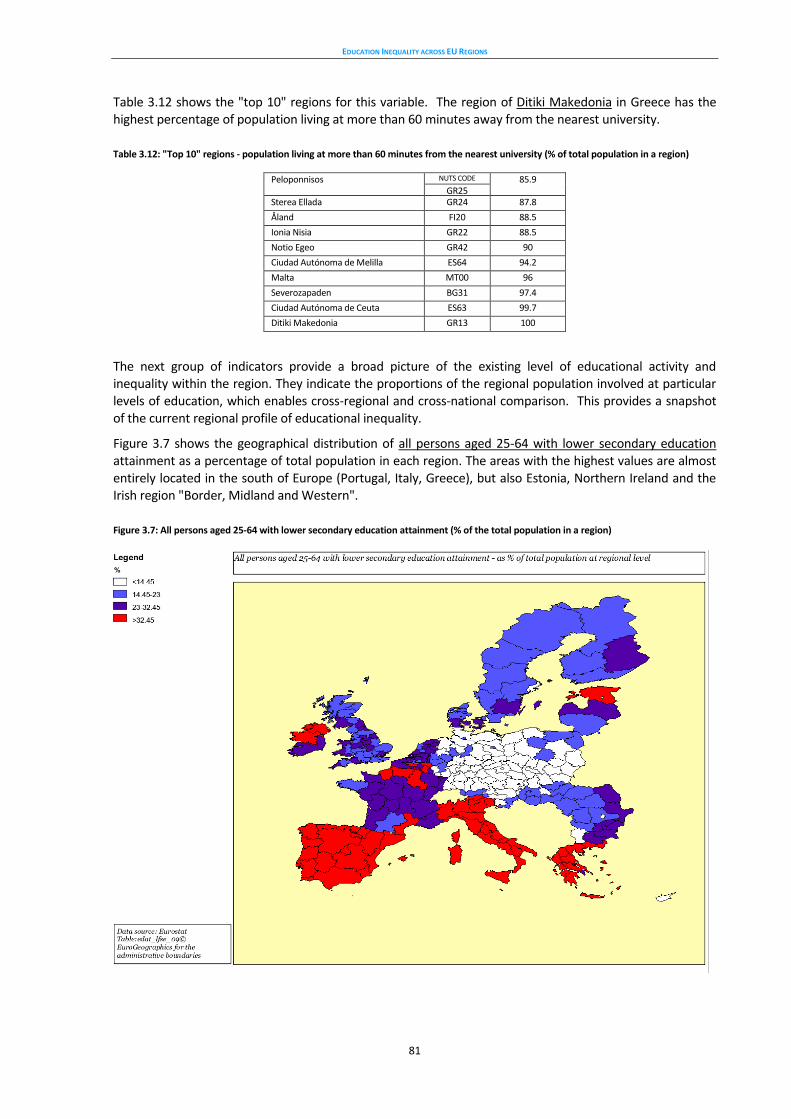
EDUCATION INEQUALITY ACROSS EU REGIONS
81
Table 3.12 shows the "top 10" regions for this variable. The region of Ditiki Makedonia in Greece has the highest percentage of population living at more than 60 minutes away from the nearest university.
Table 3.12: "Top 10" regions - population living at more than 60 minutes from the nearest university (% of total population in a region)
Peloponnisos NUTS CODE 85.9 GR25
Sterea Ellada GR24 87.8
Åland FI20 88.5
Ionia Nisia GR22 88.5
Notio Egeo GR42 90
Ciudad Autónoma de Melilla ES64 94.2
Malta MT00 96
Severozapaden BG31 97.4
Ciudad Autónoma de Ceuta ES63 99.7
Ditiki Makedonia GR13 100
The next group of indicators provide a broad picture of the existing level of educational activity and inequality within the region. They indicate the proportions of the regional population involved at particular levels of education, which enables cross-regional and cross-national comparison. This provides a snapshot of the current regional profile of educational inequality.
Figure 3.7 shows the geographical distribution of all persons aged 25-64 with lower secondary education attainment as a percentage of total population in each region. The areas with the highest values are almost entirely located in the south of Europe (Portugal, Italy, Greece), but also Estonia, Northern Ireland and the Irish region "Border, Midland and Western".
Figure 3.7: All persons aged 25-64 with lower secondary education attainment (% of the total population in a region)
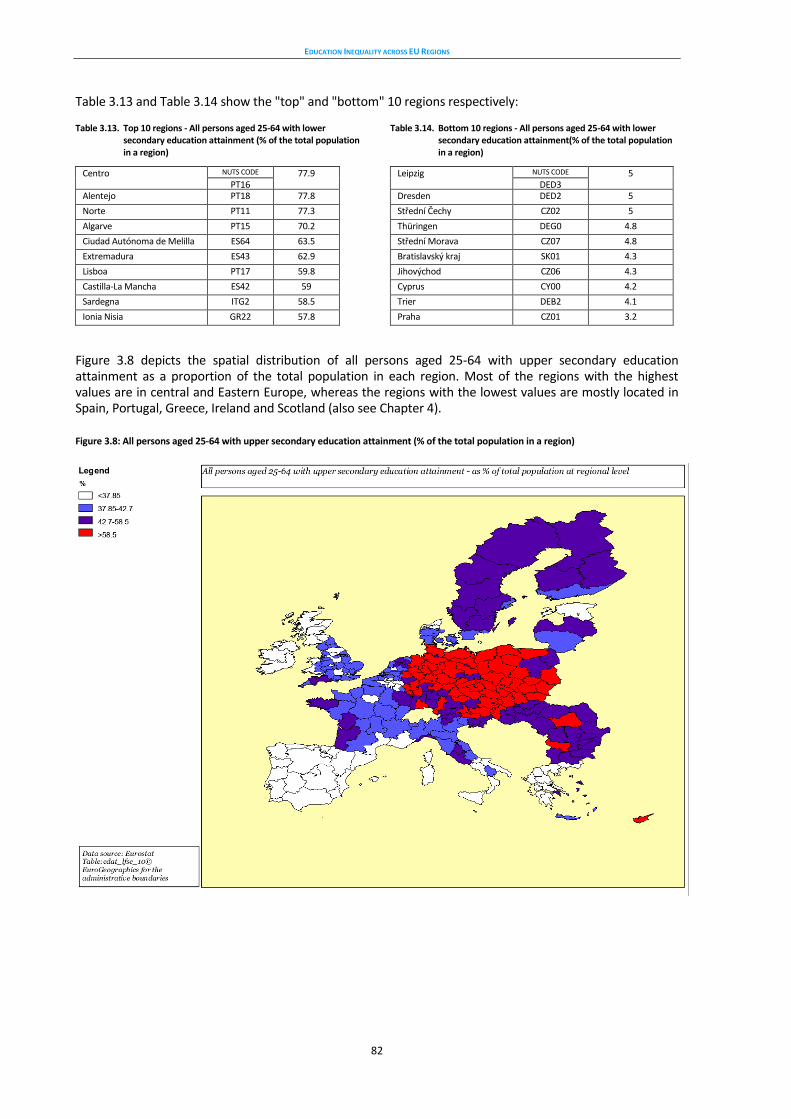
EDUCATION INEQUALITY ACROSS EU REGIONS
82
Table 3.13 and Table 3.14 show the "top" and "bottom" 10 regions respectively: Table 3.13. Top 10 regions - All persons aged 25-64 with lower secondary education attainment (% of the total population in a region)
Centro NUTS CODE 77.9 PT16
Alentejo PT18 77.8
Norte PT11 77.3
Algarve PT15 70.2
Ciudad Autónoma de Melilla ES64 63.5
Extremadura ES43 62.9
Lisboa PT17 59.8
Castilla-La Mancha ES42 59
Sardegna ITG2 58.5
Ionia Nisia GR22 57.8
Table 3.14. Bottom 10 regions - All persons aged 25-64 with lower secondary education attainment(% of the total population in a region)
Leipzig NUTS CODE 5 DED3
Dresden DED2 5
Střední Čechy CZ02 5
Thüringen DEG0 4.8
Střední Morava CZ07 4.8
Bratislavský kraj SK01 4.3
Jihovýchod CZ06 4.3
Cyprus CY00 4.2
Trier DEB2 4.1
Praha CZ01 3.2
Figure 3.8 depicts the spatial distribution of all persons aged 25-64 with upper secondary education attainment as a proportion of the total population in each region. Most of the regions with the highest values are in central and Eastern Europe, whereas the regions with the lowest values are mostly located in Spain, Portugal, Greece, Ireland and Scotland (also see Chapter 4).
Figure 3.8: All persons aged 25-64 with upper secondary education attainment (% of the total population in a region)
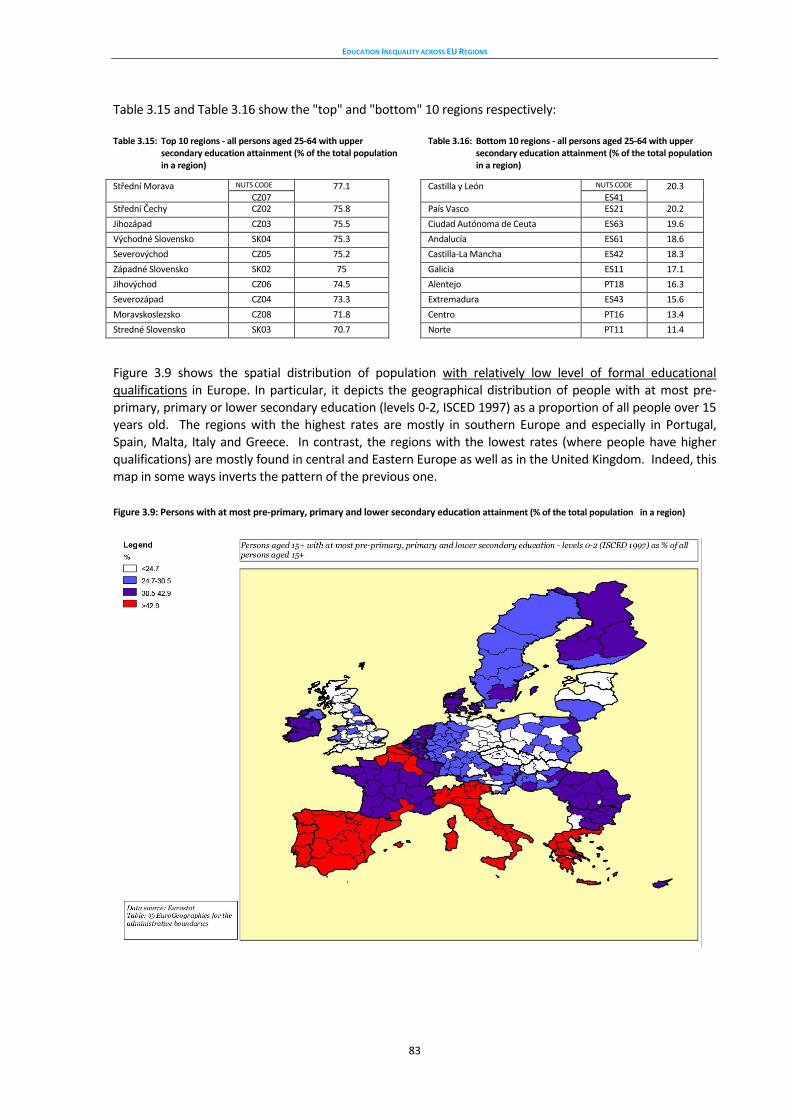
EDUCATION INEQUALITY ACROSS EU REGIONS
83
Table 3.15 and Table 3.16 show the "top" and "bottom" 10 regions respectively: Table 3.15: Top 10 regions - all persons aged 25-64 with upper secondary education attainment (% of the total population in a region)
Střední Morava NUTS CODE 77.1 CZ07
Střední Čechy CZ02 75.8
Jihozápad CZ03 75.5
Východné Slovensko SK04 75.3
Severovýchod CZ05 75.2
Západné Slovensko SK02 75
Jihovýchod CZ06 74.5
Severozápad CZ04 73.3
Moravskoslezsko CZ08 71.8
Stredné Slovensko SK03 70.7
Table 3.16: Bottom 10 regions - all persons aged 25-64 with upper secondary education attainment (% of the total population in a region)
Castilla y León NUTS CODE 20.3 ES41
País Vasco ES21 20.2
Ciudad Autónoma de Ceuta ES63 19.6
Andalucía ES61 18.6
Castilla-La Mancha ES42 18.3
Galicia ES11 17.1
Alentejo PT18 16.3
Extremadura ES43 15.6
Centro PT16 13.4
Norte PT11 11.4
Figure 3.9 shows the spatial distribution of population with relatively low level of formal educational qualifications in Europe. In particular, it depicts the geographical distribution of people with at most pre-primary, primary or lower secondary education (levels 0-2, ISCED 1997) as a proportion of all people over 15 years old. The regions with the highest rates are mostly in southern Europe and especially in Portugal, Spain, Malta, Italy and Greece. In contrast, the regions with the lowest rates (where people have higher qualifications) are mostly found in central and Eastern Europe as well as in the United Kingdom. Indeed, this map in some ways inverts the pattern of the previous one.
Figure 3.9: Persons with at most pre-primary, primary and lower secondary education attainment (% of the total population in a region)
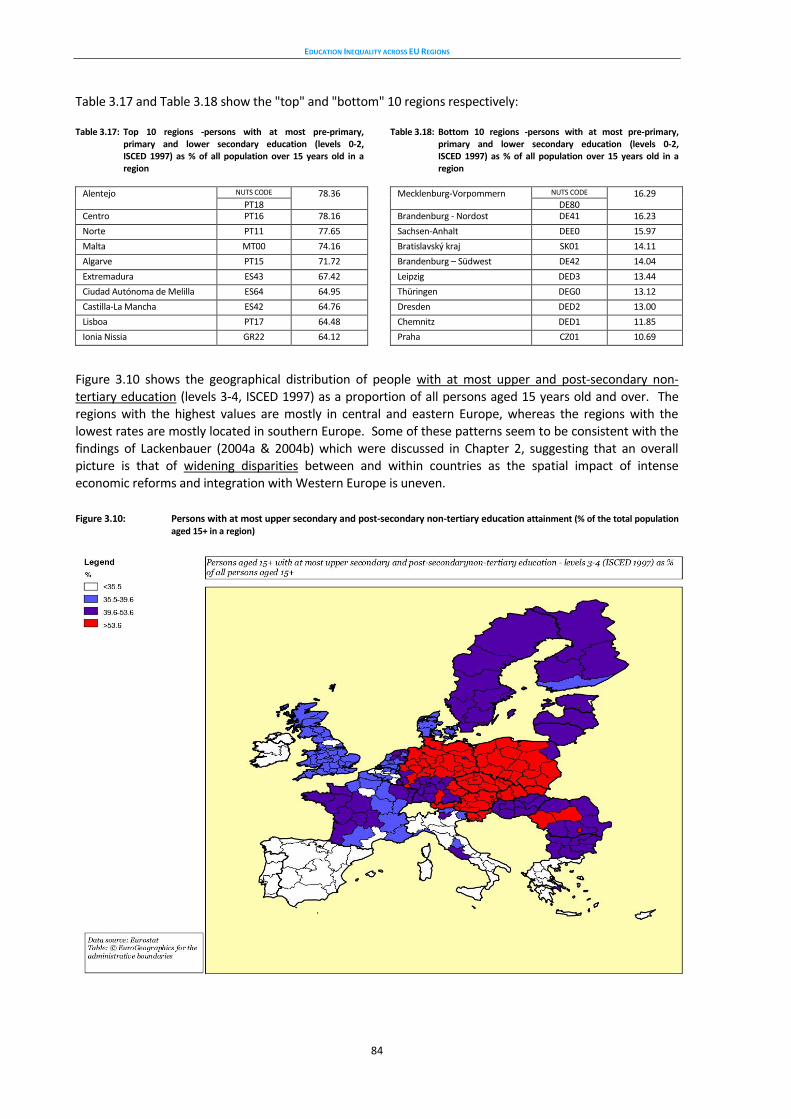
EDUCATION INEQUALITY ACROSS EU REGIONS
84
Table 3.17 and Table 3.18 show the "top" and "bottom" 10 regions respectively:
Table 3.17: Top 10 regions -persons with at most pre-primary, primary and lower secondary education (levels 0-2, ISCED 1997) as % of all population over 15 years old in a region
Alentejo NUTS CODE 78.36 PT18
Centro PT16 78.16
Norte PT11 77.65
Malta MT00 74.16
Algarve PT15 71.72
Extremadura ES43 67.42
Ciudad Autónoma de Melilla ES64 64.95
Castilla-La Mancha ES42 64.76
Lisboa PT17 64.48
Ionia Nissia GR22 64.12
Table 3.18: Bottom 10 regions -persons with at most pre-primary, primary and lower secondary education (levels 0-2, ISCED 1997) as % of all population over 15 years old in a region
Mecklenburg-Vorpommern NUTS CODE 16.29 DE80
Brandenburg - Nordost DE41 16.23
Sachsen-Anhalt DEE0 15.97
Bratislavský kraj SK01 14.11
Brandenburg – Südwest DE42 14.04
Leipzig DED3 13.44
Thüringen DEG0 13.12
Dresden DED2 13.00
Chemnitz DED1 11.85
Praha CZ01 10.69
Figure 3.10 shows the geographical distribution of people with at most upper and post-secondary non-tertiary education (levels 3-4, ISCED 1997) as a proportion of all persons aged 15 years old and over. The regions with the highest values are mostly in central and eastern Europe, whereas the regions with the lowest rates are mostly located in southern Europe. Some of these patterns seem to be consistent with the findings of Lackenbauer (2004a & 2004b) which were discussed in Chapter 2, suggesting that an overall picture is that of widening disparities between and within countries as the spatial impact of intense economic reforms and integration with Western Europe is uneven.
Figure 3.10: Persons with at most upper secondary and post-secondary non-tertiary education attainment (% of the total population aged 15+ in a region)
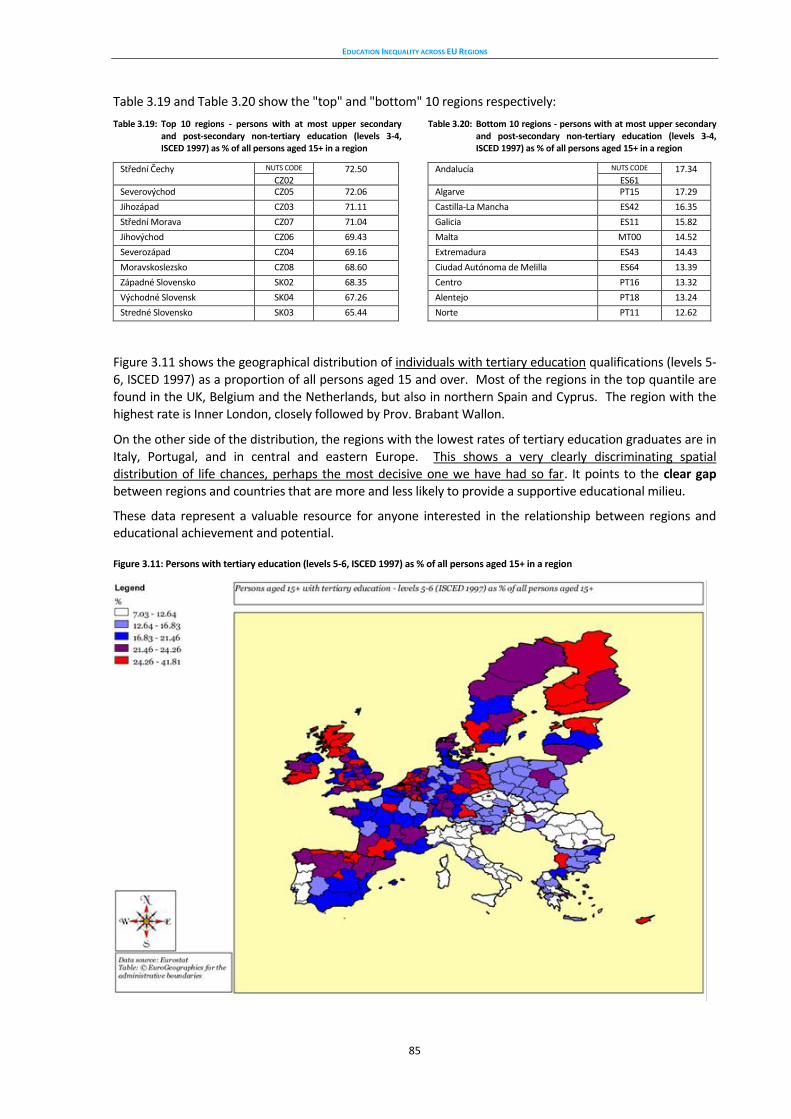
EDUCATION INEQUALITY ACROSS EU REGIONS
85
Table 3.19 and Table 3.20 show the "top" and "bottom" 10 regions respectively:
Table 3.19: Top 10 regions - persons with at most upper secondary and post-secondary non-tertiary education (levels 3-4, ISCED 1997) as % of all persons aged 15+ in a region
Střední Čechy NUTS CODE 72.50 CZ02
Severovýchod CZ05 72.06
Jihozápad CZ03 71.11
Střední Morava CZ07 71.04
Jihovýchod CZ06 69.43
Severozápad CZ04 69.16
Moravskoslezsko CZ08 68.60
Západné Slovensko SK02 68.35
Východné Slovensk SK04 67.26
Stredné Slovensko SK03 65.44
Table 3.20: Bottom 10 regions - persons with at most upper secondary and post-secondary non-tertiary education (levels 3-4, ISCED 1997) as % of all persons aged 15+ in a region
Andalucía NUTS CODE 17.34 ES61
Algarve PT15 17.29
Castilla-La Mancha ES42 16.35
Galicia ES11 15.82
Malta MT00 14.52
Extremadura ES43 14.43
Ciudad Autónoma de Melilla ES64 13.39
Centro PT16 13.32
Alentejo PT18 13.24
Norte PT11 12.62
Figure 3.11 shows the geographical distribution of individuals with tertiary education qualifications (levels 5-6, ISCED 1997) as a proportion of all persons aged 15 and over. Most of the regions in the top quantile are found in the UK, Belgium and the Netherlands, but also in northern Spain and Cyprus. The region with the highest rate is Inner London, closely followed by Prov. Brabant Wallon.
On the other side of the distribution, the regions with the lowest rates of tertiary education graduates are in Italy, Portugal, and in central and eastern Europe. This shows a very clearly discriminating spatial distribution of life chances, perhaps the most decisive one we have had so far. It points to the clear gap between regions and countries that are more and less likely to provide a supportive educational milieu.
These data represent a valuable resource for anyone interested in the relationship between regions and educational achievement and potential.
Figure 3.11: Persons with tertiary education (levels 5-6, ISCED 1997) as % of all persons aged 15+ in a region
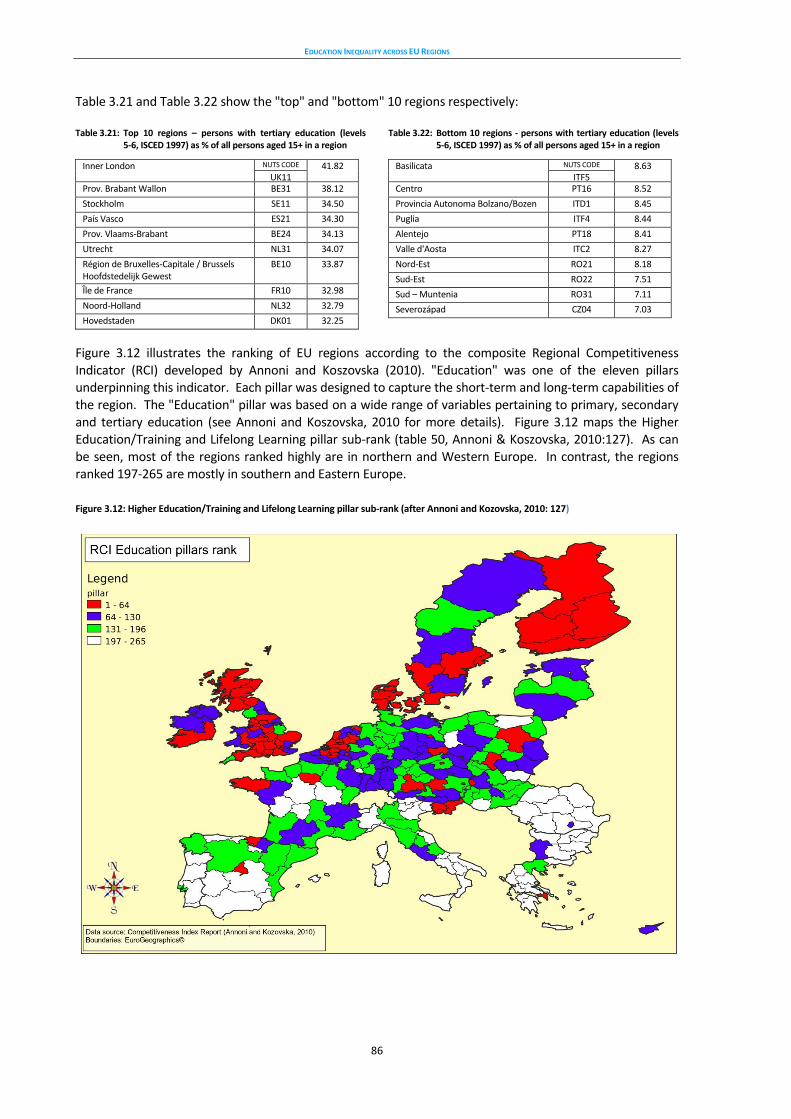
EDUCATION INEQUALITY ACROSS EU REGIONS
86
Table 3.21 and Table 3.22 show the "top" and "bottom" 10 regions respectively: Table 3.21: Top 10 regions – persons with tertiary education (levels 5-6, ISCED 1997) as % of all persons aged 15+ in a region
Inner London NUTS CODE 41.82 UK11
Prov. Brabant Wallon BE31 38.12
Stockholm SE11 34.50
País Vasco ES21 34.30
Prov. Vlaams-Brabant BE24 34.13
Utrecht NL31 34.07
Région de Bruxelles-Capitale / Brussels Hoofdstedelijk Gewest
BE10 33.87
Île de France FR10 32.98
Noord-Holland NL32 32.79
Hovedstaden DK01 32.25
Table 3.22: Bottom 10 regions - persons with tertiary education (levels 5-6, ISCED 1997) as % of all persons aged 15+ in a region
Basilicata NUTS CODE 8.63 ITF5
Centro PT16 8.52
Provincia Autonoma Bolzano/Bozen ITD1 8.45
Puglia ITF4 8.44
Alentejo PT18 8.41
Valle d'Aosta ITC2 8.27
Nord-Est RO21 8.18
Sud-Est RO22 7.51
Sud – Muntenia RO31 7.11
Severozápad CZ04 7.03
Figure 3.12 illustrates the ranking of EU regions according to the composite Regional Competitiveness Indicator (RCI) developed by Annoni and Koszovska (2010). "Education" was one of the eleven pillars underpinning this indicator. Each pillar was designed to capture the short-term and long-term capabilities of the region. The "Education" pillar was based on a wide range of variables pertaining to primary, secondary and tertiary education (see Annoni and Koszovska, 2010 for more details). Figure 3.12 maps the Higher Education/Training and Lifelong Learning pillar sub-rank (table 50, Annoni & Koszovska, 2010:127). As can be seen, most of the regions ranked highly are in northern and Western Europe. In contrast, the regions ranked 197-265 are mostly in southern and Eastern Europe.
Figure 3.12: Higher Education/Training and Lifelong Learning pillar sub-rank (after Annoni and Kozovska, 2010: 127)
EDUCATION INEQUALITY ACROSS EU REGIONS
87
This chapter has laid a basis for the analysis of the relationship between educational inequalities and regional characteristics. It has provided a means for calculating and comparing the current educational levels and participation at a regional rather than a national level –which further underlines the depth of regional inequalities in education. We have also been able to distinguish, albeit at a very broad level, those regions which seem most and least likely to attract and support productive activities and people.
It would be very useful to have longitudinal forms of such data so as to establish more clearly the relationship between regions and education inequality. Closer analysis than what we have been able to conduct here would reveal more clearly where and how policy interventions may be possible to redress some of the regional inequalities.
In the next chapter we investigate further the regional patterns of the two bodies of indicators and of the potential supportiveness of regional educational levels.
Following this, in Chapter 5, we will carry out a much closer analysis based on NUTS level 3 and smaller area data, which gives an idea of the potential of such work, and makes a very strong case for extending the availability of such data.
Annex 1 provides the human population cartogram version of the conventional maps shown in this chapter as an alternative way of visualising regional data on educational inequalities across EU regions.

EDUCATION INEQUALITY ACROSS EU REGIONS
88
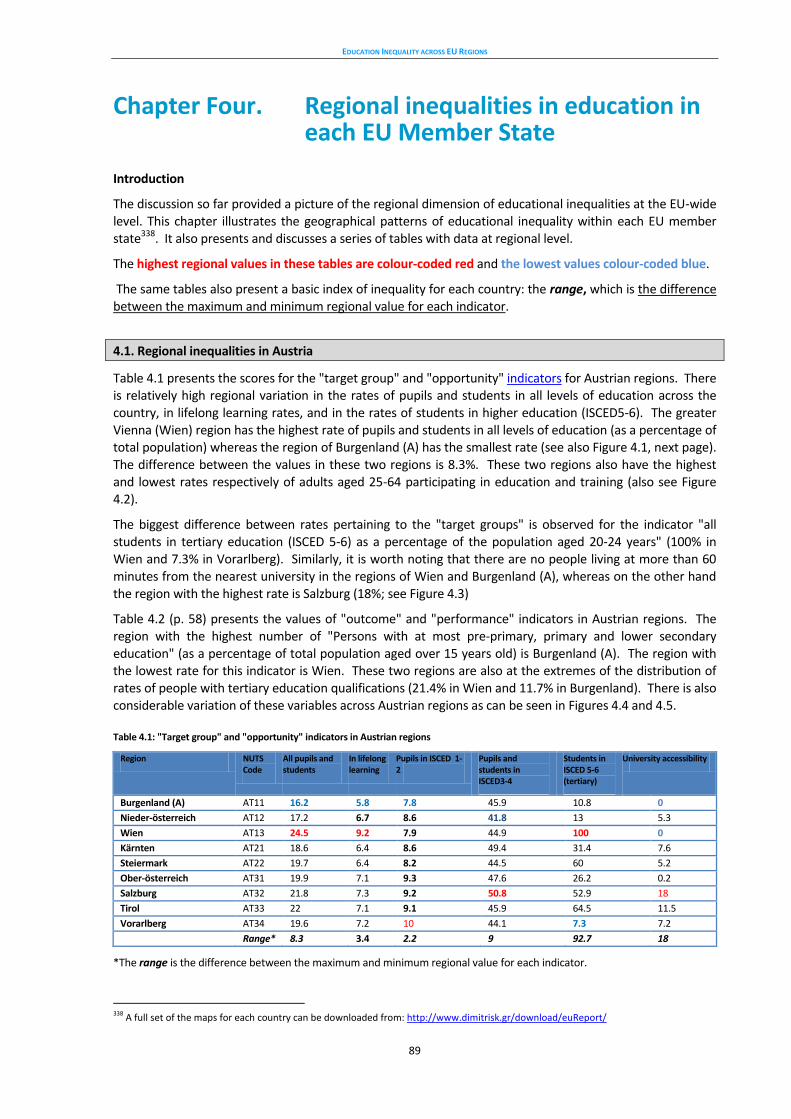
EDUCATION INEQUALITY ACROSS EU REGIONS
89
Chapter Four. Regional inequalities in education in each EU Member State
Introduction
The discussion so far provided a picture of the regional dimension of educational inequalities at the EU-wide level. This chapter illustrates the geographical patterns of educational inequality within each EU member state338. It also presents and discusses a series of tables with data at regional level.
The highest regional values in these tables are colour-coded red and the lowest values colour-coded blue.
The same tables also present a basic index of inequality for each country: the range, which is the difference between the maximum and minimum regional value for each indicator.
4.1. Regional inequalities in Austria
Table 4.1 presents the scores for the "target group" and "opportunity" indicators for Austrian regions. There is relatively high regional variation in the rates of pupils and students in all levels of education across the country, in lifelong learning rates, and in the rates of students in higher education (ISCED5-6). The greater Vienna (Wien) region has the highest rate of pupils and students in all levels of education (as a percentage of total population) whereas the region of Burgenland (A) has the smallest rate (see also Figure 4.1, next page). The difference between the values in these two regions is 8.3%. These two regions also have the highest and lowest rates respectively of adults aged 25-64 participating in education and training (also see Figure 4.2).
The biggest difference between rates pertaining to the "target groups" is observed for the indicator "all students in tertiary education (ISCED 5-6) as a percentage of the population aged 20-24 years" (100% in Wien and 7.3% in Vorarlberg). Similarly, it is worth noting that there are no people living at more than 60 minutes from the nearest university in the regions of Wien and Burgenland (A), whereas on the other hand the region with the highest rate is Salzburg (18%; see Figure 4.3)
Table 4.2 (p. 58) presents the values of "outcome" and "performance" indicators in Austrian regions. The region with the highest number of "Persons with at most pre-primary, primary and lower secondary education" (as a percentage of total population aged over 15 years old) is Burgenland (A). The region with the lowest rate for this indicator is Wien. These two regions are also at the extremes of the distribution of rates of people with tertiary education qualifications (21.4% in Wien and 11.7% in Burgenland). There is also considerable variation of these variables across Austrian regions as can be seen in Figures 4.4 and 4.5. Table 4.1: "Target group" and "opportunity" indicators in Austrian regions
Region NUTS Code
All pupils and students
In lifelong learning
Pupils in ISCED 1-2
Pupils and students in ISCED3-4
Students in ISCED 5-6 (tertiary)
University accessibility
Burgenland (A) AT11 16.2 5.8 7.8 45.9 10.8 0
Nieder-österreich AT12 17.2 6.7 8.6 41.8 13 5.3
Wien AT13 24.5 9.2 7.9 44.9 100 0
Kärnten AT21 18.6 6.4 8.6 49.4 31.4 7.6
Steiermark AT22 19.7 6.4 8.2 44.5 60 5.2
Ober-österreich AT31 19.9 7.1 9.3 47.6 26.2 0.2
Salzburg AT32 21.8 7.3 9.2 50.8 52.9 18
Tirol AT33 22 7.1 9.1 45.9 64.5 11.5
Vorarlberg AT34 19.6 7.2 10 44.1 7.3 7.2
Range* 8.3 3.4 2.2 9 92.7 18
*The range is the difference between the maximum and minimum regional value for each indicator.
338
A full set of the maps for each country can be downloaded from: http://www.dimitrisk.gr/download/euReport/
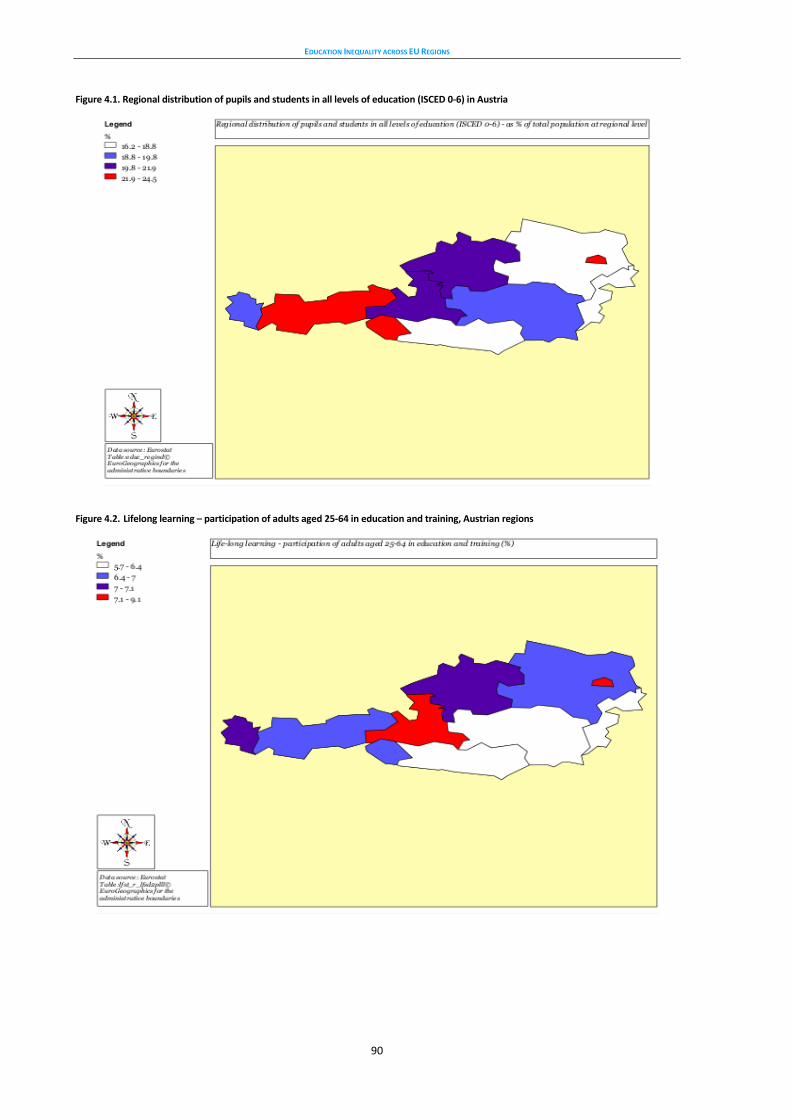
EDUCATION INEQUALITY ACROSS EU REGIONS
90
Figure 4.1. Regional distribution of pupils and students in all levels of education (ISCED 0-6) in Austria
Figure 4.2. Lifelong learning – participation of adults aged 25-64 in education and training, Austrian regions
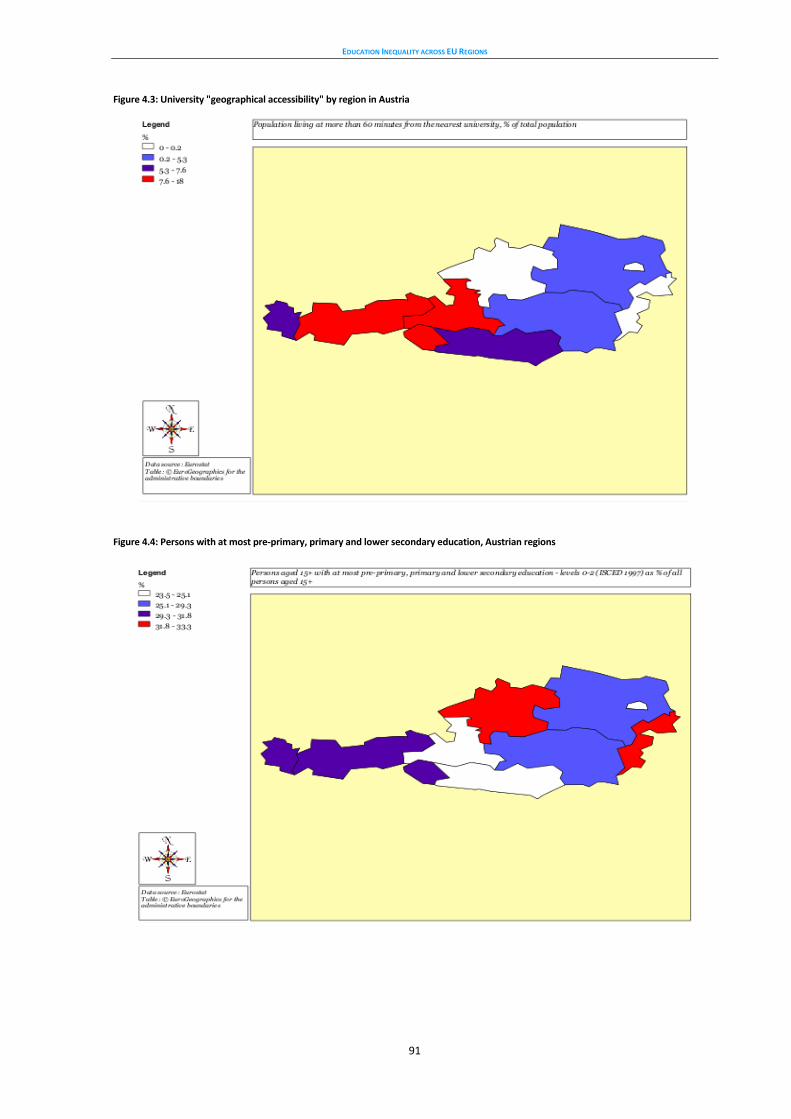
EDUCATION INEQUALITY ACROSS EU REGIONS
91
Figure 4.3: University "geographical accessibility" by region in Austria
Figure 4.4: Persons with at most pre-primary, primary and lower secondary education, Austrian regions
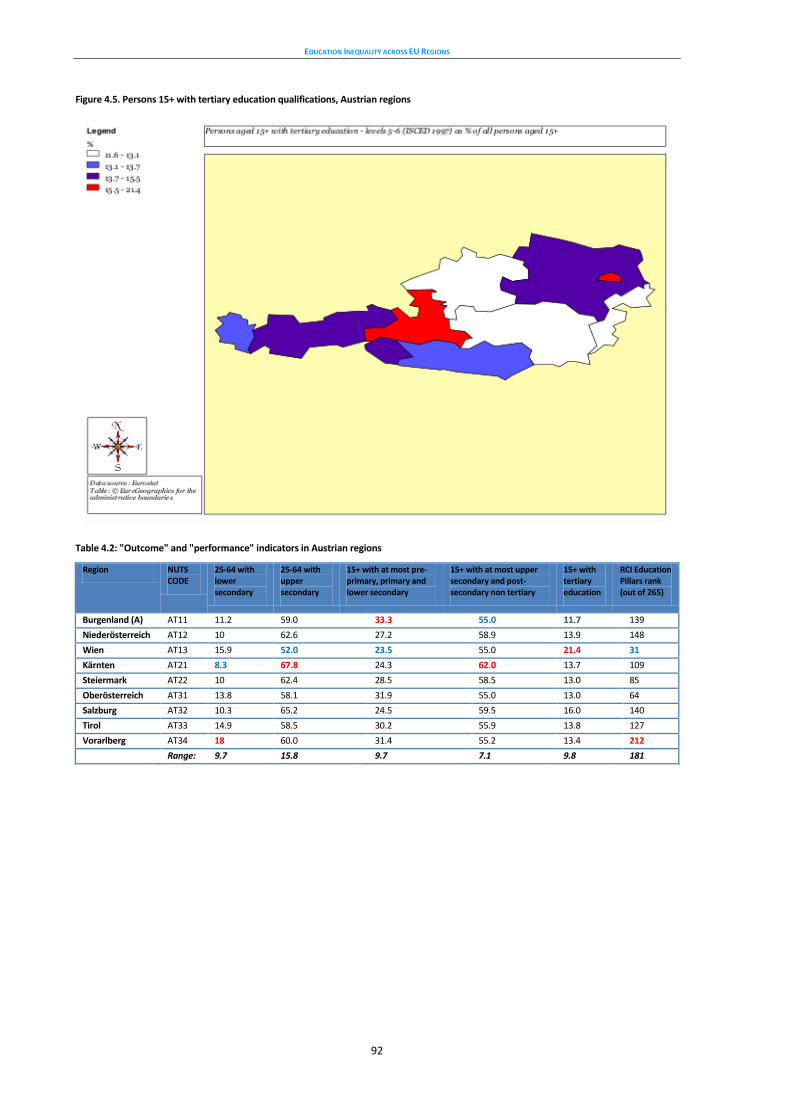
EDUCATION INEQUALITY ACROSS EU REGIONS
92
Figure 4.5. Persons 15+ with tertiary education qualifications, Austrian regions
Table 4.2: "Outcome" and "performance" indicators in Austrian regions
Region NUTS CODE
25-64 with lower secondary
25-64 with upper secondary
15+ with at most pre-primary, primary and lower secondary
15+ with at most upper secondary and post-secondary non tertiary
15+ with tertiary education
RCI Education Pillars rank (out of 265)
Burgenland (A) AT11 11.2 59.0 33.3 55.0 11.7 139
Niederösterreich AT12 10 62.6 27.2 58.9 13.9 148
Wien AT13 15.9 52.0 23.5 55.0 21.4 31
Kärnten AT21 8.3 67.8 24.3 62.0 13.7 109
Steiermark AT22 10 62.4 28.5 58.5 13.0 85
Oberösterreich AT31 13.8 58.1 31.9 55.0 13.0 64
Salzburg AT32 10.3 65.2 24.5 59.5 16.0 140
Tirol AT33 14.9 58.5 30.2 55.9 13.8 127
Vorarlberg AT34 18 60.0 31.4 55.2 13.4 212
Range: 9.7 15.8 9.7 7.1 9.8 181
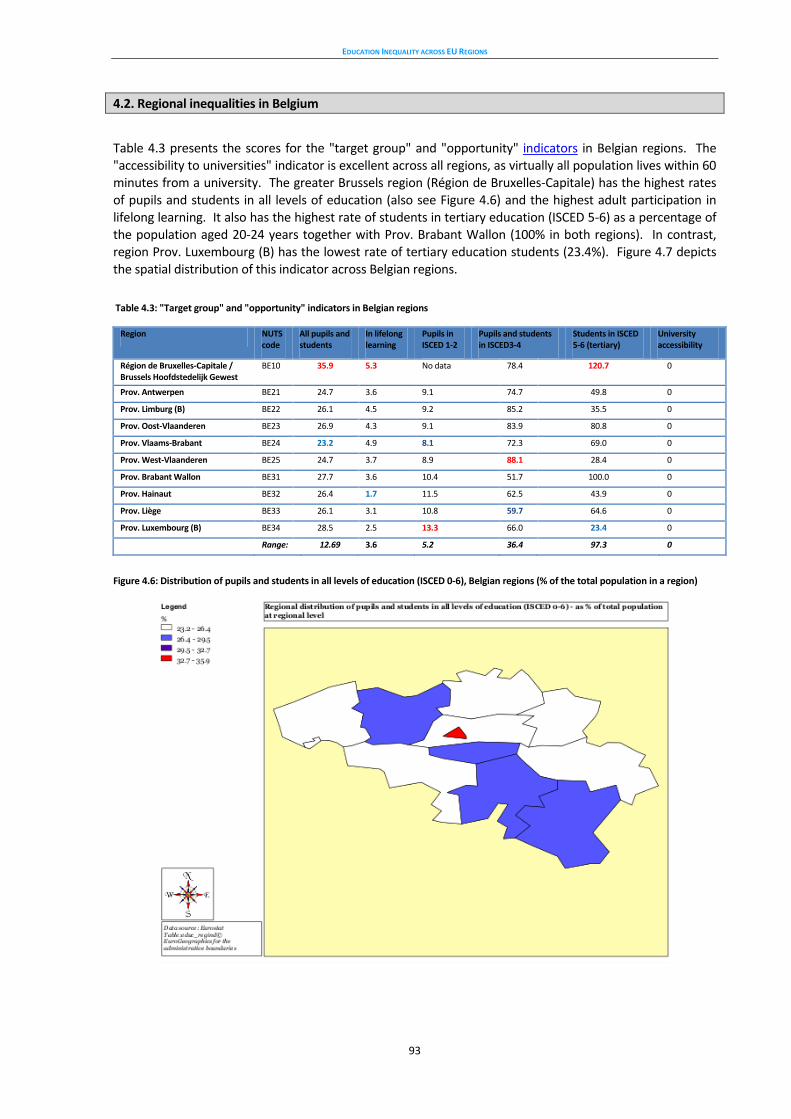
EDUCATION INEQUALITY ACROSS EU REGIONS
93
4.2. Regional inequalities in Belgium
Table 4.3 presents the scores for the "target group" and "opportunity" indicators in Belgian regions. The "accessibility to universities" indicator is excellent across all regions, as virtually all population lives within 60 minutes from a university. The greater Brussels region (Région de Bruxelles-Capitale) has the highest rates of pupils and students in all levels of education (also see Figure 4.6) and the highest adult participation in lifelong learning. It also has the highest rate of students in tertiary education (ISCED 5-6) as a percentage of the population aged 20-24 years together with Prov. Brabant Wallon (100% in both regions). In contrast, region Prov. Luxembourg (B) has the lowest rate of tertiary education students (23.4%). Figure 4.7 depicts the spatial distribution of this indicator across Belgian regions.
Table 4.3: "Target group" and "opportunity" indicators in Belgian regions
Region NUTS code
All pupils and students
In lifelong learning
Pupils in ISCED 1-2
Pupils and students in ISCED3-4
Students in ISCED 5-6 (tertiary)
University accessibility
Région de Bruxelles-Capitale / Brussels Hoofdstedelijk Gewest
BE10 35.9 5.3 No data 78.4 120.7 0
Prov. Antwerpen BE21 24.7 3.6 9.1 74.7 49.8 0
Prov. Limburg (B) BE22 26.1 4.5 9.2 85.2 35.5 0
Prov. Oost-Vlaanderen BE23 26.9 4.3 9.1 83.9 80.8 0
Prov. Vlaams-Brabant BE24 23.2 4.9 8.1 72.3 69.0 0
Prov. West-Vlaanderen BE25 24.7 3.7 8.9 88.1 28.4 0
Prov. Brabant Wallon BE31 27.7 3.6 10.4 51.7 100.0 0
Prov. Hainaut BE32 26.4 1.7 11.5 62.5 43.9 0
Prov. Liège BE33 26.1 3.1 10.8 59.7 64.6 0
Prov. Luxembourg (B) BE34 28.5 2.5 13.3 66.0 23.4 0
Range: 12.69 3.6 5.2 36.4 97.3 0
Figure 4.6: Distribution of pupils and students in all levels of education (ISCED 0-6), Belgian regions (% of the total population in a region)
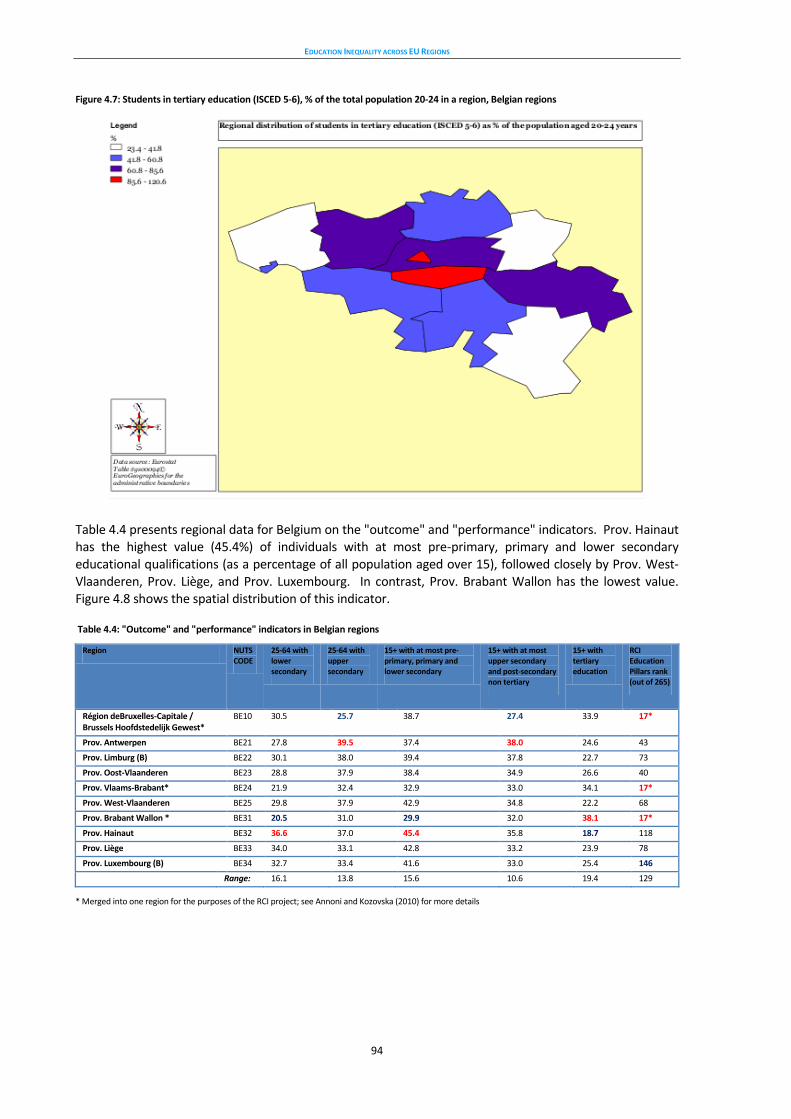
EDUCATION INEQUALITY ACROSS EU REGIONS
94
Figure 4.7: Students in tertiary education (ISCED 5-6), % of the total population 20-24 in a region, Belgian regions
Table 4.4 presents regional data for Belgium on the "outcome" and "performance" indicators. Prov. Hainaut has the highest value (45.4%) of individuals with at most pre-primary, primary and lower secondary educational qualifications (as a percentage of all population aged over 15), followed closely by Prov. West-Vlaanderen, Prov. Liège, and Prov. Luxembourg. In contrast, Prov. Brabant Wallon has the lowest value. Figure 4.8 shows the spatial distribution of this indicator.
Table 4.4: "Outcome" and "performance" indicators in Belgian regions
Region NUTS CODE
25-64 with lower secondary
25-64 with upper secondary
15+ with at most pre-primary, primary and lower secondary
15+ with at most upper secondary and post-secondary non tertiary
15+ with tertiary education
RCI Education Pillars rank (out of 265)
Région deBruxelles-Capitale / Brussels Hoofdstedelijk Gewest*
BE10 30.5 25.7 38.7 27.4 33.9 17*
Prov. Antwerpen BE21 27.8 39.5 37.4 38.0 24.6 43
Prov. Limburg (B) BE22 30.1 38.0 39.4 37.8 22.7 73
Prov. Oost-Vlaanderen BE23 28.8 37.9 38.4 34.9 26.6 40
Prov. Vlaams-Brabant* BE24 21.9 32.4 32.9 33.0 34.1 17*
Prov. West-Vlaanderen BE25 29.8 37.9 42.9 34.8 22.2 68
Prov. Brabant Wallon * BE31 20.5 31.0 29.9 32.0 38.1 17*
Prov. Hainaut BE32 36.6 37.0 45.4 35.8 18.7 118
Prov. Liège BE33 34.0 33.1 42.8 33.2 23.9 78
Prov. Luxembourg (B) BE34 32.7 33.4 41.6 33.0 25.4 146
Range: 16.1 13.8 15.6 10.6 19.4 129
* Merged into one region for the purposes of the RCI project; see Annoni and Kozovska (2010) for more details
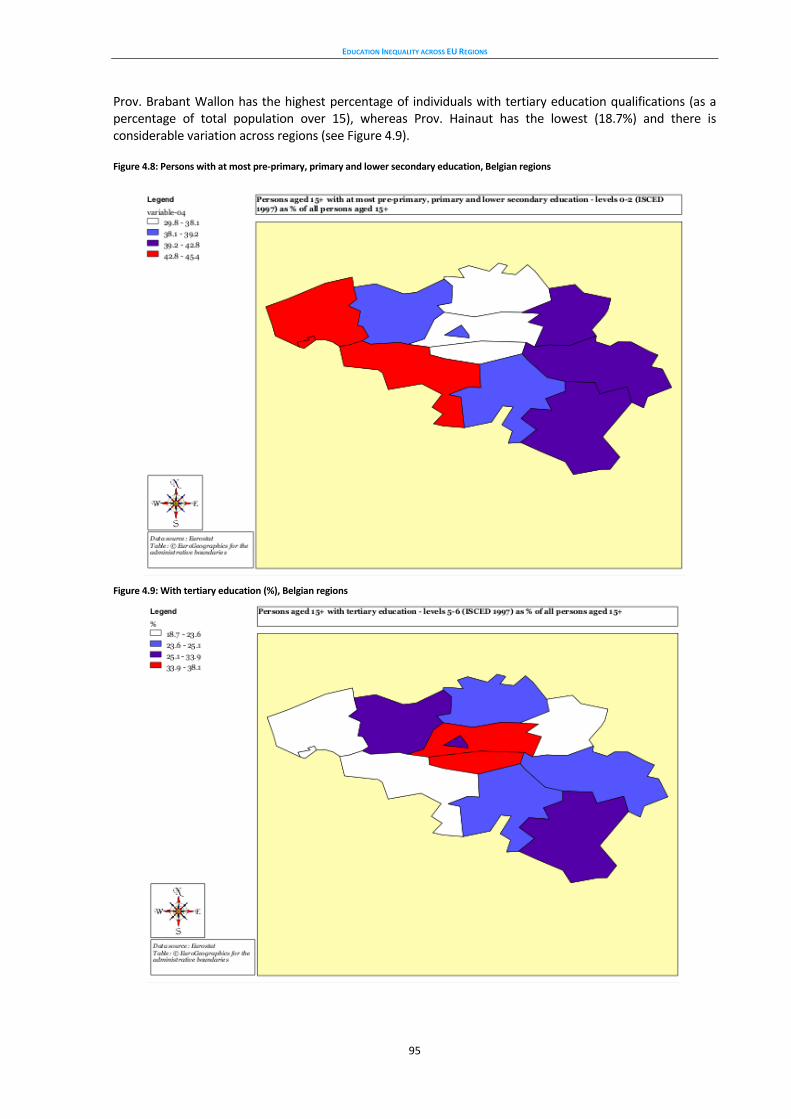
EDUCATION INEQUALITY ACROSS EU REGIONS
95
Prov. Brabant Wallon has the highest percentage of individuals with tertiary education qualifications (as a percentage of total population over 15), whereas Prov. Hainaut has the lowest (18.7%) and there is considerable variation across regions (see Figure 4.9).
Figure 4.8: Persons with at most pre-primary, primary and lower secondary education, Belgian regions
Figure 4.9: With tertiary education (%), Belgian regions
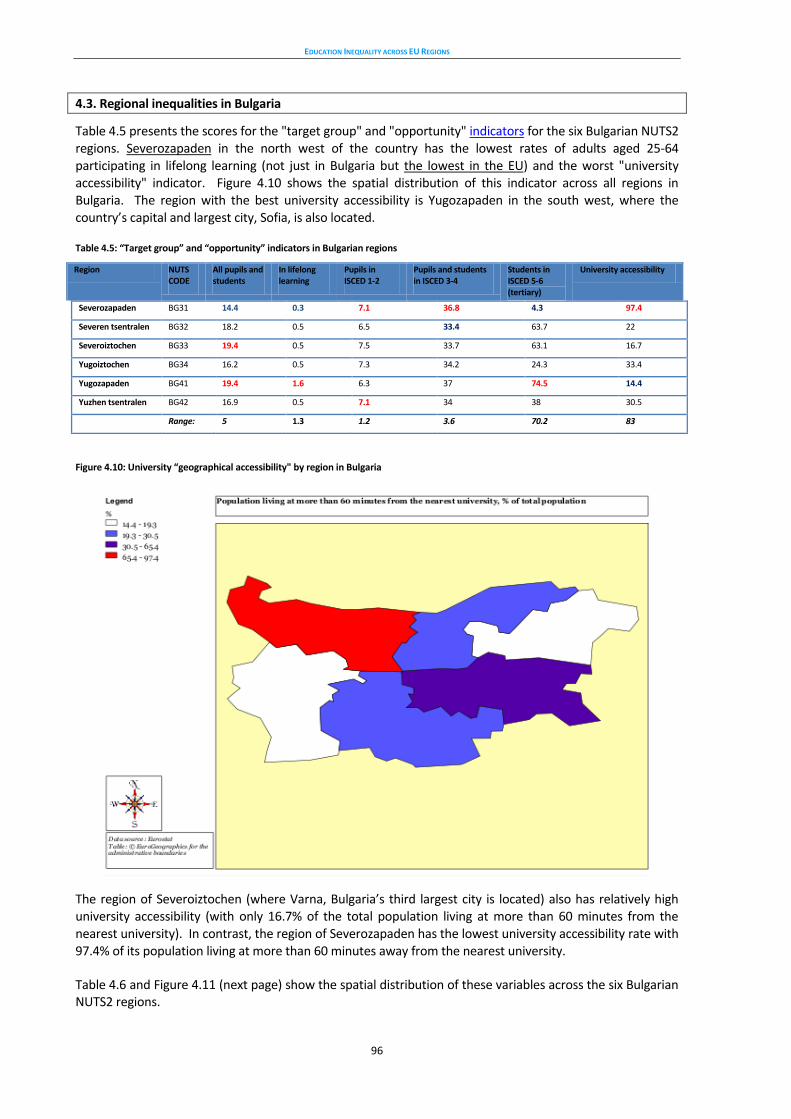
EDUCATION INEQUALITY ACROSS EU REGIONS
96
4.3. Regional inequalities in Bulgaria
Table 4.5 presents the scores for the "target group" and "opportunity" indicators for the six Bulgarian NUTS2 regions. Severozapaden in the north west of the country has the lowest rates of adults aged 25-64 participating in lifelong learning (not just in Bulgaria but the lowest in the EU) and the worst "university accessibility" indicator. Figure 4.10 shows the spatial distribution of this indicator across all regions in Bulgaria. The region with the best university accessibility is Yugozapaden in the south west, where the country’s capital and largest city, Sofia, is also located.
Table 4.5: “Target group” and “opportunity” indicators in Bulgarian regions
Region NUTS CODE
All pupils and students
In lifelong learning
Pupils in ISCED 1-2
Pupils and students in ISCED 3-4
Students in ISCED 5-6 (tertiary)
University accessibility
Severozapaden BG31 14.4 0.3 7.1 36.8 4.3 97.4
Severen tsentralen BG32 18.2 0.5 6.5 33.4 63.7 22
Severoiztochen BG33 19.4 0.5 7.5 33.7 63.1 16.7
Yugoiztochen BG34 16.2 0.5 7.3 34.2 24.3 33.4
Yugozapaden BG41 19.4 1.6 6.3 37 74.5 14.4
Yuzhen tsentralen BG42 16.9 0.5 7.1 34 38 30.5
Range: 5 1.3 1.2 3.6 70.2 83
Figure 4.10: University “geographical accessibility" by region in Bulgaria
The region of Severoiztochen (where Varna, Bulgaria’s third largest city is located) also has relatively high university accessibility (with only 16.7% of the total population living at more than 60 minutes from the nearest university). In contrast, the region of Severozapaden has the lowest university accessibility rate with 97.4% of its population living at more than 60 minutes away from the nearest university. Table 4.6 and Figure 4.11 (next page) show the spatial distribution of these variables across the six Bulgarian NUTS2 regions.
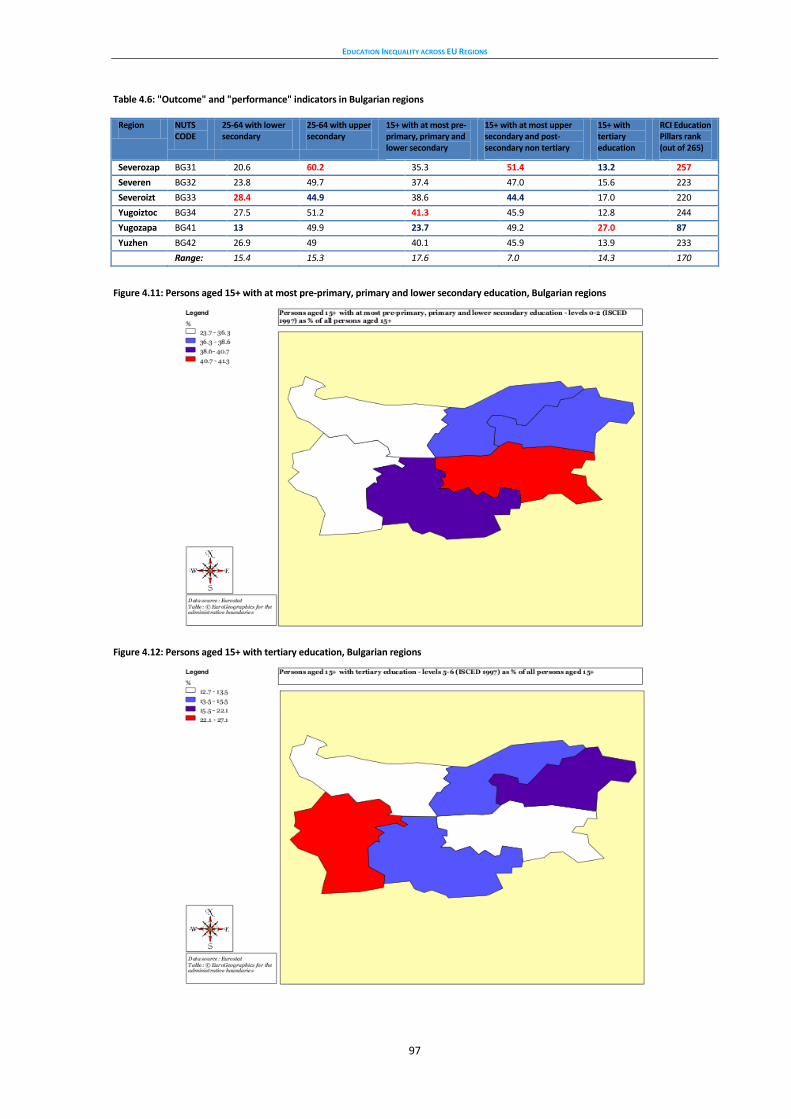
EDUCATION INEQUALITY ACROSS EU REGIONS
97
Table 4.6: "Outcome" and "performance" indicators in Bulgarian regions
Region NUTS CODE
25-64 with lower secondary
25-64 with upper secondary
15+ with at most pre-primary, primary and lower secondary
15+ with at most upper secondary and post-secondary non tertiary
15+ with tertiary education
RCI Education Pillars rank (out of 265)
Severozapaden
BG31 20.6 60.2 35.3 51.4 13.2 257
Severen tsentralen
BG32 23.8 49.7 37.4 47.0 15.6 223
Severoiztochen
BG33 28.4 44.9 38.6 44.4 17.0 220
Yugoiztochen
BG34 27.5 51.2 41.3 45.9 12.8 244
Yugozapaden
BG41 13 49.9 23.7 49.2 27.0 87
Yuzhen tsentralen
BG42 26.9 49 40.1 45.9 13.9 233
Range: 15.4 15.3 17.6 7.0 14.3 170
Figure 4.11: Persons aged 15+ with at most pre-primary, primary and lower secondary education, Bulgarian regions
Figure 4.12: Persons aged 15+ with tertiary education, Bulgarian regions
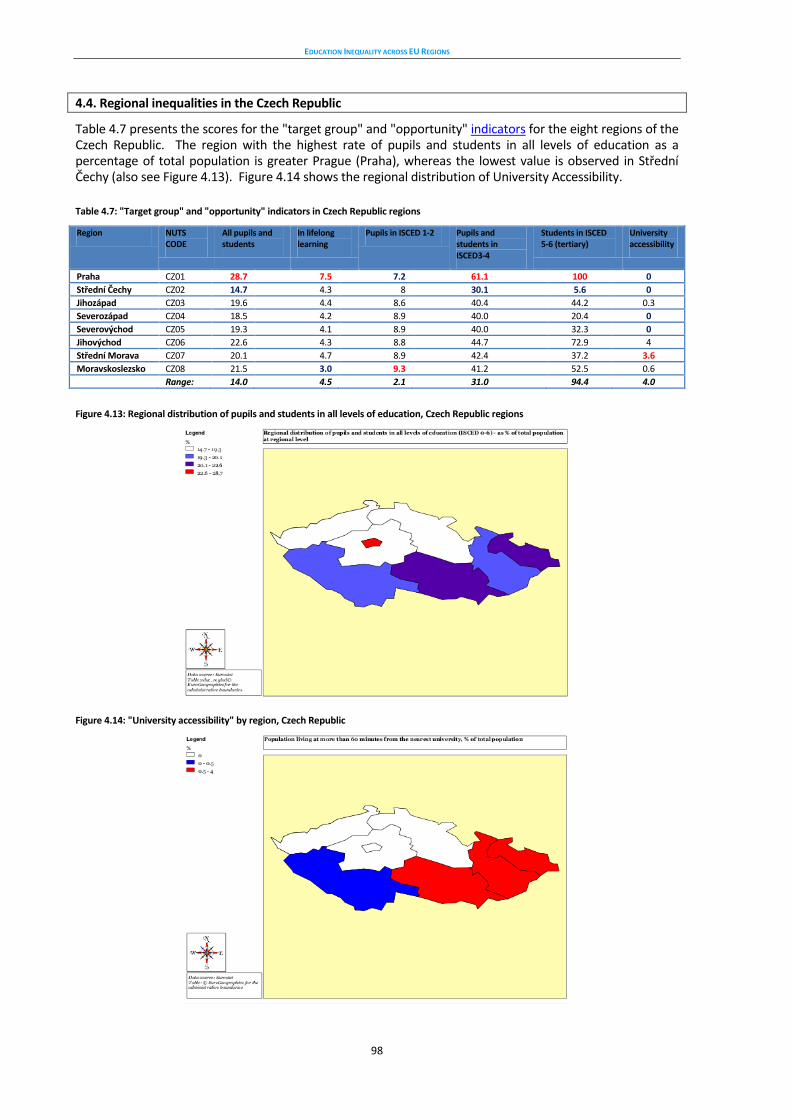
EDUCATION INEQUALITY ACROSS EU REGIONS
98
4.4. Regional inequalities in the Czech Republic
Table 4.7 presents the scores for the "target group" and "opportunity" indicators for the eight regions of the Czech Republic. The region with the highest rate of pupils and students in all levels of education as a percentage of total population is greater Prague (Praha), whereas the lowest value is observed in Střední Čechy (also see Figure 4.13). Figure 4.14 shows the regional distribution of University Accessibility.
Table 4.7: "Target group" and "opportunity" indicators in Czech Republic regions
Region NUTS CODE
All pupils and students
In lifelong learning
Pupils in ISCED 1-2 Pupils and students in ISCED3-4
Students in ISCED 5-6 (tertiary)
University accessibility
Praha CZ01 28.7 7.5 7.2 61.1 100 0
Střední Čechy CZ02 14.7 4.3 8 30.1 5.6 0
Jihozápad CZ03 19.6 4.4 8.6 40.4 44.2 0.3
Severozápad CZ04 18.5 4.2 8.9 40.0 20.4 0
Severovýchod CZ05 19.3 4.1 8.9 40.0 32.3 0
Jihovýchod CZ06 22.6 4.3 8.8 44.7 72.9 4
Střední Morava CZ07 20.1 4.7 8.9 42.4 37.2 3.6
Moravskoslezsko CZ08 21.5 3.0 9.3 41.2 52.5 0.6
Range: 14.0 4.5 2.1 31.0 94.4 4.0
Figure 4.13: Regional distribution of pupils and students in all levels of education, Czech Republic regions
Figure 4.14: "University accessibility" by region, Czech Republic
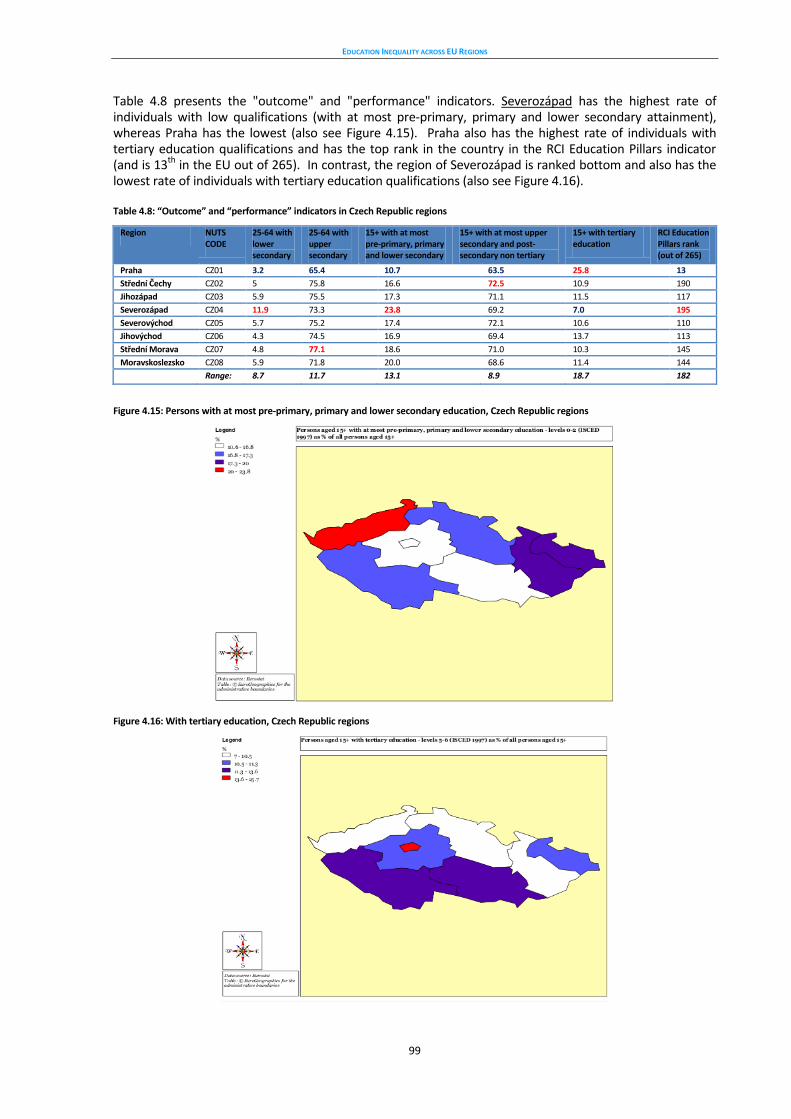
EDUCATION INEQUALITY ACROSS EU REGIONS
99
Table 4.8 presents the "outcome" and "performance" indicators. Severozápad has the highest rate of individuals with low qualifications (with at most pre-primary, primary and lower secondary attainment), whereas Praha has the lowest (also see Figure 4.15). Praha also has the highest rate of individuals with tertiary education qualifications and has the top rank in the country in the RCI Education Pillars indicator (and is 13th in the EU out of 265). In contrast, the region of Severozápad is ranked bottom and also has the lowest rate of individuals with tertiary education qualifications (also see Figure 4.16).
Table 4.8: “Outcome” and “performance” indicators in Czech Republic regions
Region NUTS CODE
25-64 with lower secondary
25-64 with upper secondary
15+ with at most pre-primary, primary and lower secondary
15+ with at most upper secondary and post-secondary non tertiary
15+ with tertiary education
RCI Education Pillars rank (out of 265)
Praha CZ01 3.2 65.4 10.7 63.5 25.8 13
Střední Čechy CZ02 5 75.8 16.6 72.5 10.9 190
Jihozápad CZ03 5.9 75.5 17.3 71.1 11.5 117
Severozápad CZ04 11.9 73.3 23.8 69.2 7.0 195
Severovýchod CZ05 5.7 75.2 17.4 72.1 10.6 110
Jihovýchod CZ06 4.3 74.5 16.9 69.4 13.7 113
Střední Morava CZ07 4.8 77.1 18.6 71.0 10.3 145
Moravskoslezsko CZ08 5.9 71.8 20.0 68.6 11.4 144
Range: 8.7 11.7 13.1 8.9 18.7 182
Figure 4.15: Persons with at most pre-primary, primary and lower secondary education, Czech Republic regions
Figure 4.16: With tertiary education, Czech Republic regions
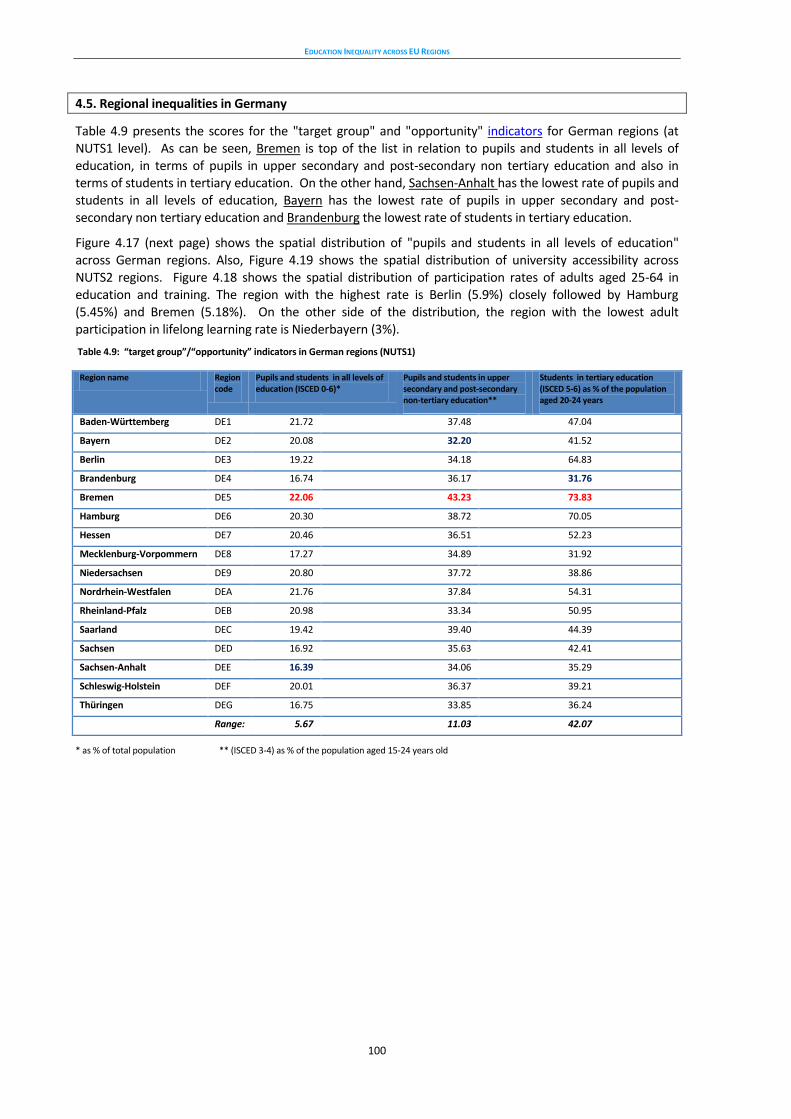
EDUCATION INEQUALITY ACROSS EU REGIONS
100
4.5. Regional inequalities in Germany
Table 4.9 presents the scores for the "target group" and "opportunity" indicators for German regions (at NUTS1 level). As can be seen, Bremen is top of the list in relation to pupils and students in all levels of education, in terms of pupils in upper secondary and post-secondary non tertiary education and also in terms of students in tertiary education. On the other hand, Sachsen-Anhalt has the lowest rate of pupils and students in all levels of education, Bayern has the lowest rate of pupils in upper secondary and post-secondary non tertiary education and Brandenburg the lowest rate of students in tertiary education.
Figure 4.17 (next page) shows the spatial distribution of "pupils and students in all levels of education" across German regions. Also, Figure 4.19 shows the spatial distribution of university accessibility across NUTS2 regions. Figure 4.18 shows the spatial distribution of participation rates of adults aged 25-64 in education and training. The region with the highest rate is Berlin (5.9%) closely followed by Hamburg (5.45%) and Bremen (5.18%). On the other side of the distribution, the region with the lowest adult participation in lifelong learning rate is Niederbayern (3%).
Table 4.9: “target group”/“opportunity” indicators in German regions (NUTS1)
Region name Region code
Pupils and students in all levels of education (ISCED 0-6)*
Pupils and students in upper secondary and post-secondary non-tertiary education**
Students in tertiary education (ISCED 5-6) as % of the population aged 20-24 years
Baden-Württemberg DE1 21.72 37.48 47.04
Bayern DE2 20.08 32.20 41.52
Berlin DE3 19.22 34.18 64.83
Brandenburg DE4 16.74 36.17 31.76
Bremen DE5 22.06 43.23 73.83
Hamburg DE6 20.30 38.72 70.05
Hessen DE7 20.46 36.51 52.23
Mecklenburg-Vorpommern DE8 17.27 34.89 31.92
Niedersachsen DE9 20.80 37.72 38.86
Nordrhein-Westfalen DEA 21.76 37.84 54.31
Rheinland-Pfalz DEB 20.98 33.34 50.95
Saarland DEC 19.42 39.40 44.39
Sachsen DED 16.92 35.63 42.41
Sachsen-Anhalt DEE 16.39 34.06 35.29
Schleswig-Holstein DEF 20.01 36.37 39.21
Thüringen DEG 16.75 33.85 36.24
Range: 5.67 11.03 42.07
* as % of total population ** (ISCED 3-4) as % of the population aged 15-24 years old
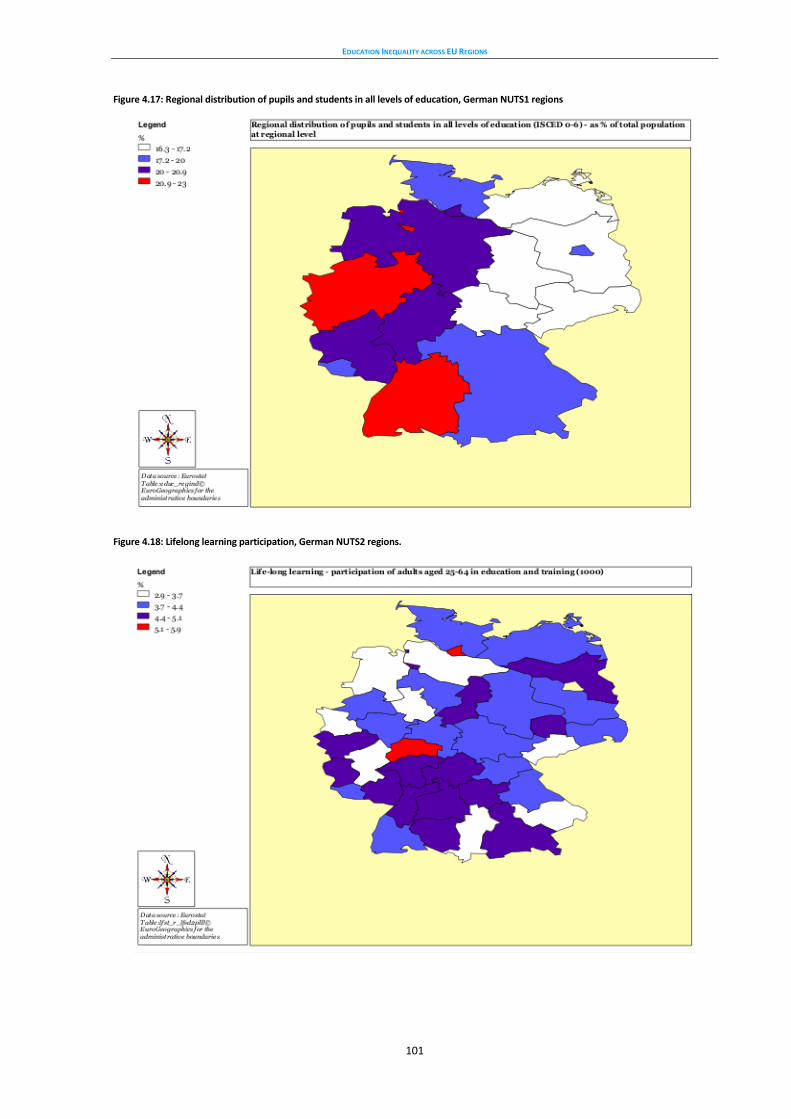
EDUCATION INEQUALITY ACROSS EU REGIONS
101
Figure 4.17: Regional distribution of pupils and students in all levels of education, German NUTS1 regions
Figure 4.18: Lifelong learning participation, German NUTS2 regions.

EDUCATION INEQUALITY ACROSS EU REGIONS
102
Figure 4.19: University "accessibility" by NUTS2 region in Germany
Figure 4.20: With tertiary education, as % of the total population 20-24 in a region, German NUTS1 regions
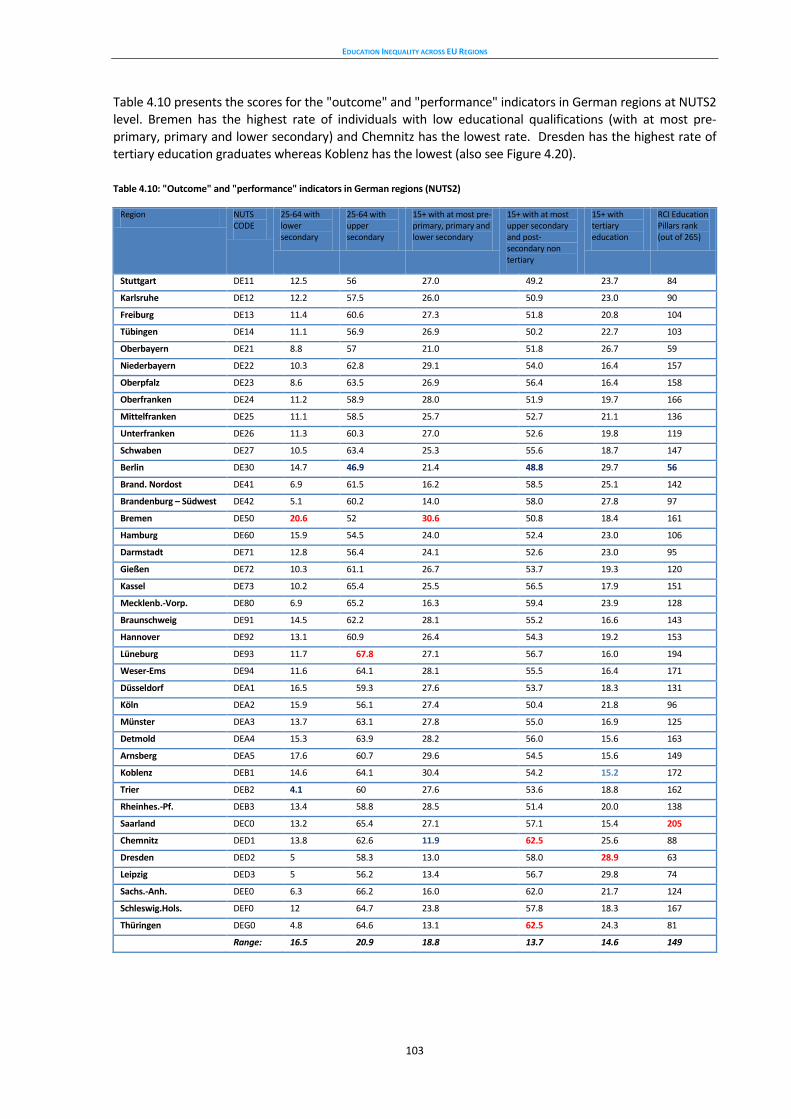
EDUCATION INEQUALITY ACROSS EU REGIONS
103
Table 4.10 presents the scores for the "outcome" and "performance" indicators in German regions at NUTS2 level. Bremen has the highest rate of individuals with low educational qualifications (with at most pre-primary, primary and lower secondary) and Chemnitz has the lowest rate. Dresden has the highest rate of tertiary education graduates whereas Koblenz has the lowest (also see Figure 4.20).
Table 4.10: "Outcome" and "performance" indicators in German regions (NUTS2)
Region NUTS CODE
25-64 with lower secondary
25-64 with upper secondary
15+ with at most pre-primary, primary and lower secondary
15+ with at most upper secondary and post-secondary non tertiary
15+ with tertiary education
RCI Education Pillars rank (out of 265)
Stuttgart DE11 12.5 56 27.0 49.2 23.7 84
Karlsruhe DE12 12.2 57.5 26.0 50.9 23.0 90
Freiburg DE13 11.4 60.6 27.3 51.8 20.8 104
Tübingen DE14 11.1 56.9 26.9 50.2 22.7 103
Oberbayern DE21 8.8 57 21.0 51.8 26.7 59
Niederbayern DE22 10.3 62.8 29.1 54.0 16.4 157
Oberpfalz DE23 8.6 63.5 26.9 56.4 16.4 158
Oberfranken DE24 11.2 58.9 28.0 51.9 19.7 166
Mittelfranken DE25 11.1 58.5 25.7 52.7 21.1 136
Unterfranken DE26 11.3 60.3 27.0 52.6 19.8 119
Schwaben DE27 10.5 63.4 25.3 55.6 18.7 147
Berlin DE30 14.7 46.9 21.4 48.8 29.7 56
Brand. Nordost DE41 6.9 61.5 16.2 58.5 25.1 142
Brandenburg – Südwest DE42 5.1 60.2 14.0 58.0 27.8 97
Bremen DE50 20.6 52 30.6 50.8 18.4 161
Hamburg DE60 15.9 54.5 24.0 52.4 23.0 106
Darmstadt DE71 12.8 56.4 24.1 52.6 23.0 95
Gießen DE72 10.3 61.1 26.7 53.7 19.3 120
Kassel DE73 10.2 65.4 25.5 56.5 17.9 151
Mecklenb.-Vorp. DE80 6.9 65.2 16.3 59.4 23.9 128
Braunschweig DE91 14.5 62.2 28.1 55.2 16.6 143
Hannover DE92 13.1 60.9 26.4 54.3 19.2 153
Lüneburg DE93 11.7 67.8 27.1 56.7 16.0 194
Weser-Ems DE94 11.6 64.1 28.1 55.5 16.4 171
Düsseldorf DEA1 16.5 59.3 27.6 53.7 18.3 131
Köln DEA2 15.9 56.1 27.4 50.4 21.8 96
Münster DEA3 13.7 63.1 27.8 55.0 16.9 125
Detmold DEA4 15.3 63.9 28.2 56.0 15.6 163
Arnsberg DEA5 17.6 60.7 29.6 54.5 15.6 149
Koblenz DEB1 14.6 64.1 30.4 54.2 15.2 172
Trier DEB2 4.1 60 27.6 53.6 18.8 162
Rheinhes.-Pf. DEB3 13.4 58.8 28.5 51.4 20.0 138
Saarland DEC0 13.2 65.4 27.1 57.1 15.4 205
Chemnitz DED1 13.8 62.6 11.9 62.5 25.6 88
Dresden DED2 5 58.3 13.0 58.0 28.9 63
Leipzig DED3 5 56.2 13.4 56.7 29.8 74
Sachs.-Anh. DEE0 6.3 66.2 16.0 62.0 21.7 124
Schleswig.Hols. DEF0 12 64.7 23.8 57.8 18.3 167
Thüringen DEG0 4.8 64.6 13.1 62.5 24.3 81
Range: 16.5 20.9 18.8 13.7 14.6 149
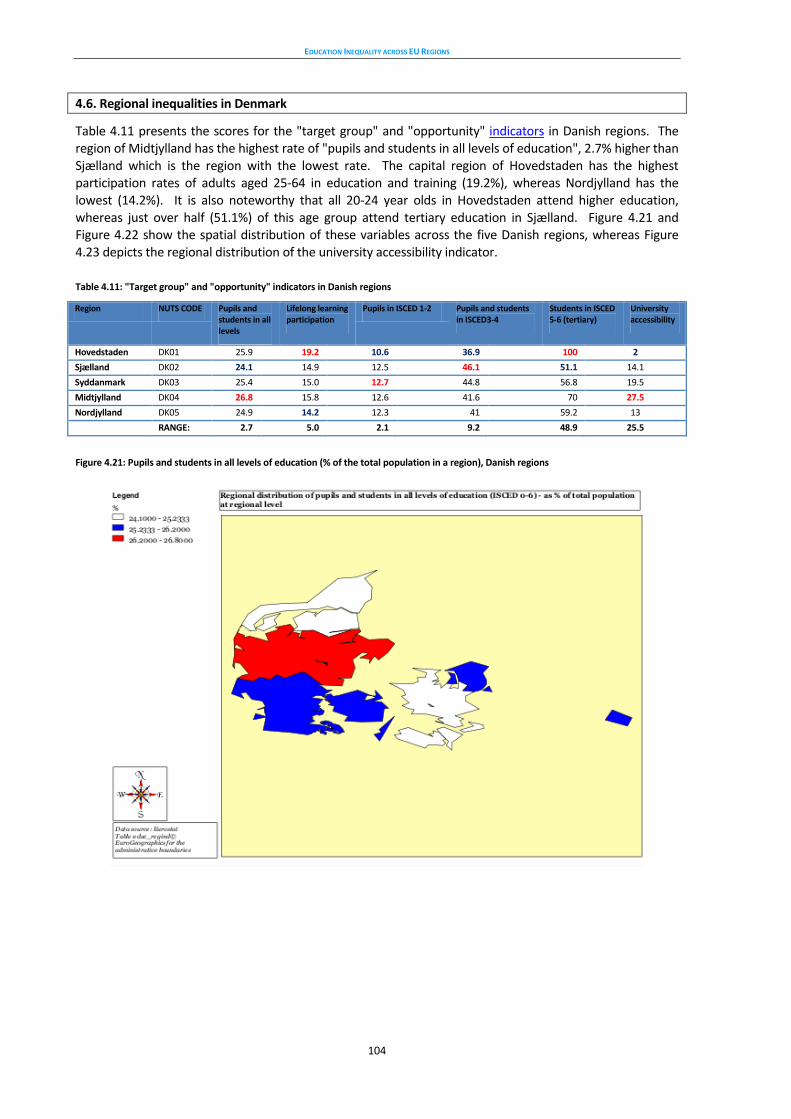
EDUCATION INEQUALITY ACROSS EU REGIONS
104
4.6. Regional inequalities in Denmark
Table 4.11 presents the scores for the "target group" and "opportunity" indicators in Danish regions. The region of Midtjylland has the highest rate of "pupils and students in all levels of education", 2.7% higher than Sjælland which is the region with the lowest rate. The capital region of Hovedstaden has the highest participation rates of adults aged 25-64 in education and training (19.2%), whereas Nordjylland has the lowest (14.2%). It is also noteworthy that all 20-24 year olds in Hovedstaden attend higher education, whereas just over half (51.1%) of this age group attend tertiary education in Sjælland. Figure 4.21 and Figure 4.22 show the spatial distribution of these variables across the five Danish regions, whereas Figure 4.23 depicts the regional distribution of the university accessibility indicator.
Table 4.11: "Target group" and "opportunity" indicators in Danish regions
Region NUTS CODE Pupils and students in all levels
Lifelong learning participation
Pupils in ISCED 1-2 Pupils and students in ISCED3-4
Students in ISCED 5-6 (tertiary)
University accessibility
Hovedstaden DK01 25.9 19.2 10.6 36.9 100 2
Sjælland DK02 24.1 14.9 12.5 46.1 51.1 14.1
Syddanmark DK03 25.4 15.0 12.7 44.8 56.8 19.5
Midtjylland DK04 26.8 15.8 12.6 41.6 70 27.5
Nordjylland DK05 24.9 14.2 12.3 41 59.2 13
RANGE: 2.7 5.0 2.1 9.2 48.9 25.5
Figure 4.21: Pupils and students in all levels of education (% of the total population in a region), Danish regions
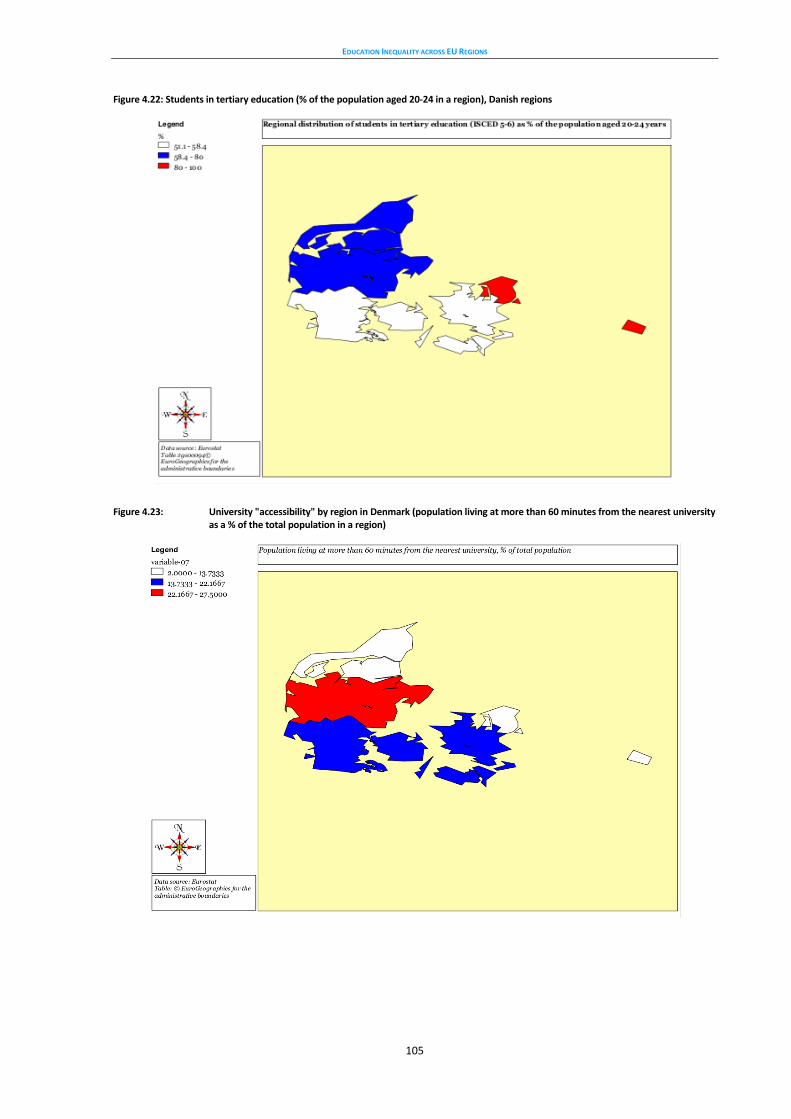
EDUCATION INEQUALITY ACROSS EU REGIONS
105
Figure 4.22: Students in tertiary education (% of the population aged 20-24 in a region), Danish regions
Figure 4.23: University "accessibility" by region in Denmark (population living at more than 60 minutes from the nearest university as a % of the total population in a region)
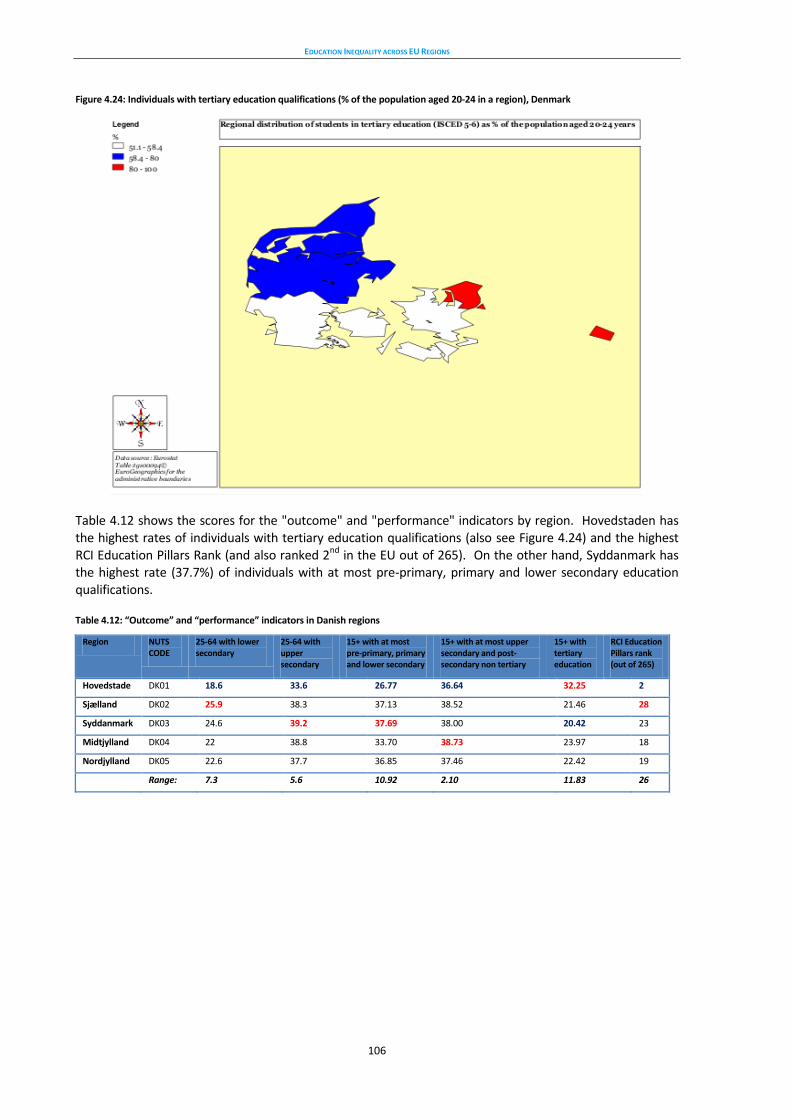
EDUCATION INEQUALITY ACROSS EU REGIONS
106
Figure 4.24: Individuals with tertiary education qualifications (% of the population aged 20-24 in a region), Denmark
Table 4.12 shows the scores for the "outcome" and "performance" indicators by region. Hovedstaden has the highest rates of individuals with tertiary education qualifications (also see Figure 4.24) and the highest RCI Education Pillars Rank (and also ranked 2nd in the EU out of 265). On the other hand, Syddanmark has the highest rate (37.7%) of individuals with at most pre-primary, primary and lower secondary education qualifications.
Table 4.12: “Outcome” and “performance” indicators in Danish regions
Region NUTS CODE
25-64 with lower secondary
25-64 with upper secondary
15+ with at most pre-primary, primary and lower secondary
15+ with at most upper secondary and post-secondary non tertiary
15+ with tertiary education
RCI Education Pillars rank (out of 265)
Hovedstaden
DK01 18.6 33.6 26.77 36.64 32.25 2
Sjælland DK02 25.9 38.3 37.13 38.52 21.46 28
Syddanmark DK03 24.6 39.2 37.69 38.00 20.42 23
Midtjylland DK04 22 38.8 33.70 38.73 23.97 18
Nordjylland DK05 22.6 37.7 36.85 37.46 22.42 19
Range: 7.3 5.6 10.92 2.10 11.83 26
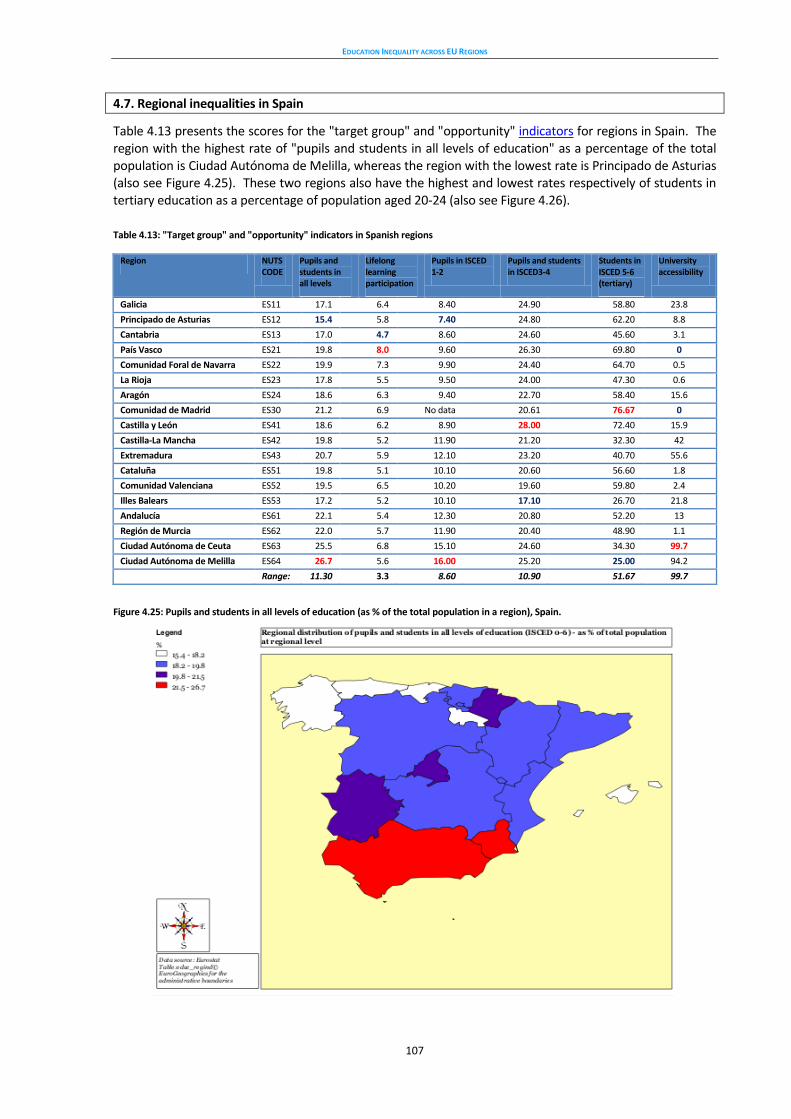
EDUCATION INEQUALITY ACROSS EU REGIONS
107
4.7. Regional inequalities in Spain
Table 4.13 presents the scores for the "target group" and "opportunity" indicators for regions in Spain. The region with the highest rate of "pupils and students in all levels of education" as a percentage of the total population is Ciudad Autónoma de Melilla, whereas the region with the lowest rate is Principado de Asturias (also see Figure 4.25). These two regions also have the highest and lowest rates respectively of students in tertiary education as a percentage of population aged 20-24 (also see Figure 4.26).
Table 4.13: "Target group" and "opportunity" indicators in Spanish regions
Region NUTS CODE
Pupils and students in all levels
Lifelong learning participation
Pupils in ISCED 1-2
Pupils and students in ISCED3-4
Students in ISCED 5-6 (tertiary)
University accessibility
Galicia ES11 17.1 6.4 8.40 24.90 58.80 23.8
Principado de Asturias ES12 15.4 5.8 7.40 24.80 62.20 8.8
Cantabria ES13 17.0 4.7 8.60 24.60 45.60 3.1
País Vasco ES21 19.8 8.0 9.60 26.30 69.80 0
Comunidad Foral de Navarra ES22 19.9 7.3 9.90 24.40 64.70 0.5
La Rioja ES23 17.8 5.5 9.50 24.00 47.30 0.6
Aragón ES24 18.6 6.3 9.40 22.70 58.40 15.6
Comunidad de Madrid ES30 21.2 6.9 No data 20.61 76.67 0
Castilla y León ES41 18.6 6.2 8.90 28.00 72.40 15.9
Castilla-La Mancha ES42 19.8 5.2 11.90 21.20 32.30 42
Extremadura ES43 20.7 5.9 12.10 23.20 40.70 55.6
Cataluña ES51 19.8 5.1 10.10 20.60 56.60 1.8
Comunidad Valenciana ES52 19.5 6.5 10.20 19.60 59.80 2.4
Illes Balears ES53 17.2 5.2 10.10 17.10 26.70 21.8
Andalucía ES61 22.1 5.4 12.30 20.80 52.20 13
Región de Murcia ES62 22.0 5.7 11.90 20.40 48.90 1.1
Ciudad Autónoma de Ceuta ES63 25.5 6.8 15.10 24.60 34.30 99.7
Ciudad Autónoma de Melilla ES64 26.7 5.6 16.00 25.20 25.00 94.2
Range: 11.30 3.3 8.60 10.90 51.67 99.7
Figure 4.25: Pupils and students in all levels of education (as % of the total population in a region), Spain.
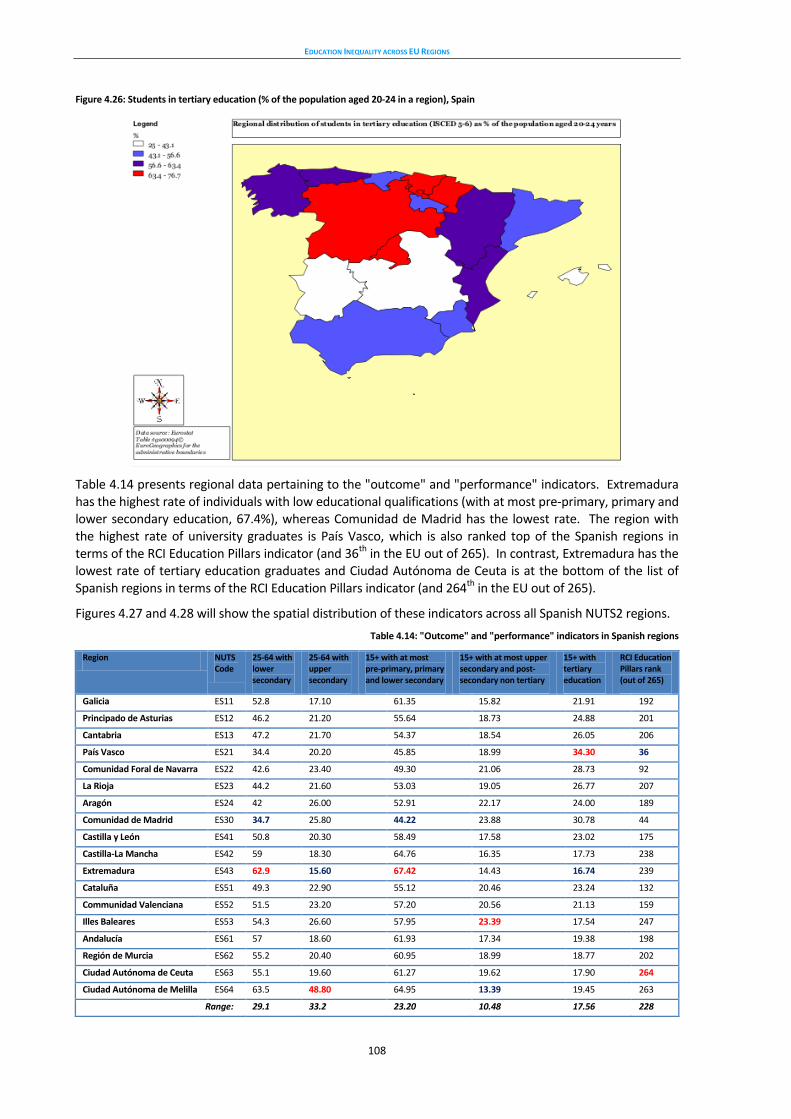
EDUCATION INEQUALITY ACROSS EU REGIONS
108
Figure 4.26: Students in tertiary education (% of the population aged 20-24 in a region), Spain
Table 4.14 presents regional data pertaining to the "outcome" and "performance" indicators. Extremadura has the highest rate of individuals with low educational qualifications (with at most pre-primary, primary and lower secondary education, 67.4%), whereas Comunidad de Madrid has the lowest rate. The region with the highest rate of university graduates is País Vasco, which is also ranked top of the Spanish regions in terms of the RCI Education Pillars indicator (and 36th in the EU out of 265). In contrast, Extremadura has the lowest rate of tertiary education graduates and Ciudad Autónoma de Ceuta is at the bottom of the list of Spanish regions in terms of the RCI Education Pillars indicator (and 264th in the EU out of 265).
Figures 4.27 and 4.28 will show the spatial distribution of these indicators across all Spanish NUTS2 regions.
Table 4.14: "Outcome" and "performance" indicators in Spanish regions
Region NUTS Code
25-64 with lower secondary
25-64 with upper secondary
15+ with at most pre-primary, primary and lower secondary
15+ with at most upper secondary and post-secondary non tertiary
15+ with tertiary education
RCI Education Pillars rank (out of 265)
Galicia ES11 52.8 17.10 61.35 15.82 21.91 192
Principado de Asturias ES12 46.2 21.20 55.64 18.73 24.88 201
Cantabria ES13 47.2 21.70 54.37 18.54 26.05 206
País Vasco ES21 34.4 20.20 45.85 18.99 34.30 36
Comunidad Foral de Navarra ES22 42.6 23.40 49.30 21.06 28.73 92
La Rioja ES23 44.2 21.60 53.03 19.05 26.77 207
Aragón ES24 42 26.00 52.91 22.17 24.00 189
Comunidad de Madrid ES30 34.7 25.80 44.22 23.88 30.78 44
Castilla y León ES41 50.8 20.30 58.49 17.58 23.02 175
Castilla-La Mancha ES42 59 18.30 64.76 16.35 17.73 238
Extremadura ES43 62.9 15.60 67.42 14.43 16.74 239
Cataluña ES51 49.3 22.90 55.12 20.46 23.24 132
Communidad Valenciana ES52 51.5 23.20 57.20 20.56 21.13 159
Illes Baleares ES53 54.3 26.60 57.95 23.39 17.54 247
Andalucía ES61 57 18.60 61.93 17.34 19.38 198
Región de Murcia ES62 55.2 20.40 60.95 18.99 18.77 202
Ciudad Autónoma de Ceuta ES63 55.1 19.60 61.27 19.62 17.90 264
Ciudad Autónoma de Melilla ES64 63.5 48.80 64.95 13.39 19.45 263
Range: 29.1 33.2 23.20 10.48 17.56 228
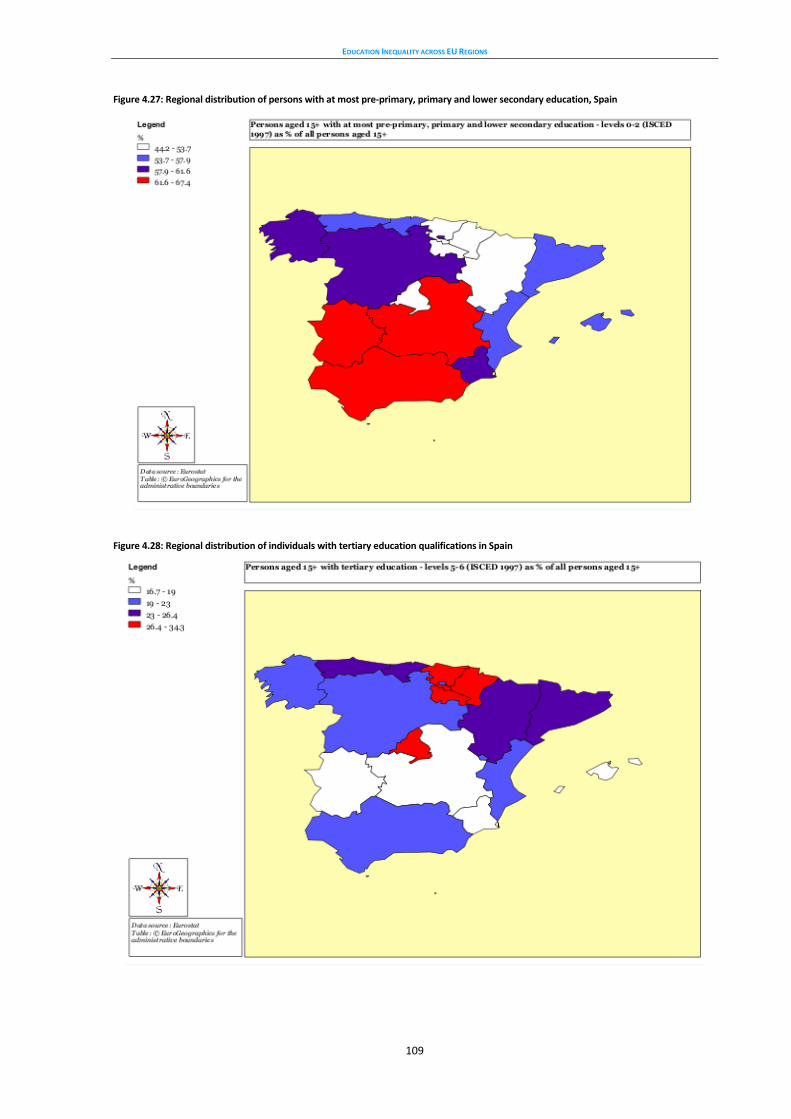
EDUCATION INEQUALITY ACROSS EU REGIONS
109
Figure 4.27: Regional distribution of persons with at most pre-primary, primary and lower secondary education, Spain
Figure 4.28: Regional distribution of individuals with tertiary education qualifications in Spain
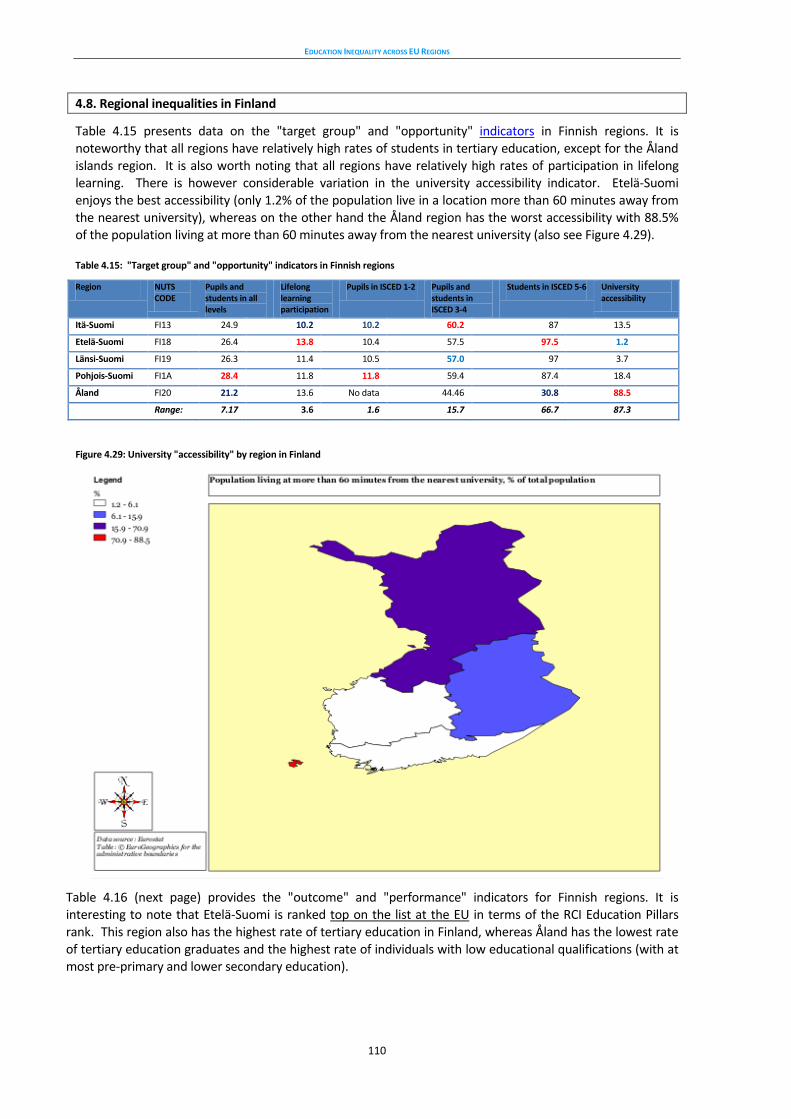
EDUCATION INEQUALITY ACROSS EU REGIONS
110
4.8. Regional inequalities in Finland
Table 4.15 presents data on the "target group" and "opportunity" indicators in Finnish regions. It is noteworthy that all regions have relatively high rates of students in tertiary education, except for the Åland islands region. It is also worth noting that all regions have relatively high rates of participation in lifelong learning. There is however considerable variation in the university accessibility indicator. Etelä-Suomi enjoys the best accessibility (only 1.2% of the population live in a location more than 60 minutes away from the nearest university), whereas on the other hand the Åland region has the worst accessibility with 88.5% of the population living at more than 60 minutes away from the nearest university (also see Figure 4.29).
Table 4.15: "Target group" and "opportunity" indicators in Finnish regions
Region NUTS CODE
Pupils and students in all levels
Lifelong learning participation
Pupils in ISCED 1-2 Pupils and students in ISCED 3-4
Students in ISCED 5-6 University accessibility
Itä-Suomi FI13 24.9 10.2 10.2 60.2 87 13.5
Etelä-Suomi FI18 26.4 13.8 10.4 57.5 97.5 1.2
Länsi-Suomi FI19 26.3 11.4 10.5 57.0 97 3.7
Pohjois-Suomi FI1A 28.4 11.8 11.8 59.4 87.4 18.4
Åland FI20 21.2 13.6 No data 44.46 30.8 88.5
Range: 7.17 3.6 1.6 15.7 66.7 87.3
Figure 4.29: University "accessibility" by region in Finland
Table 4.16 (next page) provides the "outcome" and "performance" indicators for Finnish regions. It is interesting to note that Etelä-Suomi is ranked top on the list at the EU in terms of the RCI Education Pillars rank. This region also has the highest rate of tertiary education in Finland, whereas Åland has the lowest rate of tertiary education graduates and the highest rate of individuals with low educational qualifications (with at most pre-primary and lower secondary education).
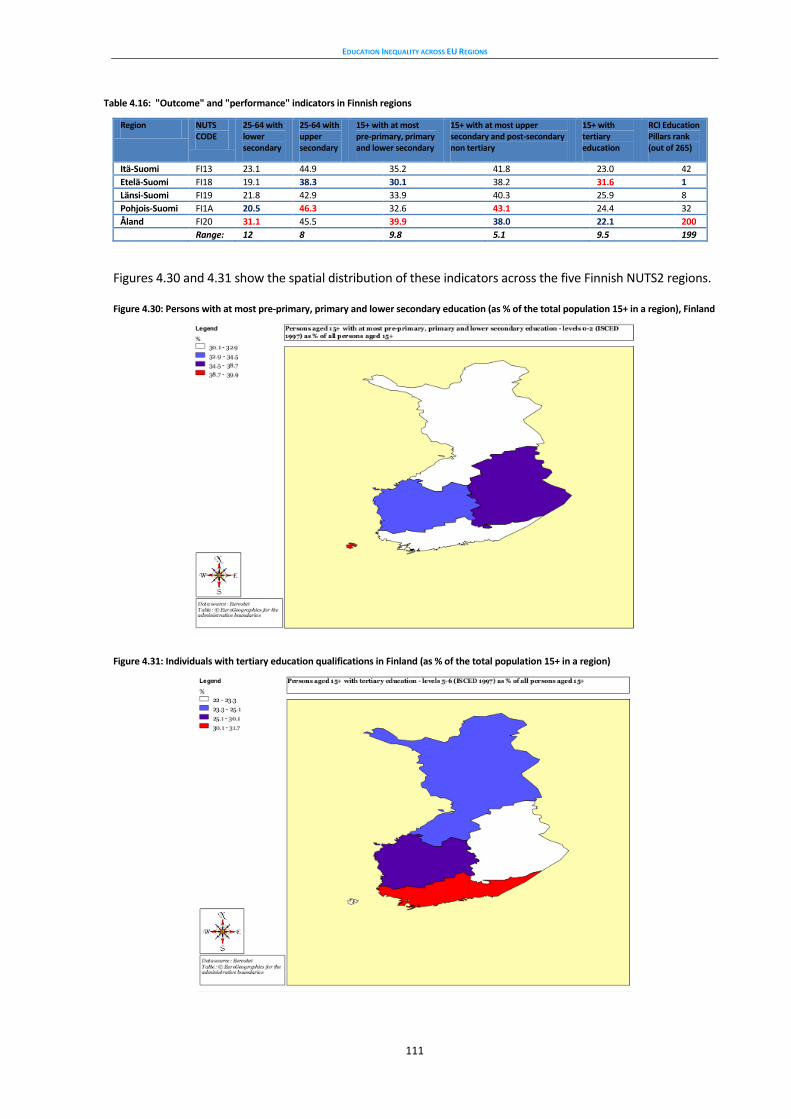
EDUCATION INEQUALITY ACROSS EU REGIONS
111
Table 4.16: "Outcome" and "performance" indicators in Finnish regions
Region NUTS CODE
25-64 with lower secondary
25-64 with upper secondary
15+ with at most pre-primary, primary and lower secondary
15+ with at most upper secondary and post-secondary non tertiary
15+ with tertiary education
RCI Education Pillars rank (out of 265)
Itä-Suomi FI13 23.1 44.9 35.2 41.8 23.0 42
Etelä-Suomi FI18 19.1 38.3 30.1 38.2 31.6 1
Länsi-Suomi FI19 21.8 42.9 33.9 40.3 25.9 8
Pohjois-Suomi FI1A 20.5 46.3 32.6 43.1 24.4 32
Åland FI20 31.1 45.5 39.9 38.0 22.1 200
Range: 12 8 9.8 5.1 9.5 199
Figures 4.30 and 4.31 show the spatial distribution of these indicators across the five Finnish NUTS2 regions.
Figure 4.30: Persons with at most pre-primary, primary and lower secondary education (as % of the total population 15+ in a region), Finland
Figure 4.31: Individuals with tertiary education qualifications in Finland (as % of the total population 15+ in a region)
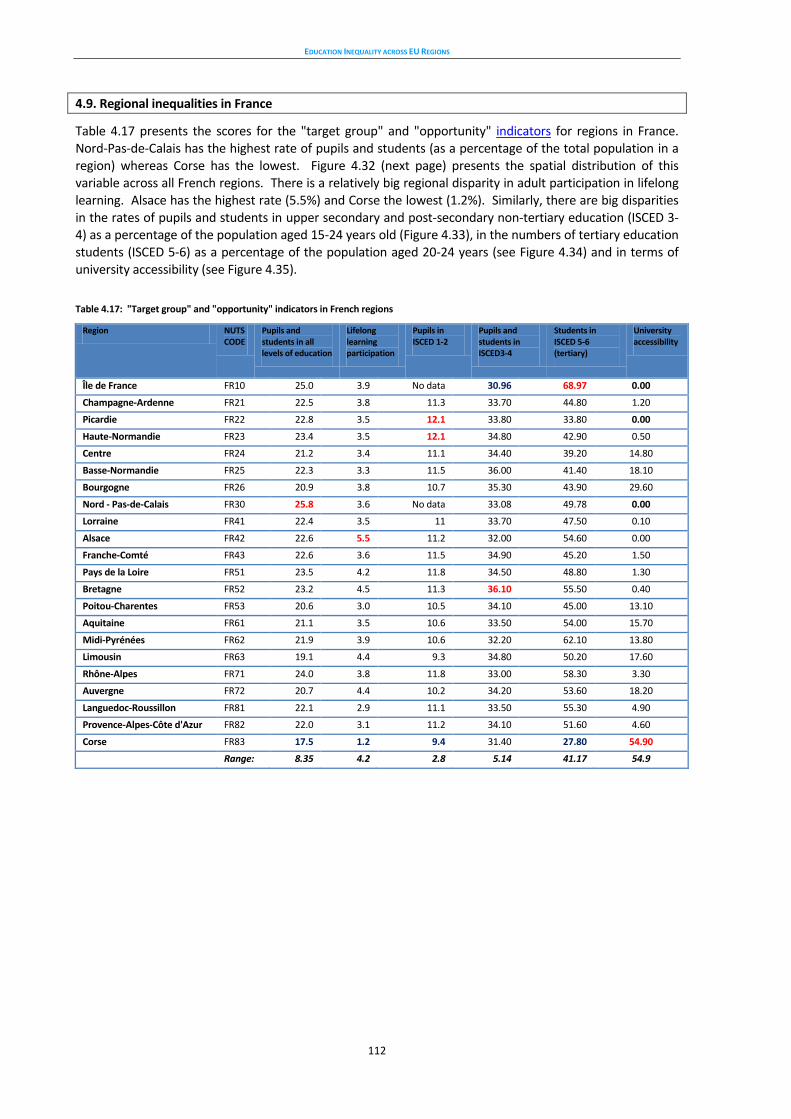
EDUCATION INEQUALITY ACROSS EU REGIONS
112
4.9. Regional inequalities in France
Table 4.17 presents the scores for the "target group" and "opportunity" indicators for regions in France. Nord-Pas-de-Calais has the highest rate of pupils and students (as a percentage of the total population in a region) whereas Corse has the lowest. Figure 4.32 (next page) presents the spatial distribution of this variable across all French regions. There is a relatively big regional disparity in adult participation in lifelong learning. Alsace has the highest rate (5.5%) and Corse the lowest (1.2%). Similarly, there are big disparities in the rates of pupils and students in upper secondary and post-secondary non-tertiary education (ISCED 3-4) as a percentage of the population aged 15-24 years old (Figure 4.33), in the numbers of tertiary education students (ISCED 5-6) as a percentage of the population aged 20-24 years (see Figure 4.34) and in terms of university accessibility (see Figure 4.35).
Table 4.17: "Target group" and "opportunity" indicators in French regions
Region NUTS CODE
Pupils and students in all levels of education
Lifelong learning participation
Pupils in ISCED 1-2
Pupils and students in ISCED3-4
Students in ISCED 5-6 (tertiary)
University accessibility
Île de France FR10 25.0 3.9 No data 30.96 68.97 0.00
Champagne-Ardenne FR21 22.5 3.8 11.3 33.70 44.80 1.20
Picardie FR22 22.8 3.5 12.1 33.80 33.80 0.00
Haute-Normandie FR23 23.4 3.5 12.1 34.80 42.90 0.50
Centre FR24 21.2 3.4 11.1 34.40 39.20 14.80
Basse-Normandie FR25 22.3 3.3 11.5 36.00 41.40 18.10
Bourgogne FR26 20.9 3.8 10.7 35.30 43.90 29.60
Nord - Pas-de-Calais FR30 25.8 3.6 No data 33.08 49.78 0.00
Lorraine FR41 22.4 3.5 11 33.70 47.50 0.10
Alsace FR42 22.6 5.5 11.2 32.00 54.60 0.00
Franche-Comté FR43 22.6 3.6 11.5 34.90 45.20 1.50
Pays de la Loire FR51 23.5 4.2 11.8 34.50 48.80 1.30
Bretagne FR52 23.2 4.5 11.3 36.10 55.50 0.40
Poitou-Charentes FR53 20.6 3.0 10.5 34.10 45.00 13.10
Aquitaine FR61 21.1 3.5 10.6 33.50 54.00 15.70
Midi-Pyrénées FR62 21.9 3.9 10.6 32.20 62.10 13.80
Limousin FR63 19.1 4.4 9.3 34.80 50.20 17.60
Rhône-Alpes FR71 24.0 3.8 11.8 33.00 58.30 3.30
Auvergne FR72 20.7 4.4 10.2 34.20 53.60 18.20
Languedoc-Roussillon FR81 22.1 2.9 11.1 33.50 55.30 4.90
Provence-Alpes-Côte d'Azur FR82 22.0 3.1 11.2 34.10 51.60 4.60
Corse FR83 17.5 1.2 9.4 31.40 27.80 54.90
Range: 8.35 4.2 2.8 5.14 41.17 54.9
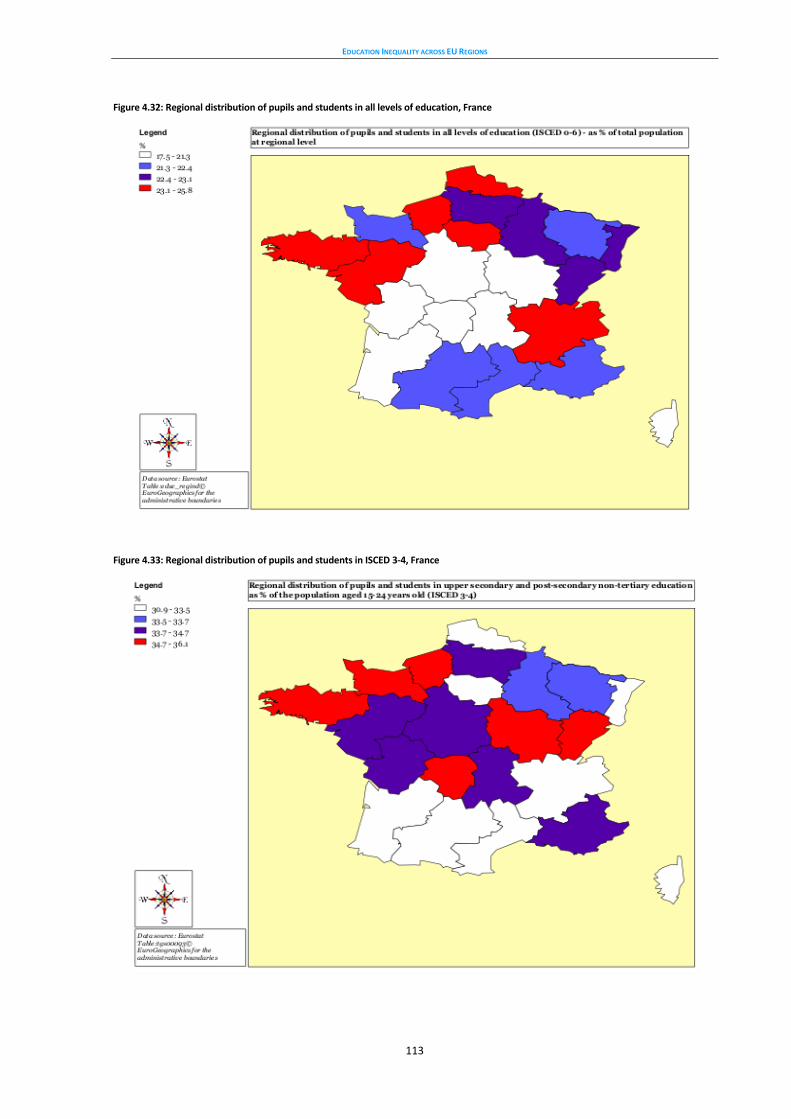
EDUCATION INEQUALITY ACROSS EU REGIONS
113
Figure 4.32: Regional distribution of pupils and students in all levels of education, France
Figure 4.33: Regional distribution of pupils and students in ISCED 3-4, France
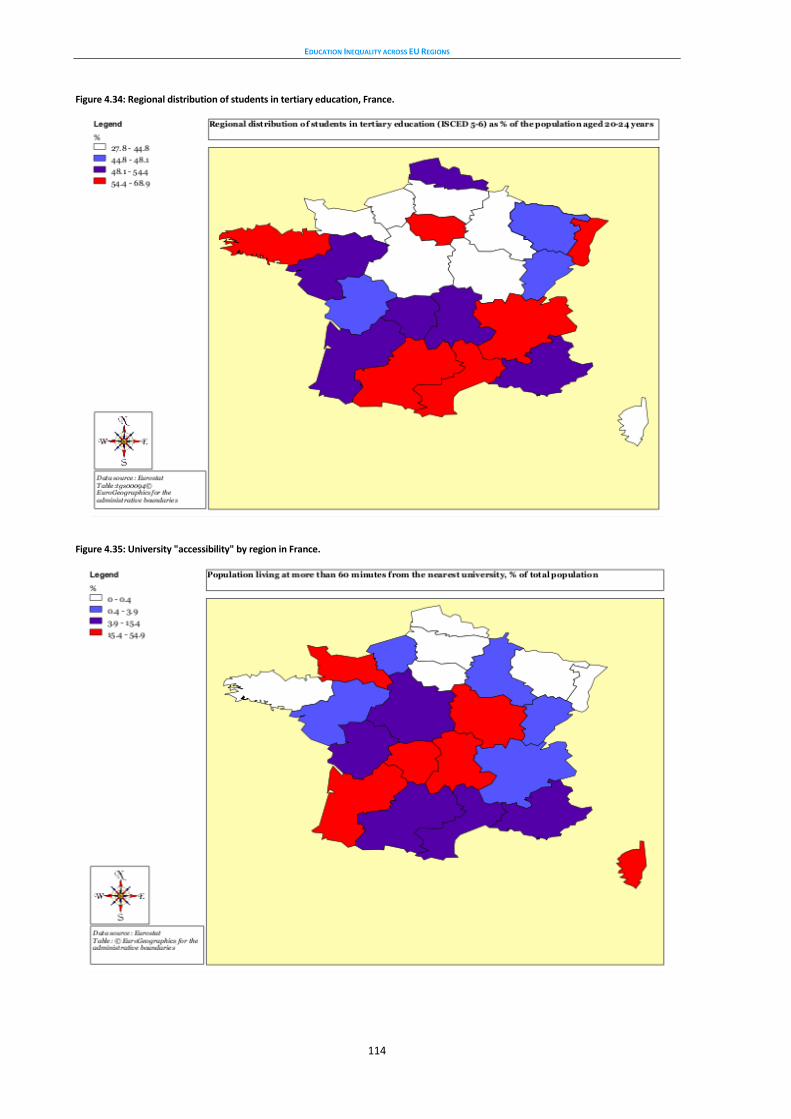
EDUCATION INEQUALITY ACROSS EU REGIONS
114
Figure 4.34: Regional distribution of students in tertiary education, France.
Figure 4.35: University "accessibility" by region in France.

EDUCATION INEQUALITY ACROSS EU REGIONS
115
Table 4.18 presents the scores for the "outcome" and "performance" indicators, whereas Figures 4.36 and 4.37 (next page) present the spatial distribution of the rates of people with low qualifications (with at most lower secondary qualifications) and the rates of tertiary education graduates. It is noteworthy that the region of Corse is at the bottom or top of all lists, having the higher rates of individuals with at most lower secondary qualifications and the lowest rates of tertiary education graduates. It is also at the bottom of the list in terms of the RCI Education Pillars (and 255th in the EU out of 265). In contrast, the capital region of Île de France is ranked highest in terms of the RCI Education Pillars indicator (and 24th in the EU out of 265) and also has the highest rate of tertiary education graduates in France.
Table 4.18: "Outcome" and "performance" indicators in French regions
Region NUTS CODE
25-64 with lower secondary
25-64 with upper secondary
15+ with at most pre-primary, primary and lower secondary
15+ with at most upper secondary and post-secondary non tertiary
15+ with tertiary education
RCI Education Pillars rank (out of 265)
Île de France FR10 26.8 32.1 34.6 32.4 33.0 24
Champagne-Ardenne FR21 34.2 39 45.1 39.6 15.3 154
Picardie FR22 36 38.5 45.4 37.7 16.9 185
Haute-Normandie FR23 35.7 39.5 45.1 39.6 15.4 160
Centre FR24 28 41.2 40.5 40.9 18.5 210
Basse-Normandie FR25 28.5 42.2 41.9 39.8 18.3 191
Bourgogne FR26 28.9 40 42.6 38.7 18.8 226
Nord - Pas-de-Calais FR30 32.3 38 42.9 37.3 19.8 111
Lorraine FR41 27.6 43 41.2 42.0 16.8 107
Alsace FR42 24.4 44.3 32.9 43.7 23.4 98
Franche-Comté FR43 32.3 41.3 42.5 39.1 18.5 181
Pays de la Loire FR51 26.6 42.4 38.6 40.7 20.7 126
Bretagne FR52 21.5 43 36.3 41.6 22.2 38
Poitou-Charentes FR53 31.2 43.2 42.9 40.6 16.5 208
Aquitaine FR61 27.9 43 38.5 39.8 21.7 169
Midi-Pyrénées FR62 20.3 39.3 35.6 37.9 26.6 116
Limousin FR63 25.1 40.5 39.6 40.3 20.1 222
Rhône-Alpes FR71 28.6 40.9 38.6 38.9 22.4 99
Auvergne FR72 25.1 40.9 37.9 39.9 22.3 179
Languedoc-Roussillon FR81 35.5 37.2 45.4 34.5 20.1 176
Provence-Alpes-Côte d'Azur
FR82 31.9 37.6 42.0 36.8 21.2 155
Corse FR83 50 28.1 60.1 28.2 11.7 255
Range: 29.7 16.2 27.2 15.5 21.3 231
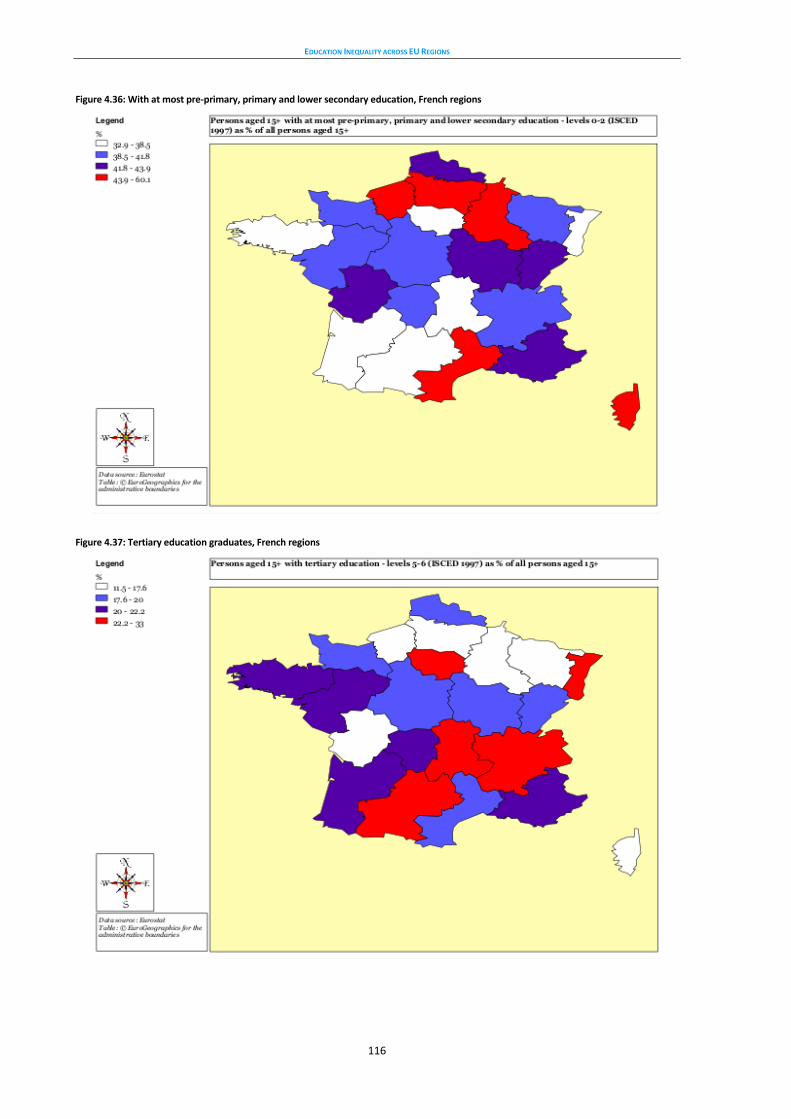
EDUCATION INEQUALITY ACROSS EU REGIONS
116
Figure 4.36: With at most pre-primary, primary and lower secondary education, French regions
Figure 4.37: Tertiary education graduates, French regions
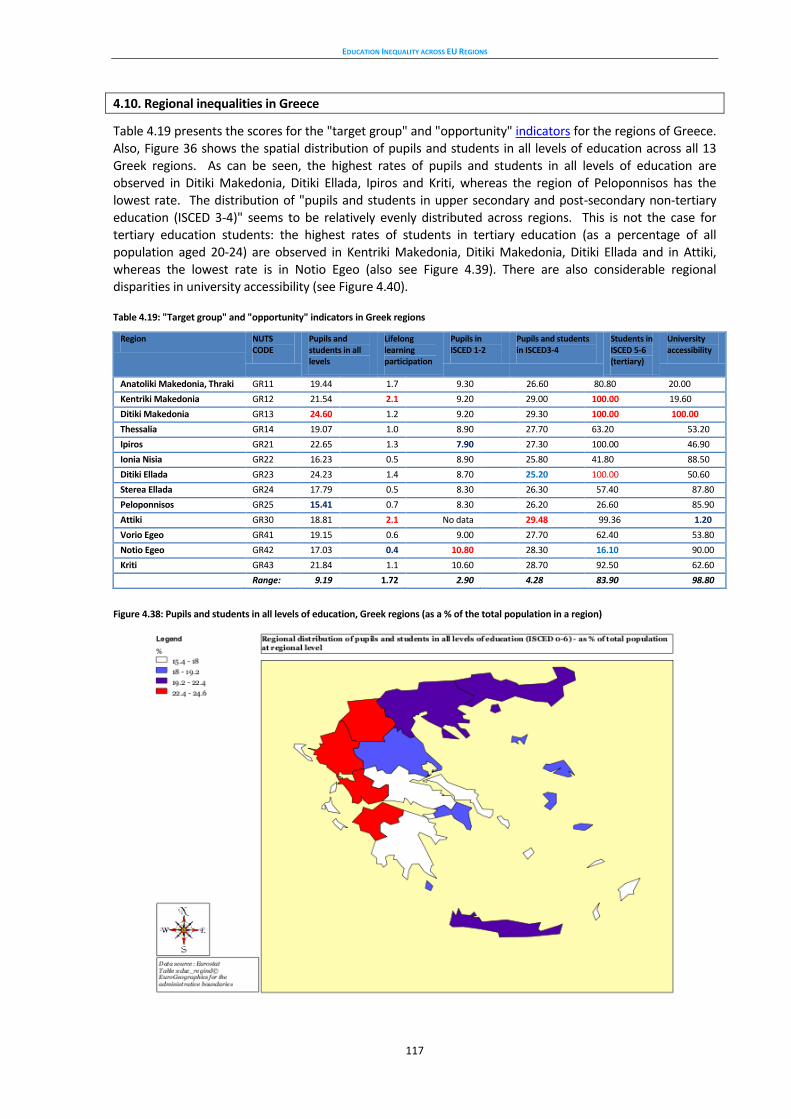
EDUCATION INEQUALITY ACROSS EU REGIONS
117
4.10. Regional inequalities in Greece
Table 4.19 presents the scores for the "target group" and "opportunity" indicators for the regions of Greece. Also, Figure 36 shows the spatial distribution of pupils and students in all levels of education across all 13 Greek regions. As can be seen, the highest rates of pupils and students in all levels of education are observed in Ditiki Makedonia, Ditiki Ellada, Ipiros and Kriti, whereas the region of Peloponnisos has the lowest rate. The distribution of "pupils and students in upper secondary and post-secondary non-tertiary education (ISCED 3-4)" seems to be relatively evenly distributed across regions. This is not the case for tertiary education students: the highest rates of students in tertiary education (as a percentage of all population aged 20-24) are observed in Kentriki Makedonia, Ditiki Makedonia, Ditiki Ellada and in Attiki, whereas the lowest rate is in Notio Egeo (also see Figure 4.39). There are also considerable regional disparities in university accessibility (see Figure 4.40).
Table 4.19: "Target group" and "opportunity" indicators in Greek regions
Region NUTS CODE
Pupils and students in all levels
Lifelong learning participation
Pupils in ISCED 1-2
Pupils and students in ISCED3-4
Students in ISCED 5-6 (tertiary)
University accessibility
Anatoliki Makedonia, Thraki GR11 19.44 1.7 9.30 26.60 80.80 20.00
Kentriki Makedonia GR12 21.54 2.1 9.20 29.00 100.00 19.60
Ditiki Makedonia GR13 24.60 1.2 9.20 29.30 100.00 100.00
Thessalia GR14 19.07 1.0 8.90 27.70 63.20 53.20
Ipiros GR21 22.65 1.3 7.90 27.30 100.00 46.90
Ionia Nisia GR22 16.23 0.5 8.90 25.80 41.80 88.50
Ditiki Ellada GR23 24.23 1.4 8.70 25.20 100.00 50.60
Sterea Ellada GR24 17.79 0.5 8.30 26.30 57.40 87.80
Peloponnisos GR25 15.41 0.7 8.30 26.20 26.60 85.90
Attiki GR30 18.81 2.1 No data 29.48 99.36 1.20
Vorio Egeo GR41 19.15 0.6 9.00 27.70 62.40 53.80
Notio Egeo GR42 17.03 0.4 10.80 28.30 16.10 90.00
Kriti GR43 21.84 1.1 10.60 28.70 92.50 62.60
Range: 9.19 1.72 2.90 4.28 83.90 98.80
Figure 4.38: Pupils and students in all levels of education, Greek regions (as a % of the total population in a region)
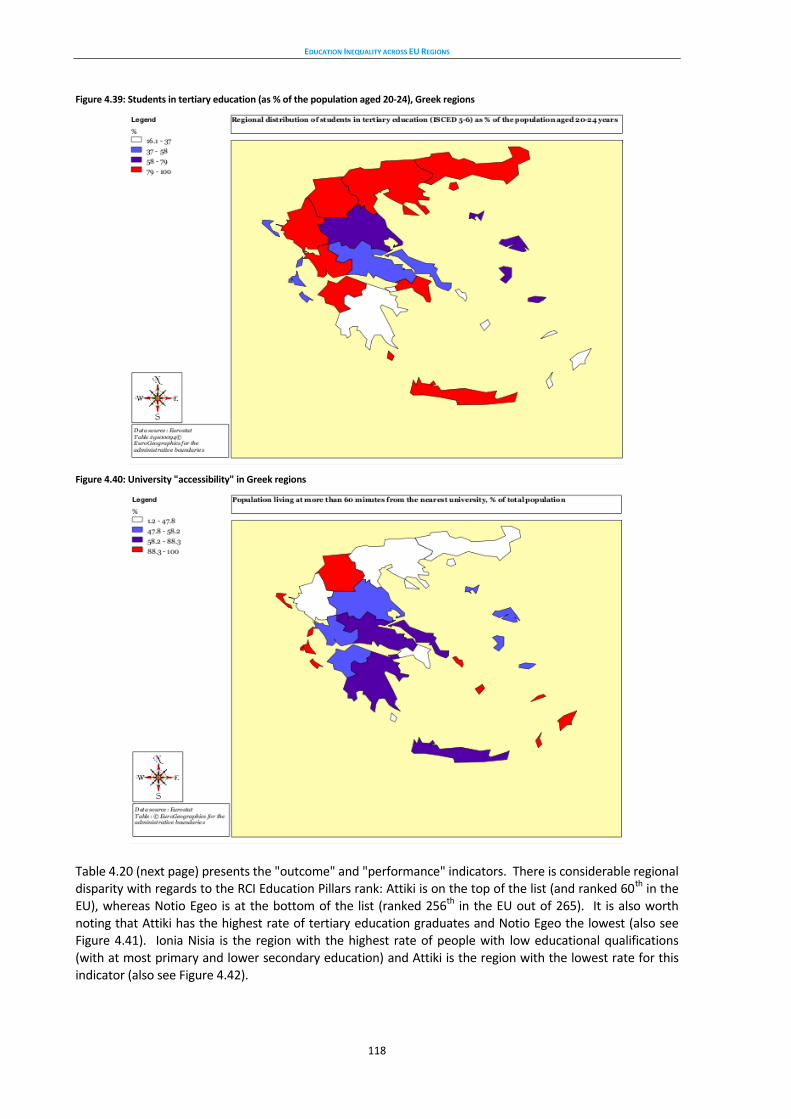
EDUCATION INEQUALITY ACROSS EU REGIONS
118
Figure 4.39: Students in tertiary education (as % of the population aged 20-24), Greek regions
Figure 4.40: University "accessibility" in Greek regions
Table 4.20 (next page) presents the "outcome" and "performance" indicators. There is considerable regional disparity with regards to the RCI Education Pillars rank: Attiki is on the top of the list (and ranked 60th in the EU), whereas Notio Egeo is at the bottom of the list (ranked 256th in the EU out of 265). It is also worth noting that Attiki has the highest rate of tertiary education graduates and Notio Egeo the lowest (also see Figure 4.41). Ionia Nisia is the region with the highest rate of people with low educational qualifications (with at most primary and lower secondary education) and Attiki is the region with the lowest rate for this indicator (also see Figure 4.42).
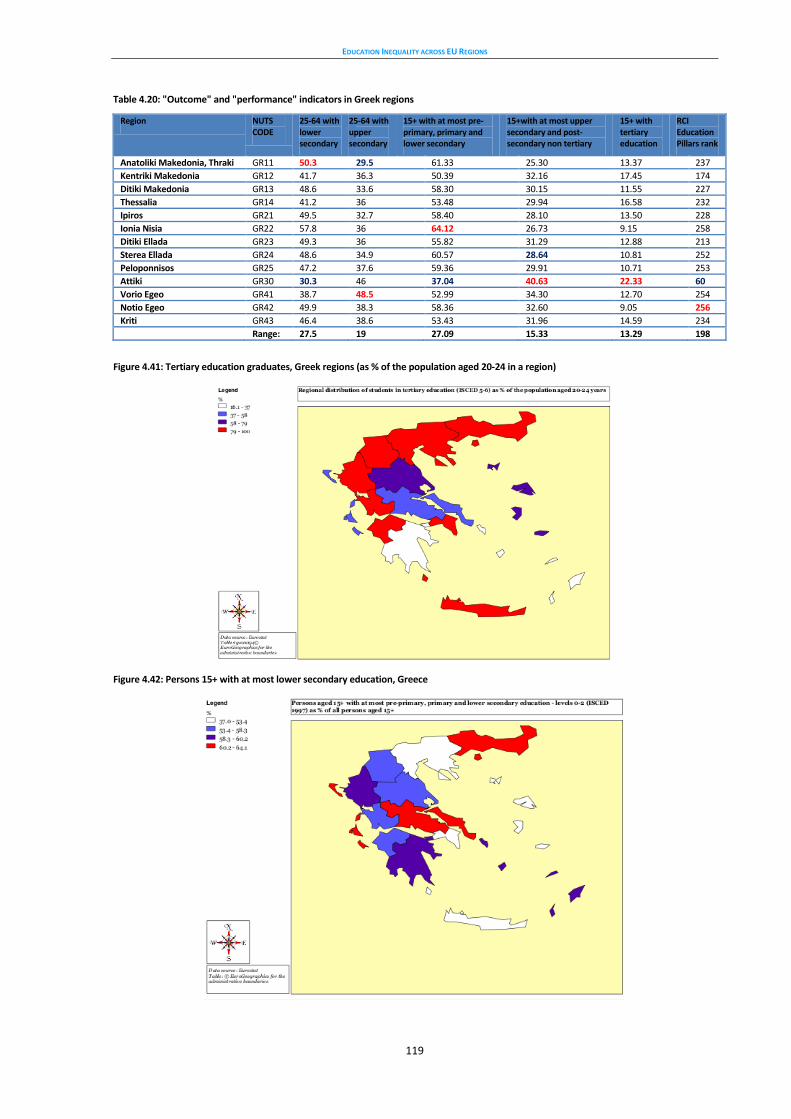
EDUCATION INEQUALITY ACROSS EU REGIONS
119
Table 4.20: "Outcome" and "performance" indicators in Greek regions
Region NUTS CODE
25-64 with lower secondary
25-64 with upper secondary
15+ with at most pre-primary, primary and lower secondary
15+with at most upper secondary and post-secondary non tertiary
15+ with tertiary education
RCI Education Pillars rank
Anatoliki Makedonia, Thraki GR11 50.3 29.5 61.33 25.30 13.37 237
Kentriki Makedonia GR12 41.7 36.3 50.39 32.16 17.45 174
Ditiki Makedonia GR13 48.6 33.6 58.30 30.15 11.55 227
Thessalia GR14 41.2 36 53.48 29.94 16.58 232
Ipiros GR21 49.5 32.7 58.40 28.10 13.50 228
Ionia Nisia GR22 57.8 36 64.12 26.73 9.15 258
Ditiki Ellada GR23 49.3 36 55.82 31.29 12.88 213
Sterea Ellada GR24 48.6 34.9 60.57 28.64 10.81 252
Peloponnisos GR25 47.2 37.6 59.36 29.91 10.71 253
Attiki GR30 30.3 46 37.04 40.63 22.33 60
Vorio Egeo GR41 38.7 48.5 52.99 34.30 12.70 254
Notio Egeo GR42 49.9 38.3 58.36 32.60 9.05 256
Kriti GR43 46.4 38.6 53.43 31.96 14.59 234
Range: 27.5 19 27.09 15.33 13.29 198
Figure 4.41: Tertiary education graduates, Greek regions (as % of the population aged 20-24 in a region)
Figure 4.42: Persons 15+ with at most lower secondary education, Greece
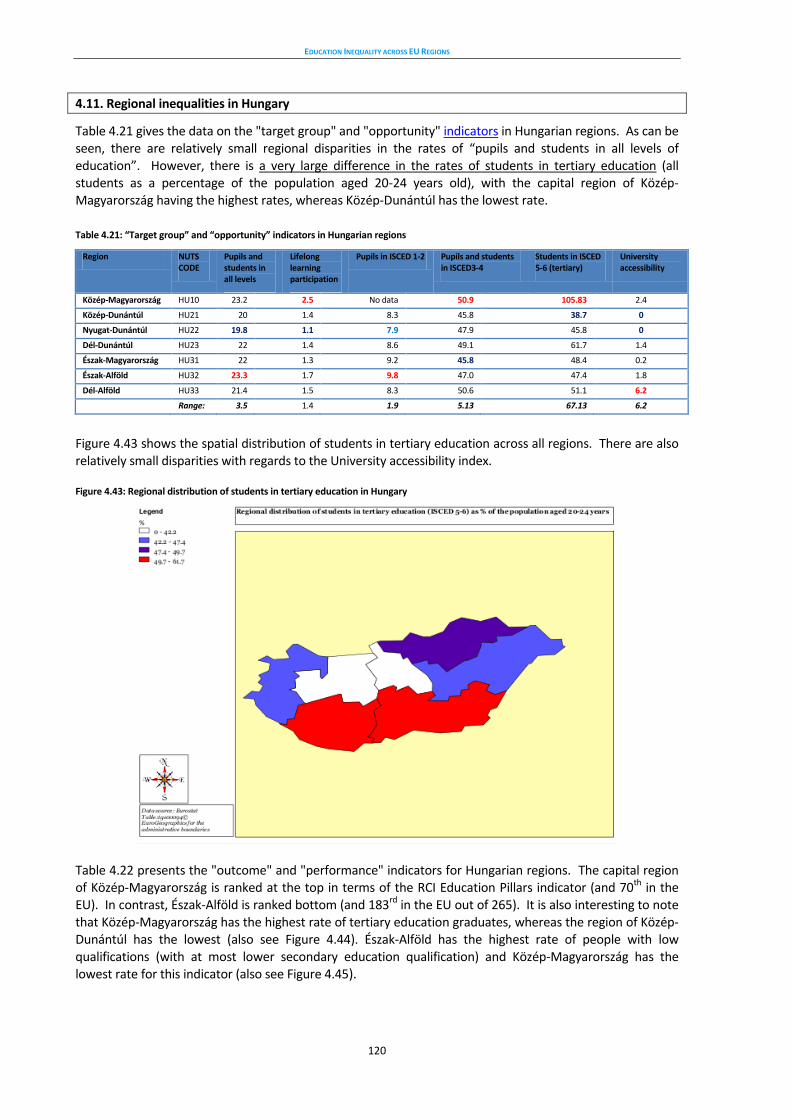
EDUCATION INEQUALITY ACROSS EU REGIONS
120
4.11. Regional inequalities in Hungary
Table 4.21 gives the data on the "target group" and "opportunity" indicators in Hungarian regions. As can be seen, there are relatively small regional disparities in the rates of “pupils and students in all levels of education”. However, there is a very large difference in the rates of students in tertiary education (all students as a percentage of the population aged 20-24 years old), with the capital region of Közép-Magyarország having the highest rates, whereas Közép-Dunántúl has the lowest rate.
Table 4.21: “Target group” and “opportunity” indicators in Hungarian regions
Region NUTS CODE
Pupils and students in all levels
Lifelong learning participation
Pupils in ISCED 1-2 Pupils and students in ISCED3-4
Students in ISCED 5-6 (tertiary)
University accessibility
Közép-Magyarország HU10 23.2 2.5 No data 50.9 105.83 2.4
Közép-Dunántúl HU21 20 1.4 8.3 45.8 38.7 0
Nyugat-Dunántúl HU22 19.8 1.1 7.9 47.9 45.8 0
Dél-Dunántúl HU23 22 1.4 8.6 49.1 61.7 1.4
Észak-Magyarország HU31 22 1.3 9.2 45.8 48.4 0.2
Észak-Alföld HU32 23.3 1.7 9.8 47.0 47.4 1.8
Dél-Alföld HU33 21.4 1.5 8.3 50.6 51.1 6.2
Range: 3.5 1.4 1.9 5.13 67.13 6.2
Figure 4.43 shows the spatial distribution of students in tertiary education across all regions. There are also relatively small disparities with regards to the University accessibility index.
Figure 4.43: Regional distribution of students in tertiary education in Hungary
Table 4.22 presents the "outcome" and "performance" indicators for Hungarian regions. The capital region of Közép-Magyarország is ranked at the top in terms of the RCI Education Pillars indicator (and 70th in the EU). In contrast, Észak-Alföld is ranked bottom (and 183rd in the EU out of 265). It is also interesting to note that Közép-Magyarország has the highest rate of tertiary education graduates, whereas the region of Közép-Dunántúl has the lowest (also see Figure 4.44). Észak-Alföld has the highest rate of people with low qualifications (with at most lower secondary education qualification) and Közép-Magyarország has the lowest rate for this indicator (also see Figure 4.45).
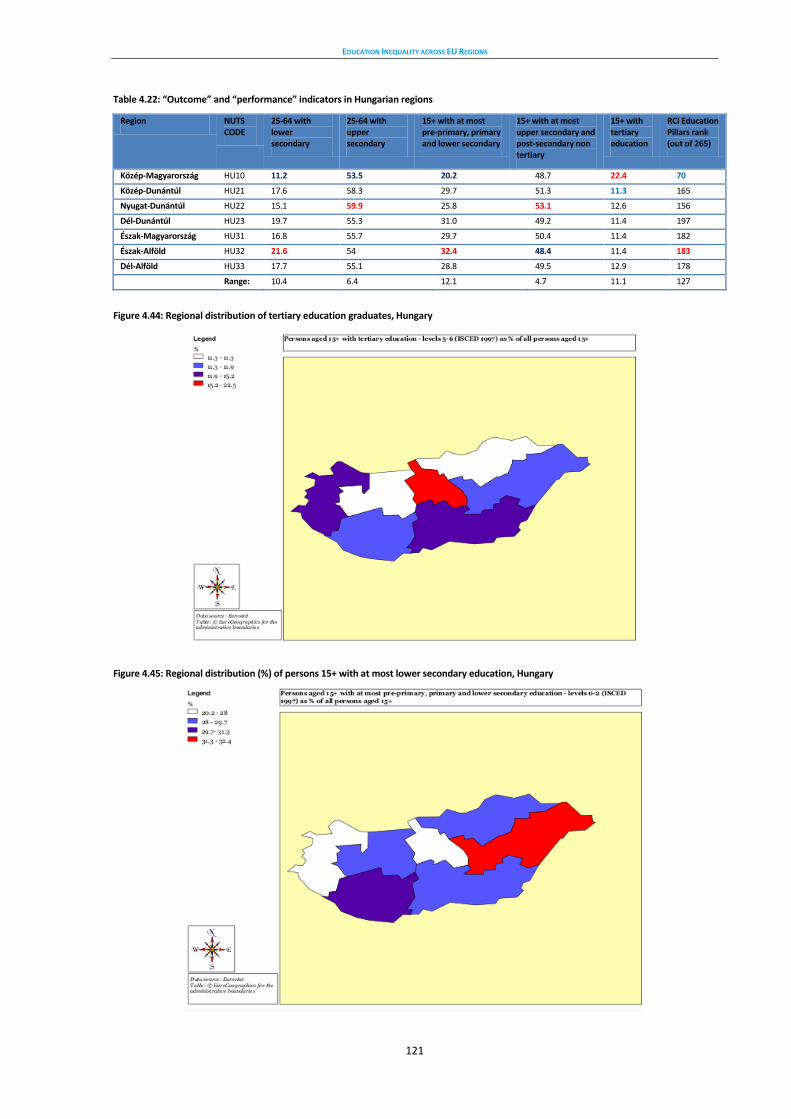
EDUCATION INEQUALITY ACROSS EU REGIONS
121
Table 4.22: “Outcome” and “performance” indicators in Hungarian regions
Region NUTS CODE
25-64 with lower secondary
25-64 with upper secondary
15+ with at most pre-primary, primary and lower secondary
15+ with at most upper secondary and post-secondary non tertiary
15+ with tertiary education
RCI Education Pillars rank (out of 265)
Közép-Magyarország HU10 11.2 53.5 20.2 48.7 22.4 70
Közép-Dunántúl HU21 17.6 58.3 29.7 51.3 11.3 165
Nyugat-Dunántúl HU22 15.1 59.9 25.8 53.1 12.6 156
Dél-Dunántúl HU23 19.7 55.3 31.0 49.2 11.4 197
Észak-Magyarország HU31 16.8 55.7 29.7 50.4 11.4 182
Észak-Alföld HU32 21.6 54 32.4 48.4 11.4 183
Dél-Alföld HU33 17.7 55.1 28.8 49.5 12.9 178
Range: 10.4 6.4 12.1 4.7 11.1 127
Figure 4.44: Regional distribution of tertiary education graduates, Hungary
Figure 4.45: Regional distribution (%) of persons 15+ with at most lower secondary education, Hungary
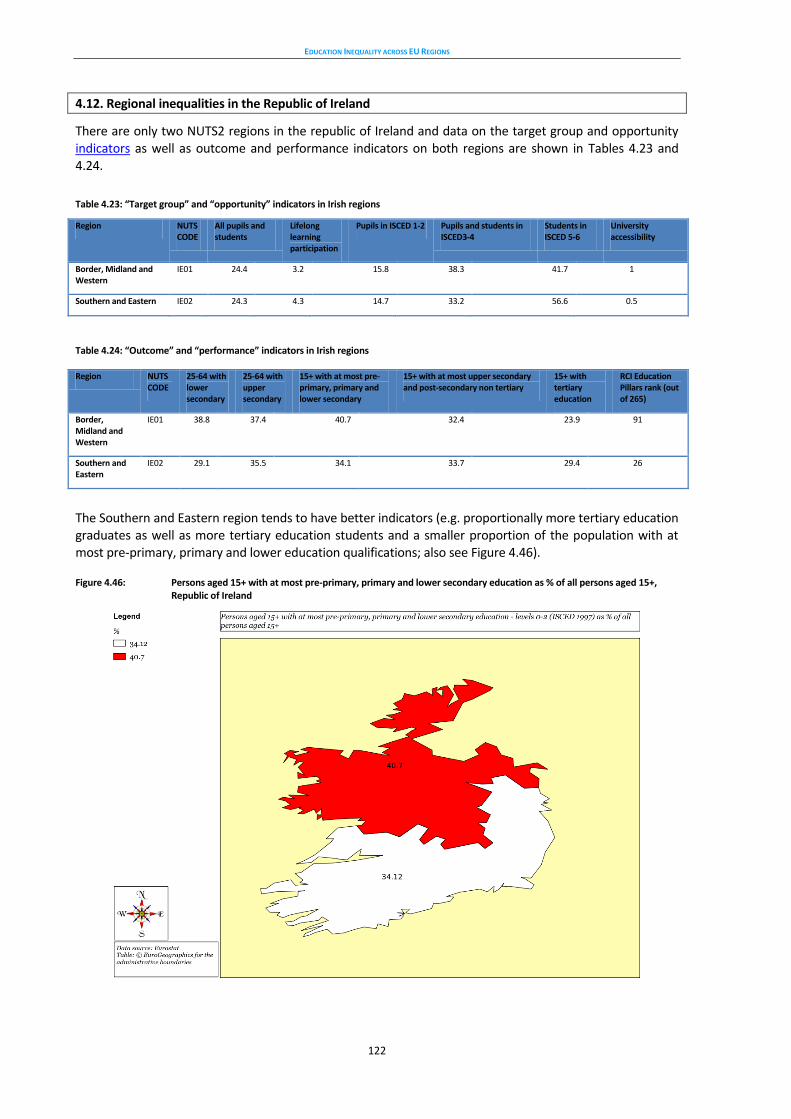
EDUCATION INEQUALITY ACROSS EU REGIONS
122
4.12. Regional inequalities in the Republic of Ireland
There are only two NUTS2 regions in the republic of Ireland and data on the target group and opportunity indicators as well as outcome and performance indicators on both regions are shown in Tables 4.23 and 4.24.
Table 4.23: “Target group” and “opportunity” indicators in Irish regions
Region NUTS CODE
All pupils and students
Lifelong learning participation
Pupils in ISCED 1-2 Pupils and students in ISCED3-4
Students in ISCED 5-6
University accessibility
Border, Midland and Western
IE01 24.4 3.2 15.8 38.3 41.7 1
Southern and Eastern IE02 24.3 4.3 14.7 33.2 56.6 0.5
Table 4.24: “Outcome” and “performance” indicators in Irish regions
Region NUTS CODE
25-64 with lower secondary
25-64 with upper secondary
15+ with at most pre-primary, primary and lower secondary
15+ with at most upper secondary and post-secondary non tertiary
15+ with tertiary education
RCI Education Pillars rank (out of 265)
Border, Midland and Western
IE01 38.8 37.4 40.7 32.4 23.9 91
Southern and Eastern
IE02 29.1 35.5 34.1 33.7 29.4 26
The Southern and Eastern region tends to have better indicators (e.g. proportionally more tertiary education graduates as well as more tertiary education students and a smaller proportion of the population with at most pre-primary, primary and lower education qualifications; also see Figure 4.46). Figure 4.46: Persons aged 15+ with at most pre-primary, primary and lower secondary education as % of all persons aged 15+, Republic of Ireland
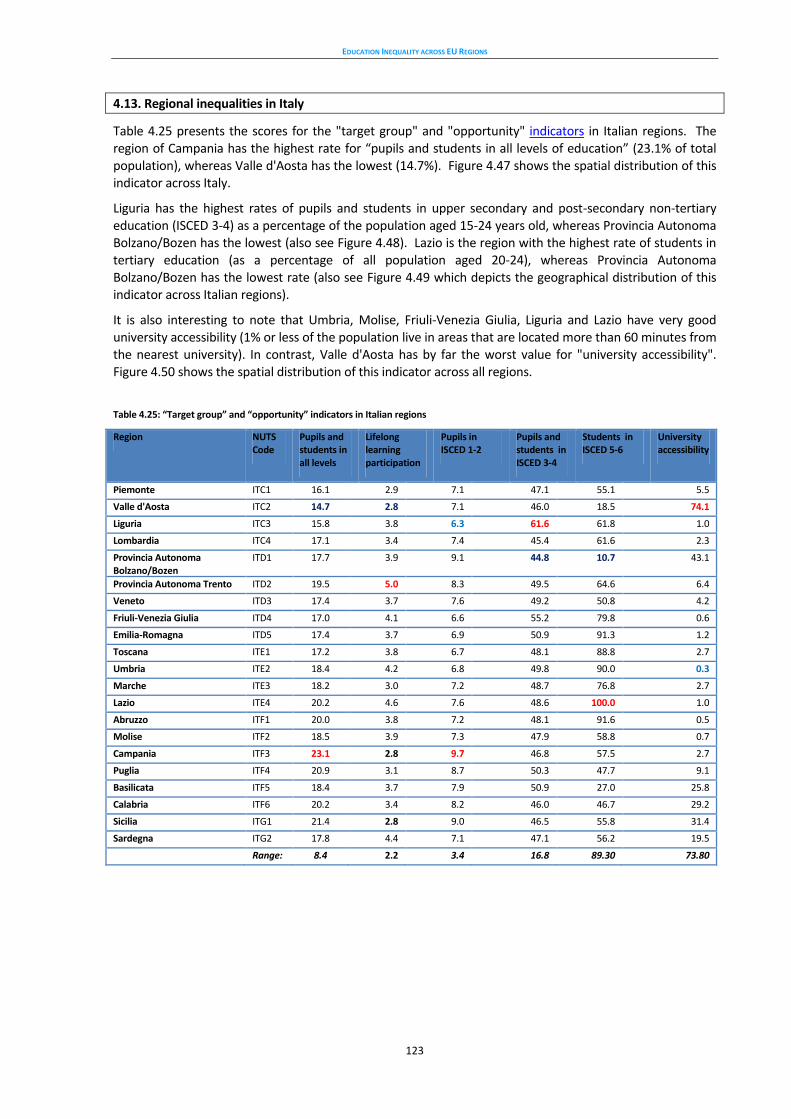
EDUCATION INEQUALITY ACROSS EU REGIONS
123
4.13. Regional inequalities in Italy
Table 4.25 presents the scores for the "target group" and "opportunity" indicators in Italian regions. The region of Campania has the highest rate for “pupils and students in all levels of education” (23.1% of total population), whereas Valle d'Aosta has the lowest (14.7%). Figure 4.47 shows the spatial distribution of this indicator across Italy.
Liguria has the highest rates of pupils and students in upper secondary and post-secondary non-tertiary education (ISCED 3-4) as a percentage of the population aged 15-24 years old, whereas Provincia Autonoma Bolzano/Bozen has the lowest (also see Figure 4.48). Lazio is the region with the highest rate of students in tertiary education (as a percentage of all population aged 20-24), whereas Provincia Autonoma Bolzano/Bozen has the lowest rate (also see Figure 4.49 which depicts the geographical distribution of this indicator across Italian regions).
It is also interesting to note that Umbria, Molise, Friuli-Venezia Giulia, Liguria and Lazio have very good university accessibility (1% or less of the population live in areas that are located more than 60 minutes from the nearest university). In contrast, Valle d'Aosta has by far the worst value for "university accessibility". Figure 4.50 shows the spatial distribution of this indicator across all regions.
Table 4.25: “Target group” and “opportunity” indicators in Italian regions
Region NUTS Code
Pupils and students in all levels
Lifelong learning participation
Pupils in ISCED 1-2
Pupils and students in ISCED 3-4
Students in ISCED 5-6
University accessibility
Piemonte ITC1 16.1 2.9 7.1 47.1 55.1 5.5
Valle d'Aosta ITC2 14.7 2.8 7.1 46.0 18.5 74.1
Liguria ITC3 15.8 3.8 6.3 61.6 61.8 1.0
Lombardia ITC4 17.1 3.4 7.4 45.4 61.6 2.3
Provincia Autonoma Bolzano/Bozen
ITD1 17.7 3.9 9.1 44.8 10.7 43.1
Provincia Autonoma Trento ITD2 19.5 5.0 8.3 49.5 64.6 6.4
Veneto ITD3 17.4 3.7 7.6 49.2 50.8 4.2
Friuli-Venezia Giulia ITD4 17.0 4.1 6.6 55.2 79.8 0.6
Emilia-Romagna ITD5 17.4 3.7 6.9 50.9 91.3 1.2
Toscana ITE1 17.2 3.8 6.7 48.1 88.8 2.7
Umbria ITE2 18.4 4.2 6.8 49.8 90.0 0.3
Marche ITE3 18.2 3.0 7.2 48.7 76.8 2.7
Lazio ITE4 20.2 4.6 7.6 48.6 100.0 1.0
Abruzzo ITF1 20.0 3.8 7.2 48.1 91.6 0.5
Molise ITF2 18.5 3.9 7.3 47.9 58.8 0.7
Campania ITF3 23.1 2.8 9.7 46.8 57.5 2.7
Puglia ITF4 20.9 3.1 8.7 50.3 47.7 9.1
Basilicata ITF5 18.4 3.7 7.9 50.9 27.0 25.8
Calabria ITF6 20.2 3.4 8.2 46.0 46.7 29.2
Sicilia ITG1 21.4 2.8 9.0 46.5 55.8 31.4
Sardegna ITG2 17.8 4.4 7.1 47.1 56.2 19.5
Range: 8.4 2.2 3.4 16.8 89.30 73.80
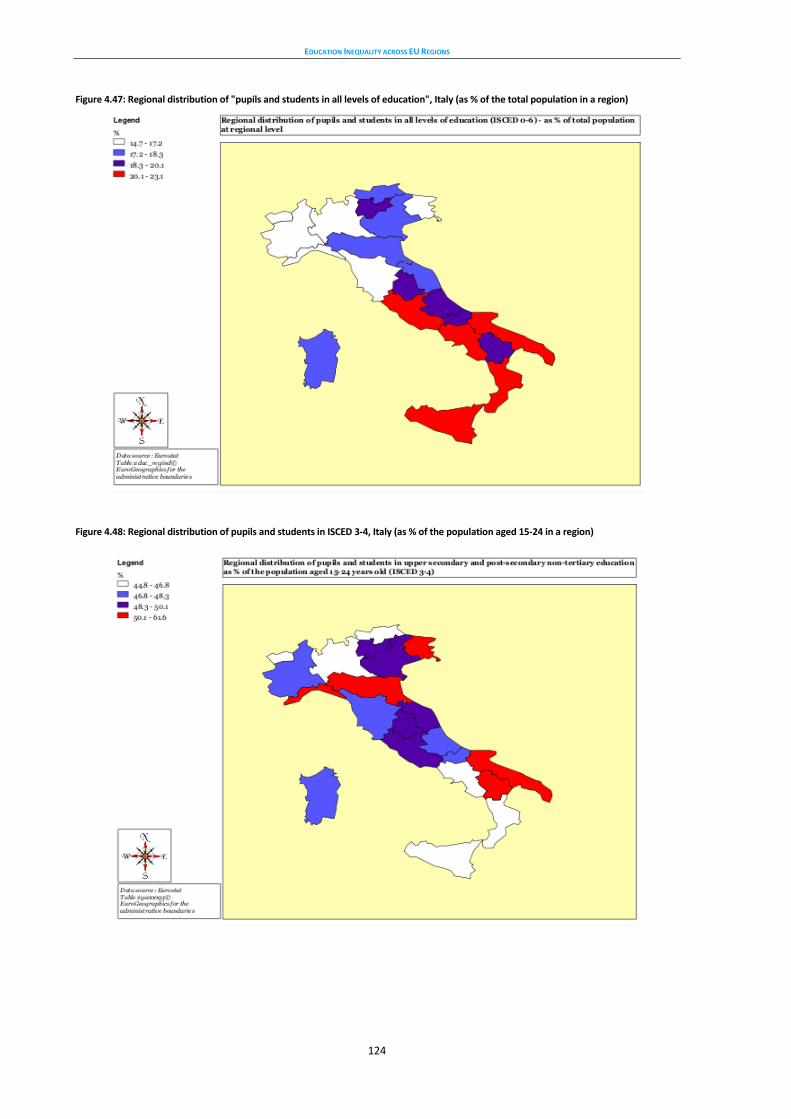
EDUCATION INEQUALITY ACROSS EU REGIONS
124
Figure 4.47: Regional distribution of "pupils and students in all levels of education", Italy (as % of the total population in a region)
Figure 4.48: Regional distribution of pupils and students in ISCED 3-4, Italy (as % of the population aged 15-24 in a region)
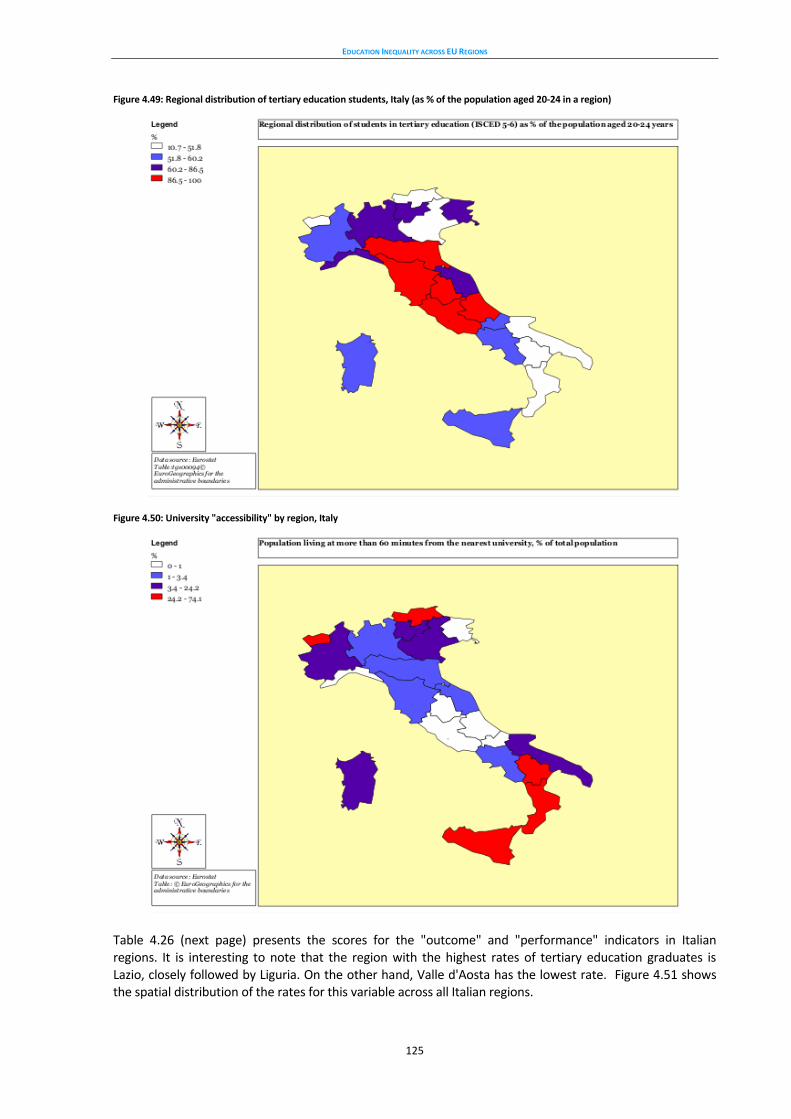
EDUCATION INEQUALITY ACROSS EU REGIONS
125
Figure 4.49: Regional distribution of tertiary education students, Italy (as % of the population aged 20-24 in a region)
Figure 4.50: University "accessibility" by region, Italy
Table 4.26 (next page) presents the scores for the "outcome" and "performance" indicators in Italian regions. It is interesting to note that the region with the highest rates of tertiary education graduates is Lazio, closely followed by Liguria. On the other hand, Valle d'Aosta has the lowest rate. Figure 4.51 shows the spatial distribution of the rates for this variable across all Italian regions.
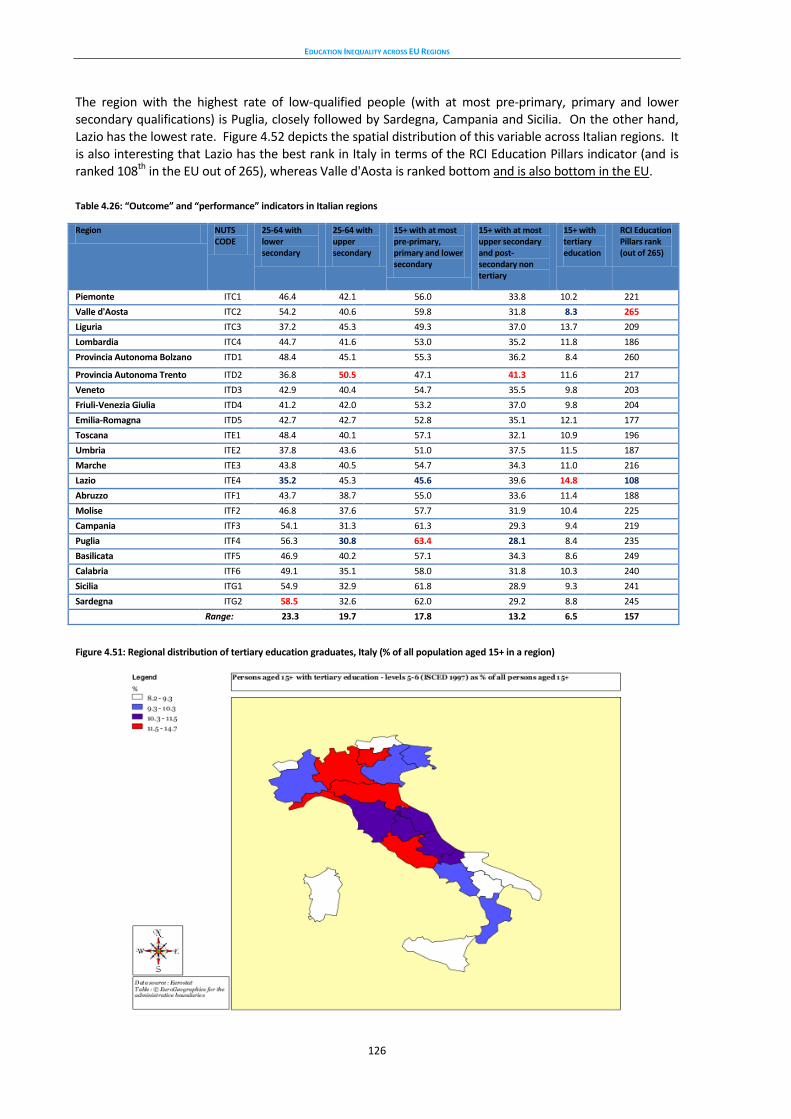
EDUCATION INEQUALITY ACROSS EU REGIONS
126
The region with the highest rate of low-qualified people (with at most pre-primary, primary and lower secondary qualifications) is Puglia, closely followed by Sardegna, Campania and Sicilia. On the other hand, Lazio has the lowest rate. Figure 4.52 depicts the spatial distribution of this variable across Italian regions. It is also interesting that Lazio has the best rank in Italy in terms of the RCI Education Pillars indicator (and is ranked 108th in the EU out of 265), whereas Valle d'Aosta is ranked bottom and is also bottom in the EU.
Table 4.26: “Outcome” and “performance” indicators in Italian regions
Region NUTS CODE
25-64 with lower secondary
25-64 with upper secondary
15+ with at most pre-primary, primary and lower secondary
15+ with at most upper secondary and post-secondary non tertiary
15+ with tertiary education
RCI Education Pillars rank (out of 265)
Piemonte ITC1 46.4 42.1 56.0 33.8 10.2 221
Valle d'Aosta ITC2 54.2 40.6 59.8 31.8 8.3 265
Liguria ITC3 37.2 45.3 49.3 37.0 13.7 209
Lombardia ITC4 44.7 41.6 53.0 35.2 11.8 186
Provincia Autonoma Bolzano ITD1 48.4 45.1 55.3 36.2 8.4 260
Provincia Autonoma Trento ITD2 36.8 50.5 47.1 41.3 11.6 217
Veneto ITD3 42.9 40.4 54.7 35.5 9.8 203
Friuli-Venezia Giulia ITD4 41.2 42.0 53.2 37.0 9.8 204
Emilia-Romagna ITD5 42.7 42.7 52.8 35.1 12.1 177
Toscana ITE1 48.4 40.1 57.1 32.1 10.9 196
Umbria ITE2 37.8 43.6 51.0 37.5 11.5 187
Marche ITE3 43.8 40.5 54.7 34.3 11.0 216
Lazio ITE4 35.2 45.3 45.6 39.6 14.8 108
Abruzzo ITF1 43.7 38.7 55.0 33.6 11.4 188
Molise ITF2 46.8 37.6 57.7 31.9 10.4 225
Campania ITF3 54.1 31.3 61.3 29.3 9.4 219
Puglia ITF4 56.3 30.8 63.4 28.1 8.4 235
Basilicata ITF5 46.9 40.2 57.1 34.3 8.6 249
Calabria ITF6 49.1 35.1 58.0 31.8 10.3 240
Sicilia ITG1 54.9 32.9 61.8 28.9 9.3 241
Sardegna ITG2 58.5 32.6 62.0 29.2 8.8 245
Range: 23.3 19.7 17.8 13.2 6.5 157
Figure 4.51: Regional distribution of tertiary education graduates, Italy (% of all population aged 15+ in a region)
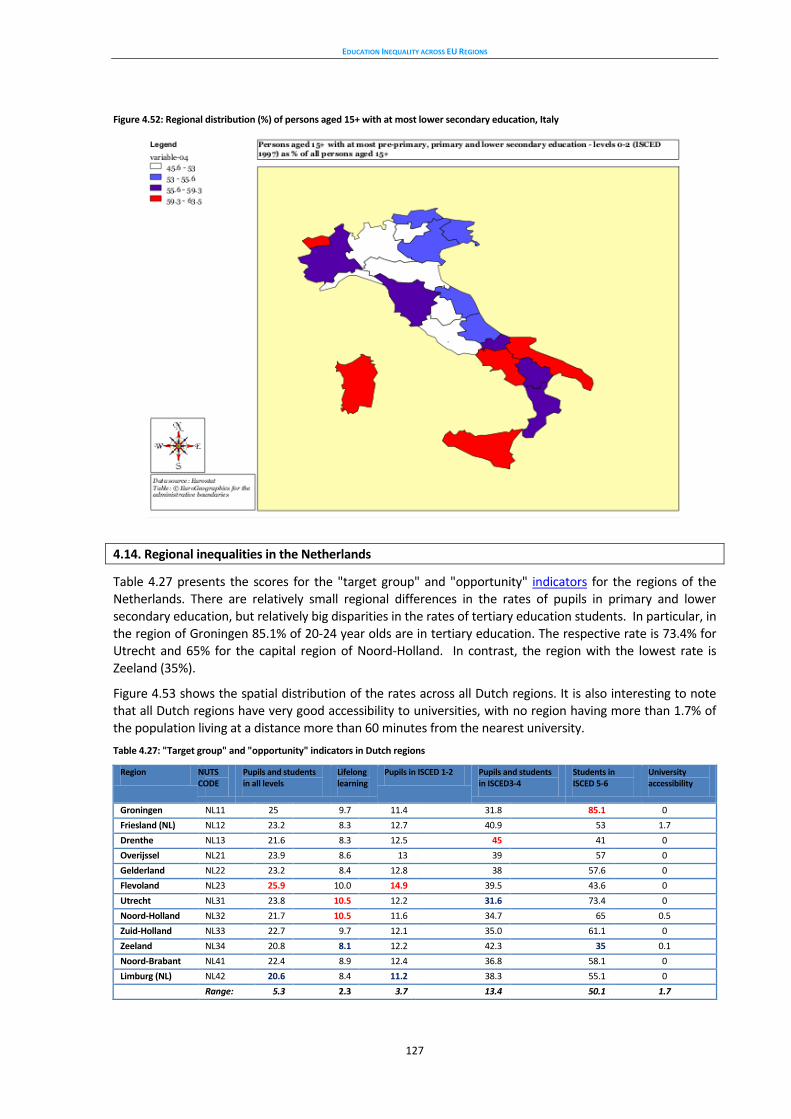
EDUCATION INEQUALITY ACROSS EU REGIONS
127
Figure 4.52: Regional distribution (%) of persons aged 15+ with at most lower secondary education, Italy
4.14. Regional inequalities in the Netherlands
Table 4.27 presents the scores for the "target group" and "opportunity" indicators for the regions of the Netherlands. There are relatively small regional differences in the rates of pupils in primary and lower secondary education, but relatively big disparities in the rates of tertiary education students. In particular, in the region of Groningen 85.1% of 20-24 year olds are in tertiary education. The respective rate is 73.4% for Utrecht and 65% for the capital region of Noord-Holland. In contrast, the region with the lowest rate is Zeeland (35%).
Figure 4.53 shows the spatial distribution of the rates across all Dutch regions. It is also interesting to note that all Dutch regions have very good accessibility to universities, with no region having more than 1.7% of the population living at a distance more than 60 minutes from the nearest university.
Table 4.27: "Target group" and "opportunity" indicators in Dutch regions
Region NUTS CODE
Pupils and students in all levels
Lifelong learning
Pupils in ISCED 1-2 Pupils and students in ISCED3-4
Students in ISCED 5-6
University accessibility
Groningen NL11 25 9.7 11.4 31.8 85.1 0
Friesland (NL) NL12 23.2 8.3 12.7 40.9 53 1.7
Drenthe NL13 21.6 8.3 12.5 45 41 0
Overijssel NL21 23.9 8.6 13 39 57 0
Gelderland NL22 23.2 8.4 12.8 38 57.6 0
Flevoland NL23 25.9 10.0 14.9 39.5 43.6 0
Utrecht NL31 23.8 10.5 12.2 31.6 73.4 0
Noord-Holland NL32 21.7 10.5 11.6 34.7 65 0.5
Zuid-Holland NL33 22.7 9.7 12.1 35.0 61.1 0
Zeeland NL34 20.8 8.1 12.2 42.3 35 0.1
Noord-Brabant NL41 22.4 8.9 12.4 36.8 58.1 0
Limburg (NL) NL42 20.6 8.4 11.2 38.3 55.1 0
Range: 5.3 2.3 3.7 13.4 50.1 1.7
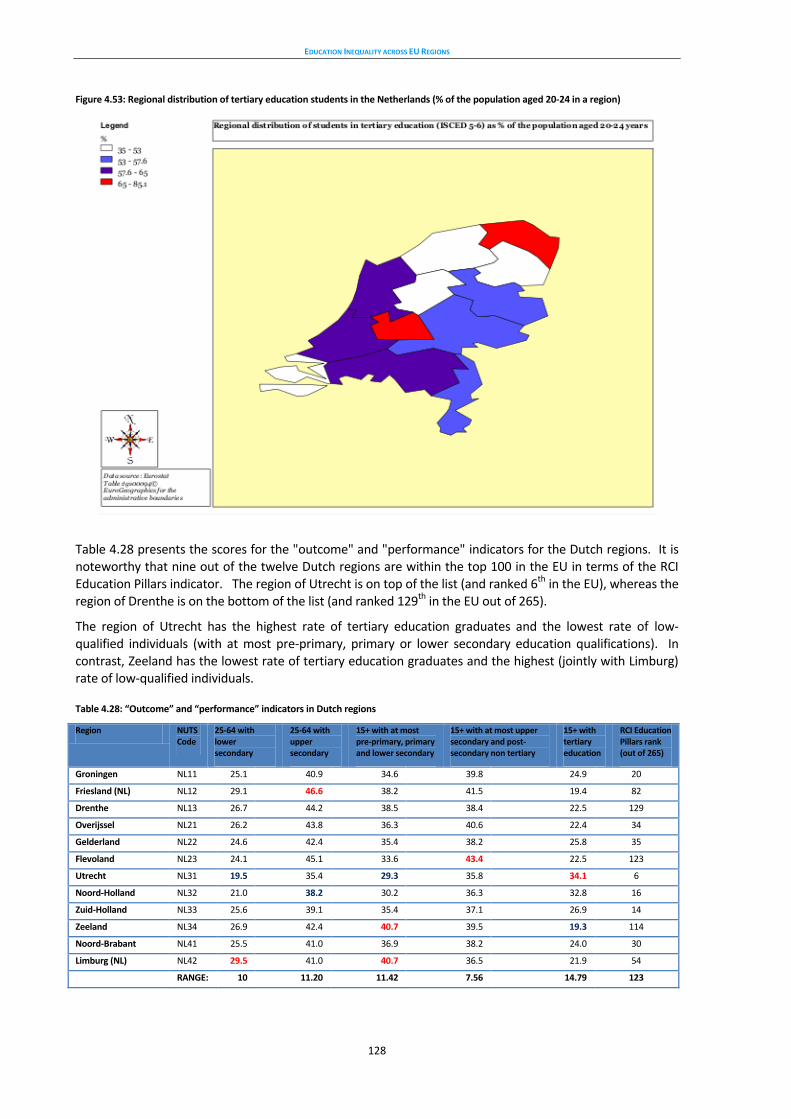
EDUCATION INEQUALITY ACROSS EU REGIONS
128
Figure 4.53: Regional distribution of tertiary education students in the Netherlands (% of the population aged 20-24 in a region)
Table 4.28 presents the scores for the "outcome" and "performance" indicators for the Dutch regions. It is noteworthy that nine out of the twelve Dutch regions are within the top 100 in the EU in terms of the RCI Education Pillars indicator. The region of Utrecht is on top of the list (and ranked 6th in the EU), whereas the region of Drenthe is on the bottom of the list (and ranked 129th in the EU out of 265).
The region of Utrecht has the highest rate of tertiary education graduates and the lowest rate of low-qualified individuals (with at most pre-primary, primary or lower secondary education qualifications). In contrast, Zeeland has the lowest rate of tertiary education graduates and the highest (jointly with Limburg) rate of low-qualified individuals.
Table 4.28: “Outcome” and “performance” indicators in Dutch regions
Region NUTS Code
25-64 with lower secondary
25-64 with upper secondary
15+ with at most pre-primary, primary and lower secondary
15+ with at most upper secondary and post-secondary non tertiary
15+ with tertiary education
RCI Education Pillars rank (out of 265)
Groningen NL11 25.1 40.9 34.6 39.8 24.9 20
Friesland (NL) NL12 29.1 46.6 38.2 41.5 19.4 82
Drenthe NL13 26.7 44.2 38.5 38.4 22.5 129
Overijssel NL21 26.2 43.8 36.3 40.6 22.4 34
Gelderland NL22 24.6 42.4 35.4 38.2 25.8 35
Flevoland NL23 24.1 45.1 33.6 43.4 22.5 123
Utrecht NL31 19.5 35.4 29.3 35.8 34.1 6
Noord-Holland NL32 21.0 38.2 30.2 36.3 32.8 16
Zuid-Holland NL33 25.6 39.1 35.4 37.1 26.9 14
Zeeland NL34 26.9 42.4 40.7 39.5 19.3 114
Noord-Brabant NL41 25.5 41.0 36.9 38.2 24.0 30
Limburg (NL) NL42 29.5 41.0 40.7 36.5 21.9 54
RANGE: 10 11.20 11.42 7.56 14.79 123

EDUCATION INEQUALITY ACROSS EU REGIONS
129
Figure 4.54 and Figure 4.55 depict the spatial distribution of these rates across all Dutch regions.
Figure 4.54: Regional distribution of tertiary education graduates in the Netherlands
Figure 4.55: Regional distribution of persons with at most lower secondary education, The Netherlands

EDUCATION INEQUALITY ACROSS EU REGIONS
130
4.15. Regional inequalities in Poland
Table 4.29 shows the scores for the "target groups" and "opportunity" indicators for Polish regions. The region with the highest rates for "pupils and students in all levels of education" (as a percentage of the total population in the region) is Masovian (Mazowieckie) where the capital Warsaw is also located. This region also has the highest percentage of tertiary education students. In contrast, the region with the lowest rate of "pupils and students in all levels of education" is Opolskie, whereas Lubuskie has the lowest rate of students in tertiary education.
Figures 4.56 and 4.57 (next page) show the spatial distribution of these rates across all Polish regions. It is also worth noting that the capital region of Mazowieckie has the highest rate of adult participation in lifelong learning (4.2%), whereas Podkarpackie has the lowest (1.5%).
Table 4.29: "Target group" and "opportunity" indicators in Polish regions
Region NUTS Code Pupils and students in all levels
Lifelong learning participation
Pupils in ISCED 1-2
Pupils and students in ISCED3-4
Students in ISCED 5-6
University accessibility
Łódzkie PL11 23 2.1 9.4 38.1 77.5 8.7
Mazowieckie PL12 26 4.2 9.7 35.9 100 2.8
Małopolskie PL21 25.8 2.2 10.6 36.8 81.7 7.4
Śląskie PL22 21.5 2.4 9.2 36.9 54.3 0.1
Lubelskie PL31 23.9 2.8 10.6 35.5 60.9 6.3
Podkarpackie PL32 23.1 1.5 11.2 35.2 42.1 6.1
Świętokrzyskie PL33 22.9 2.3 10.2 37.8 58.1 2.7
Podlaskie PL34 23.6 2.4 10.5 37 55 21
Wielkopolskie PL41 25.3 2.0 10.7 38.4 68.8 28.3
Zachodniopomorskie PL42 22.8 2.7 10.1 34.5 60.9 14.8
Lubuskie PL43 21.5 2.3 10.3 35.1 35.6 21.5
Dolnośląskie PL51 23.1 2.8 9.2 35 78.1 4.3
Opolskie PL52 21.1 2.6 9.3 33.8 47.4 4.9
Kujawsko-Pomorskie PL61 23.1 2.2 10.6 37.9 51.2 7
Warmińsko-Mazurskie
PL62 23.6 2.4 11.1 35.5 46.7 40
Pomorskie PL63 23.7 2.1 10.6 37.3 58.3 12.9
Range: 4.9 2.7 2 4.6 64.4 39.9
Figure 4.56: Regional distribution of pupils and students in all levels of education, Poland (as % of the total population in a region)
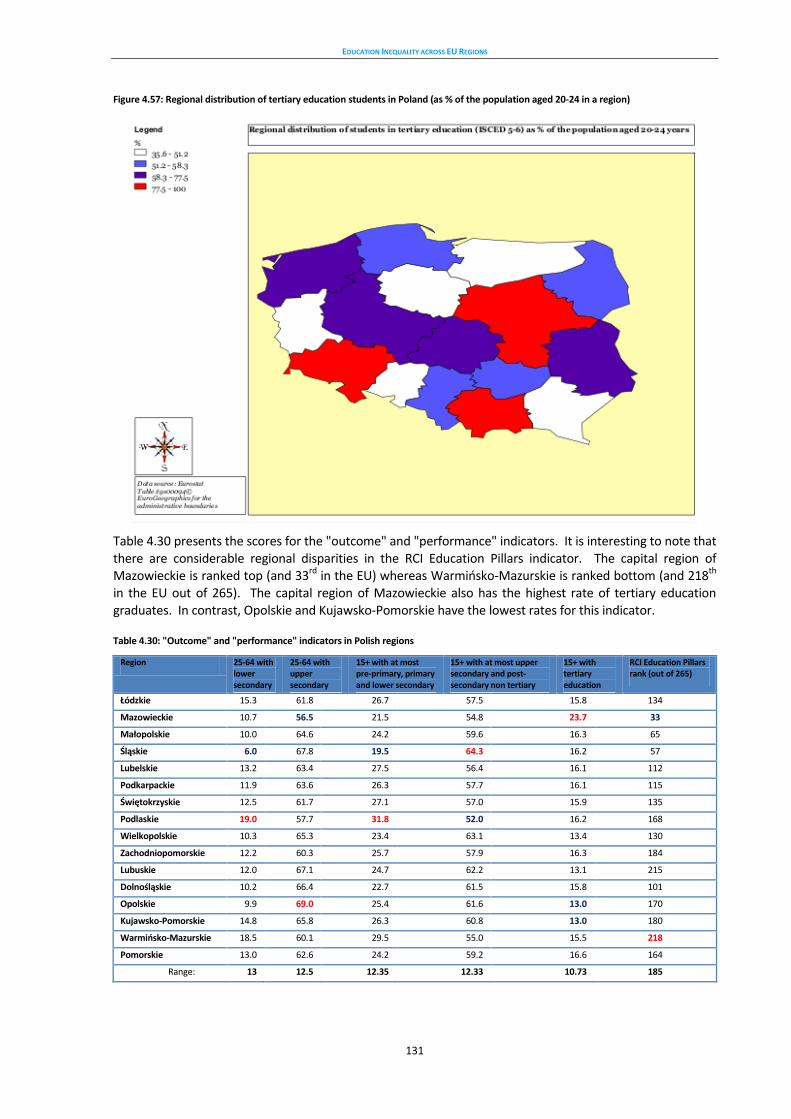
EDUCATION INEQUALITY ACROSS EU REGIONS
131
Figure 4.57: Regional distribution of tertiary education students in Poland (as % of the population aged 20-24 in a region)
Table 4.30 presents the scores for the "outcome" and "performance" indicators. It is interesting to note that there are considerable regional disparities in the RCI Education Pillars indicator. The capital region of Mazowieckie is ranked top (and 33rd in the EU) whereas Warmińsko-Mazurskie is ranked bottom (and 218th in the EU out of 265). The capital region of Mazowieckie also has the highest rate of tertiary education graduates. In contrast, Opolskie and Kujawsko-Pomorskie have the lowest rates for this indicator.
Table 4.30: "Outcome" and "performance" indicators in Polish regions
Region 25-64 with lower secondary
25-64 with upper secondary
15+ with at most pre-primary, primary and lower secondary
15+ with at most upper secondary and post-secondary non tertiary
15+ with tertiary education
RCI Education Pillars rank (out of 265)
Łódzkie 15.3 61.8 26.7 57.5 15.8 134
Mazowieckie 10.7 56.5 21.5 54.8 23.7 33
Małopolskie 10.0 64.6 24.2 59.6 16.3 65
Śląskie 6.0 67.8 19.5 64.3 16.2 57
Lubelskie 13.2 63.4 27.5 56.4 16.1 112
Podkarpackie 11.9 63.6 26.3 57.7 16.1 115
Świętokrzyskie 12.5 61.7 27.1 57.0 15.9 135
Podlaskie 19.0 57.7 31.8 52.0 16.2 168
Wielkopolskie 10.3 65.3 23.4 63.1 13.4 130
Zachodniopomorskie 12.2 60.3 25.7 57.9 16.3 184
Lubuskie 12.0 67.1 24.7 62.2 13.1 215
Dolnośląskie 10.2 66.4 22.7 61.5 15.8 101
Opolskie 9.9 69.0 25.4 61.6 13.0 170
Kujawsko-Pomorskie 14.8 65.8 26.3 60.8 13.0 180
Warmińsko-Mazurskie 18.5 60.1 29.5 55.0 15.5 218
Pomorskie 13.0 62.6 24.2 59.2 16.6 164
Range: 13 12.5 12.35 12.33 10.73 185

EDUCATION INEQUALITY ACROSS EU REGIONS
132
Figures 4.58 and 4.59 show the spatial distribution across Polish regions. Podlaskie has the highest rate of people with low qualifications (with at most pre-primary, primary and lower secondary education attainment), whereas Śląskie has the lowest rate.
Figure 4.58: Regional distribution of tertiary education graduates, Poland (as % of the population aged 15+ in a region)
Figure 4.59: Regional distribution of persons with at most pre-primary, primary and lower secondary education, Poland
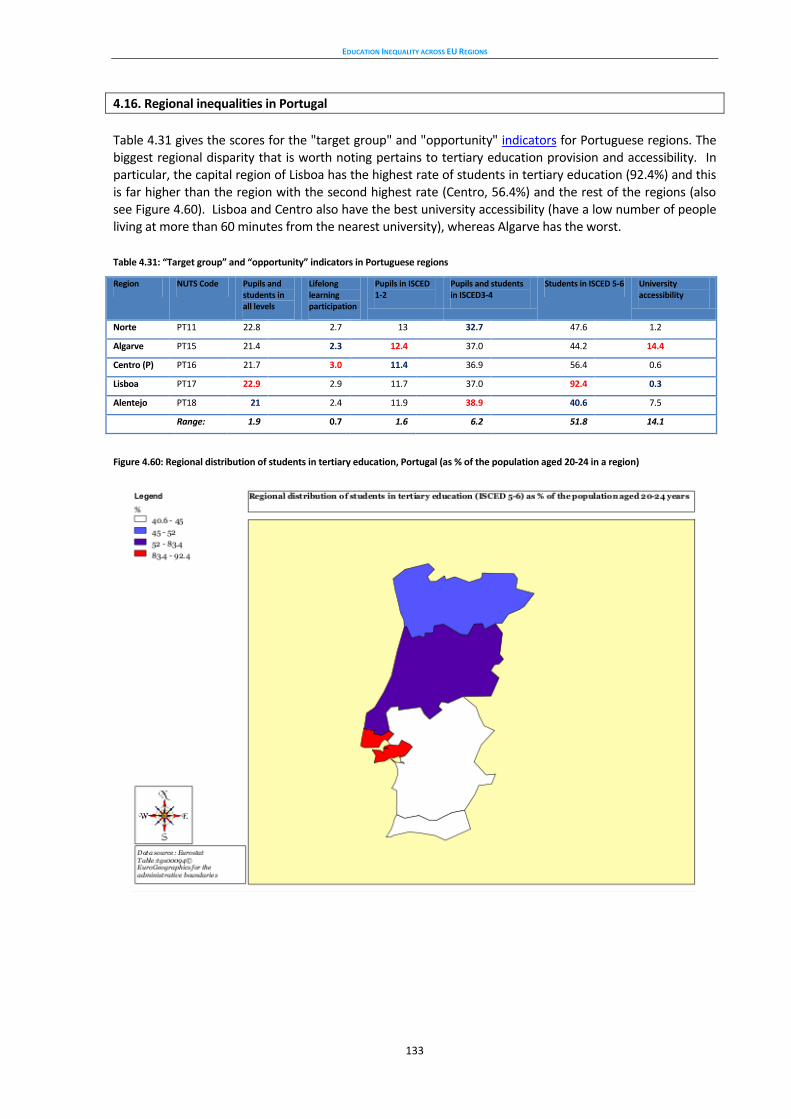
EDUCATION INEQUALITY ACROSS EU REGIONS
133
4.16. Regional inequalities in Portugal
Table 4.31 gives the scores for the "target group" and "opportunity" indicators for Portuguese regions. The biggest regional disparity that is worth noting pertains to tertiary education provision and accessibility. In particular, the capital region of Lisboa has the highest rate of students in tertiary education (92.4%) and this is far higher than the region with the second highest rate (Centro, 56.4%) and the rest of the regions (also see Figure 4.60). Lisboa and Centro also have the best university accessibility (have a low number of people living at more than 60 minutes from the nearest university), whereas Algarve has the worst.
Table 4.31: “Target group” and “opportunity” indicators in Portuguese regions
Region NUTS Code Pupils and students in all levels
Lifelong learning participation
Pupils in ISCED 1-2
Pupils and students in ISCED3-4
Students in ISCED 5-6 University accessibility
Norte PT11 22.8 2.7 13 32.7 47.6 1.2
Algarve PT15 21.4 2.3 12.4 37.0 44.2 14.4
Centro (P) PT16 21.7 3.0 11.4 36.9 56.4 0.6
Lisboa PT17 22.9 2.9 11.7 37.0 92.4 0.3
Alentejo PT18 21 2.4 11.9 38.9 40.6 7.5
Range: 1.9 0.7 1.6 6.2 51.8 14.1
Figure 4.60: Regional distribution of students in tertiary education, Portugal (as % of the population aged 20-24 in a region)
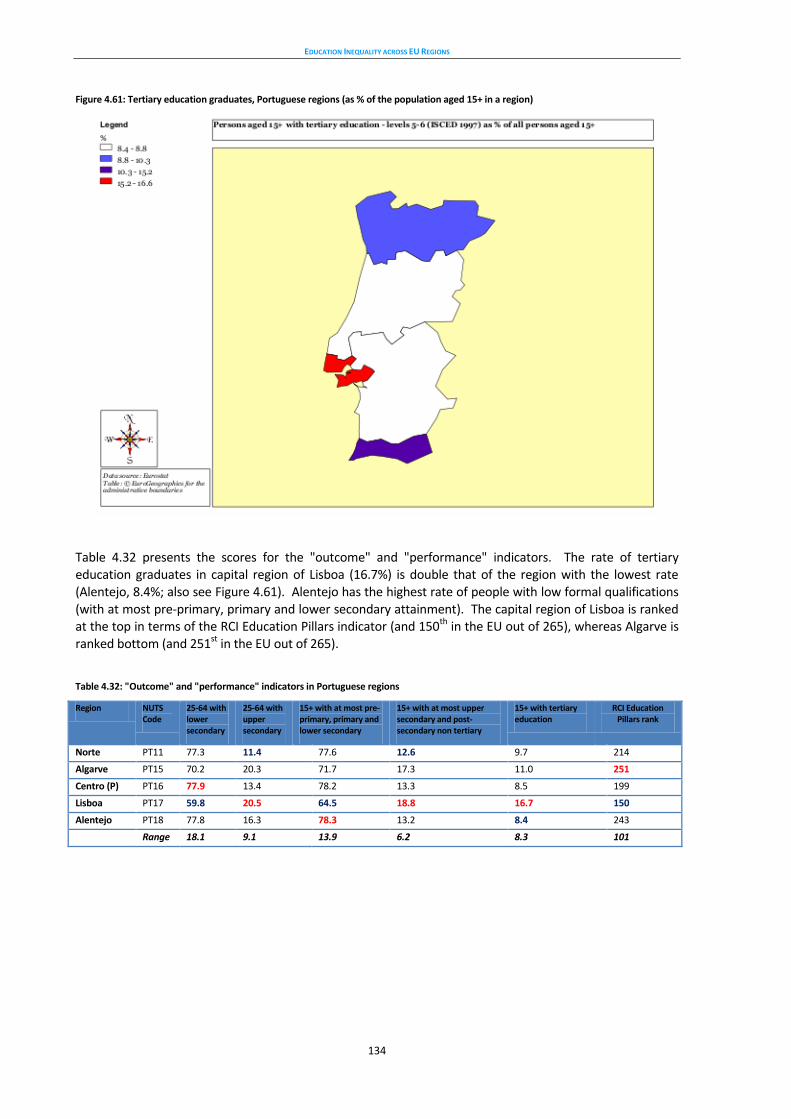
EDUCATION INEQUALITY ACROSS EU REGIONS
134
Figure 4.61: Tertiary education graduates, Portuguese regions (as % of the population aged 15+ in a region)
Table 4.32 presents the scores for the "outcome" and "performance" indicators. The rate of tertiary education graduates in capital region of Lisboa (16.7%) is double that of the region with the lowest rate (Alentejo, 8.4%; also see Figure 4.61). Alentejo has the highest rate of people with low formal qualifications (with at most pre-primary, primary and lower secondary attainment). The capital region of Lisboa is ranked at the top in terms of the RCI Education Pillars indicator (and 150th in the EU out of 265), whereas Algarve is ranked bottom (and 251st in the EU out of 265).
Table 4.32: "Outcome" and "performance" indicators in Portuguese regions
Region NUTS Code
25-64 with lower secondary
25-64 with upper secondary
15+ with at most pre-primary, primary and lower secondary
15+ with at most upper secondary and post-secondary non tertiary
15+ with tertiary education
RCI Education Pillars rank
Norte PT11 77.3 11.4 77.6 12.6 9.7 214
Algarve PT15 70.2 20.3 71.7 17.3 11.0 251
Centro (P) PT16 77.9 13.4 78.2 13.3 8.5 199
Lisboa PT17 59.8 20.5 64.5 18.8 16.7 150
Alentejo PT18 77.8 16.3 78.3 13.2 8.4 243
Range:
18.1 9.1 13.9 6.2 8.3 101
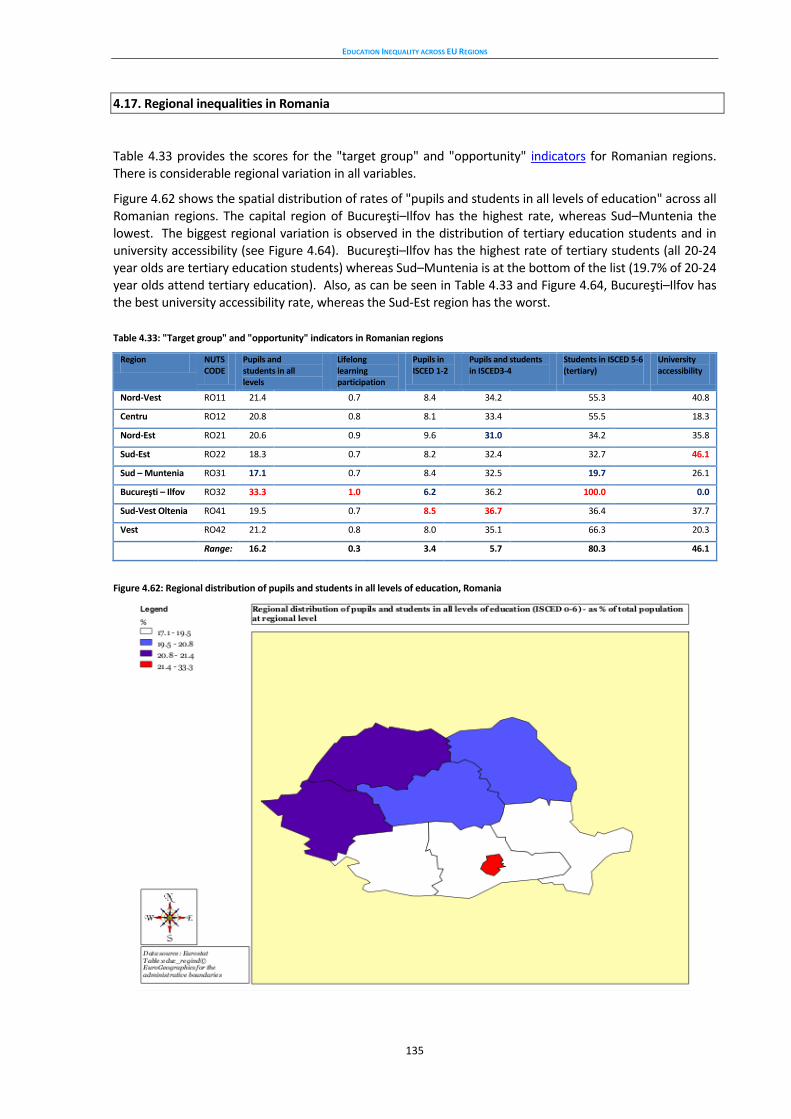
EDUCATION INEQUALITY ACROSS EU REGIONS
135
4.17. Regional inequalities in Romania
Table 4.33 provides the scores for the "target group" and "opportunity" indicators for Romanian regions. There is considerable regional variation in all variables.
Figure 4.62 shows the spatial distribution of rates of "pupils and students in all levels of education" across all Romanian regions. The capital region of Bucureşti–Ilfov has the highest rate, whereas Sud–Muntenia the lowest. The biggest regional variation is observed in the distribution of tertiary education students and in university accessibility (see Figure 4.64). Bucureşti–Ilfov has the highest rate of tertiary students (all 20-24 year olds are tertiary education students) whereas Sud–Muntenia is at the bottom of the list (19.7% of 20-24 year olds attend tertiary education). Also, as can be seen in Table 4.33 and Figure 4.64, Bucureşti–Ilfov has the best university accessibility rate, whereas the Sud-Est region has the worst.
Table 4.33: "Target group" and "opportunity" indicators in Romanian regions
Region NUTS CODE
Pupils and students in all levels
Lifelong learning participation
Pupils in ISCED 1-2
Pupils and students in ISCED3-4
Students in ISCED 5-6 (tertiary)
University accessibility
Nord-Vest RO11 21.4 0.7 8.4 34.2 55.3 40.8
Centru RO12 20.8 0.8 8.1 33.4 55.5 18.3
Nord-Est RO21 20.6 0.9 9.6 31.0 34.2 35.8
Sud-Est RO22 18.3 0.7 8.2 32.4 32.7 46.1
Sud – Muntenia RO31 17.1 0.7 8.4 32.5 19.7 26.1
Bucureşti – Ilfov RO32 33.3 1.0 6.2 36.2 100.0 0.0
Sud-Vest Oltenia RO41 19.5 0.7 8.5 36.7 36.4 37.7
Vest RO42 21.2 0.8 8.0 35.1 66.3 20.3
Range: 16.2 0.3 3.4 5.7 80.3 46.1
Figure 4.62: Regional distribution of pupils and students in all levels of education, Romania
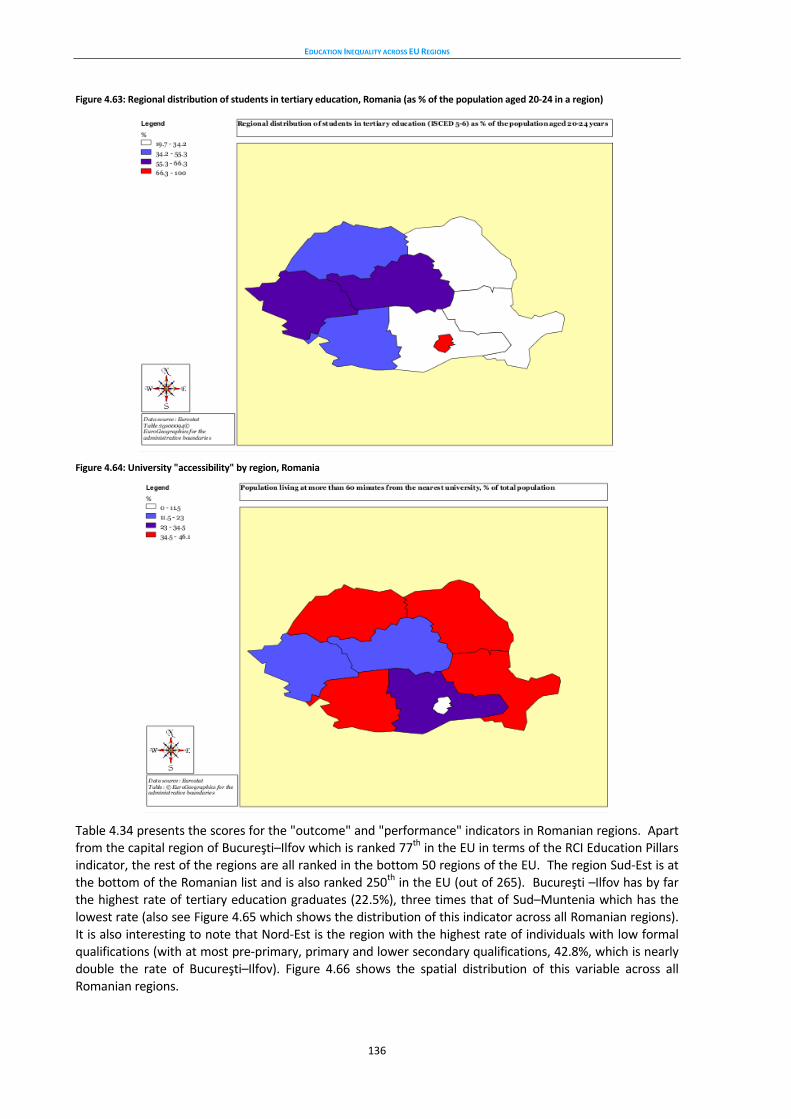
EDUCATION INEQUALITY ACROSS EU REGIONS
136
Figure 4.63: Regional distribution of students in tertiary education, Romania (as % of the population aged 20-24 in a region)
Figure 4.64: University "accessibility" by region, Romania
Table 4.34 presents the scores for the "outcome" and "performance" indicators in Romanian regions. Apart from the capital region of Bucureşti–Ilfov which is ranked 77th in the EU in terms of the RCI Education Pillars indicator, the rest of the regions are all ranked in the bottom 50 regions of the EU. The region Sud-Est is at the bottom of the Romanian list and is also ranked 250th in the EU (out of 265). Bucureşti –Ilfov has by far the highest rate of tertiary education graduates (22.5%), three times that of Sud–Muntenia which has the lowest rate (also see Figure 4.65 which shows the distribution of this indicator across all Romanian regions). It is also interesting to note that Nord-Est is the region with the highest rate of individuals with low formal qualifications (with at most pre-primary, primary and lower secondary qualifications, 42.8%, which is nearly double the rate of Bucureşti–Ilfov). Figure 4.66 shows the spatial distribution of this variable across all Romanian regions.
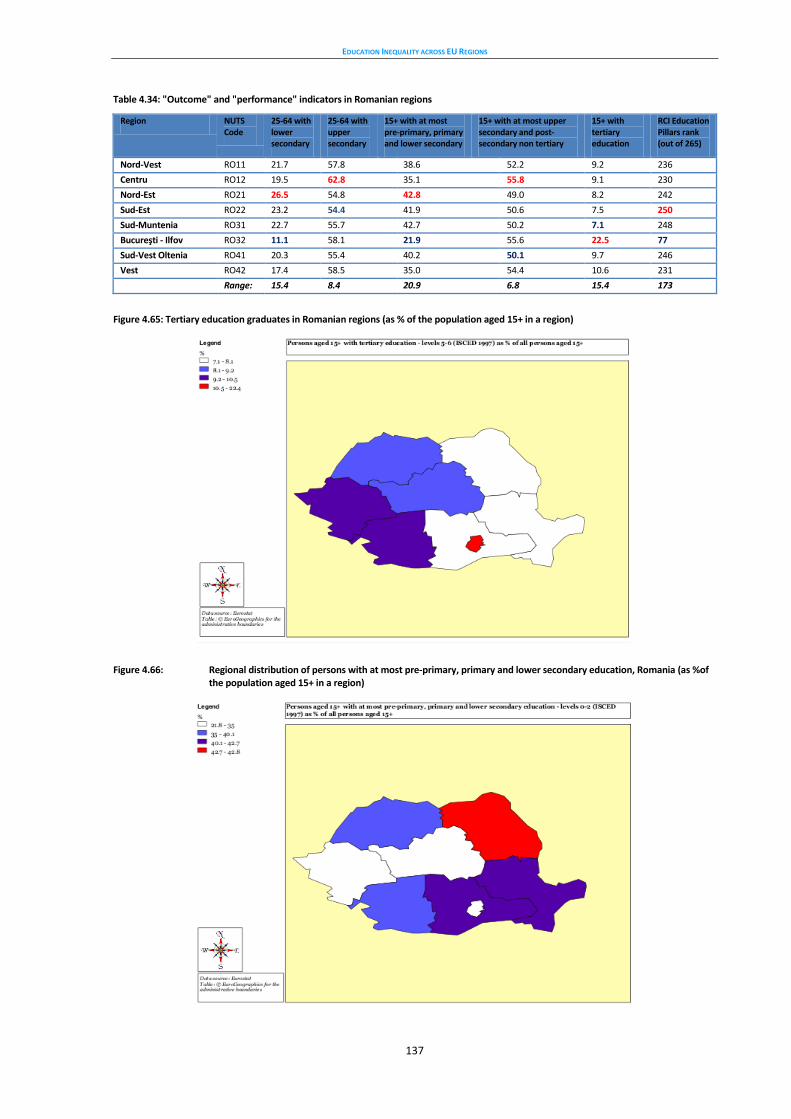
EDUCATION INEQUALITY ACROSS EU REGIONS
137
Table 4.34: "Outcome" and "performance" indicators in Romanian regions
Region NUTS Code
25-64 with lower secondary
25-64 with upper secondary
15+ with at most pre-primary, primary and lower secondary
15+ with at most upper secondary and post-secondary non tertiary
15+ with tertiary education
RCI Education Pillars rank (out of 265)
Nord-Vest RO11 21.7 57.8 38.6 52.2 9.2 236
Centru RO12 19.5 62.8 35.1 55.8 9.1 230
Nord-Est RO21 26.5 54.8 42.8 49.0 8.2 242
Sud-Est RO22 23.2 54.4 41.9 50.6 7.5 250
Sud-Muntenia RO31 22.7 55.7 42.7 50.2 7.1 248
Bucureşti - Ilfov RO32 11.1 58.1 21.9 55.6 22.5 77
Sud-Vest Oltenia RO41 20.3 55.4 40.2 50.1 9.7 246
Vest RO42 17.4 58.5 35.0 54.4 10.6 231
Range: 15.4 8.4 20.9 6.8 15.4 173
Figure 4.65: Tertiary education graduates in Romanian regions (as % of the population aged 15+ in a region)
Figure 4.66: Regional distribution of persons with at most pre-primary, primary and lower secondary education, Romania (as %of the population aged 15+ in a region)
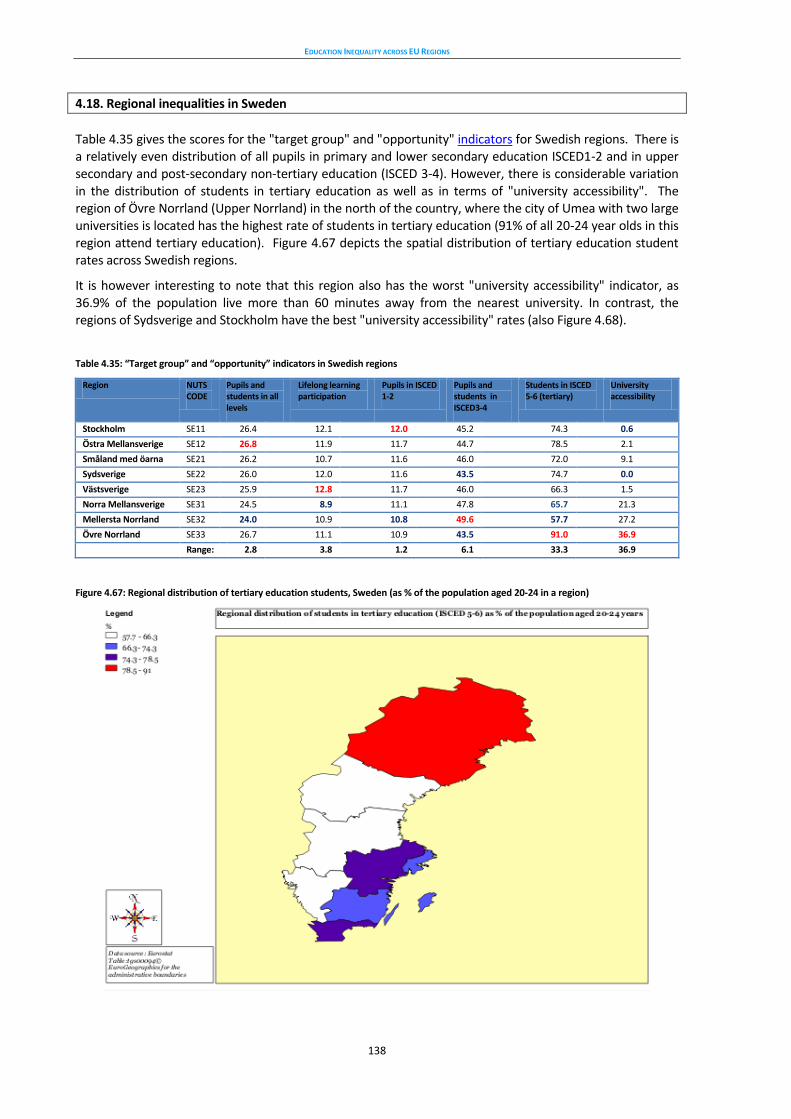
EDUCATION INEQUALITY ACROSS EU REGIONS
138
4.18. Regional inequalities in Sweden
Table 4.35 gives the scores for the "target group" and "opportunity" indicators for Swedish regions. There is a relatively even distribution of all pupils in primary and lower secondary education ISCED1-2 and in upper secondary and post-secondary non-tertiary education (ISCED 3-4). However, there is considerable variation in the distribution of students in tertiary education as well as in terms of "university accessibility". The region of Övre Norrland (Upper Norrland) in the north of the country, where the city of Umea with two large universities is located has the highest rate of students in tertiary education (91% of all 20-24 year olds in this region attend tertiary education). Figure 4.67 depicts the spatial distribution of tertiary education student rates across Swedish regions.
It is however interesting to note that this region also has the worst "university accessibility" indicator, as 36.9% of the population live more than 60 minutes away from the nearest university. In contrast, the regions of Sydsverige and Stockholm have the best "university accessibility" rates (also Figure 4.68).
Table 4.35: “Target group” and “opportunity” indicators in Swedish regions
Region NUTS CODE
Pupils and students in all levels
Lifelong learning participation
Pupils in ISCED 1-2
Pupils and students in ISCED3-4
Students in ISCED 5-6 (tertiary)
University accessibility
Stockholm SE11 26.4 12.1 12.0 45.2 74.3 0.6
Östra Mellansverige SE12 26.8 11.9 11.7 44.7 78.5 2.1
Småland med öarna SE21 26.2 10.7 11.6 46.0 72.0 9.1
Sydsverige SE22 26.0 12.0 11.6 43.5 74.7 0.0
Västsverige SE23 25.9 12.8 11.7 46.0 66.3 1.5
Norra Mellansverige SE31 24.5 8.9 11.1 47.8 65.7 21.3
Mellersta Norrland SE32 24.0 10.9 10.8 49.6 57.7 27.2
Övre Norrland SE33 26.7 11.1 10.9 43.5 91.0 36.9
Range: 2.8 3.8 1.2 6.1 33.3 36.9
Figure 4.67: Regional distribution of tertiary education students, Sweden (as % of the population aged 20-24 in a region)
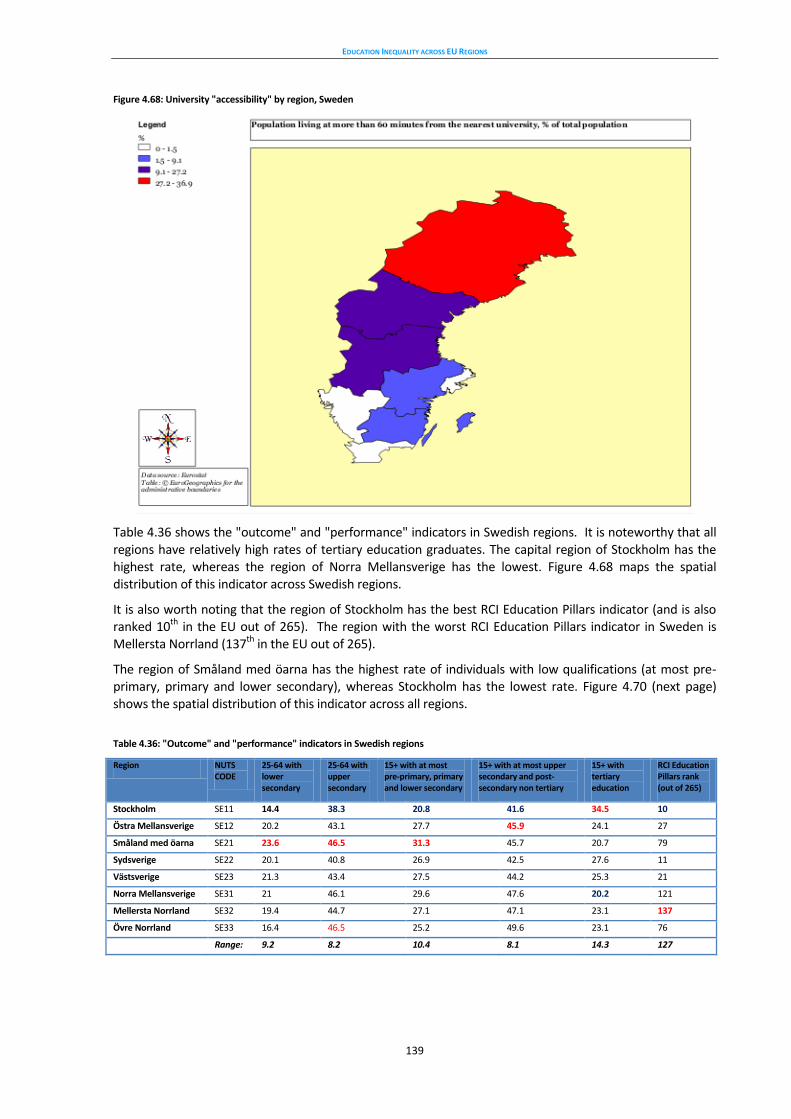
EDUCATION INEQUALITY ACROSS EU REGIONS
139
Figure 4.68: University "accessibility" by region, Sweden
Table 4.36 shows the "outcome" and "performance" indicators in Swedish regions. It is noteworthy that all regions have relatively high rates of tertiary education graduates. The capital region of Stockholm has the highest rate, whereas the region of Norra Mellansverige has the lowest. Figure 4.68 maps the spatial distribution of this indicator across Swedish regions.
It is also worth noting that the region of Stockholm has the best RCI Education Pillars indicator (and is also ranked 10th in the EU out of 265). The region with the worst RCI Education Pillars indicator in Sweden is Mellersta Norrland (137th in the EU out of 265).
The region of Småland med öarna has the highest rate of individuals with low qualifications (at most pre-primary, primary and lower secondary), whereas Stockholm has the lowest rate. Figure 4.70 (next page) shows the spatial distribution of this indicator across all regions.
Table 4.36: "Outcome" and "performance" indicators in Swedish regions
Region NUTS CODE
25-64 with lower secondary
25-64 with upper secondary
15+ with at most pre-primary, primary and lower secondary
15+ with at most upper secondary and post-secondary non tertiary
15+ with tertiary education
RCI Education Pillars rank (out of 265)
Stockholm SE11 14.4 38.3 20.8 41.6 34.5 10
Östra Mellansverige SE12 20.2 43.1 27.7 45.9 24.1 27
Småland med öarna SE21 23.6 46.5 31.3 45.7 20.7 79
Sydsverige SE22 20.1 40.8 26.9 42.5 27.6 11
Västsverige SE23 21.3 43.4 27.5 44.2 25.3 21
Norra Mellansverige SE31 21 46.1 29.6 47.6 20.2 121
Mellersta Norrland SE32 19.4 44.7 27.1 47.1 23.1 137
Övre Norrland SE33 16.4 46.5 25.2 49.6 23.1 76
Range: 9.2 8.2 10.4 8.1 14.3 127
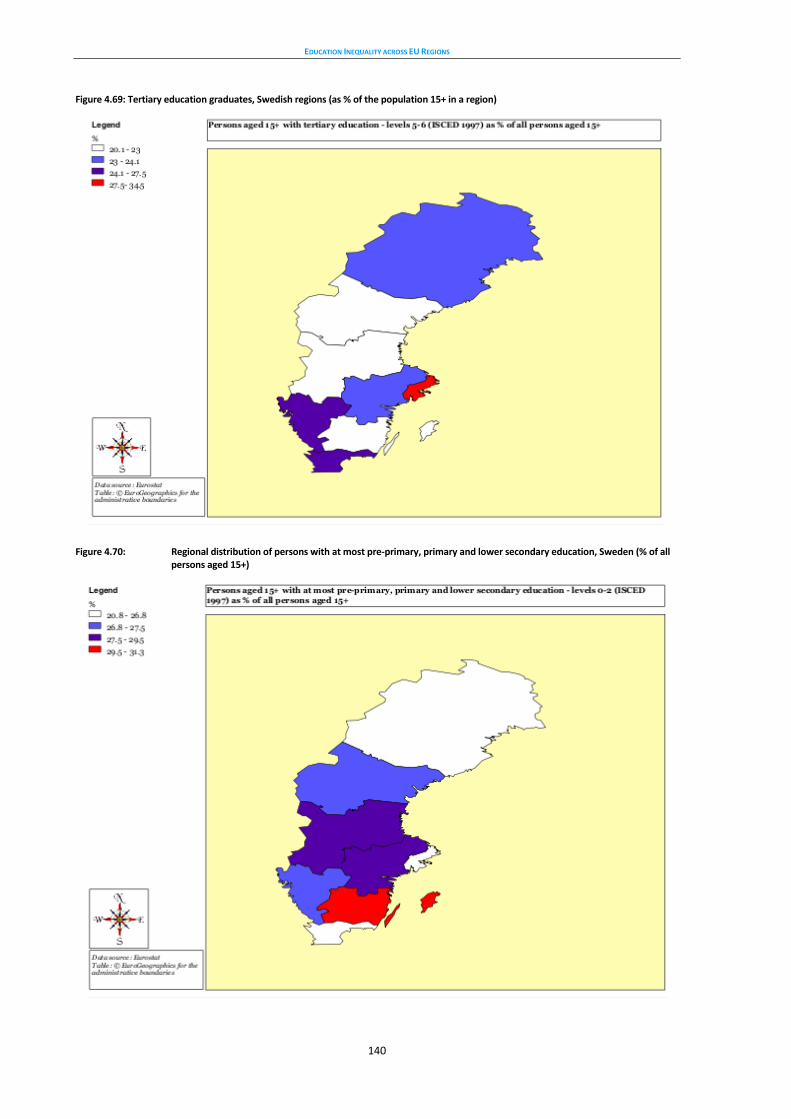
EDUCATION INEQUALITY ACROSS EU REGIONS
140
Figure 4.69: Tertiary education graduates, Swedish regions (as % of the population 15+ in a region)
Figure 4.70: Regional distribution of persons with at most pre-primary, primary and lower secondary education, Sweden (% of all persons aged 15+)
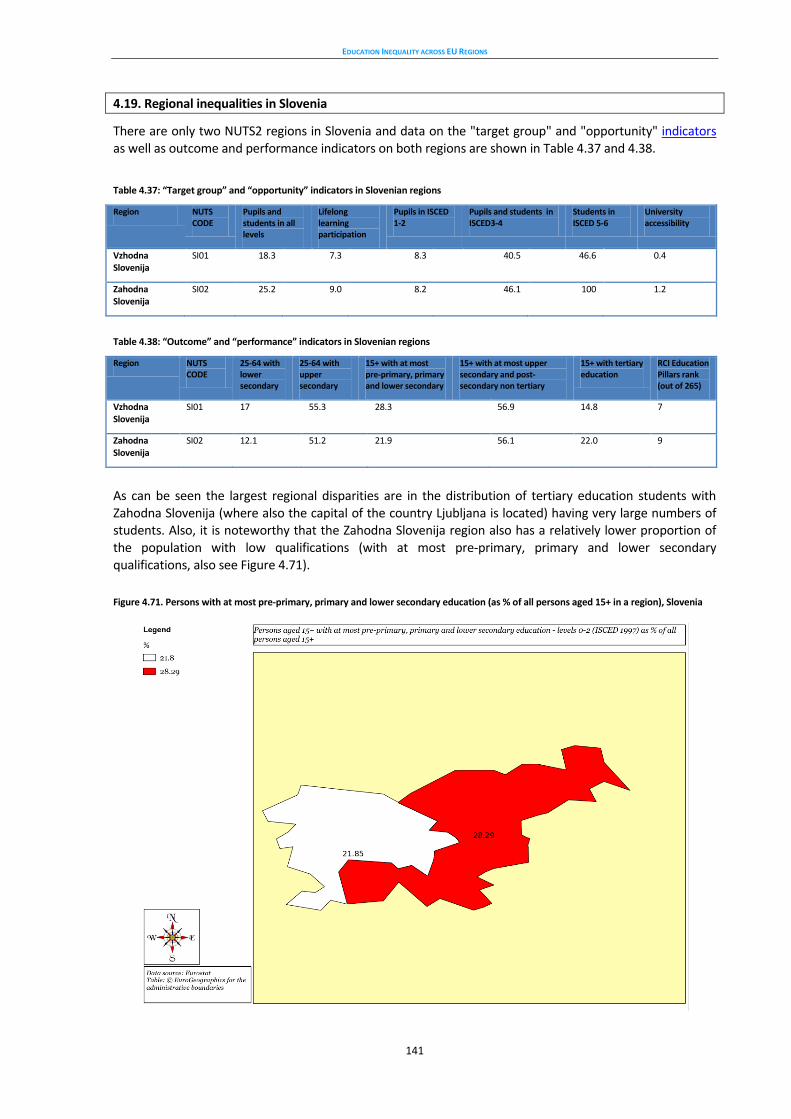
EDUCATION INEQUALITY ACROSS EU REGIONS
141
4.19. Regional inequalities in Slovenia
There are only two NUTS2 regions in Slovenia and data on the "target group" and "opportunity" indicators as well as outcome and performance indicators on both regions are shown in Table 4.37 and 4.38.
Table 4.37: “Target group” and “opportunity” indicators in Slovenian regions
Region NUTS CODE
Pupils and students in all levels
Lifelong learning participation
Pupils in ISCED 1-2
Pupils and students in ISCED3-4
Students in ISCED 5-6
University accessibility
Vzhodna Slovenija
SI01 18.3 7.3 8.3 40.5 46.6 0.4
Zahodna Slovenija
SI02 25.2 9.0 8.2 46.1 100 1.2
Table 4.38: “Outcome” and “performance” indicators in Slovenian regions
Region NUTS CODE
25-64 with lower secondary
25-64 with upper secondary
15+ with at most pre-primary, primary and lower secondary
15+ with at most upper secondary and post-secondary non tertiary
15+ with tertiary education
RCI Education Pillars rank (out of 265)
Vzhodna Slovenija
SI01 17 55.3 28.3 56.9 14.8 7
Zahodna Slovenija
SI02 12.1 51.2 21.9 56.1 22.0 9
As can be seen the largest regional disparities are in the distribution of tertiary education students with Zahodna Slovenija (where also the capital of the country Ljubljana is located) having very large numbers of students. Also, it is noteworthy that the Zahodna Slovenija region also has a relatively lower proportion of the population with low qualifications (with at most pre-primary, primary and lower secondary qualifications, also see Figure 4.71).
Figure 4.71. Persons with at most pre-primary, primary and lower secondary education (as % of all persons aged 15+ in a region), Slovenia
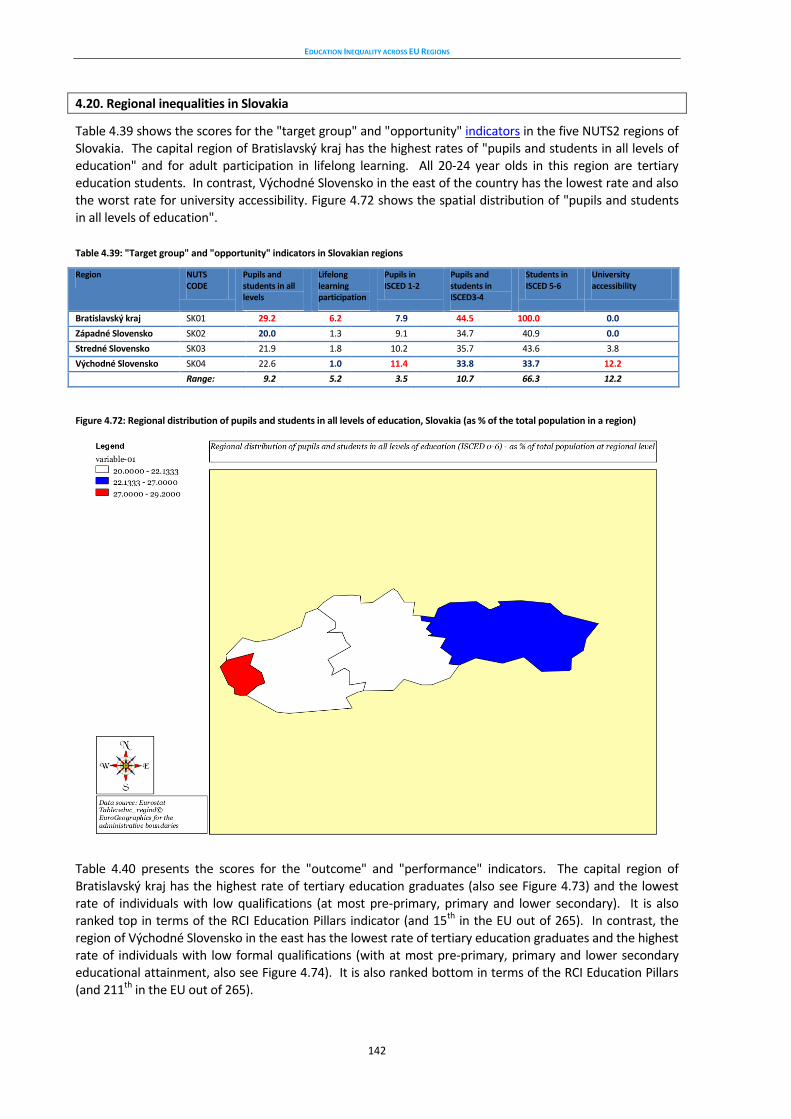
EDUCATION INEQUALITY ACROSS EU REGIONS
142
4.20. Regional inequalities in Slovakia
Table 4.39 shows the scores for the "target group" and "opportunity" indicators in the five NUTS2 regions of Slovakia. The capital region of Bratislavský kraj has the highest rates of "pupils and students in all levels of education" and for adult participation in lifelong learning. All 20-24 year olds in this region are tertiary education students. In contrast, Východné Slovensko in the east of the country has the lowest rate and also the worst rate for university accessibility. Figure 4.72 shows the spatial distribution of "pupils and students in all levels of education".
Table 4.39: "Target group" and "opportunity" indicators in Slovakian regions
Region NUTS CODE
Pupils and students in all levels
Lifelong learning participation
Pupils in ISCED 1-2
Pupils and students in ISCED3-4
Students in ISCED 5-6
University accessibility
Bratislavský kraj SK01 29.2 6.2 7.9 44.5 100.0 0.0
Západné Slovensko SK02 20.0 1.3 9.1 34.7 40.9 0.0
Stredné Slovensko SK03 21.9 1.8 10.2 35.7 43.6 3.8
Východné Slovensko SK04 22.6 1.0 11.4 33.8 33.7 12.2
Range: 9.2 5.2 3.5 10.7 66.3 12.2
Figure 4.72: Regional distribution of pupils and students in all levels of education, Slovakia (as % of the total population in a region)
Table 4.40 presents the scores for the "outcome" and "performance" indicators. The capital region of Bratislavský kraj has the highest rate of tertiary education graduates (also see Figure 4.73) and the lowest rate of individuals with low qualifications (at most pre-primary, primary and lower secondary). It is also ranked top in terms of the RCI Education Pillars indicator (and 15th in the EU out of 265). In contrast, the region of Východné Slovensko in the east has the lowest rate of tertiary education graduates and the highest rate of individuals with low formal qualifications (with at most pre-primary, primary and lower secondary educational attainment, also see Figure 4.74). It is also ranked bottom in terms of the RCI Education Pillars (and 211th in the EU out of 265).
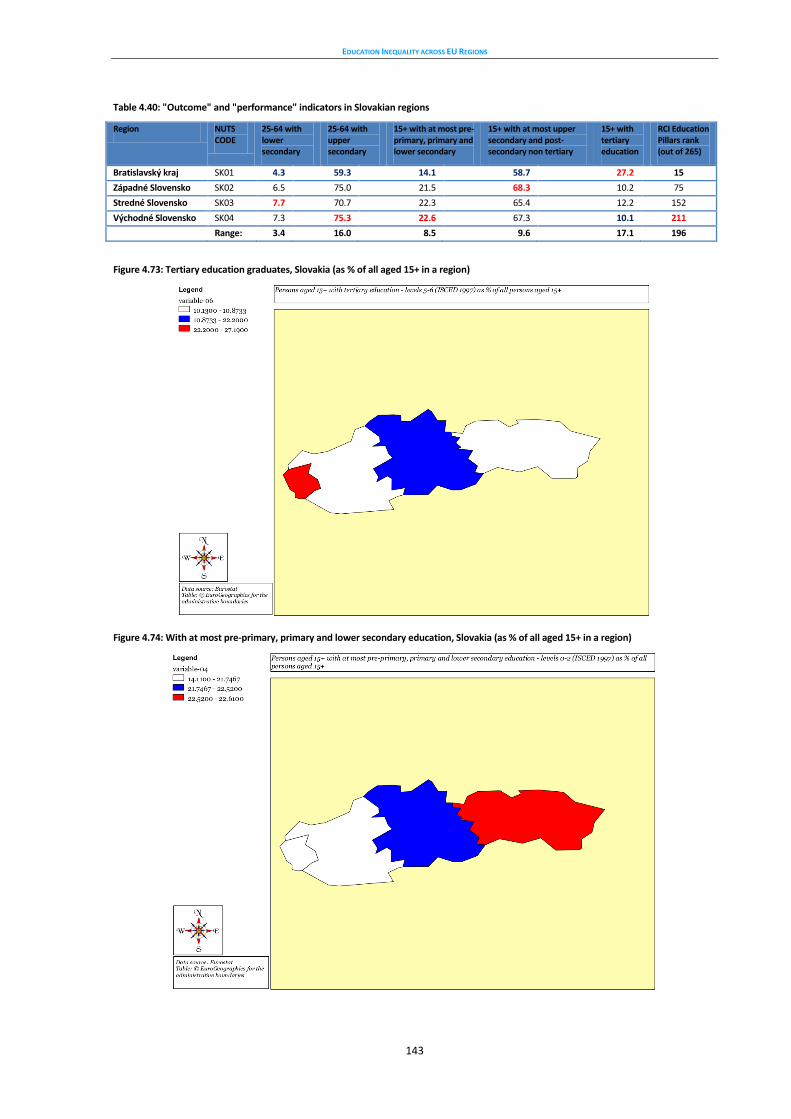
EDUCATION INEQUALITY ACROSS EU REGIONS
143
Table 4.40: "Outcome" and "performance" indicators in Slovakian regions
Region NUTS CODE
25-64 with lower secondary
25-64 with upper secondary
15+ with at most pre-primary, primary and lower secondary
15+ with at most upper secondary and post-secondary non tertiary
15+ with tertiary education
RCI Education Pillars rank (out of 265)
Bratislavský kraj SK01 4.3 59.3 14.1 58.7 27.2 15
Západné Slovensko SK02 6.5 75.0 21.5 68.3 10.2 75
Stredné Slovensko SK03 7.7 70.7 22.3 65.4 12.2 152
Východné Slovensko SK04 7.3 75.3 22.6 67.3 10.1 211
Range: 3.4 16.0 8.5 9.6 17.1 196
Figure 4.73: Tertiary education graduates, Slovakia (as % of all aged 15+ in a region)
Figure 4.74: With at most pre-primary, primary and lower secondary education, Slovakia (as % of all aged 15+ in a region)
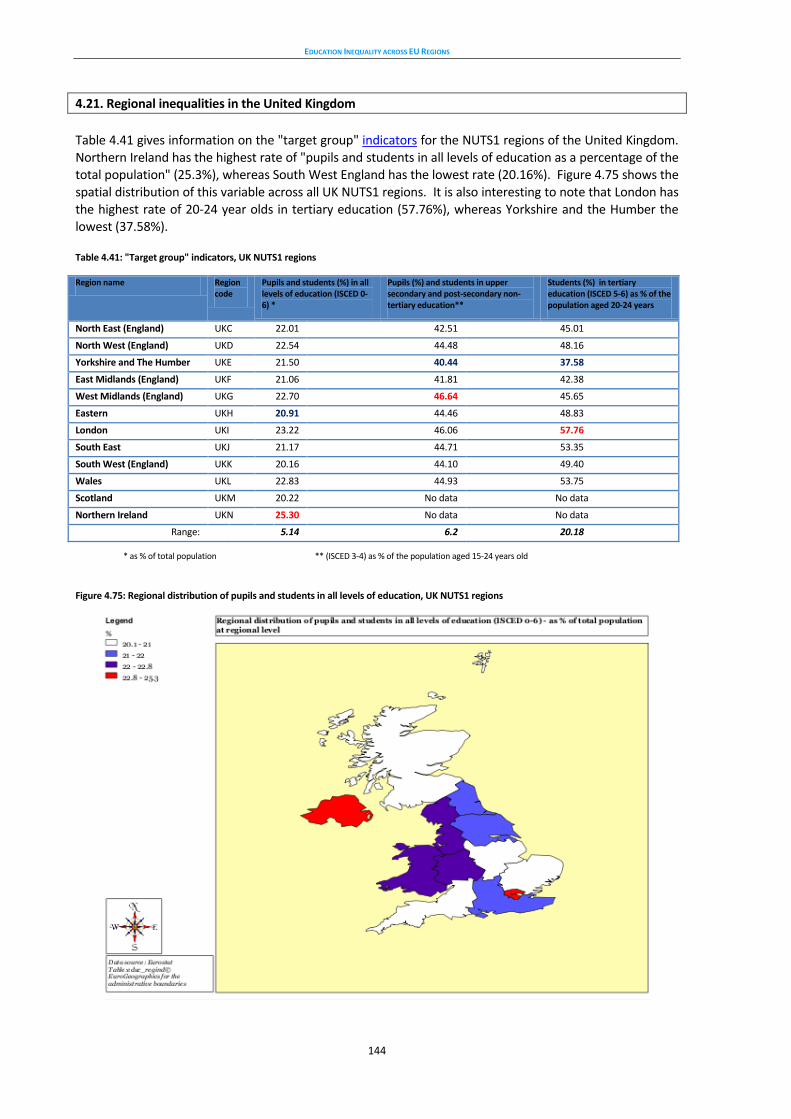
EDUCATION INEQUALITY ACROSS EU REGIONS
144
4.21. Regional inequalities in the United Kingdom
Table 4.41 gives information on the "target group" indicators for the NUTS1 regions of the United Kingdom. Northern Ireland has the highest rate of "pupils and students in all levels of education as a percentage of the total population" (25.3%), whereas South West England has the lowest rate (20.16%). Figure 4.75 shows the spatial distribution of this variable across all UK NUTS1 regions. It is also interesting to note that London has the highest rate of 20-24 year olds in tertiary education (57.76%), whereas Yorkshire and the Humber the lowest (37.58%). Table 4.41: "Target group" indicators, UK NUTS1 regions
Region name Region code
Pupils and students (%) in all levels of education (ISCED 0-6) *
Pupils (%) and students in upper secondary and post-secondary non-tertiary education**
Students (%) in tertiary education (ISCED 5-6) as % of the population aged 20-24 years
North East (England) UKC 22.01 42.51 45.01
North West (England) UKD 22.54 44.48 48.16
Yorkshire and The Humber UKE 21.50 40.44 37.58
East Midlands (England) UKF 21.06 41.81 42.38
West Midlands (England) UKG 22.70 46.64 45.65
Eastern UKH 20.91 44.46 48.83
London UKI 23.22 46.06 57.76
South East UKJ 21.17 44.71 53.35
South West (England) UKK 20.16 44.10 49.40
Wales UKL 22.83 44.93 53.75
Scotland UKM 20.22 No data No data
Northern Ireland UKN 25.30 No data No data
Range: 5.14 6.2 20.18
* as % of total population ** (ISCED 3-4) as % of the population aged 15-24 years old
Figure 4.75: Regional distribution of pupils and students in all levels of education, UK NUTS1 regions

EDUCATION INEQUALITY ACROSS EU REGIONS
145
Figure 4.76: University accessibility, UK regions (% of the population in a region living at more than 60 minutes from the nearest university)
Table 4.42 provides more information on "target group" and "opportunity" indicators for the smaller NUTS2 regions. It is interesting to note that Inner London has the highest lifelong learning rate (16.1%, participation of adults aged 25-64 in education and training), whereas Northern Ireland has the lowest (5.7%). It is also worth noting that most regions have very good university accessibility, except for Cumbria, Cornwall and Isles of Scilly and Highlands and Islands where more than 40% of the population live in an area located more than 60 minutes from the nearest university (also see Figure 4.76). Table 4.42: “Target group” indicators, UK NUTS2 regions
Region NUTS CODE
Lifelong learning - participation of adults aged 25-64 in education and training (1000s)
Population living at more than 60 minutes from the nearest university, (% of total population)
Tees Valley and Durham UKC1 9.1 0
Northumb. / Tyne & Wear UKC2 10.3 0.5
Cumbria UKD1 8.9 42.5
Cheshire UKD2 9.5 0
Greater Manchester UKD3 9.4 0
Lancashire UKD4 9.3 0
Merseyside UKD5 9.6 0
E Yorkshire and N Linc. UKE1 9.2 0
North Yorkshire UKE2 10.4 0
South Yorkshire UKE3 9.1 0
West Yorkshire UKE4 8.9 0
Derbyshire & Nott. UKF1 10.0 0
Leicestershire, Rutland and Northamptonshire
UKF2 10.8 0
Lincolnshire UKF3 9.3 0.7
Herefordshire, Worcestershire and Warwickshire
UKG1 10.7 0
Shropshire and Staffordshire UKG2 9.2 0
West Midlands UKG3 9.5 0
East Anglia UKH1 10.8 0.2
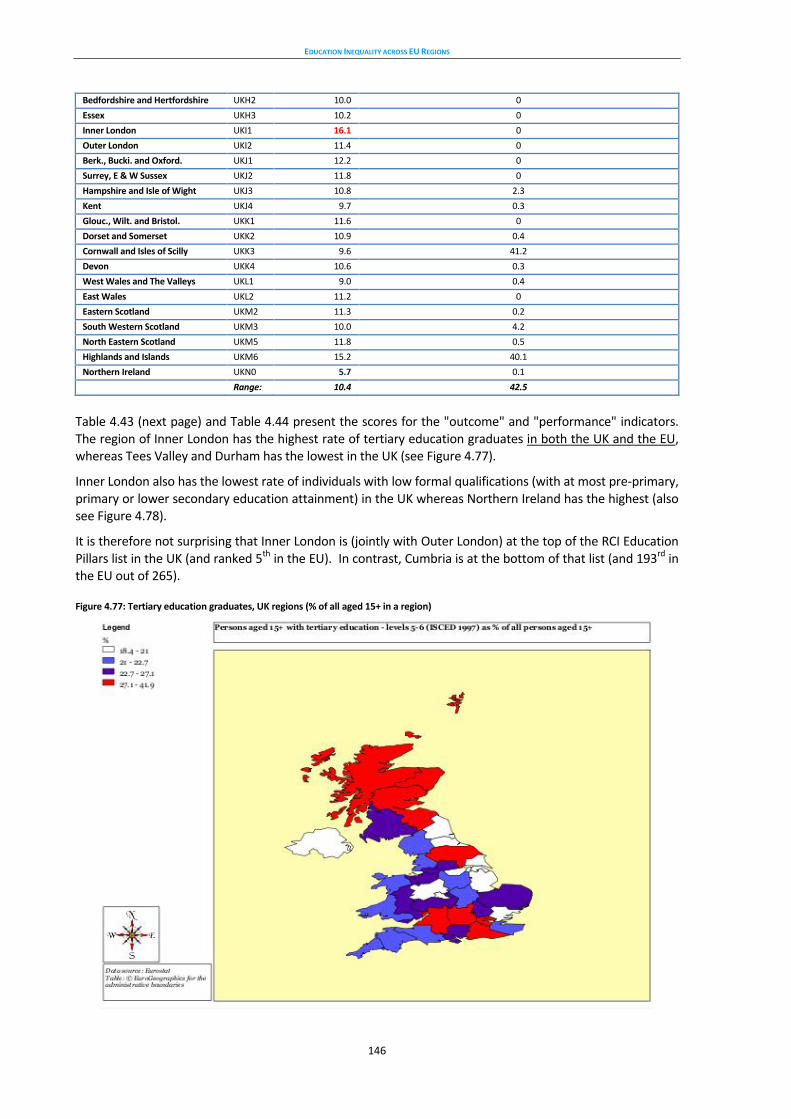
EDUCATION INEQUALITY ACROSS EU REGIONS
146
Bedfordshire and Hertfordshire UKH2 10.0 0
Essex UKH3 10.2 0
Inner London UKI1 16.1 0
Outer London UKI2 11.4 0
Berk., Bucki. and Oxford. UKJ1 12.2 0
Surrey, E & W Sussex UKJ2 11.8 0
Hampshire and Isle of Wight UKJ3 10.8 2.3
Kent UKJ4 9.7 0.3
Glouc., Wilt. and Bristol. UKK1 11.6 0
Dorset and Somerset UKK2 10.9 0.4
Cornwall and Isles of Scilly UKK3 9.6 41.2
Devon UKK4 10.6 0.3
West Wales and The Valleys UKL1 9.0 0.4
East Wales UKL2 11.2 0
Eastern Scotland UKM2 11.3 0.2
South Western Scotland UKM3 10.0 4.2
North Eastern Scotland UKM5 11.8 0.5
Highlands and Islands UKM6 15.2 40.1
Northern Ireland UKN0 5.7 0.1
Range: 10.4 42.5
Table 4.43 (next page) and Table 4.44 present the scores for the "outcome" and "performance" indicators. The region of Inner London has the highest rate of tertiary education graduates in both the UK and the EU, whereas Tees Valley and Durham has the lowest in the UK (see Figure 4.77).
Inner London also has the lowest rate of individuals with low formal qualifications (with at most pre-primary, primary or lower secondary education attainment) in the UK whereas Northern Ireland has the highest (also see Figure 4.78).
It is therefore not surprising that Inner London is (jointly with Outer London) at the top of the RCI Education Pillars list in the UK (and ranked 5th in the EU). In contrast, Cumbria is at the bottom of that list (and 193rd in the EU out of 265).
Figure 4.77: Tertiary education graduates, UK regions (% of all aged 15+ in a region)
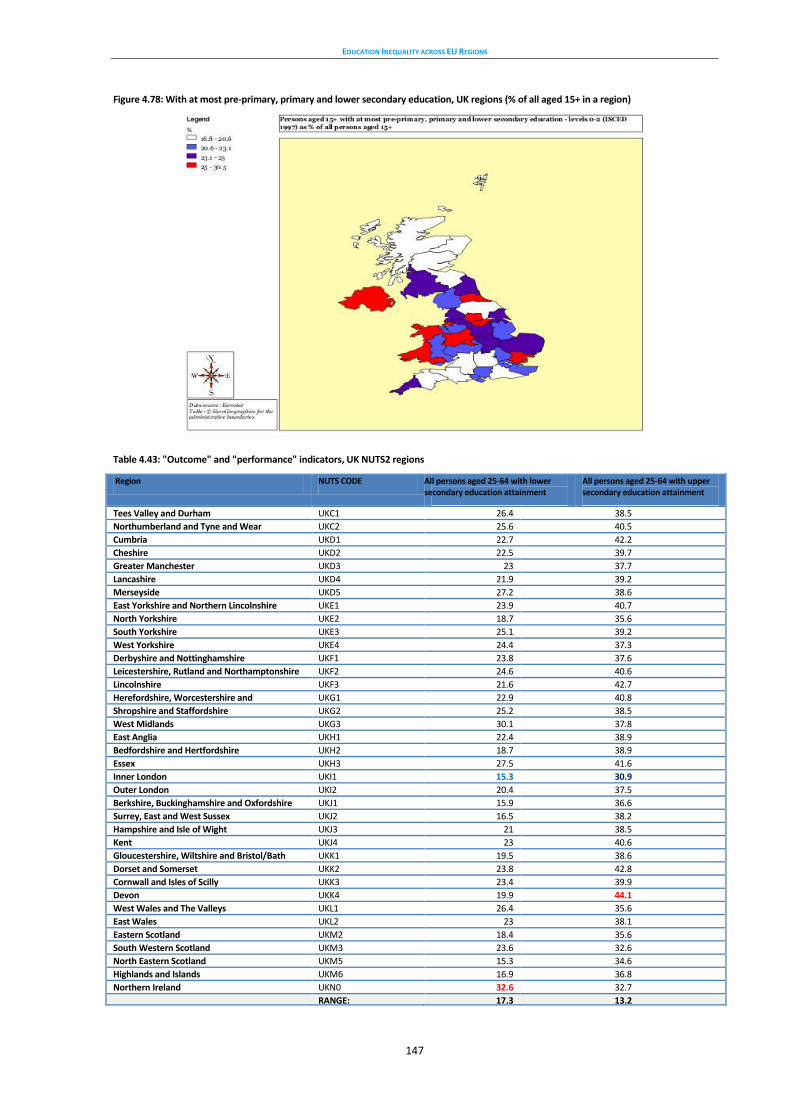
EDUCATION INEQUALITY ACROSS EU REGIONS
147
Figure 4.78: With at most pre-primary, primary and lower secondary education, UK regions (% of all aged 15+ in a region)
Table 4.43: "Outcome" and "performance" indicators, UK NUTS2 regions
Region NUTS CODE All persons aged 25-64 with lower secondary education attainment
All persons aged 25-64 with upper secondary education attainment
Tees Valley and Durham UKC1 26.4 38.5
Northumberland and Tyne and Wear UKC2 25.6 40.5
Cumbria UKD1 22.7 42.2
Cheshire UKD2 22.5 39.7
Greater Manchester UKD3 23 37.7
Lancashire UKD4 21.9 39.2
Merseyside UKD5 27.2 38.6
East Yorkshire and Northern Lincolnshire UKE1 23.9 40.7
North Yorkshire UKE2 18.7 35.6
South Yorkshire UKE3 25.1 39.2
West Yorkshire UKE4 24.4 37.3
Derbyshire and Nottinghamshire UKF1 23.8 37.6
Leicestershire, Rutland and Northamptonshire UKF2 24.6 40.6
Lincolnshire UKF3 21.6 42.7
Herefordshire, Worcestershire and Warwickshire
UKG1 22.9 40.8
Shropshire and Staffordshire UKG2 25.2 38.5
West Midlands UKG3 30.1 37.8
East Anglia UKH1 22.4 38.9
Bedfordshire and Hertfordshire UKH2 18.7 38.9
Essex UKH3 27.5 41.6
Inner London UKI1 15.3 30.9
Outer London UKI2 20.4 37.5
Berkshire, Buckinghamshire and Oxfordshire UKJ1 15.9 36.6
Surrey, East and West Sussex UKJ2 16.5 38.2
Hampshire and Isle of Wight UKJ3 21 38.5
Kent UKJ4 23 40.6
Gloucestershire, Wiltshire and Bristol/Bath area
UKK1 19.5 38.6
Dorset and Somerset UKK2 23.8 42.8
Cornwall and Isles of Scilly UKK3 23.4 39.9
Devon UKK4 19.9 44.1
West Wales and The Valleys UKL1 26.4 35.6
East Wales UKL2 23 38.1
Eastern Scotland UKM2 18.4 35.6
South Western Scotland UKM3 23.6 32.6
North Eastern Scotland UKM5 15.3 34.6
Highlands and Islands UKM6 16.9 36.8
Northern Ireland UKN0 32.6 32.7
RANGE: 17.3 13.2
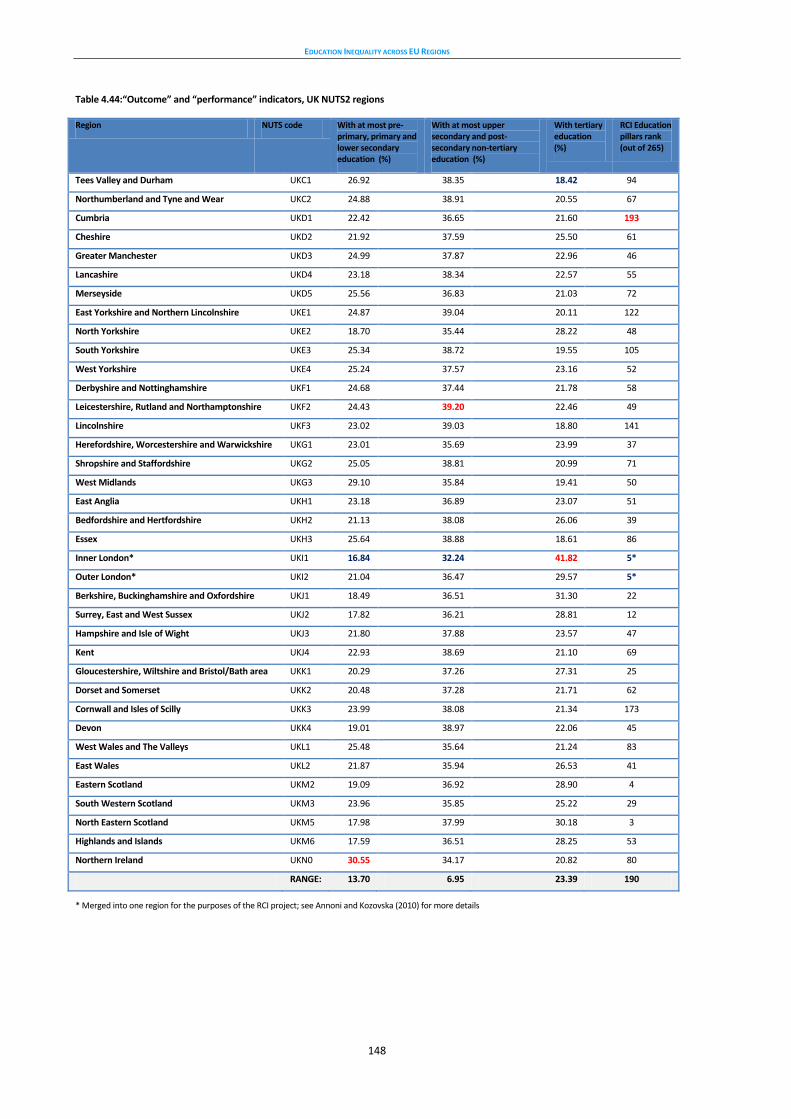
EDUCATION INEQUALITY ACROSS EU REGIONS
148
Table 4.44:“Outcome” and “performance” indicators, UK NUTS2 regions
Region NUTS code With at most pre-primary, primary and lower secondary education (%)
With at most upper secondary and post-secondary non-tertiary education (%)
With tertiary education (%)
RCI Education pillars rank (out of 265)
Tees Valley and Durham UKC1 26.92 38.35 18.42 94
Northumberland and Tyne and Wear UKC2 24.88 38.91 20.55 67
Cumbria UKD1 22.42 36.65 21.60 193
Cheshire UKD2 21.92 37.59 25.50 61
Greater Manchester UKD3 24.99 37.87 22.96 46
Lancashire UKD4 23.18 38.34 22.57 55
Merseyside UKD5 25.56 36.83 21.03 72
East Yorkshire and Northern Lincolnshire UKE1 24.87 39.04 20.11 122
North Yorkshire UKE2 18.70 35.44 28.22 48
South Yorkshire UKE3 25.34 38.72 19.55 105
West Yorkshire UKE4 25.24 37.57 23.16 52
Derbyshire and Nottinghamshire UKF1 24.68 37.44 21.78 58
Leicestershire, Rutland and Northamptonshire UKF2 24.43 39.20 22.46 49
Lincolnshire UKF3 23.02 39.03 18.80 141
Herefordshire, Worcestershire and Warwickshire UKG1 23.01 35.69 23.99 37
Shropshire and Staffordshire UKG2 25.05 38.81 20.99 71
West Midlands UKG3 29.10 35.84 19.41 50
East Anglia UKH1 23.18 36.89 23.07 51
Bedfordshire and Hertfordshire UKH2 21.13 38.08 26.06 39
Essex UKH3 25.64 38.88 18.61 86
Inner London* UKI1 16.84 32.24 41.82 5*
Outer London* UKI2 21.04 36.47 29.57 5*
Berkshire, Buckinghamshire and Oxfordshire UKJ1 18.49 36.51 31.30 22
Surrey, East and West Sussex UKJ2 17.82 36.21 28.81 12
Hampshire and Isle of Wight UKJ3 21.80 37.88 23.57 47
Kent UKJ4 22.93 38.69 21.10 69
Gloucestershire, Wiltshire and Bristol/Bath area UKK1 20.29 37.26 27.31 25
Dorset and Somerset UKK2 20.48 37.28 21.71 62
Cornwall and Isles of Scilly UKK3 23.99 38.08 21.34 173
Devon UKK4 19.01 38.97 22.06 45
West Wales and The Valleys UKL1 25.48 35.64 21.24 83
East Wales UKL2 21.87 35.94 26.53 41
Eastern Scotland UKM2 19.09 36.92 28.90 4
South Western Scotland UKM3 23.96 35.85 25.22 29
North Eastern Scotland UKM5 17.98 37.99 30.18 3
Highlands and Islands UKM6 17.59 36.51 28.25 53
Northern Ireland UKN0 30.55 34.17 20.82 80
RANGE: 13.70 6.95 23.39 190
* Merged into one region for the purposes of the RCI project; see Annoni and Kozovska (2010) for more details
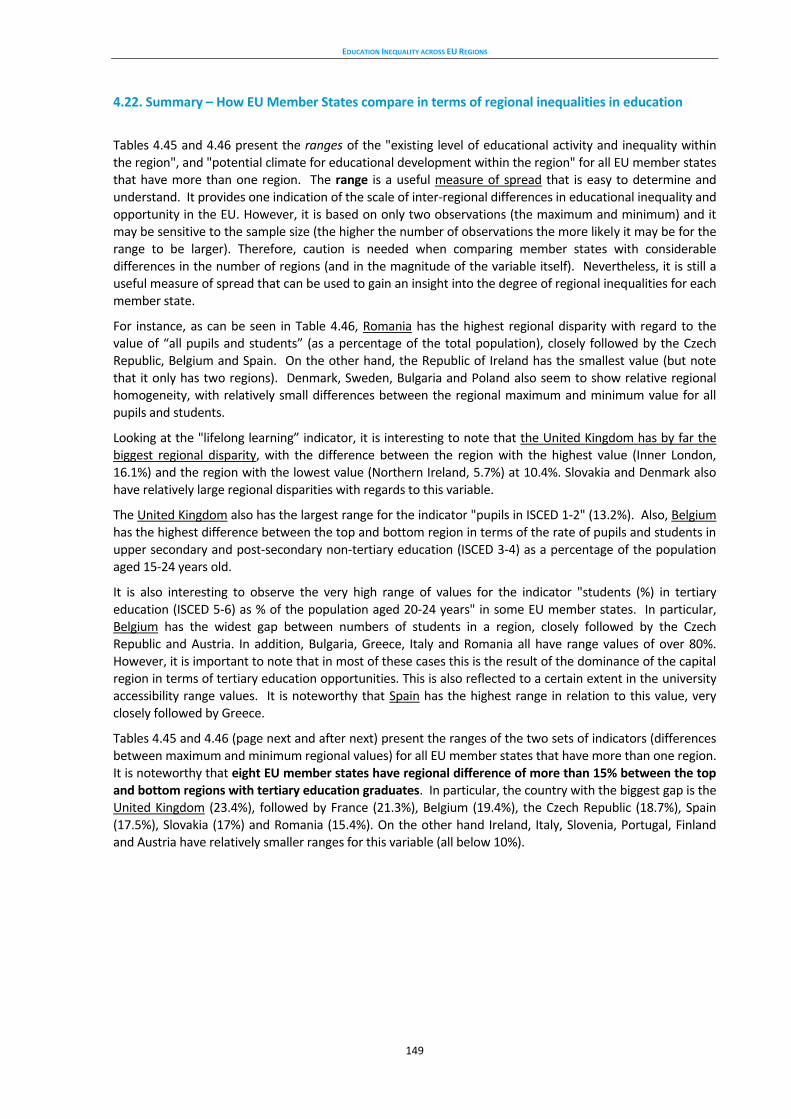
EDUCATION INEQUALITY ACROSS EU REGIONS
149
4.22. Summary – How EU Member States compare in terms of regional inequalities in education
Tables 4.45 and 4.46 present the ranges of the "existing level of educational activity and inequality within the region", and "potential climate for educational development within the region" for all EU member states that have more than one region. The range is a useful measure of spread that is easy to determine and understand. It provides one indication of the scale of inter-regional differences in educational inequality and opportunity in the EU. However, it is based on only two observations (the maximum and minimum) and it may be sensitive to the sample size (the higher the number of observations the more likely it may be for the range to be larger). Therefore, caution is needed when comparing member states with considerable differences in the number of regions (and in the magnitude of the variable itself). Nevertheless, it is still a useful measure of spread that can be used to gain an insight into the degree of regional inequalities for each member state.
For instance, as can be seen in Table 4.46, Romania has the highest regional disparity with regard to the value of “all pupils and students” (as a percentage of the total population), closely followed by the Czech Republic, Belgium and Spain. On the other hand, the Republic of Ireland has the smallest value (but note that it only has two regions). Denmark, Sweden, Bulgaria and Poland also seem to show relative regional homogeneity, with relatively small differences between the regional maximum and minimum value for all pupils and students.
Looking at the "lifelong learning” indicator, it is interesting to note that the United Kingdom has by far the biggest regional disparity, with the difference between the region with the highest value (Inner London, 16.1%) and the region with the lowest value (Northern Ireland, 5.7%) at 10.4%. Slovakia and Denmark also have relatively large regional disparities with regards to this variable.
The United Kingdom also has the largest range for the indicator "pupils in ISCED 1-2" (13.2%). Also, Belgium has the highest difference between the top and bottom region in terms of the rate of pupils and students in upper secondary and post-secondary non-tertiary education (ISCED 3-4) as a percentage of the population aged 15-24 years old.
It is also interesting to observe the very high range of values for the indicator "students (%) in tertiary education (ISCED 5-6) as % of the population aged 20-24 years" in some EU member states. In particular, Belgium has the widest gap between numbers of students in a region, closely followed by the Czech Republic and Austria. In addition, Bulgaria, Greece, Italy and Romania all have range values of over 80%. However, it is important to note that in most of these cases this is the result of the dominance of the capital region in terms of tertiary education opportunities. This is also reflected to a certain extent in the university accessibility range values. It is noteworthy that Spain has the highest range in relation to this value, very closely followed by Greece.
Tables 4.45 and 4.46 (page next and after next) present the ranges of the two sets of indicators (differences between maximum and minimum regional values) for all EU member states that have more than one region. It is noteworthy that eight EU member states have regional difference of more than 15% between the top and bottom regions with tertiary education graduates. In particular, the country with the biggest gap is the United Kingdom (23.4%), followed by France (21.3%), Belgium (19.4%), the Czech Republic (18.7%), Spain (17.5%), Slovakia (17%) and Romania (15.4%). On the other hand Ireland, Italy, Slovenia, Portugal, Finland and Austria have relatively smaller ranges for this variable (all below 10%).

EDUCATION INEQUALITY ACROSS EU REGIONS
150
Table 4.45: The gap between the top and bottom region in each Member State in terms of "Potential climate for educational development within the region" indicators (EU Member States with more than one region)
Co
un
try Pupils and students
in all levels of education
Adult participation
in lifelong learning
Pupils in ISCED 1-2
Pupils and students in ISCED 3-4
Students in tertiary education ( ISCED 5-
6)
University accessibility
AT 8.3 3.4 2.2 9.0 92.7 18.0
BE 12.7 3.6 5.2 36.4 97.3 0.0
BG 5.0 1.3 1.2 3.6 70.2 83.0
CZ 14.0 4.5 2.1 31.0 94.4 4.0
DE 5.7 2.9 no data 11.0 42.1 1.1
DK 2.7 5.0 2.1 9.2 48.9 25.5
ES 11.3 3.3 8.6 10.9 51.7 99.7
FI 7.2 3.6 1.6 15.7 66.7 87.3
FR 8.4 4.3 2.8 5.1 41.2 54.9
GR 9.2 1.7 2.9 4.3 83.9 98.8
HU 3.5 1.4 1.9 5.1 67.1 6.2
IE 0.1 1.1 1.1 5.1 14.9 0.5
IT 8.4 2.2 3.4 16.8 89.3 73.8
NL 5.3 2.3 3.7 13.4 50.1 1.7
PL 4.9 2.7 2.0 4.6 64.4 39.9
PT 1.9 0.7 1.6 6.2 51.8 14.1
RO 16.2 0.3 3.4 5.7 80.3 46.1
SE 2.8 3.8 1.2 6.1 33.3 36.9
SI 6.9 1.7 0.0 5.6 53.4 0.8
SK 9.2 5.2 3.5 10.7 66.3 12.2
UK 5.1 10.4 13.2 6.2 20.2 42.5
Looking at the outcome indicator "at most pre-primary, primary and lower secondary qualifications" (rates of people with low qualifications), it is interesting to note that France has the highest disparity between the regions with the top and bottom value (range of 27.1%), followed by Greece, Spain, Romania and Germany. In contrast, the countries with the lowest disparities for this variable are Slovenia, Ireland, Slovakia, Austria and Finland.
It is also interesting to discuss the regional disparities by member state in relation to the "RCI Education Pillars" indicator. The last column of Table 4.46 (next page) gives the differences between the rank of the top and bottom region in each member state. The biggest difference is observed in France, where the capital region of Île de France is ranked top (and 24th in the EU out of 265), 231 places above Corse which is ranked bottom (and 255th in the EU out of 265). Similarly, Spain has a very high range: the capital region of Comunidad de Madrid is ranked 44th in the EU, 228 places above Ciudad Autónoma de Ceuta. Also, in Finland, the capital region of Etelä-Suomi is ranked 1st in the EU, 199 places above Åland islands (but the difference with the other Finnish regions is relatively small). In Greece, the capital region of Attiki is ranked 60th in the EU, 198 places above the region of Ionia Nisia which is ranked bottom (and 258th in the EU out of 265). In Slovakia, the capital region of Bratislavský kraj is ranked 15th in the EU, 196 places above the region of Východné Slovensko which is ranked bottom.

EDUCATION INEQUALITY ACROSS EU REGIONS
151
Table 4.46: The gap between the top and bottom region in each Member State (EU Member States with more than one region)
Country Lower
secondary 25-64
Upper secondary
25-64
At most pre-primary, primary and lower
secondary 15+
At most upper secondary and post-secondary non
tertiary 15+
Tertiary education
15+
RCI Education Pillars Rank (0-265)
AT 9.7 15.8 9.8 7.1 9.8 181
BE 16.1 13.8 15.6 10.6 19.4 129
BG 15.4 15.3 17.6 7.0 14.3 170
CZ 8.7 11.7 13.1 8.9 18.7 182
DE 16.5 20.9 18.8 13.7 14.6 149
DK 7.3 5.6 10.9 2.1 11.8 26
ES 29.1 33.2 23.2 10.5 17.6 228
FI 12.0 8.0 9.8 5.1 9.5 199
FR 29.7 16.2 27.2 15.5 21.3 231
GR 27.5 19.0 27.1 15.3 13.3 198
HU 10.4 6.4 12.2 4.7 11.1 127
IE 9.7 1.9 6.6 1.3 5.5 65
IT 23.3 19.7 17.8 13.2 6.5 157
NL 10.0 11.2 11.4 7.6 14.8 123
PL 13.0 12.5 12.3 12.3 10.7 185
PT 18.1 9.1 13.9 6.2 8.3 101
RO 15.4 8.4 20.9 6.8 15.4 173
SE 9.2 8.2 10.4 8.1 14.3 127
SI 0.0 0.0 0.0 0.0 7.3 2
SK 3.4 16.0 8.5 9.6 17.1 196
UK 17.3 13.2 13.7 7.0 23.4 190

EDUCATION INEQUALITY ACROSS EU REGIONS
152
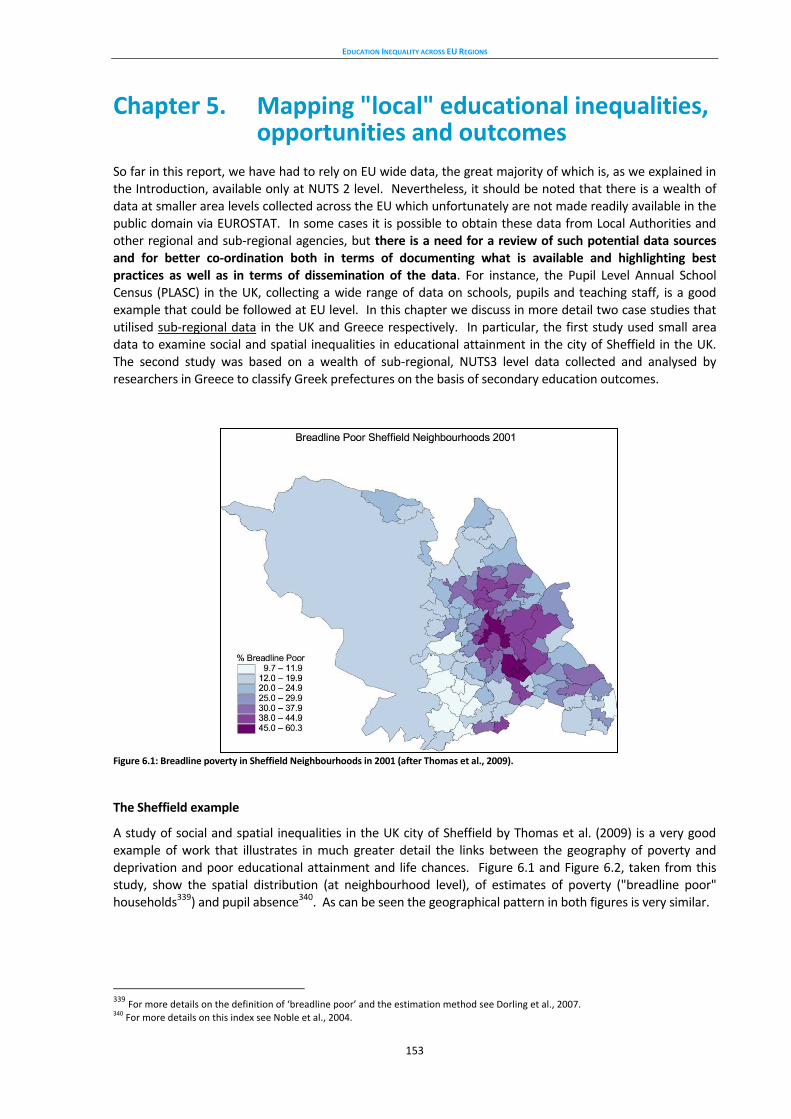
EDUCATION INEQUALITY ACROSS EU REGIONS
153
Chapter 5. Mapping "local" educational inequalities, opportunities and outcomes
So far in this report, we have had to rely on EU wide data, the great majority of which is, as we explained in the Introduction, available only at NUTS 2 level. Nevertheless, it should be noted that there is a wealth of data at smaller area levels collected across the EU which unfortunately are not made readily available in the public domain via EUROSTAT. In some cases it is possible to obtain these data from Local Authorities and other regional and sub-regional agencies, but there is a need for a review of such potential data sources and for better co-ordination both in terms of documenting what is available and highlighting best practices as well as in terms of dissemination of the data. For instance, the Pupil Level Annual School Census (PLASC) in the UK, collecting a wide range of data on schools, pupils and teaching staff, is a good example that could be followed at EU level. In this chapter we discuss in more detail two case studies that utilised sub-regional data in the UK and Greece respectively. In particular, the first study used small area data to examine social and spatial inequalities in educational attainment in the city of Sheffield in the UK. The second study was based on a wealth of sub-regional, NUTS3 level data collected and analysed by researchers in Greece to classify Greek prefectures on the basis of secondary education outcomes.
Figure 6.1: Breadline poverty in Sheffield Neighbourhoods in 2001 (after Thomas et al., 2009).
The Sheffield example
A study of social and spatial inequalities in the UK city of Sheffield by Thomas et al. (2009) is a very good example of work that illustrates in much greater detail the links between the geography of poverty and deprivation and poor educational attainment and life chances. Figure 6.1 and Figure 6.2, taken from this study, show the spatial distribution (at neighbourhood level), of estimates of poverty ("breadline poor" households339) and pupil absence340. As can be seen the geographical pattern in both figures is very similar.
339 For more details on the definition of ‘breadline poor’ and the estimation method see Dorling et al., 2007. 340
For more details on this index see Noble et al., 2004.
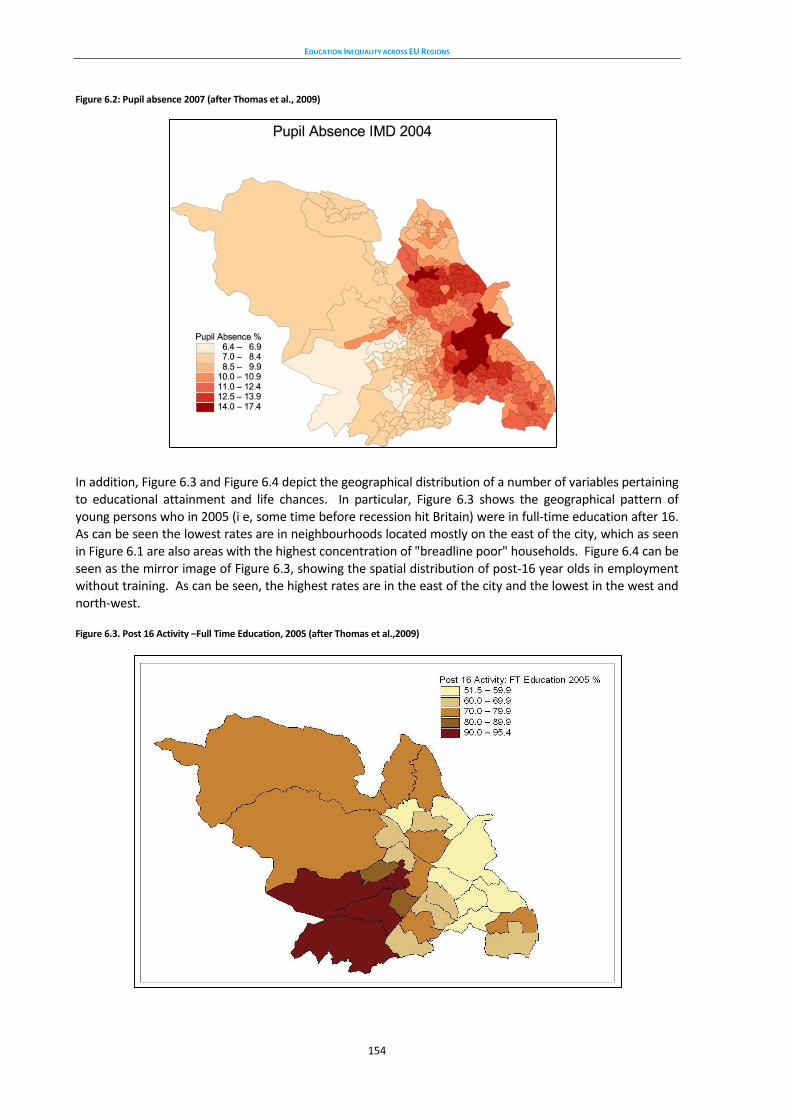
EDUCATION INEQUALITY ACROSS EU REGIONS
154
Figure 6.2: Pupil absence 2007 (after Thomas et al., 2009)
In addition, Figure 6.3 and Figure 6.4 depict the geographical distribution of a number of variables pertaining to educational attainment and life chances. In particular, Figure 6.3 shows the geographical pattern of young persons who in 2005 (i e, some time before recession hit Britain) were in full-time education after 16. As can be seen the lowest rates are in neighbourhoods located mostly on the east of the city, which as seen in Figure 6.1 are also areas with the highest concentration of "breadline poor" households. Figure 6.4 can be seen as the mirror image of Figure 6.3, showing the spatial distribution of post-16 year olds in employment without training. As can be seen, the highest rates are in the east of the city and the lowest in the west and north-west.
Figure 6.3. Post 16 Activity –Full Time Education, 2005 (after Thomas et al.,2009)
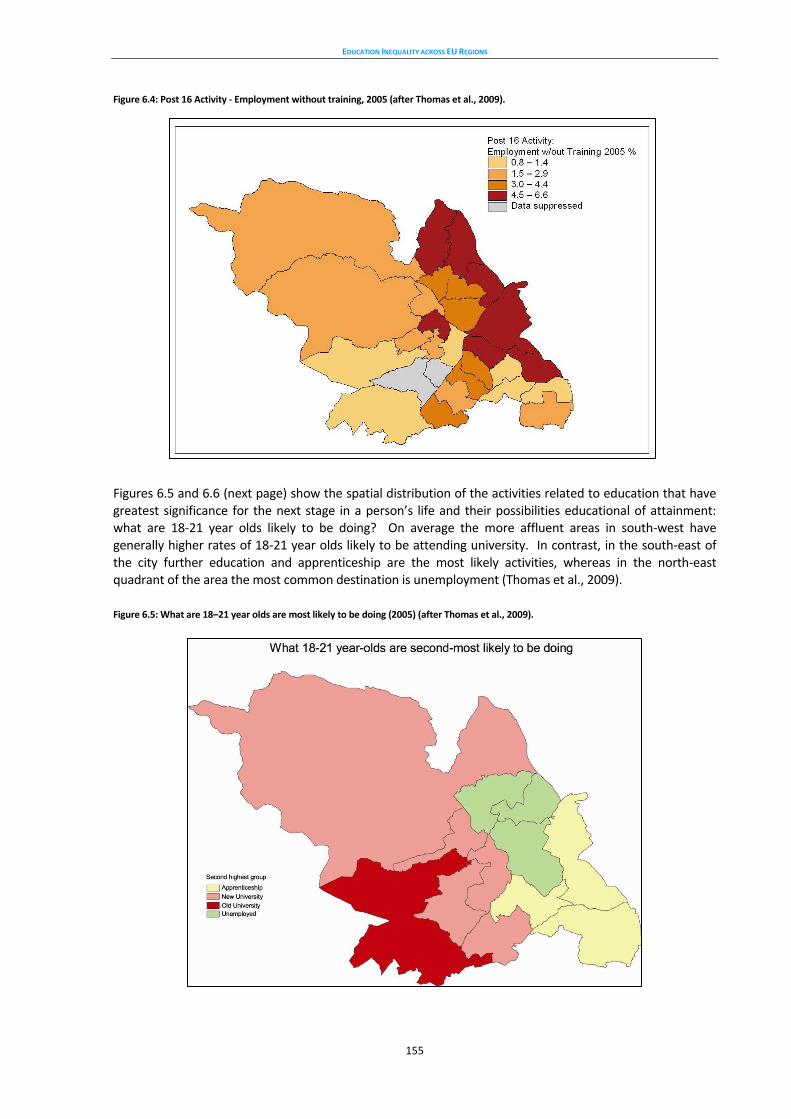
EDUCATION INEQUALITY ACROSS EU REGIONS
155
Figure 6.4: Post 16 Activity - Employment without training, 2005 (after Thomas et al., 2009).
Figures 6.5 and 6.6 (next page) show the spatial distribution of the activities related to education that have greatest significance for the next stage in a person’s life and their possibilities educational of attainment: what are 18-21 year olds likely to be doing? On average the more affluent areas in south-west have generally higher rates of 18-21 year olds likely to be attending university. In contrast, in the south-east of the city further education and apprenticeship are the most likely activities, whereas in the north-east quadrant of the area the most common destination is unemployment (Thomas et al., 2009).
Figure 6.5: What are 18–21 year olds are most likely to be doing (2005) (after Thomas et al., 2009).
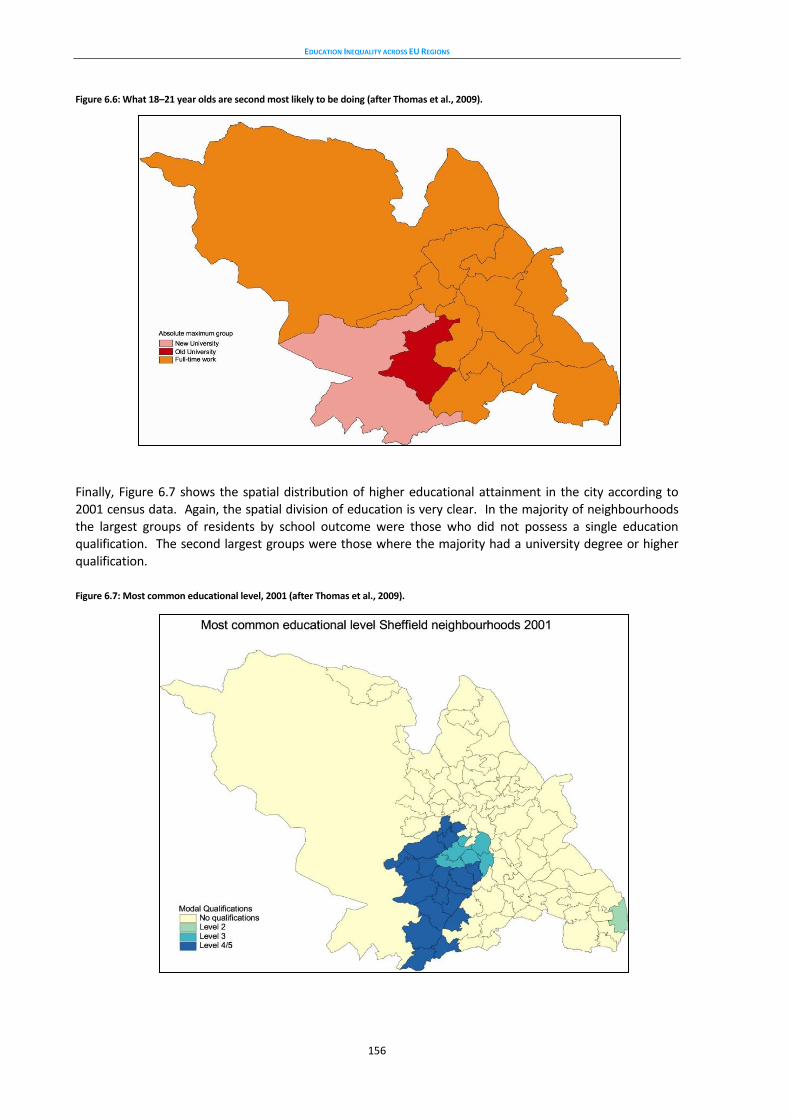
EDUCATION INEQUALITY ACROSS EU REGIONS
156
Figure 6.6: What 18–21 year olds are second most likely to be doing (after Thomas et al., 2009).
Finally, Figure 6.7 shows the spatial distribution of higher educational attainment in the city according to 2001 census data. Again, the spatial division of education is very clear. In the majority of neighbourhoods the largest groups of residents by school outcome were those who did not possess a single education qualification. The second largest groups were those where the majority had a university degree or higher qualification.
Figure 6.7: Most common educational level, 2001 (after Thomas et al., 2009).
EDUCATION INEQUALITY ACROSS EU REGIONS
157
The above figures show a clear pattern of social and spatial division matched by patterns of inequality in educational attainment and life chances which can be seen as the geographical manifestation of deeper social and spatial inequalities and divisions in relation to a wider range of indicators, including employment and income, crime, quality of housing and health and life expectancy. Thomas et al. (2009) provide more visualisations and maps as well as a detailed discussion of how localised forms of inequality with regards to these indicators play out and inter-relate, resulting effectively into a “tale of two cities” within Sheffield (which is also the title of the study).
The KANEP/GSEE example
Another example of work exploring the geographic dimension of educational inequalities is the work of the Centre for Education Policy Development of the General Confederation of Greek Workers (KANEP/GSEE, 2008, 2009 and 2011) on educational disparities in Greece. Monitoring the evolution of a large number of input and outcome indicators341 at three administrative levels (national, regional and local –counties and prefectures equivalent to NUTS 3), this work reveals that there are big disparities between different parts of the country.
A comparison of education figures with other socioeconomic indicators (‘prosperity and development’, risk of poverty, educational attainment level, and degree of urbanisation) for each county is also revealing.
In addition, the use of the “Total Educational Indicator” composite indicator reveals geographic inequalities, shows the strengths and weaknesses of each prefecture and helps identify disadvantaged areas where priority intervention is necessary.
This work shows that the state of educational provision and the educational outcomes in each area (prefecture) are directly associated with the socio-economic conditions of the area. Schools in rural and remote areas with low growth indicators lag behind when compared to schools of cities and areas with better quality infrastructure and human resources. Areas with low levels of economic growth and high numbers of population at risk of poverty tend to have lower educational outcomes, including higher numbers of pupils with considerably lower academic performance, higher numbers of early school leavers and poor participation in tertiary education.
Figure 6.8 and Figure 6.9 (next page) illustrate the geographical distribution of disparities in secondary education outcomes and attainment across the 54 Greek prefectures. Figure 6.10 (next page) shows disparities in the number of school VET pupils who drop out before the end of the school year across the 54 Greek municipalities.
341
"Input" variables in this context include indicators related to the quality and adequacy of education infrastructures, characteristics of the student population, the adequacy of human resources such as teachers and teaching assistants and funding for education; "Output” variables include an index of student retainment in secondary VET (i.e. not dropping out before the end of the school year) and indexes of academic performance.

EDUCATION INEQUALITY ACROSS EU REGIONS
158
Figure 6.8: Distribution of secondary pupils' educational outcomes and attainment across Greek municipalities in 2008. Source: KANEP/GSEE, 2011.
Cluster’s mean value
Lower secondary
General upper
secondary
Vocational upper
secondary
cluster 1 86.7% 72.4% 44.5%
cluster 2 86.1% 68.8% 54.0%
cluster 3 80.6% 63.5% 35.5%
cluster 4 76.3% 55.7% 39.3%
cluster 5 75.7% 57.1% 25.6%
cluster 6 66.1% 54.5% 31.4% TOTAL 80.5% 63.8% 37.2%
Xanthi
West Attica
Heraklion
Piraeus Kefalonia
Lasithi Rethymno Corfu
Zakynthos Cyclades Lefkada
Preveza
Grevena
Karditsa
Lesvos Magnesia
LT
PC
A
Kastoria
Arcadia
Florina
Kozani Trikala
Chios Pieria
Larissa
Ind
ex
of
ed
uca
tio
nal
ou
tco
me
s -
LOW
ER S
ECO
ND
AR
Y
Rhodope
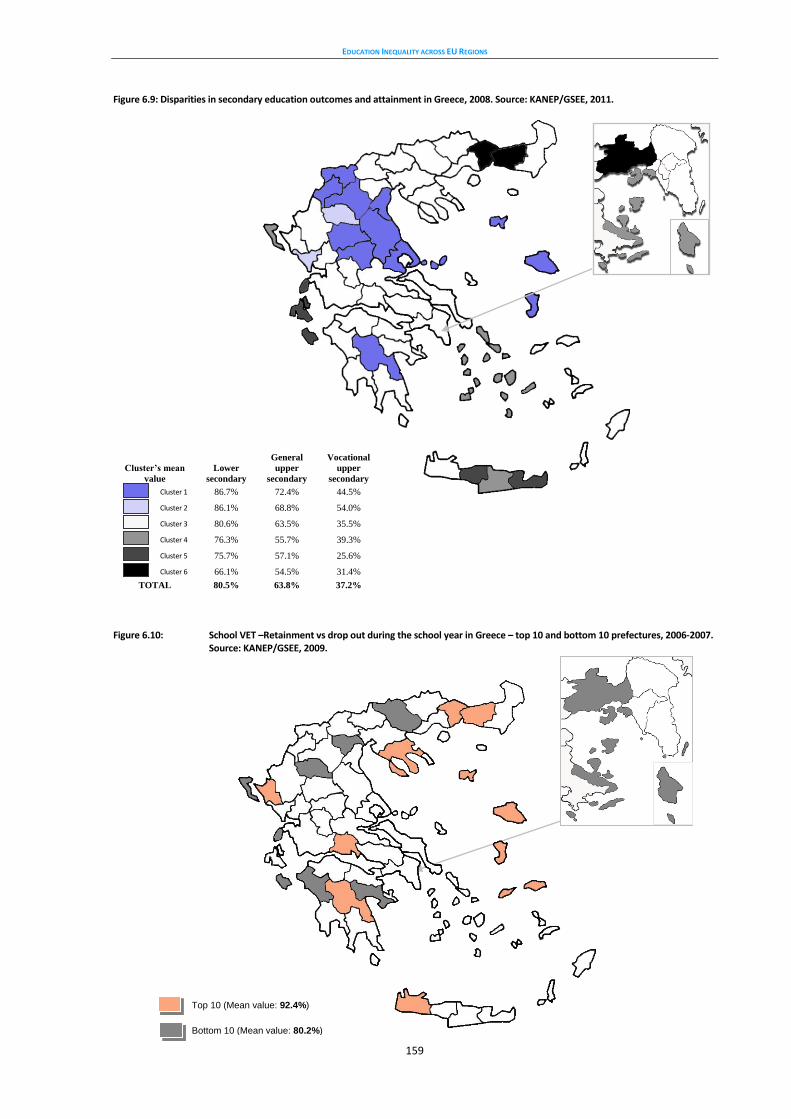
EDUCATION INEQUALITY ACROSS EU REGIONS
159
Figure 6.9: Disparities in secondary education outcomes and attainment in Greece, 2008. Source: KANEP/GSEE, 2011.
Cluster’s mean
value
Lower
secondary
General
upper
secondary
Vocational
upper
secondary
Cluster 1 86.7% 72.4% 44.5%
Cluster 2 86.1% 68.8% 54.0%
Cluster 3 80.6% 63.5% 35.5%
Cluster 4 76.3% 55.7% 39.3%
Cluster 5 75.7% 57.1% 25.6%
Cluster 6 66.1% 54.5% 31.4%
TOTAL 80.5% 63.8% 37.2%
Figure 6.10: School VET –Retainment vs drop out during the school year in Greece – top 10 and bottom 10 prefectures, 2006-2007. Source: KANEP/GSEE, 2009.
Top 10 (Mean value: 92.4%)
Bottom 10 (Mean value: 80.2%)
EDUCATION INEQUALITY ACROSS EU REGIONS
160
In consistency with other studies reviewed in this report, KANEP/GSEE (2011) confirms that educational outcomes are directly related to the socio-economic situation of an area. It also confirms that, in the Greek context too, socio-geographic disparities in educational outcomes at one level of education (e.g. participation in tertiary education) depends largely on the outcomes achieved in previous levels of education as success at one stage governs access to another. The KANEP/GSEE studies show that in the Greek context education inequalities have a strong spatial/geographic/regional aspect. They suggest that education policy in Greece has so far underestimated the effects of geographic and social inequalities on people's educational experiences and outcomes by offering exactly the same educational provision to all. They suggest that a different approach to education policy is necessary that would recognise these disparities and would include the aim of tackling them in its strategic planning and action.
Conclusion
Both the Sheffield study and the study of Greece described above are examples of how educational opportunities and attainment can be mapped out at local and county levels and analysed in relation to a wider range of other characteristics of neighbourhoods and localities. The two examples demonstrate the value, for policy makers in particular, of the kind of fine grained analysis made possible by comparative data at NUTS 3 level and for smaller more "local" areas. The Sheffield study is particularly informative in respect of a key question this report is trying to address: what is the specific nature of "localised" forms of inequality and exclusion across cities and regions in the EU? The data provide overwhelming evidence for one of the key arguments of this report - that spatial divisions and inequalities in educational opportunities and attainment reflect, and compound, wider socio-economic inequalities.
THE REGIONAL DIMENSION OF EDUCATIONAL INEQUALITY IN THE EU
161
Chapter 6. Conclusions and policy recommendations
Drawing largely on geographic understandings and tools, this report has presented a unique analysis of regional inequalities in education in the European Union. The following are key conclusions:
Where you live in Europe can strongly influence your educational opportunities and prospects in life.
Despite the commitment of EU Member States to promote equity in education and training, major geographic disparities in educational opportunities and results persist across and within EU countries and regions. EU countries need to work harder to reduce these inequalities.
There appears to be a North-South divide in educational attainment, with the highest rates of low-qualified people (with "at most pre-primary, primary or lower secondary education") found mostly in southern Europe and especially in Portugal, Spain, Italy and Greece. In contrast, the regions with the lowest rates of low-qualified people are mostly found in the UK, Belgium, the Netherlands and Sweden.
The regions with the highest proportion of individuals with tertiary education qualifications are mostly found in the UK, the Netherlands, northern Spain and Cyprus. The regions with the lowest rates of tertiary education graduates are in Italy, Portugal, and in central and eastern Member States such as Romania and the Czech Republic.
There are large regional disparities in terms of adult participation in lifelong learning in the EU. There seems to be an "East/West" divide with regard to this variable. This has serious consequences for regional development and economic performance.
There are significant differences in geographical accessibility to tertiary education across EU regions – that is the percentage of people living more than 60 minutes from the nearest university. Although just under 200 EU regions have excellent geographical accessibility to tertiary education with less than 10% of the population living more than 60 minutes from the nearest university, there are over 100 regions with relatively low access to universities and most of these are in the south-east Europe, northern Sweden and Finland, the Baltic states, Spain, Denmark and France.
20 of the regions with low geographical accessibility to tertiary education have GDP which is lower than 75% of the EU average. A potential cost effective and efficient way of addressing these regional disparities in geographical accessibility to tertiary education is the enhancement of distance and e-learning programmes. Also, enhancing transport infrastructure in these regions to reduce the travel time to the nearest university could be an additional policy response. Nevertheless, it should be noted that the measure of accessibility used in this report is very basic and does not take into account socio-economic and other barriers to participation in tertiary education (but still the best indicator that we had at our disposal for European level regional analysis).
Regional disparities within Member States
The scale of regional disparities in educational opportunities and attainment within Member States varies significantly.
Spain has the biggest gap between its best and worst performing regions in terms of geographical accessibility to tertiary education – that is the percentage of people living more than 60 minutes from the nearest university (best: Madrid and País Vasco, 0%; worst: Ceuta, 99.7%). It is followed closely by Greece (best: Attiki, 1.2%; worst: Ditiki Makedonia, 100%), with Finland third (best: Etelä-Suomi, 1.2%; worst: Åland, 88.5%) and Bulgaria fourth (best: Yugozapaden, 14.4%; worst: Severozapaden, 97.4%).
THE REGIONAL DIMENSION OF EDUCATIONAL INEQUALITY IN THE EU
162
The widest disparities regarding students in tertiary education as a proportion of the population aged 20-24 in each region are in Belgium (best: Brussels Capital, 120.7%342; worst: Province of Luxembourg, 23.4%) followed closely by the Czech Republic (best: Prague, 100%, worst: Střední Čechy, 5.6%) and Austria (best: Vienna, 100%, worst: Voralberg, 7.3%).
In 8 Member States, there is a difference of more than 15 percentage points between their top and worst performing regions regarding the ratio of tertiary education graduates among the population aged 15 or over. The UK is the country with the biggest gap (23.4 percentage points, best: Inner London, 41.8%; worst: Tees Valley and Durham, 18.4%), followed by France (21.3 percentage points, best: Île de France, 33%; worst: Corsica, 11.7%), the Czech Republic (18.8 percentage points, best: Praha, 25.8%; worst: Severozápad, 7%), Spain (17.6 percentage points, best: País Vasco, 34.3%; worst: Extremadura, 16.7%), Slovakia (17.1 percentage points, best: Bratislavský kraj, 27.2%; worst: Východné Slovensko, 10.1%) and Romania (15.4 percentage points, best: Bucureşti–Ilfov, 22.5%; worst: Sud-Muntenia, 7.1%).
France has the highest disparity between its top and bottom regions in terms of low educational qualifications (best: Alsace, 32.9%; worst: Corsica, 60.1%), followed by Greece (best: Attiki, 37%; worst: Ionia Nisia, 64.1%), Spain (best: Madrid, 44.2%; worst: Extremadura, 67.4%), Romania (best: Bucuresti-Ilfov, 21.9%; worst: Nord-Est, 42.8%) and Germany (best: Chemnitz, 11.9%; worst: Bremen, 30.6%).
The UK has by far the biggest regional disparity in terms of adult participation in lifelong learning. The best performing region is Inner London, with 16.1% of the population aged 25-64 in lifelong learning; the worst is Northern Ireland, with 5.7%.
These disparities reflect wider social and spatial divides between regions and cities within each Member State in terms of factors including employment, wealth, crime, quality of housing and health and life expectancy.
Regional and local inequalities in educational attainment are best ameliorated through policies that tackle deeper socio-economic and spatial inequalities. For example, the Educational Maintenance Allowance in the UK (which has however now been discontinued for new applicants in England343) could be seen as a good example of a measure addressing such inequalities, enabling young people to stay on in further education after completing compulsory education.
Given the overwhelming evidence about the importance of human capital and knowledge for regional development and economic performance, there should be renewed emphasis on efforts to expand and widen participation in tertiary education across the EU. A policy response in this context would be to aim for a minimal or zero level of tuition fees, at least for undergraduate courses across the EU.
There is a need for smaller area data (lower than the administrative NUTS 3 level). The data that Thomas et al. (2009) and KANEP/GSEE (2009, 2010, 2011) had at their disposal (see Chapter 5) would be ideal. A lot of these data is being collected across the EU, but there is a need for better co-ordination and for data to be made available in the public domain. Another example of an excellent data resource that could be seen as an example for best practice across the EU is the Pupil Level Annual School Census (PLASC) in the UK which collects a wide range of data on schools, pupils and teaching staff. The data currently available by EUROSTAT is very useful and there are efforts to improve this every year, but there is a need for more information to be made available at regional and local levels –for data at the level of individual schools and classrooms.
342 This figure is above 100% because of the high concentration of students in the Belgian capital and of the high number of
mature students in tertiary education –which is typical of capital cities. 343
For details see: http://www.direct.gov.uk/en/EducationAndLearning/14To19/MoneyToLearn/16to19bursary/DG_067575

THE REGIONAL DIMENSION OF EDUCATIONAL INEQUALITY IN THE EU
163
References
Ainsworth, J.W. (2002). “Why Does It Take a Village? The Mediation of Neighbourhood Effects on Educational Achievement.” Social Forces, 81, 117.
Ainsworth, J.W. (2010). “Does the Race of Neighborhood Role Models Matter? Collective Socialization Effects on Educational Achievement.” Urban Education, 45, 401.
Allen, R., Burgess., S., and McKenna, L. (2010) The early impact of Brighton and Hove’s school admission reforms. CMPO Working Paper 10/244. Bristol: Centre for Market and Public Organisation.
Almeida dos Reis, J.G. & Paes de Barros, R. (1991). “Wage inequality and the distribution of Education. A study of the evolution of regional differences in inequality in metropolitan Brazil.” Journal of Development Economics, 36, 117-143.
Andersson, E. & Subramanian, S.V. (2006). “Explorations of Neighbourhood and Educational Outcomes for Young Swedes.” Urban Studies, 43, 2013.
Annoni, P. & Kozovska, K. (2010). EU Regional Competitiveness Index 2010. [Online] JRC Scientific and Technical Report, EUR 24346. Luxembourg: Publication Office of the European Union. http://easu.jrc.ec.europa.eu/eas/downloads/pdf/JRC58169.pdf [Accessed 9 December 2010].
Armstrong, H.W. (1993). The Local Income and Employment Impact of Lancaster University, Urban Studies, 30(10), 1653-1668.
Armstrong, H.W., Darrall, J. and Grove-White, R. (1997). Maximising the local economic, environmental and social benefits of a university: Lancaster University. Geojournal, 41(4), 339-350
Azzoni, C.R. &. Servo, L.M.S. (2002). “Education, cost of living and regional wage inequality in Brazil.” Papers in Regional Science, 81, 157–175.
Ballas, D., Dorling, D (2011), Human Scaled Visualisations and Society, in Nyerges, T, Couclelis, H, McMaster, R (eds.), Handbook of GIS & Society Research, Sage
Bernstein, B. (1975)Class, Codes and Control: Towards a Theory of Educational Transmission. Oxford: Routledge and Kegan Paul
Ball, S. J. (1981). Beachside Comprehensive. Cambridge, Cambridge University Press.
Blasius, J., Friedrichs, J. and Galster, G., 2007. Introduction: Frontiers of Quantifying Neighbourhood effects. Housing Studies, 22(5), 627–636.
Bourdieu, P. (1977) Outline of a Theory of Practice. Cambridge: Cambridge University Press
Bourdieu, P. (1984) Distinction: A Social Critique of the Judgement of Taste
Burgess, S., Johnston, R. and Wilson, D. (2003). “School Segregation in multi-ethnic England.” The Centre for Market and Public Organisation (CMPO), University of Bristol, Working paper 03/092.
Byrd, C.M. & Chavous, T.M. (2009). “Racial Identity and Academic Achievement in the Neighborhood Context: A Multilevel Analysis.” Journal of Youth Adolescence, 38, 544–559.
Champion, T. & Coombes, M. (2007). “Using the 2001 census to study human capital movements affecting Britain’s larger cities: insights and issues.” Journal of Royal Statistical Society A, 170 (2), 447-467.
Ciccone, A., Cingano, F. and Cipollone, P. (2004). “The Private and Social Return to Schooling in Italy.” GiornaledegliEconomisti e Annali di Economia,63 (3/4), 413-444
Ciccone, A., Cingano, F. and Cipollone, P. (2004). “The Private and Social Return to Schooling in Italy.” Giornale degli Economisti e Annali di Economia, 63 (3/4), 413-444.
Clarke, G.P. & Langley, R. (1996). “The potential of GIS and spatial modelling for planning in the new education market.” Environment and Planning C, Government and Policy, 14, 301-323.
Datcher, L., (1982). “Effects of Community and Family Background on Achievement.” Review of Economics and Statistics, 64 (1), 32-41.
de la Croix, D. & Vandenberghe, V. (2004). Human capital as a factor of growth and employment at the regional level. The case of Belgium. European Commission, Directorate-General for Employment and Social Affairs. Preliminary Report.
de la Fuente, A. (2003). The effect of Structural Fund spending on the Spanish regions: an assessment of the 1994-99 Objective 1 CSF. FEDEA, Fundación de Estudios de Economía Aplicada, Documento de Trabajo 2003-11.
de la Fuente, A. (2009). “Testing, not modelling, the impact of Cohesion support: a theoretical framework and some preliminary results for the Spanish regions.” Barcelona Economics Working Paper Series, Working Paper No 419.
THE REGIONAL DIMENSION OF EDUCATIONAL INEQUALITY IN THE EU
164
de la Fuente, A. & Ciccone, A. (2002). Human capital in a global and knowledge-based economy. European Commission, Directorate-General for Employment and Social Affairs. Final Report.
de la Fuente, A., Doménech, R. and Jimeno, J. F. (2003). Human capital as a factor of growth and employment at the regional level. The case of Spain. European Commission, Directorate-General for Employment and Social Affairs. Final Report.
de la Fuente, A. & Vives, X. (1995). “Infrastructure and Education as Instruments of Regional Policy: Evidence from Spain.” Economic Policy, 10 (20), 11–51.
de la Fuente Moreno, Á. (2009). “Can Investment in Human Capital Reduce Regional Disparities? Some Evidence for Spain.” In: Köchendorfer-Lucius, G. & Pleskovič, B. (eds.) Spatial Disparities and Development Policy, Berlin Workshop Series. Washington DC: The International Bank for Reconstruction and Development / The World Bank, pp. 109-120.
DeLuca, S. & Dayton, E. (2009). “Switching Social Contexts: The Effects of Housing Mobility and School Choice Programs on Youth Outcomes.” Annual Review of Sociology, 35, 457–91.
Demack, S., Drew, D. and Grimsley, M. (2000). “Minding the Gap: ethnic, gender and social class differences in attainment at 16, 1988-95.” Race, Ethnicity and Education, 3 (2), 117-143.
Dillabough, J-A., Kennelly, J. and Wang, E. (2007) Warehousing young people in urban Canadian schools: gender, peer rivalry and spatial containment, in Gulson, K. and Symes, C. Spatial Theories of Education: Policy and Geography Matters. New York and London: Routledge
Dorling, D., Rigby, J., Wheeler, B., Ballas, D. Thomas, B., Fahmy, E., Gordon, D., and Lupton, R. (2007). Poverty, wealth and place in Britain, 1968 to 2005. Bristol: Policy Press.
Dreger, C., Erber, G. and Glocker, D. (2009). “Regional Measures of Human Capital in the European Union.” IZA Discussion Paper Series, January 2009, IZA DP No. 3919.
Duranton, G. & Monastiriotis, V. (2001). “Mind The Gap: How much does Britain’s north-south divide matter?” Centre Piece Magazine, Spring 2001, 18-23.
Duranton, G. & Monastiriotis, V. (2002). “Mind the Gaps: The Evolution of Regional Inequalities in the U.K. 1982-1997.” Journal of Regional Science, 42 (2), 219-256.
Durlauf, S.N. (2003). “Neighborhood Effects”. In: Henderson, J. V. & Thisse, J.F. (Eds.) Handbook of Regional and Urban Economics, volume 4, Economics.
Eriksson, R.H. (2004). “Localized Spillovers and Knowledge Flows: How Does Proximity Influence the Performance of Plants?” Papers in Evolutionary Economic Geography. Utrecht University: Urban & Regional Research Centre Utrecht.
Ellen, I. and Turner, M. (2003) ‘Do Neighborhoods Matter and Why?’ in Choosing a Better Life: Evaluating the Moving to Opportunity Experiment, pp. 313-339, Washington DC: Urban Institute Press
European Commission (2009). Eurostat regional yearbook 2009 [Online] Eurostat statistical books. Luxemburg: Publication Office of the European Union. http://epp.eurostat.ec.europa.eu/portal/page/portal/product_details/publication?p_product_code=KS-HA-09-001 [Accessed 9 December 2010].
European Commission (2010). Eurostat regional yearbook 2010 [Online] Eurostat statistical books. Luxemburg: Publication Office of the European Union. http://epp.eurostat.ec.europa.eu/portal/page/portal/product_details/publication?p_product_code=KS-HA-10-001 [Accessed 9 December 2010].
Everitt BS (1993) Cluster Analysis 3rd edition. London: Edward Arnold.
Garner, C.L., & Raudenbush, S.W. (1991). "Neighborhood Effects on Educational Attainment: A Multilevel Analysis." Sociology of Education, 64, 251-262.
Gibbons, S. (2002). Neighbourhood Effects on Educational Achievement: Evidence from the Census and National Child Development Study. London School of Economics and Political Science: Centre for the Economics of Education. CEEDP, 18.
Gibbons, S. & Machin, S. (2003). “Valuing English primary schools.” Journal of Urban Economics, 53, 197-219.
Goldsmith, P.R. (2009). “Schools or Neighborhoods or Both? Race and Ethnic Segregation and Educational Attainment.” Social Forces, 87 (4), 1913-1941.
Goldstein, H. (2003). Multilevel Statistical Models, 3rd edition. London: Arnold.
Florida, R. (2002) The Rise of the Creative Class. Basic Books
Galster, G., Marcotte, D., Mandell, M., Wolman, H. and Augustine, N. (2007) ‘The influence of Neighbourhood Poverty During Childhood on Fertility, Education and Earnings Outcomes’, Housing Studies, 22(5), 723–751
THE REGIONAL DIMENSION OF EDUCATIONAL INEQUALITY IN THE EU
165
Galster, G. (2010) The Mechanisms of Neighbourhood Effects: Theory, Evidence and Policy Implications. Presentation to the ESRC Neighbourhood Effects Seminar, St Andrews University, 4th February 2010.
Gulson, K. and Symes, C (2007) Spatial Theories of Education: Policy and Geography Matters. New York and London: Routledge
Harris, R. & Johnston, R. (2008). “Primary Schools, Markets and Choice: Studying Polarization and the Core Catchment Areas of Schools.” Applied Spatial Analysis and Policy, 1, 59-84.
Harris, R., Johnston, R. and Burgess, S. (2007). “Neighborhoods, ethnicity and school choice: developing a statistical framework for geodemographic analysis.” Population Research and Policy Review, 26 (5-6), 553-579.
Heckman, J.J. (2005). “China’s human capital investment.” China Economic Review, 16, 50–70.
Hox, J.J. (1995). Applied Multilevel Analysis. Amsterdam, TT-Publicaties.
Jencks, C. and Mayer, S. (1990) The Social Consequences of Growing up in Poor Neighbourhood’ in L. Lynn and M. McGeary (eds.) Inner City Poverty in the United States pp.151-186 Washington DC: National Academic Press.
Johnson Jr., O. (2008). “Who Benefits from Concentrated Affluence? A Synthesis of Neighborhood Effects Considering Race, Gender, and Education Outcomes.” Journal of Public Management and Social Policy, unpublished manuscript. University of California.
Johnston, R., Burgess, S., Wilson, D. and Harris, R. (2006a). “School and residential ethnic segregation: An analysis of variations across England’s Local Education Authorities.” The Centre for Market and Public Organisation (CMPO), University of Bristol, Working paper 06/145.
Johnston, R., Burgess, S., Harris, R. and Wilson, D. (2006b). “ ‘Sleep-Walking Towards Segregation?’ The Changing Ethnic Composition of English Schools 1997-2003. An Entry Cohort Analysis.” The Centre for Market and Public Organisation (CMPO), University of Bristol, Working paper 06/155.
Johnston, R., Sirkeci, I., Khattab, N., Modood, T. (2010). “Ethno-religious categories and measuring occupational attainment in relation to education in England and Wales: a multilevel analysis.” Environment and Planning A, 42, 578-591.
Johnston, R., Wilson, D., and Burgess, S. (2004). “School segregation in multi-ethnic England.” Ethnicities, 4 (2), 237-265.
Johnston, R., Wilson, D., and Burgess, S. (2005). “England’s multiethnic educational system? A classification of secondary schools.” Environment and Planning A, 37, 45-62.
Johnston, R., Wilson, D., and Burgess, S. (2006). “Ethnic segregation and educational performance at secondary school in Bradford and Leicester.” The Centre for Market and Public Organisation (CMPO), University of Bristol, Working paper 06/142.
Johnston, R., Burgess, S., Wilson, D. and Harris, R. (2006a). “School and residential ethnic segregation: An analysis of variations across England’s Local Education Authorities.” The Centre for Market and Public Organisation (CMPO), University of Bristol, Working paper 06/145.
KANEP/GSEE, (2008), “Education policy scenarios: educational priority areas”, The system of access in tertiary education (data 2004-2006), Volume 12, Centre for Educational Policy Development/General Confederation of Greek Workers, Athens, October 2008. http://www.kanep-gsee.gr/ (in Greek)
KANEP/GSEE, (2009), The basic figures of Greek education 2009 (primary and secondary education) – Educational inequities, Centre for Educational Policy Development/General Confederation of Greek Workers, Athens, October 2009. http://www.kanep-gsee.gr/ (in Greek)
KANEP/GSEE, (2011), The basic figures of Greek education 2010 (primary and secondary education), Centre for Educational Policy Development/General Confederation of Greek Workers, Athens, January 2011. http://www.kanep-gsee.gr/ (in Greek)
Kasarda, J. D. (1993). “Inner-city concentrated poverty and neighborhood distress: 1970-1990.” Housing Policy Debate, 4, 253-302.
La Ferrara, E. & Marcellino, M. (2004). TFP, Costs, and Public Infrastructure: An Equivocal Relationship. Bocconi University and IGIER.
Labrianidis, L. (1995). “Establishing universities as a policy for local economic development: an assessment of the direct economic impact - Three Greek Universities”, Higher Education Policy, 8 (2), 55-62.
Labrianidis L. (2011) Investing in leaving: The Greek case of international migration of professionals in the globalization era, Athens, Kritiki (in Greek)
Lackenbauer, J. (2004a). “Catching-up, Regional Disparities and EU Cohesion Policy: The Case of Hungary.” Managing Global Transitions, 2, 123-162.
Lackenbauer, J. (2004b). “Transition and Regional Income Inequalities in Hungary: A Case for Regional Innovation, Education and Housing Policies.” In: Kruszka, M. (Ed.): Unification of European Economies: Opportunities and Threats, WWZ, Warsaw 2004, pp. 31-46.
THE REGIONAL DIMENSION OF EDUCATIONAL INEQUALITY IN THE EU
166
Lefebvre, H. (1991) The Production of Space. Oxford: Blackwell.
Leventhal, T. and Brooks-Gunn, J. (2000) ‘The Neighborhoods they Live in: the Effects of Neighborhood Residence on Child and Adolescent Outcomes’, Psychological Bulletin 126 (2):309-37
Liefner, I. (2009). “Spatial Disparities of Knowledge Absorption, Technological Change, and Prosperity: Theoretical Considerations and Empirical Evidence from China”. In: Köchendorfer-Lucius, G. &Pleskovič, B. (eds.) Spatial Disparities and Development Policy, Berlin Workshop Series. Washington DC: The International Bank for Reconstruction and Development / The World Bank, pp. 71-80.
Lindvall, L. (2009). “Neighbourhoods, economic incentives and post compulsory education choices.” Institute for Labour Market Policy Evaluation (IFAU), Uppsala. Working Paper 2009:11.
López-Bazo, E. & Moreno Serrano, R. (2008). “Regional variability in the impact of human capital on regional growth.” Research Institute of Applied Economics, Working Papers 2008/17.
López-Bazo, E. & Motellón, E. (2009). “Human Capital and Regional Wage Gaps.” Research Institute of Applied Economics, Working Papers 2009/24.
Lupton, R. and Kintrea, K (2011,) Can Community-Based Interventions on Aspirations Raise Young People’s Attainment? Social Policy and Society 10 (3), pp.321-335.
Lupton, R. and Kneale, D. (2011) “Theorising and Measuring Place in Neighbourhood Effects Research: The Example of Teenage Parenthood in England”. in van Ham M., Manley D., Bailey N., Simpson L. &Maclennan D. (eds) (2011) Neighbourhood Effects Research: New Perspectives. Dordrecht:Springer:
Maier, G., Kurka, B. and Trippl, M. (2007). “Knowledge Spillover Agents and Regional Development: Spatial Distribution and Mobility of Star Scientists.” DYNREG, Dynamic Regions in a Knowledge-Driven Global Economy, Lessons and Policy Implications for the EU, Working Paper, 17/2007.
Martin, P. (1998). “Can Regional Policies Affect Growth and Geography in Europe?” The World Economy, 21 (6), 757–774.
Martin, P. (1999). “Are European regional policies delivering?” European Investment Bank Papers 4 (2), 10–23.
Mendolicchio, C. (2006). “A Disaggregate Analysis of Private Returns to Education in Italy.” Département de Sciences Économiques de l’Université catholique de Louvain, Discussion Paper 2006-54.
NESSE (2010). The Dark Side of the Whiteboard –education, poverty, inequalities and social exclusion. Paper authored for the European Commission by prof. Roger Dale on behalf of the NESSE network of experts for distribution at the Belgian EU Presidency conference on education and social inclusion, Ghent, 28-29 September 2010.
Noble, M., Wright, G., Dibben, C., Smith, G., McLennan, D., Anttila, C., Barnes, H., Mokhtar, C., Noble, S., Gardner, J., Braswell, S., Covizzi, I. and Lloyd, M. (2004). The English Indices of Deprivation 2004. Office of the Deputy Prime Minister, London.
Nuttall, D.L., Goldstein, H., Prosser, R. and Rasbash, J. (1989). “Differential school effectiveness.” International Journal of Educational Research, 13, 769-776
Ramos, R., Surinach, J. and Artís, M. (2009). “Regional Economic Growth and Human Capital: The Role of Overeducation.” IZA Discussion Paper Series, September 2009, IZA DP No. 4453.
Rasbash, J.R. & Browne, W.J. (2001). “Modelling non-hierarchical structures.” In: Leyland, A.H. & Goldstein, H. (Eds.) Multilevel modelling of health statistics. Chichester: John Wiley and Sons, pp. 93-105.
Raudenbush, S. & Bryk, A. (1986). "A Hierarchical Model for Studying School Effects." Sociology of Education, 59, 1-17.
Raudenbush, S. & Bryk, A. (2002). Hierarchical Linear Models: Applications and Data Analysis Methods, 2nd edition. Advanced Quantitative Techniques in the Social Sciences Series. Thousand Oaks: Sage.
Rodríguez-Pose, A. & Fratesi, U. (2004). “Between Development and Social Policies: The Impact of European Structural Funds in Objective 1 Regions.” Regional Studies, 38 (1), 97-113.
Rodríguez-Pose, A. & Tselios, V. (2009). “Education and Income Inequality In The Regions Of The European Union.” Journal of Regional Science, 49 (3), 411–437.
Rodríguez-Pose, A. & Vilalta-Bufi, M. (2005). “Education, migration, and job satisfaction: the regional returns of human capital in the EU.” Journal of Economic Geography, 5, 545-566.
Ross, A. (2009). “Educational Policies that Address Social Inequality” EPASI Report, February 2009.
Sampson, R., Morenoff, J. and Gannon-Rowley, T. (2002) ‘Assessing “Neighborhood Effects”: Social Processes and New Directions in Research, American Review of Sociology 28, 443- 478.
Sanbonmatsu, L., Kling, J. Duncan, G. and Brooks-Gunn, J. (2006) .Neighborhoods and Academic Achievement: Results from Moving to Opportunity Experiment, Journal of Human Resources, 41 (4) 649-691
THE REGIONAL DIMENSION OF EDUCATIONAL INEQUALITY IN THE EU
167
Serrano, G. &Cabrer, B. (2004).“The effect of knowledge spillovers on productivity growth inequalities in Spanish regions.”Environment and Planning A, 36, 731 – 753
Serrano, G. & Cabrer, B. (2004). “The effect of knowledge spillovers on productivity growth inequalities in Spanish regions.” Environment and Planning A, 36, 731 – 753.
Singleton, A.D. (2004). “A State of the Art Review of Geodemographics and their Applicability to the Higher Education Market.” Centre for Advanced Spatial Analysis, London. CASA Working Paper 74.
Singleton, A., Davidson-Burnett, G. and Longley, P. (2007). “University Market Area Analysis for Widening Participation.” Centre for Education in the Built Environment, London. CEBE Working Paper 12.
Snijders, T.A.B. & Bosker, R.J. (1999). Multilevel Analysis: An Introduction to Basic and multilevel modeling. London etc.: Sage Publications, 1999.
Suedekum, J. (2005). “The Pitfalls of Regional Education Policy.” Finanzarchiv N F, 61 (3), 327-352.
Sykes, B. & Musterd, S. (2010). “Examining Neighbourhood and School Effects Simultaneously: What Does the Dutch Evidence Show?” Urban Studies [Online), 1-25. http://usj.sagepub.com/content/early/2010/08/31/0042098010371393 [Accessed 9 December 2010].
Szapocznik, J., Lombard, J., Martinez, F., Mason, C.A., Gorman-Smith, D., Plater-Zyberk, E., Brown, S.C., and Spokane, A. (2006). American Journal of Community Psychology, 38 (3–4), 299–310.
Taylor, I., Evans, K. and Fraser, P. (1996) A Tale of Two Cities: global change, local feeling and everyday life in the North of England: A study in Manchester and Sheffield. London and New York: Routledge.
Taylor, C. (2001) The geography of choice and diversity in the 'new' secondary education market of England, Area, 33, 4, 368-381
Thomas, B., Pritchard, J., Ballas, D., Vickers, D. and Dorling, D. (2009). A Tale of Two Cities: The Sheffield Project. [Online] The University of Sheffield: Social and Spatial Inequalities Research Group (SASI). November 2009. [Accessed 9 December 2010]. http://www.sasi.group.shef.ac.uk/research/sheffield/index.html Thomson, P. (2002) Schooling the Rustbelt Kids. Stoke-on-Trent: Trentham Books.
Thrupp, M. (1999).School Making A Difference, Lets Be Realistic! Buckingham, Open University Press.
Tondl, G. & Vuksic, G. (2003). “What makes regions in Eastern Europe catching up? The role of foreign investment, human resources and geography.” IEF May 2003, Working Paper 51.
Van der Ploeg, F. & Veugelers, R. (2008). “Towards Evidence-based Reform of European Universities.” CESifo Economic Studies, 54, (2), 99–120.
Wilkinson, R. &Pickett, K. (2009) The Spirit Level - Why More Equal Societies Almost Always Do Better, Allen Lane.
Willis, P. (1977). Learning to Labour. Farnborough, Saxon House.
Wilson, W.J. (1996). When Work Disappears: The World of the New Urban Poor. New York: Alfred A. Knopf.
Woolley, M.E., Grogan-Kaylor, A., Gilster, M. E., Karb, R.A., Gant, L.M., Reischl, T.M., and Alaimo, K. (2008). “Neighborhood Social Capital, Poor Physical Conditions, and School Achievement.” Children & Schools. 30 (3), 133-145.
Wostner, P. & Šlander, S. (2009). “The Effectiveness of EU Cohesion Policy Revisited: Are EU Funds Really Additional?” EPRC European Policies Research Centre, University of Strathclyde, European Policy Research Paper No 69, November 2009.
Young, M. (1971) Knowledge and Control: New Directions for the Sociology of Education. London: Collier Macmillan.
Zhang, X. & Fan, S. (2004). “Public investment and regional inequality in rural China.” Agricultural Economics, 30, 89–100.

THE REGIONAL DIMENSION OF EDUCATIONAL INEQUALITY IN THE EU
168
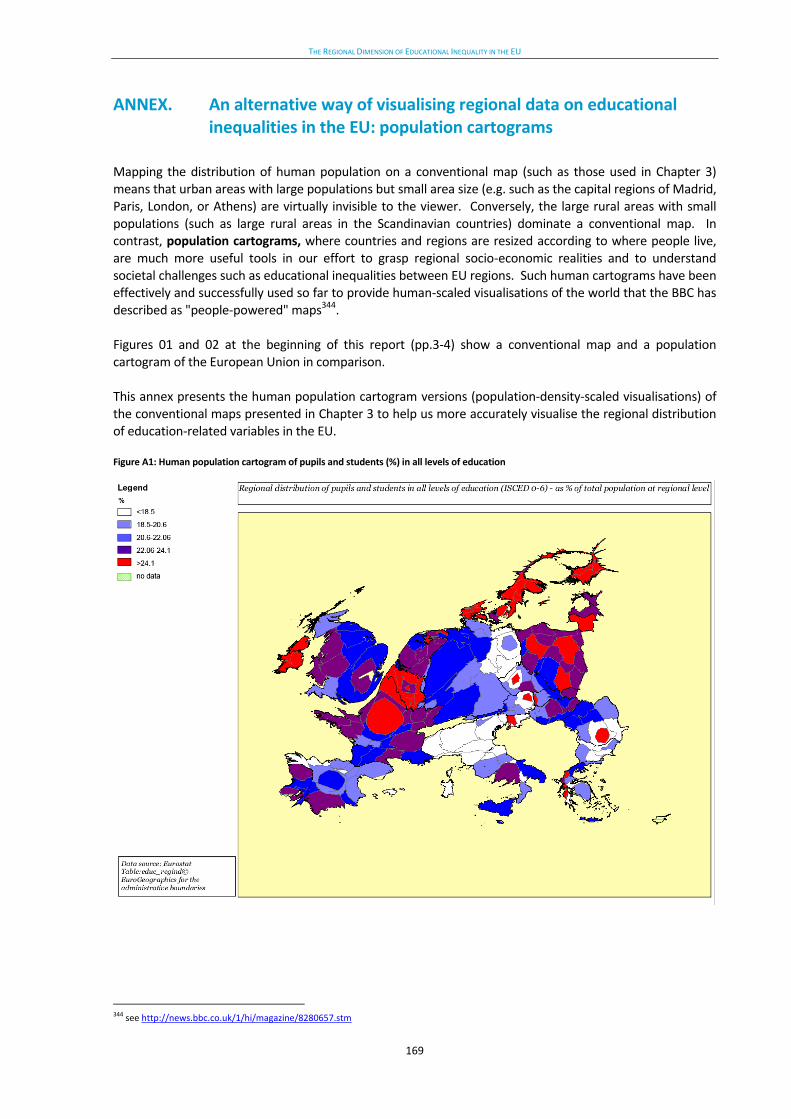
THE REGIONAL DIMENSION OF EDUCATIONAL INEQUALITY IN THE EU
169
ANNEX. An alternative way of visualising regional data on educational inequalities in the EU: population cartograms
Mapping the distribution of human population on a conventional map (such as those used in Chapter 3) means that urban areas with large populations but small area size (e.g. such as the capital regions of Madrid, Paris, London, or Athens) are virtually invisible to the viewer. Conversely, the large rural areas with small populations (such as large rural areas in the Scandinavian countries) dominate a conventional map. In contrast, population cartograms, where countries and regions are resized according to where people live, are much more useful tools in our effort to grasp regional socio-economic realities and to understand societal challenges such as educational inequalities between EU regions. Such human cartograms have been effectively and successfully used so far to provide human-scaled visualisations of the world that the BBC has described as "people-powered" maps344. Figures 01 and 02 at the beginning of this report (pp.3-4) show a conventional map and a population cartogram of the European Union in comparison. This annex presents the human population cartogram versions (population-density-scaled visualisations) of the conventional maps presented in Chapter 3 to help us more accurately visualise the regional distribution of education-related variables in the EU. Figure A1: Human population cartogram of pupils and students (%) in all levels of education
344 see http://news.bbc.co.uk/1/hi/magazine/8280657.stm
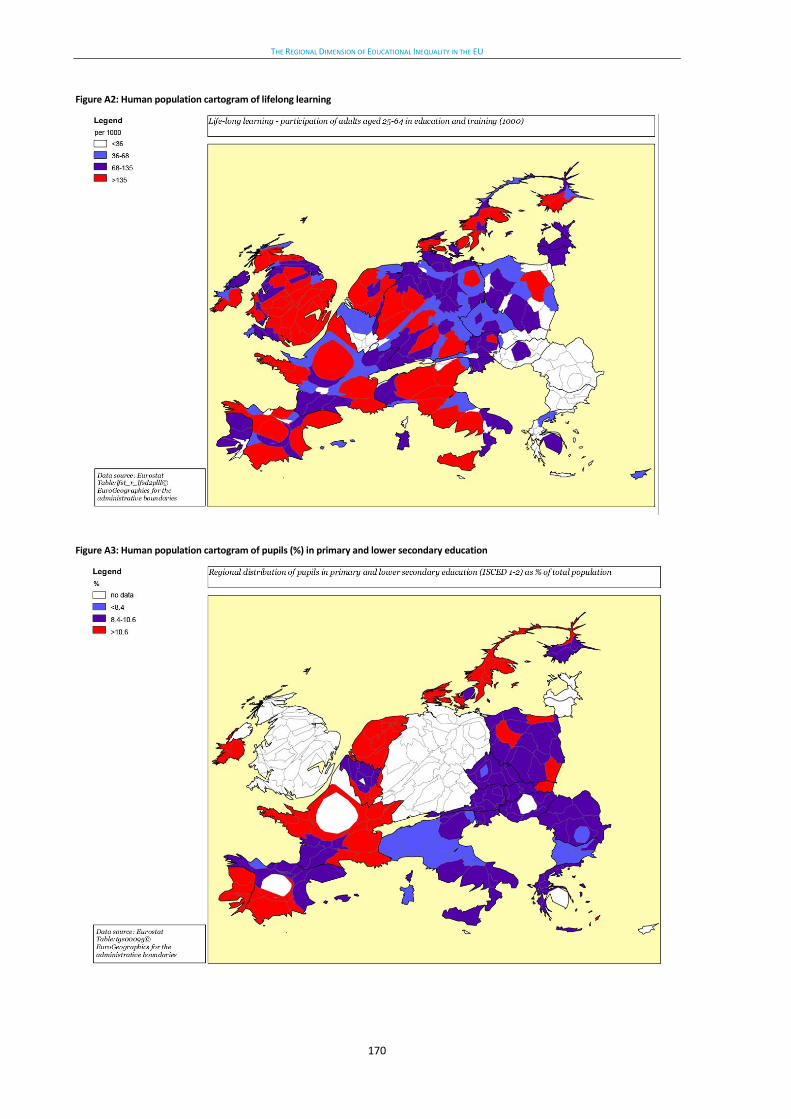
THE REGIONAL DIMENSION OF EDUCATIONAL INEQUALITY IN THE EU
170
Figure A2: Human population cartogram of lifelong learning
Figure A3: Human population cartogram of pupils (%) in primary and lower secondary education
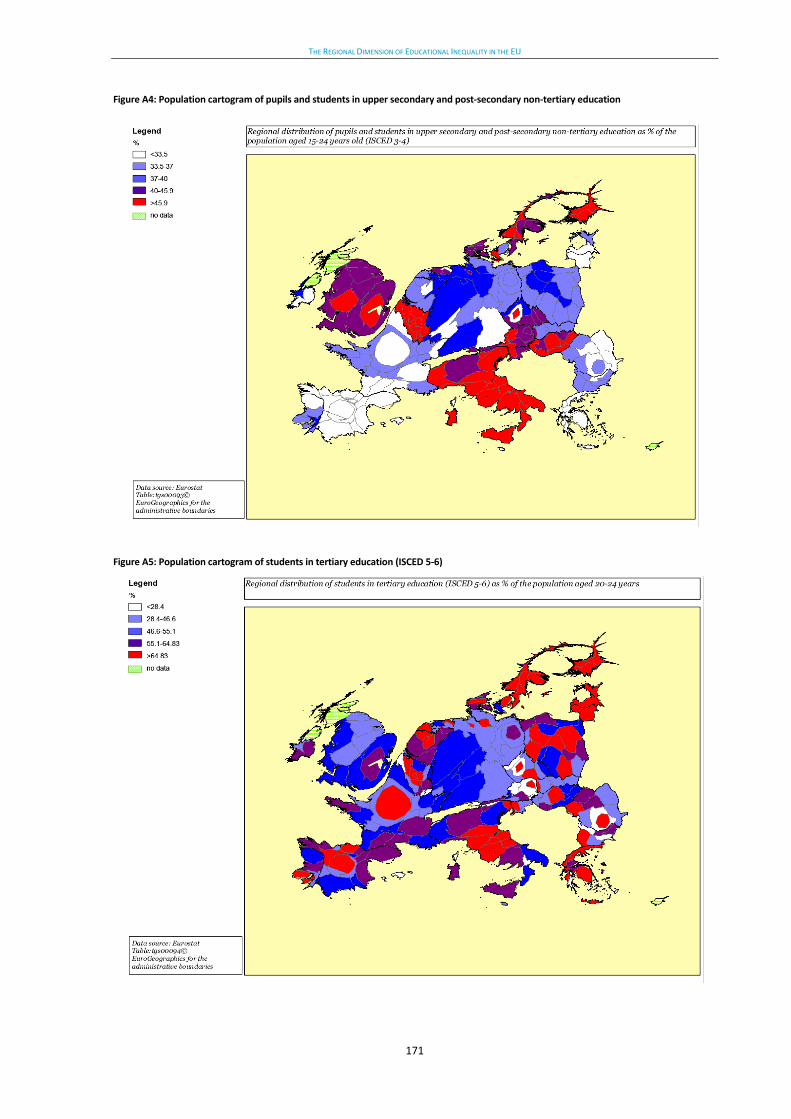
THE REGIONAL DIMENSION OF EDUCATIONAL INEQUALITY IN THE EU
171
Figure A4: Population cartogram of pupils and students in upper secondary and post-secondary non-tertiary education
Figure A5: Population cartogram of students in tertiary education (ISCED 5-6)
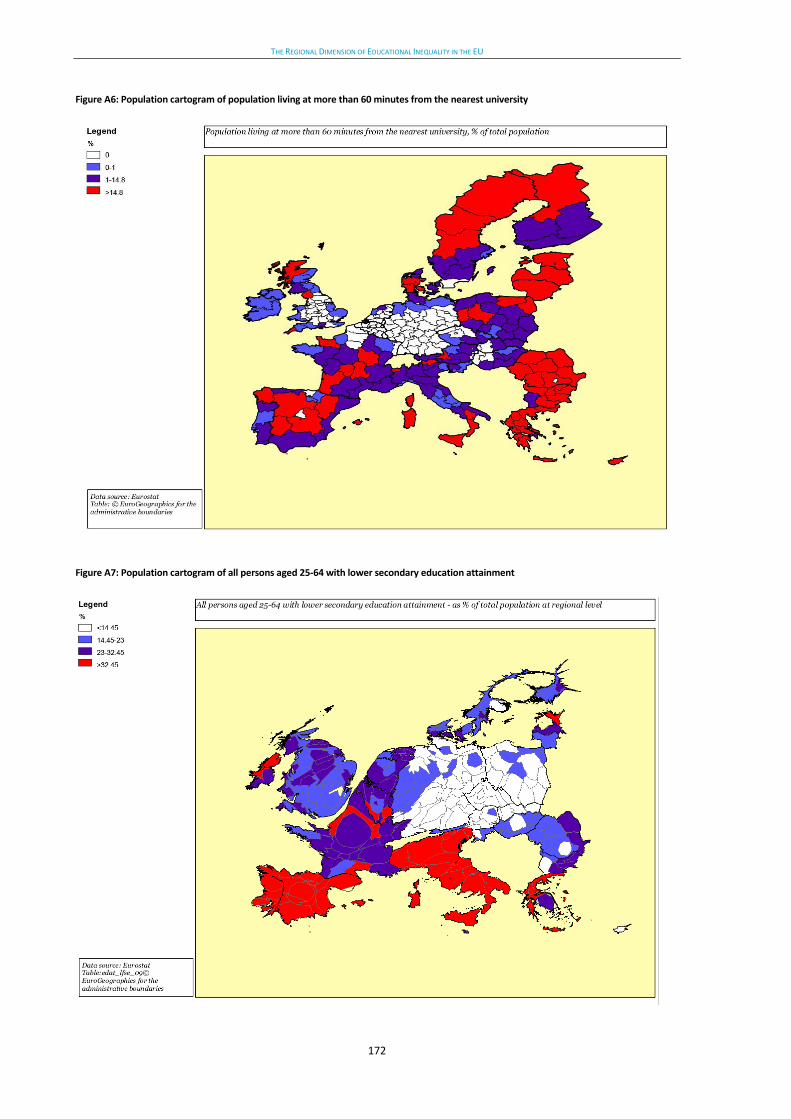
THE REGIONAL DIMENSION OF EDUCATIONAL INEQUALITY IN THE EU
172
Figure A6: Population cartogram of population living at more than 60 minutes from the nearest university
Figure A7: Population cartogram of all persons aged 25-64 with lower secondary education attainment
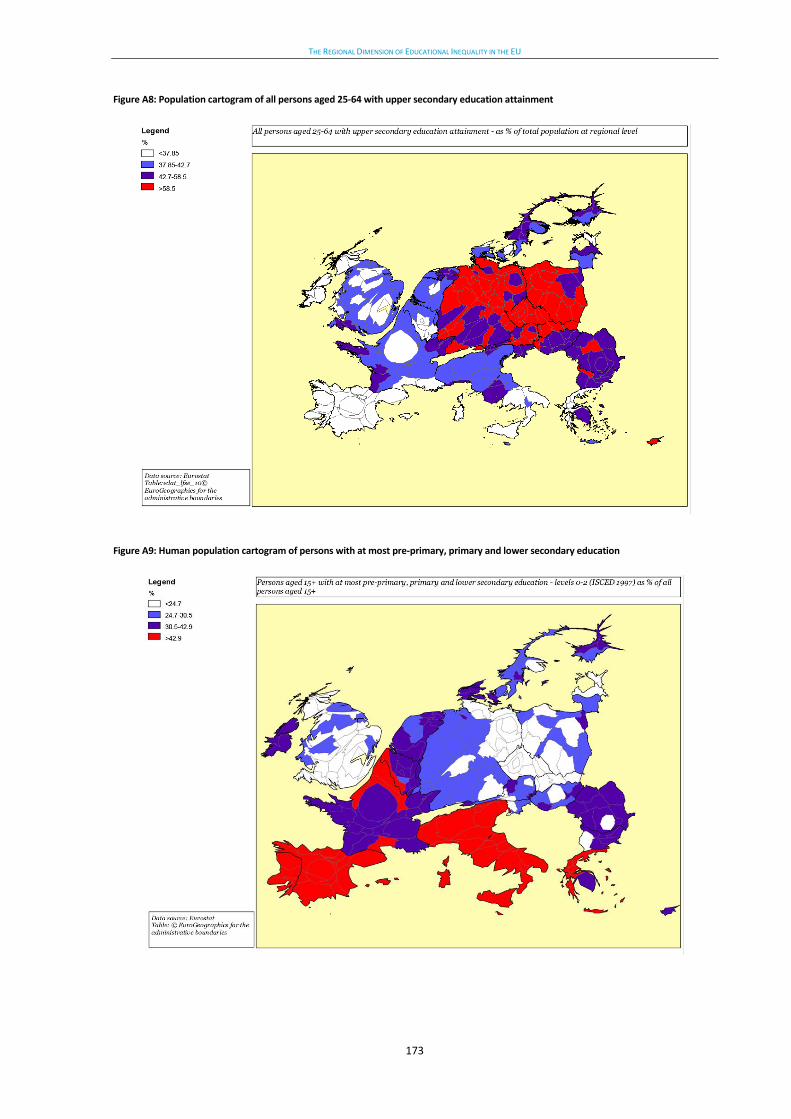
THE REGIONAL DIMENSION OF EDUCATIONAL INEQUALITY IN THE EU
173
Figure A8: Population cartogram of all persons aged 25-64 with upper secondary education attainment
Figure A9: Human population cartogram of persons with at most pre-primary, primary and lower secondary education
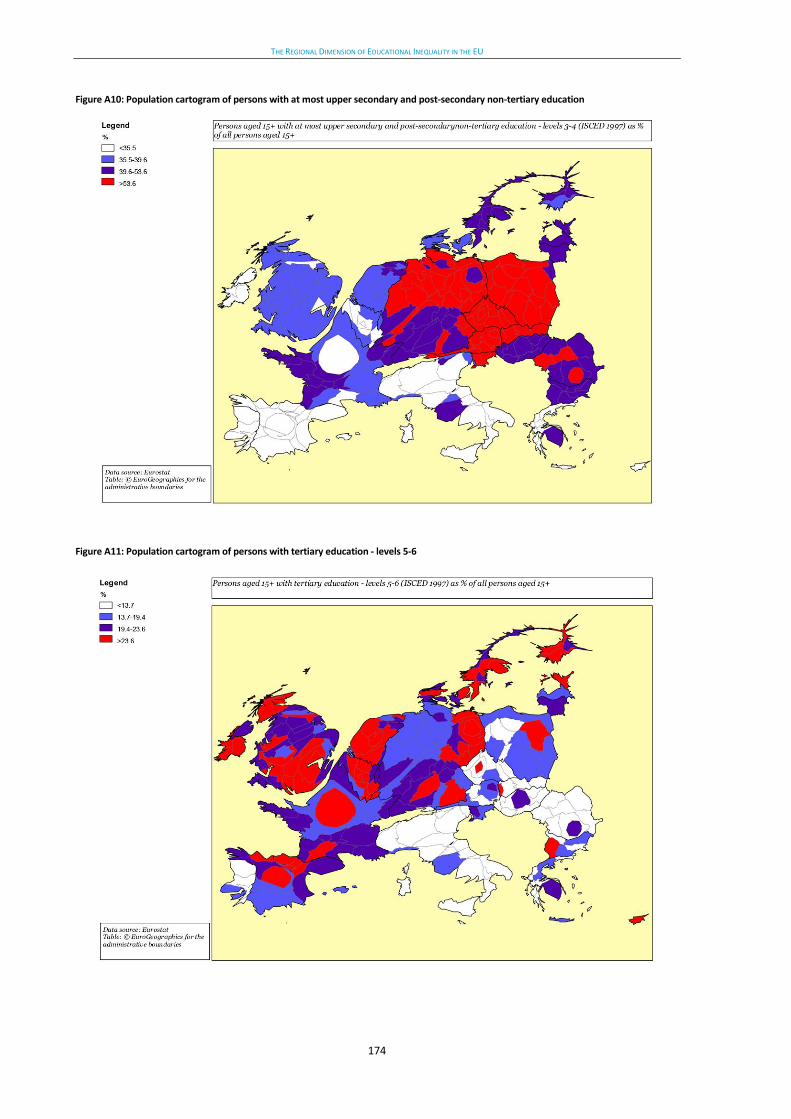
THE REGIONAL DIMENSION OF EDUCATIONAL INEQUALITY IN THE EU
174
Figure A10: Population cartogram of persons with at most upper secondary and post-secondary non-tertiary education
Figure A11: Population cartogram of persons with tertiary education - levels 5-6


![Entry: Cartogram [1883 WORDS] - by Danny Dorling ... · Vol. 6: Dorling/Cartogram/entry Not to be included in final draft – but here is Waldo’s hand drawn version of Figure 2](https://img.pdfslide.us/doc/110x75/5fc794bfd6f53e3b665aea56/entry-cartogram-1883-words-by-danny-dorling-vol-6-dorlingcartogramentry.jpg)


![Entry: Cartogram [1883 WORDS] - by Danny Dorling (University of … · 2016. 1. 8. · Vol. 6: Dorling/Cartogram/entry be taken more seriously than traditional cartographic treatments](https://img.pdfslide.us/doc/110x75/609a38c74e6b8a0338263eef/entry-cartogram-1883-words-by-danny-dorling-university-of-2016-1-8-vol.jpg)