Embed Size (px)
Citation preview
www.actamat-journals.com
Acta Materialia 54 (2006) 1513–1523
Micromechanical modeling of isotropic elastic behaviorof semicrystalline polymers
F. Bedoui, J. Diani *, G. Regnier, W. Seiler
Laboratoire d’Ingenierie des Materiaux (LIM, UMR CNRS 8006), ENSAM, 151 bd de l’Hopital 75013 Paris, France
Received 19 May 2005; received in revised form 10 November 2005; accepted 11 November 2005Available online 20 January 2006
Abstract
Considering semicrystalline polymers as heterogeneous materials consisting of an amorphous phase and crystallites, several microme-chanical models have been tested to predict their elastic behavior. Two representations have been considered: crystallites embedded in amatrix and a layered-composite aggregate. Several homogenization schemes have been used in these representations. Firstly, compari-sons between the models and experiments show that the micromechanics approach applies at this scale. Secondly, the results differaccording to the rubbery or glassy state of the amorphous phase. Finally, the results suggest that the spherulitic mesostructure doesnot affect the material behavior while infinitesimal elastic strains are considered.� 2005 Acta Materialia Inc. Published by Elsevier Ltd. All rights reserved.
Keywords: Polymers; Micromechanical modeling; Elastic behavior; Microstructure; X-ray diffraction
1. Introduction
Semicrystalline polymers are increasingly being used asstructural materials. Much work has focused on the pre-diction of the crystallinity and microstructure morphol-ogy of these materials [1–4], and several methods havebeen developed to characterize this microstructure byoptical microscopy or scanning electron microscopy(SEM) after an etching processing [5] or by X-ray scat-tering [6]. Less work has been done in terms of relatingthe microstructure to the mechanical behavior. Semicrys-talline polymers may be considered as heterogeneousmaterials, and micromechanical models can be used toestimate or predict their mechanical properties. Recentwork [7–10] has explored this area, focusing on large-strain-scale elastoplastic or elastoviscoplastic behaviors.Very little work has been done at the small-strain level
1359-6454/$30.00 � 2005 Acta Materialia Inc. Published by Elsevier Ltd. All
doi:10.1016/j.actamat.2005.11.028
* Corresponding author. Fax: +33 1 44 24 69 90/62 90.E-mail address: [email protected] (J. Diani).
[11]. Even less is known about the elasticity of thesematerials.
Previous work [12] has made it possible to understand aparadox involving polypropylene (PP) and polyethylene(PE) using micromechanical modeling. It has been shownthat using a micromechanics approach may help explainwhy PP is more rigid than PE despite a lower crystallinityand less rigid amorphous and crystalline phases. Beyondthis qualitative result, the applicability of micromechanicalmodeling for the quantitative prediction of the elastic prop-erties of semicrystalline polymers remains an issue. In orderto decide whether micromechanical modeling applies at thescale of the crystallites, three semicrystalline polymers areconsidered: an isotactic PP, a PE, and a polyethylene tere-phthalate (PET) crystallized by annealing. Firstly, themechanical properties of the homogeneous materials weremeasured and the results considered in terms of crystallin-ity. Secondly, the microstructure was observed and thecrystallite lamellae dimensions were estimated when possi-ble. Finally, considering two schematic representationsand several homogenization schemes, the estimates of themodels were compared with experimental data.
rights reserved.
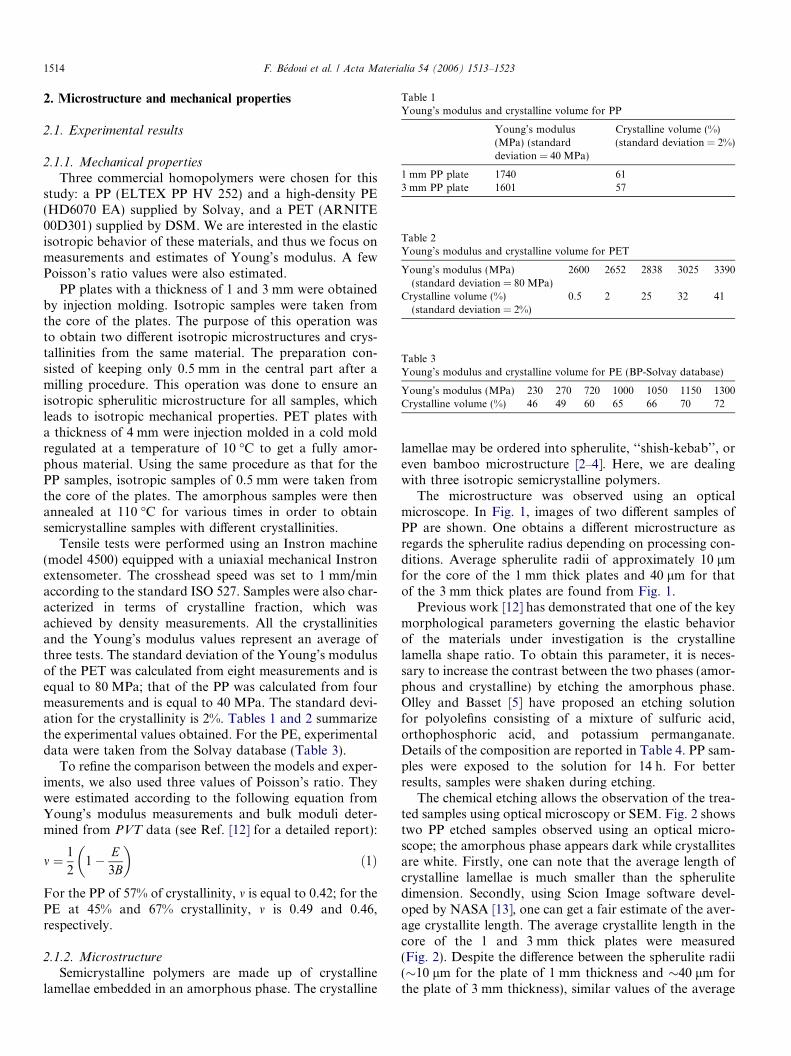
Table 1Young’s modulus and crystalline volume for PP
Young’s modulus(MPa) (standarddeviation = 40 MPa)
Crystalline volume (%)(standard deviation = 2%)
1 mm PP plate 1740 613 mm PP plate 1601 57
Table 2Young’s modulus and crystalline volume for PET
Young’s modulus (MPa)(standard deviation = 80 MPa)
2600 2652 2838 3025 3390
Crystalline volume (%)(standard deviation = 2%)
0.5 2 25 32 41
Table 3Young’s modulus and crystalline volume for PE (BP-Solvay database)
Young’s modulus (MPa) 230 270 720 1000 1050 1150 1300Crystalline volume (%) 46 49 60 65 66 70 72
1514 F. Bedoui et al. / Acta Materialia 54 (2006) 1513–1523
2. Microstructure and mechanical properties
2.1. Experimental results
2.1.1. Mechanical properties
Three commercial homopolymers were chosen for thisstudy: a PP (ELTEX PP HV 252) and a high-density PE(HD6070 EA) supplied by Solvay, and a PET (ARNITE00D301) supplied by DSM. We are interested in the elasticisotropic behavior of these materials, and thus we focus onmeasurements and estimates of Young’s modulus. A fewPoisson’s ratio values were also estimated.
PP plates with a thickness of 1 and 3 mm were obtainedby injection molding. Isotropic samples were taken fromthe core of the plates. The purpose of this operation wasto obtain two different isotropic microstructures and crys-tallinities from the same material. The preparation con-sisted of keeping only 0.5 mm in the central part after amilling procedure. This operation was done to ensure anisotropic spherulitic microstructure for all samples, whichleads to isotropic mechanical properties. PET plates witha thickness of 4 mm were injection molded in a cold moldregulated at a temperature of 10 �C to get a fully amor-phous material. Using the same procedure as that for thePP samples, isotropic samples of 0.5 mm were taken fromthe core of the plates. The amorphous samples were thenannealed at 110 �C for various times in order to obtainsemicrystalline samples with different crystallinities.
Tensile tests were performed using an Instron machine(model 4500) equipped with a uniaxial mechanical Instronextensometer. The crosshead speed was set to 1 mm/minaccording to the standard ISO 527. Samples were also char-acterized in terms of crystalline fraction, which wasachieved by density measurements. All the crystallinitiesand the Young’s modulus values represent an average ofthree tests. The standard deviation of the Young’s modulusof the PET was calculated from eight measurements and isequal to 80 MPa; that of the PP was calculated from fourmeasurements and is equal to 40 MPa. The standard devi-ation for the crystallinity is 2%. Tables 1 and 2 summarizethe experimental values obtained. For the PE, experimentaldata were taken from the Solvay database (Table 3).
To refine the comparison between the models and exper-iments, we also used three values of Poisson’s ratio. Theywere estimated according to the following equation fromYoung’s modulus measurements and bulk moduli deter-mined from PVT data (see Ref. [12] for a detailed report):
m ¼ 1
21� E
3B
� �ð1Þ
For the PP of 57% of crystallinity, m is equal to 0.42; for thePE at 45% and 67% crystallinity, m is 0.49 and 0.46,respectively.
2.1.2. Microstructure
Semicrystalline polymers are made up of crystallinelamellae embedded in an amorphous phase. The crystalline
lamellae may be ordered into spherulite, ‘‘shish-kebab’’, oreven bamboo microstructure [2–4]. Here, we are dealingwith three isotropic semicrystalline polymers.
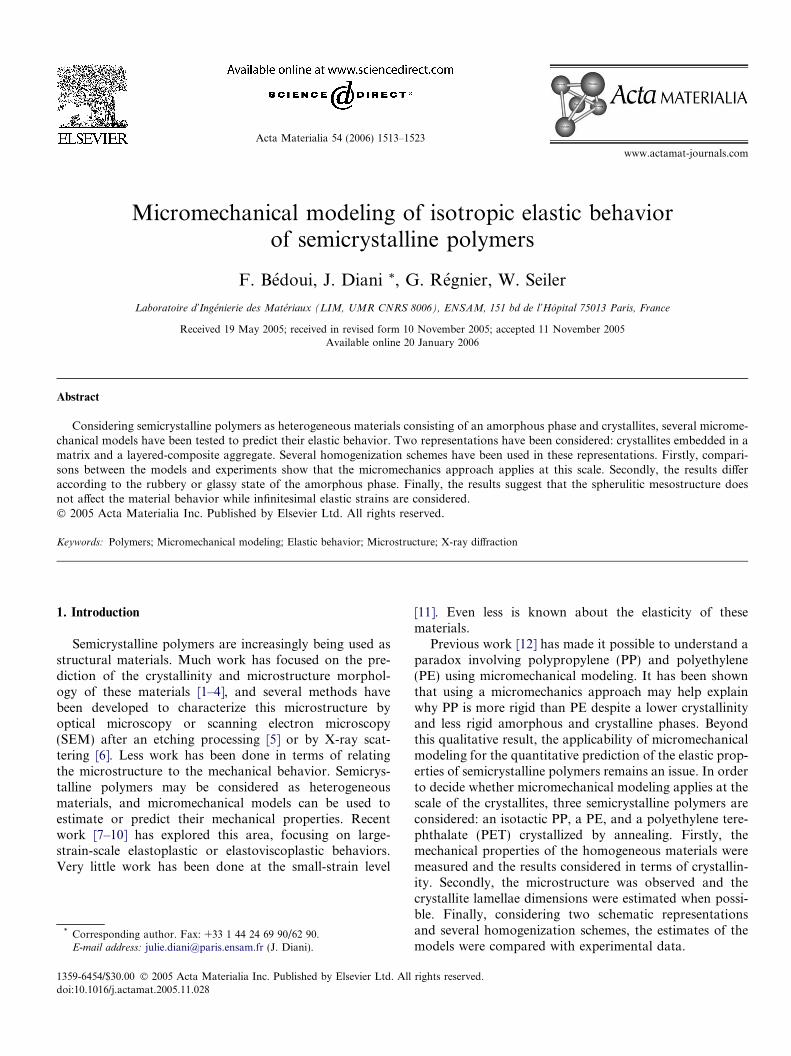
The microstructure was observed using an opticalmicroscope. In Fig. 1, images of two different samples ofPP are shown. One obtains a different microstructure asregards the spherulite radius depending on processing con-ditions. Average spherulite radii of approximately 10 lmfor the core of the 1 mm thick plates and 40 lm for thatof the 3 mm thick plates are found from Fig. 1.
Previous work [12] has demonstrated that one of the keymorphological parameters governing the elastic behaviorof the materials under investigation is the crystallinelamella shape ratio. To obtain this parameter, it is neces-sary to increase the contrast between the two phases (amor-phous and crystalline) by etching the amorphous phase.Olley and Basset [5] have proposed an etching solutionfor polyolefins consisting of a mixture of sulfuric acid,orthophosphoric acid, and potassium permanganate.Details of the composition are reported in Table 4. PP sam-ples were exposed to the solution for 14 h. For betterresults, samples were shaken during etching.
The chemical etching allows the observation of the trea-ted samples using optical microscopy or SEM. Fig. 2 showstwo PP etched samples observed using an optical micro-scope; the amorphous phase appears dark while crystallitesare white. Firstly, one can note that the average length ofcrystalline lamellae is much smaller than the spherulitedimension. Secondly, using Scion Image software devel-oped by NASA [13], one can get a fair estimate of the aver-age crystallite length. The average crystallite length in thecore of the 1 and 3 mm thick plates were measured(Fig. 2). Despite the difference between the spherulite radii(�10 lm for the plate of 1 mm thickness and �40 lm forthe plate of 3 mm thickness), similar values of the average
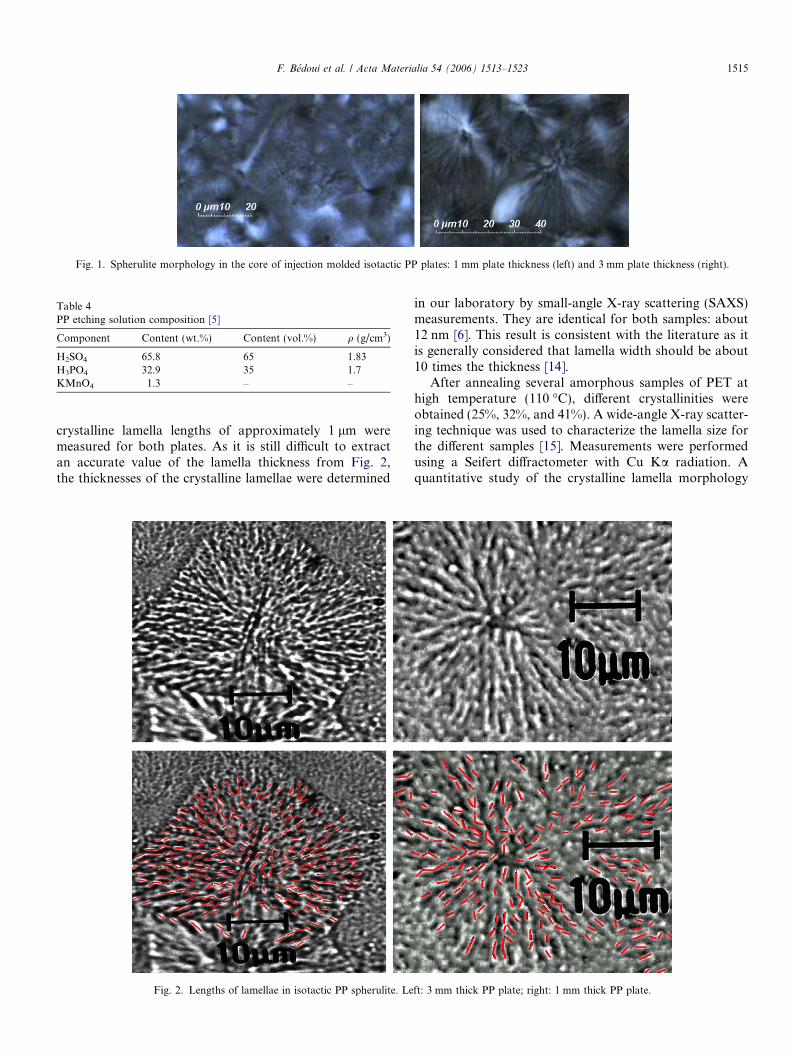
Fig. 1. Spherulite morphology in the core of injection molded isotactic PP plates: 1 mm plate thickness (left) and 3 mm plate thickness (right).
Table 4PP etching solution composition [5]
Component Content (wt.%) Content (vol.%) q (g/cm3)
H2SO4 65.8 65 1.83H3PO4 32.9 35 1.7KMnO4 1.3 – –
F. Bedoui et al. / Acta Materialia 54 (2006) 1513–1523 1515
crystalline lamella lengths of approximately 1 lm weremeasured for both plates. As it is still difficult to extractan accurate value of the lamella thickness from Fig. 2,the thicknesses of the crystalline lamellae were determined
Fig. 2. Lengths of lamellae in isotactic PP spherulite. Le
in our laboratory by small-angle X-ray scattering (SAXS)measurements. They are identical for both samples: about12 nm [6]. This result is consistent with the literature as itis generally considered that lamella width should be about10 times the thickness [14].
After annealing several amorphous samples of PET athigh temperature (110 �C), different crystallinities wereobtained (25%, 32%, and 41%). A wide-angle X-ray scatter-ing technique was used to characterize the lamella size forthe different samples [15]. Measurements were performedusing a Seifert diffractometer with Cu Ka radiation. Aquantitative study of the crystalline lamella morphology
ft: 3 mm thick PP plate; right: 1 mm thick PP plate.
1516 F. Bedoui et al. / Acta Materialia 54 (2006) 1513–1523
was carried out through a 2h integration. Peak profileswere deconvoluted using ORIGIN software [16]. Crystal-line peaks were analyzed as Pearson VII curves. The firstcrystallographic plane of interest is (105); its normal isclose to the chain axis direction and consequently providesinformation on the lamella thickness. Planes (100) and(010) provide dimensions for lamella width and length,respectively. Crystal sizes along directions that are normalto these planes are calculated using the Scherrer relation:
Lhkl ¼k � k
cos hhkl � Dhhklð2Þ
where Dhhkl is the angular width of the diffracted (hkl)plane band and k is a proportionality factor equal to 0.9.The parameter Dhhkl is usually considered as the width ofthe peak at its mid-height. The planes (105), (100), and(010) are recorded at 2h angles of 65.8�, 33.8�, and 24.9�for Cu Ka radiation [17]. Fig. 3 shows a 2h diffraction pat-tern for the sample of 32% crystallinity.
Table 5 shows values obtained using Eq. (2) for crystal-line lamella length, width, and thickness for the differentcrystallinities.
For PE, the chemical etching method of Olley andBasset [5] did not give us accurate images to determinethe lamella dimensions and only the lamella thickness canbe obtained using SAXS [18]. The microstructure has beenproved to be spherulitic, but lamella dimensions are diffi-cult to estimate. Hence, micromechanical modeling is usedin Section 4 to estimate lamella dimensions regarding theexperimental values of Young’s modulus vs. crystallinity.
10080604020
0.0
3
3
3
3
4
1.2x10
1.0x10
8.0x10
6.0x10
4.0x10
2.0x10
4
)011(
Inte
nsity
2θ )˚( elgnA
)501(
suohpromA
)010( )001(
ecruos rC
Fig. 3. Deconvolution of PET diffraction peaks for a sample of 32%crystallinity.
Table 5PET crystalline lamella dimensions
Crystalline volume (%) Length (nm) Width (nm) Thickness (nm)
25 31 29 1532 30 32 1541 32 30 14
2.2. Mechanical properties of constitutive phases
2.2.1. Crystalline phase
The crystalline phase consists of polymer lamellae,which show a highly anisotropic behavior with a very highmodulus along the chain axis. Elastic constants have beentheoretically calculated for several materials and arereviewed by Ward [19].
PP chains have a helical conformation angle [20]. Thetheoretical stiffness tensor has been calculated by Tashiroet al. [21]:
CcPP ¼
7:78 3:91 3:72 0 0:9 0
3:91 11:55 3:99 0 �0:36 0
3:72 3:99 42:44 0 �0:57 0
0 0 0 4:02 0 �0:12
0:9 �0:36 �0:57 0 3:1 0
0 0 0 �0:12 0 2:99
0BBBBBBBB@
1CCCCCCCCA
GPa
ð3ÞThis tensor is consistent with the value of 40 GPa along thechain direction that was observed in X-ray studies [22].
PE has a zigzag planar chain conformation. This confor-mation of the molecular chain influences the stiffness of thecrystalline lamellae [20]. Due to its zigzag conformation,PE stiffness is highly dependent on temperature. The stiff-ness of PE lamellae was chosen as calculated by Choyand Leung [23] (see Ref. [12] for discussion):
CcPE ¼
7:0 3:8 4:7 0 0 0
3:8 7:0 3:8 0 0 0
4:7 3:8 81 0 0 0
0 0 0 1:6 0 0
0 0 0 0 1:6 0
0 0 0 0 0 1:6
0BBBBBBBB@
1CCCCCCCCA
GPa ð4Þ
PET lamella stiffness was experimentally measured by Hineand Ward [24]. A theoretical estimate was provided byRutledge [25]. For most components, experimental valuesof the elastic stiffness tensor are comparable to the theoret-ical ones. However, a discrepancy is observed for the C33
stiffness tensor component, which may be the result ofimperfect crystallites. Rutledge [25] noted that the C33 stiff-ness tensor component may drop drastically due to chainaxis misorientations. A better experimental estimate of thiscomponent has been given by Matsuo and Sawatari [26],and the PET crystal stiffness tensor is given by
CcPET ¼
7:70 5:46 5:07 0 0 0
5:46 7:70 5:07 0 0 0
5:07 5:07 118 0 0 0
0 0 0 1:62 0 0
0 0 0 0 1:62 0
0 0 0 0 0 1:12
0BBBBBBBB@
1CCCCCCCCA
GPa
ð5Þ
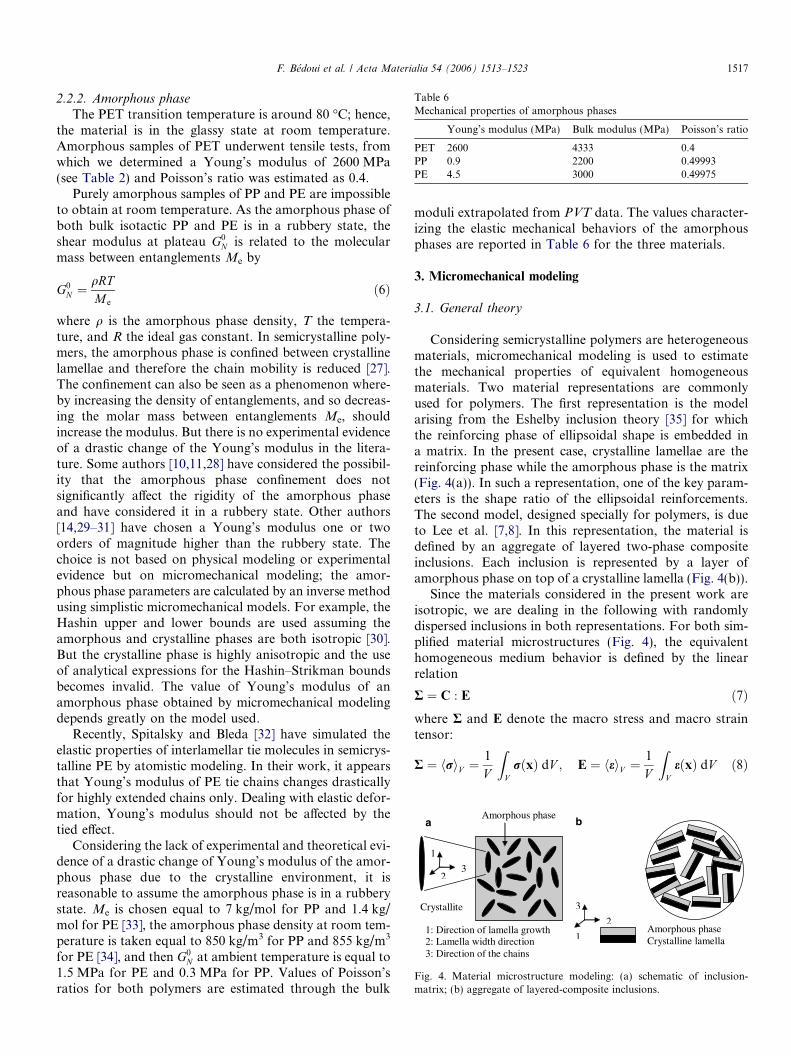
Table 6Mechanical properties of amorphous phases
Young’s modulus (MPa) Bulk modulus (MPa) Poisson’s ratio
PET 2600 4333 0.4PP 0.9 2200 0.49993PE 4.5 3000 0.49975
3
1
2Amorphous phase Crystalline lamella
ba
1
23
1: Direction of lamella growth 2: Lamella width direction 3: Direction of the chains
Amorphous phase
Crystallite
Fig. 4. Material microstructure modeling: (a) schematic of inclusion-matrix; (b) aggregate of layered-composite inclusions.
F. Bedoui et al. / Acta Materialia 54 (2006) 1513–1523 1517
2.2.2. Amorphous phase
The PET transition temperature is around 80 �C; hence,the material is in the glassy state at room temperature.Amorphous samples of PET underwent tensile tests, fromwhich we determined a Young’s modulus of 2600 MPa(see Table 2) and Poisson’s ratio was estimated as 0.4.
Purely amorphous samples of PP and PE are impossibleto obtain at room temperature. As the amorphous phase ofboth bulk isotactic PP and PE is in a rubbery state, theshear modulus at plateau G0
N is related to the molecularmass between entanglements Me by
G0N ¼ qRT
M e
ð6Þ
where q is the amorphous phase density, T the tempera-ture, and R the ideal gas constant. In semicrystalline poly-mers, the amorphous phase is confined between crystallinelamellae and therefore the chain mobility is reduced [27].The confinement can also be seen as a phenomenon where-by increasing the density of entanglements, and so decreas-ing the molar mass between entanglements Me, shouldincrease the modulus. But there is no experimental evidenceof a drastic change of the Young’s modulus in the litera-ture. Some authors [10,11,28] have considered the possibil-ity that the amorphous phase confinement does notsignificantly affect the rigidity of the amorphous phaseand have considered it in a rubbery state. Other authors[14,29–31] have chosen a Young’s modulus one or twoorders of magnitude higher than the rubbery state. Thechoice is not based on physical modeling or experimentalevidence but on micromechanical modeling; the amor-phous phase parameters are calculated by an inverse methodusing simplistic micromechanical models. For example, theHashin upper and lower bounds are used assuming theamorphous and crystalline phases are both isotropic [30].But the crystalline phase is highly anisotropic and the useof analytical expressions for the Hashin–Strikman boundsbecomes invalid. The value of Young’s modulus of anamorphous phase obtained by micromechanical modelingdepends greatly on the model used.
Recently, Spitalsky and Bleda [32] have simulated theelastic properties of interlamellar tie molecules in semicrys-talline PE by atomistic modeling. In their work, it appearsthat Young’s modulus of PE tie chains changes drasticallyfor highly extended chains only. Dealing with elastic defor-mation, Young’s modulus should not be affected by thetied effect.
Considering the lack of experimental and theoretical evi-dence of a drastic change of Young’s modulus of the amor-phous phase due to the crystalline environment, it isreasonable to assume the amorphous phase is in a rubberystate. Me is chosen equal to 7 kg/mol for PP and 1.4 kg/mol for PE [33], the amorphous phase density at room tem-perature is taken equal to 850 kg/m3 for PP and 855 kg/m3
for PE [34], and then G0N at ambient temperature is equal to
1.5 MPa for PE and 0.3 MPa for PP. Values of Poisson’sratios for both polymers are estimated through the bulk
moduli extrapolated from PVT data. The values character-izing the elastic mechanical behaviors of the amorphousphases are reported in Table 6 for the three materials.
3. Micromechanical modeling
3.1. General theory
Considering semicrystalline polymers are heterogeneousmaterials, micromechanical modeling is used to estimatethe mechanical properties of equivalent homogeneousmaterials. Two material representations are commonlyused for polymers. The first representation is the modelarising from the Eshelby inclusion theory [35] for whichthe reinforcing phase of ellipsoidal shape is embedded ina matrix. In the present case, crystalline lamellae are thereinforcing phase while the amorphous phase is the matrix(Fig. 4(a)). In such a representation, one of the key param-eters is the shape ratio of the ellipsoidal reinforcements.The second model, designed specially for polymers, is dueto Lee et al. [7,8]. In this representation, the material isdefined by an aggregate of layered two-phase compositeinclusions. Each inclusion is represented by a layer ofamorphous phase on top of a crystalline lamella (Fig. 4(b)).
Since the materials considered in the present work areisotropic, we are dealing in the following with randomlydispersed inclusions in both representations. For both sim-plified material microstructures (Fig. 4), the equivalenthomogeneous medium behavior is defined by the linearrelation
R ¼ C : E ð7Þwhere R and E denote the macro stress and macro straintensor:
R ¼ hriV ¼ 1
V
ZVrðxÞ dV ; E ¼ heiV ¼ 1
V
ZVeðxÞ dV ð8Þ
1518 F. Bedoui et al. / Acta Materialia 54 (2006) 1513–1523
In the following, both microstructures presented in Fig. 4will be considered separately, allowing us to review the pos-sible homogenization schemes for each representation.
3.2. Crystalline phase randomly dispersed in amorphous
matrix
3.2.1. Bounds
The simplest bounds are Reuss and Voigt ones whichassume that stresses [36] or strains [37] are identical in bothphases. In case of a great difference between the elastic con-stants of the two phases, as for both PP and PE, one getsvery wide bounds of limited usefulness.
Closer bounds are due to Hashin and Strickman [38] bythe use of variational formulation. In their homogenizationscheme, inclusions are assumed to be surrounded by a ref-erence medium Cref. The choice of the reference mediumbehavior defined by Cref depends on the nature of thebounds.
IfCref < Cc then CHS is a lower bound
Cref > Cc then CHS is an upper boundð9Þ
The difficulty rises from the choice of the reference med-ium. In our case, the reinforcing phase (crystalline lamel-lae) is highly anisotropic and the reference medium is notclearly defined. For the upper bound, the reference mediahave to satisfy:
8e; e : Cref : e P MaxR
½e : RT : Cc : R : e�
R : Rotation tensor e : Strain tensor ð10Þ
Defining ksup as the highest eigenvalue of the crystallinestiffness tensor Cc, Cref = ksup Æ I satisfies Eq. (10) [39]. Thissimple choice of Cref does not exactly define a Hashin–Strickman bound but a so-called upper-like Hashin–Strick-man bound.
For the lower bound, the original assumption leads us toconsider the less rigid phase as the reference medium, inour case the amorphous phase, Cref = Cam. Note that thelower Hashin–Strikman bound is equivalent to the Mori–Tanaka model [40].
3.2.2. Other models
In order to get a better estimate of the elastic behavior ofthe equivalent homogeneous material, let us consider someother classic micromechanics models. All models presentedin the following are detailed in Nemat-Nasser and Hori[41].
A self-consistent scheme is better suited for polycrystalsor aggregate materials than for matrix containing inclu-sions [42]. Nevertheless, in order to provide a completepicture of micromechanical modeling applied to semicrys-talline polymers, this model is also considered. The self-consistent scheme is based on the assumption of inclusionssurrounded by the homogeneous material.
The Mori–Tanaka model [40] is suited for low volumefractions of inclusions, which is not the case in the present
study. The crystalline fraction is about 60%, which limitsthe use of this model. Nevertheless, since the Hashin–Strickman lower bound is equivalent to the Mori–Tanakamodel, results are estimated for this model.
Finally, when dealing with high volume fractions of thereinforcing phase, the differential scheme is appropriate[43]. In such a model, the crystalline fraction is addedstep-by-step using a dilute scheme until the required vol-ume fraction is reached (see Ref. [12] for detailedequations).
3.3. Aggregate of composite layers
3.3.1. Layered two-phase inclusion behaviorIn this material representation (Fig. 4(b)), the length and
width of the composite inclusion are considered very largein comparison to the thickness. This assumption allows usto consider a constant strain and stress field in each layer ofthe inclusion. The inclusion-averaged strain and stresstensor are given in terms of a volume average over thetwo phases:
XI ¼ ð1� f cÞXam þ f cXc for X ¼ r and X ¼ e ð11Þwhere superscript I stands for the composite inclusion. Atthe interface, kinematic coupling compatibility of strainand stress continuity leads to
ecab ¼ eamab ¼ eIab ða; bÞ 2 f1; 2g � f1; 2grci3 ¼ ram
i3 ¼ rIi3 i 2 f1; 2; 3g
ð12Þ
in a direct basis (e1, e2, e3) for which direction e3 is the unitnormal of the interface. Combining Eqs. (11) and (12), oneobtains the elastic behavior of the composite inclusion[12,29].
Considering a set of randomly dispersed compositeinclusions, several micromechanical models can be usedto estimate the behavior of an aggregate of inclusions.
3.3.2. BoundsUpper and lower bounds are defined in the same way as
Voigt and Reuss bounds [29]. For the Voigt (Reuss) bound,strains (stresses) are assumed identical in all inclusions.This assumption provides tighter bounds than the oneobtained by applying Voigt and Reuss bounds to the amor-phous and crystalline phases directly [29].
3.3.3. Self-consistent schemeConsidering the material as an aggregate of two-layered
inclusions, the self-consistent scheme is theoreticallywell sui-ted to estimate the elastic behavior of the homogeneousequivalent material [29,44]. Considering n inclusions ran-domly dispersed, the elastic stiffness tensorC of the homoge-neous material is calculated by iteration, solving equations:
C ¼ CþXn
k¼1
1
nðCI
k � CÞ : AkðCÞ
AkðCÞ ¼ Iþ SeshC�1ðCIk � CÞ
ð13Þ
F. Bedoui et al. / Acta Materialia 54 (2006) 1513–1523 1519
where Sesh is the Eshelby tensor [35]. Tensors Ak mustsatisfy ÆAkæ = I, with angle brackets denoting the volumeaverage over all considered orientations. In the case ofnon-spherical inclusions, this last equation is not necessar-ily satisfied and the self-consistent model is then general-ized by adding the condition [45]
Ak ¼ Ak � hAki�1 ð14ÞIn the following, two models dedicated to polymer model-ing are presented.
3.3.4. Hybrid scheme
Lee et al. [7,8] first used a layered-composite inclusionrepresentation, dealing with perfect plasticity. In thisframework, two hybrid schemes have been defined basedon a mix of Sachs [46] and Taylor [47] assumptions, ther-inclusion and the U-inclusion models. Both models havebeen recently used in the context of elastoviscoplasticity byVan Dommelen et al. [10]. The model formulation isrecorded here in a simpler context of linear elasticity.
3.3.4.1. r-Inclusion scheme. Let us consider an aggregate oftwo-layered-phase composite inclusions submitted to amacroscopic strain field E. In order to compute the elasticbehavior of the macrostructure, it is necessary, accordingto Eq. (7), to determine the macroscopic stress tensor Rinduced by the strain field E. Following Eq. (8), macro-scopic strains and stresses may be defined as a volume aver-age over all inclusions:
E ¼ heIi and R ¼ hrIi ð15ÞIn the r-inclusion model, an unknown auxiliary stress fieldis introduced as r. Partial Sachs and Taylor conditions areapplied at the local scale of each inclusion according to
eIk ¼ Ek for k 2 f3; 4; 5g and rIk ¼ rk for k 2 f1; 2; 6g
ð16Þusing Voigt notation in the local basis of the inclusion, e3being the unit normal of the interface. Considering a sys-tem of n inclusions, 6 · n unknowns ðeI1; eI2; eI6; rI
3; rI4; r
I5Þ;
I 2 f1; ng and 6 global unknowns due to r, remain fromEq. (16). The composite inclusion elastic behavior (CI)being known, the equations
eIj ¼ SIjk � rI
k; j 2 f3; 4; 5g and rj ¼ CIjk � eIk; j 2 f1; 2; 6g
ð17Þwritten in the composite inclusion basis, provide 6 · n localequations. The global condition of macro-homogeneityE = ÆeIæ provides six global equations. Finally, one endsup with a (6 · n + 6) by (6 · n + 6) linear system to solve.The solution of this system makes calculations of R andC possible.
3.3.4.2. U-inclusion scheme. The aggregate of compositeinclusions is now submitted to a macroscopic stress fieldR. To obtain the elastic behavior of the macrostructure,
according to Eq. (7), it is necessary to determine the mac-roscopic strain tensor E induced by the stress field R. Asfor the r-inclusion scheme, an unknown auxiliary strainfield e is introduced and the partial Sachs and Taylor con-ditions are still applied at the local scale of each inclusionaccording to
eIk ¼ ek for k 2 f3; 4; 5g and rIk ¼ Rk for k 2 f1; 2; 6g
ð18ÞFrom Eq. (18) remain 6 · n local unknowns ðeI1; eI2; eI6;rI3; r
I4; r
I5Þ; I 2 f1; ng and six global unknowns due to e.
As for the r-inclusion model, knowing the composite inclu-sion elastic behavior provides us with 6 · n local equations:
eIj ¼ SIjk � rI
k; j 2 f3; 4; 5g and rIj ¼ CI
jk � eIk; j 2 f1; 2; 6gð19Þ
Finally, the global stress macro-homogeneity equationR = ÆrIæ defines six global equations. The resolution of a(6 · n + 6) by (6 · n + 6) linear system makes possible thecalculation of E and C.
Finally, let us end this theoretical section by noting firstlythat it has not been possible to consider the differentialschemes in the case of an aggregate of composite inclusionsdue to the requirement of a matrix in order to graduallyadd the reinforcing phase. Secondly, inclusion shape ratioparameters are required only for the self-consistent anddifferential schemes.
In the following section, quantitative agreementsbetween the predictions of the micromechanical modelsand the measured elastic constants for PP, PE, and semi-crystalline PET are presented.
4. Results
For both PP and PE there is a strong contrast betweenthe mechanical behaviors of the two constitutive phases.PP morphology is relatively well estimated in Section2.1.2, and none of the inputs required by micromechanicalmodeling is unknown. Considering PE, the crystallitedimensions, which provide inclusion shape ratios, remainunknown. However, Young’s modulus of the homoge-neous material has been measured for a large range of crys-tallinity, which provides a good database to estimate thecrystallite shape ratios.
The PET was chosen for several reasons. Firstly, theelastic behavior of the amorphous phase is not question-able. Secondly, it is possible to control its crystallinity upto 41%. Finally, since the amorphous phase is in a glassystate, the contrast between both phases, in terms of elasticbehavior, is largely reduced in comparison to PP and PE.
4.1. Comparison between models and PP experimental data
Since all inputs required by the modeling are known forthe PP, this material is chosen to compare several models.PP crystallizes in a narrow interval varying from 50% to
1520 F. Bedoui et al. / Acta Materialia 54 (2006) 1513–1523
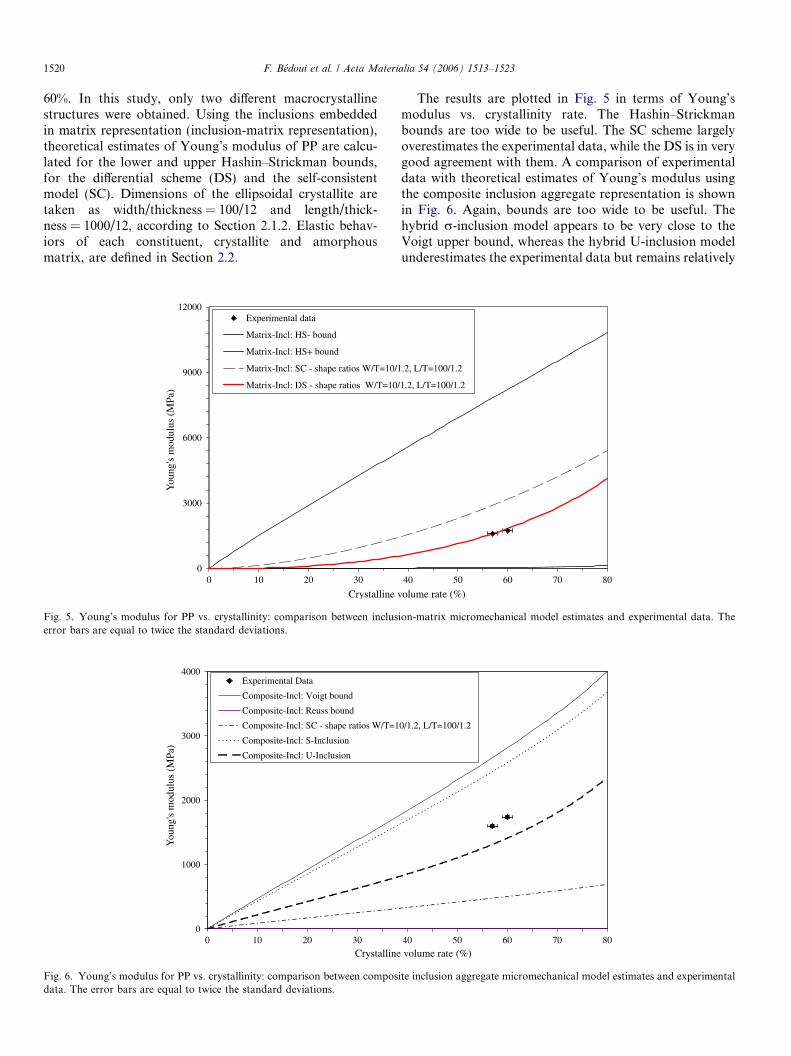
60%. In this study, only two different macrocrystallinestructures were obtained. Using the inclusions embeddedin matrix representation (inclusion-matrix representation),theoretical estimates of Young’s modulus of PP are calcu-lated for the lower and upper Hashin–Strickman bounds,for the differential scheme (DS) and the self-consistentmodel (SC). Dimensions of the ellipsoidal crystallite aretaken as width/thickness = 100/12 and length/thick-ness = 1000/12, according to Section 2.1.2. Elastic behav-iors of each constituent, crystallite and amorphousmatrix, are defined in Section 2.2.
0
0003
0006
0009
00021
0302010
Crystalline v
You
ng's
mod
ulus
(M
Pa)
atadlatnemirepxE
dnuob-SH:lcnI-xirtaM
dnuob+SH:lcnI-xirtaM
1/01=T/Wsoitarepahs-CS:lcnI-xirtaM
/01=T/Wsoitarepahs-SD:lcnI-xirtaM
Fig. 5. Young’s modulus for PP vs. crystallinity: comparison between incluserror bars are equal to twice the standard deviations.
0
0001
0002
0003
0004
0302010
Crystalline
You
ng's
mod
ulus
(M
Pa)
ataDlatnemirepxE
dnuobtgioV:lcnI-etisopmoC
dnuobssueR:lcnI-etisopmoC
1=T/Wsoitarepahs-CS:lcnI-etisopmoC
noisulcnI-S:lcnI-etisopmoC
noisulcnI-U:lcnI-etisopmoC
Fig. 6. Young’s modulus for PP vs. crystallinity: comparison between composdata. The error bars are equal to twice the standard deviations.
The results are plotted in Fig. 5 in terms of Young’smodulus vs. crystallinity rate. The Hashin–Strickmanbounds are too wide to be useful. The SC scheme largelyoverestimates the experimental data, while the DS is in verygood agreement with them. A comparison of experimentaldata with theoretical estimates of Young’s modulus usingthe composite inclusion aggregate representation is shownin Fig. 6. Again, bounds are too wide to be useful. Thehybrid r-inclusion model appears to be very close to theVoigt upper bound, whereas the hybrid U-inclusion modelunderestimates the experimental data but remains relatively
0807060504
olume rate (%)
2.1/001=T/L,2.
2.1/001=T/L,2.1
ion-matrix micromechanical model estimates and experimental data. The
0807060504
volume rate (%)
2.1/001=T/L,2.1/0
ite inclusion aggregate micromechanical model estimates and experimental
F. Bedoui et al. / Acta Materialia 54 (2006) 1513–1523 1521
close to them. One of the interesting aspects of this model isthe fact that no shape parameters are required. But theassumption of homogeneous strain and stress in each layerof the composite inclusion implies that shape ratios must behigh. In the case of the PP, shape ratios are indeed high,and therefore this model assumption is compatible withthe microstructure observations.
By comparing Poisson’s ratio at 57% crystallinity, weobtained a correct value of 0.42 with the DS while thehybrid U-inclusion model provided an erroneous value of0.38. So far, the inclusion-matrix DS model has provento be better at estimating the elastic constant of the semi-crystalline PP.
4.2. Comparison between models and PE experimental data
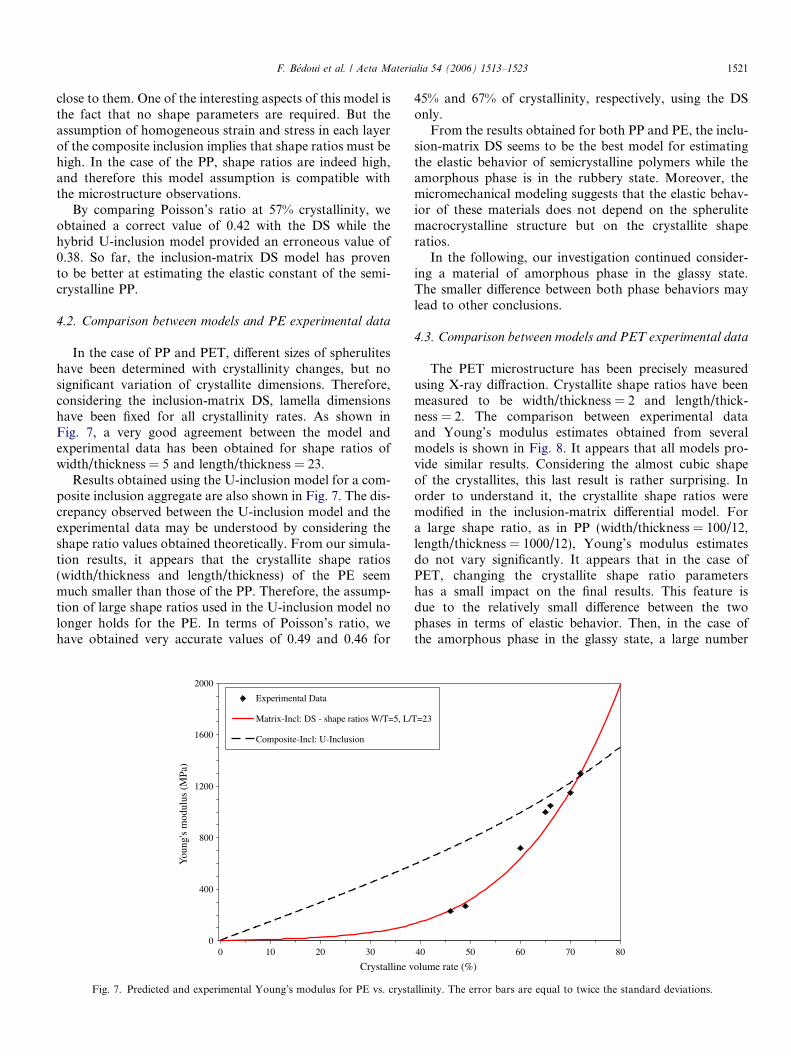
In the case of PP and PET, different sizes of spheruliteshave been determined with crystallinity changes, but nosignificant variation of crystallite dimensions. Therefore,considering the inclusion-matrix DS, lamella dimensionshave been fixed for all crystallinity rates. As shown inFig. 7, a very good agreement between the model andexperimental data has been obtained for shape ratios ofwidth/thickness = 5 and length/thickness = 23.
Results obtained using the U-inclusion model for a com-posite inclusion aggregate are also shown in Fig. 7. The dis-crepancy observed between the U-inclusion model and theexperimental data may be understood by considering theshape ratio values obtained theoretically. From our simula-tion results, it appears that the crystallite shape ratios(width/thickness and length/thickness) of the PE seemmuch smaller than those of the PP. Therefore, the assump-tion of large shape ratios used in the U-inclusion model nolonger holds for the PE. In terms of Poisson’s ratio, wehave obtained very accurate values of 0.49 and 0.46 for
0
004
008
0021
0061
0002
0302010
Crystalline v
You
ng's
mod
ulus
(M
Pa)
ataD latnemirepxE
/L ,5=T/W soitar epahs - SD :lcnI-xirtaM
noisulcnI-U :lcnI-etisopmoC
Fig. 7. Predicted and experimental Young’s modulus for PE vs. crysta
45% and 67% of crystallinity, respectively, using the DSonly.
From the results obtained for both PP and PE, the inclu-sion-matrix DS seems to be the best model for estimatingthe elastic behavior of semicrystalline polymers while theamorphous phase is in the rubbery state. Moreover, themicromechanical modeling suggests that the elastic behav-ior of these materials does not depend on the spherulitemacrocrystalline structure but on the crystallite shaperatios.
In the following, our investigation continued consider-ing a material of amorphous phase in the glassy state.The smaller difference between both phase behaviors maylead to other conclusions.
4.3. Comparison between models and PET experimental data
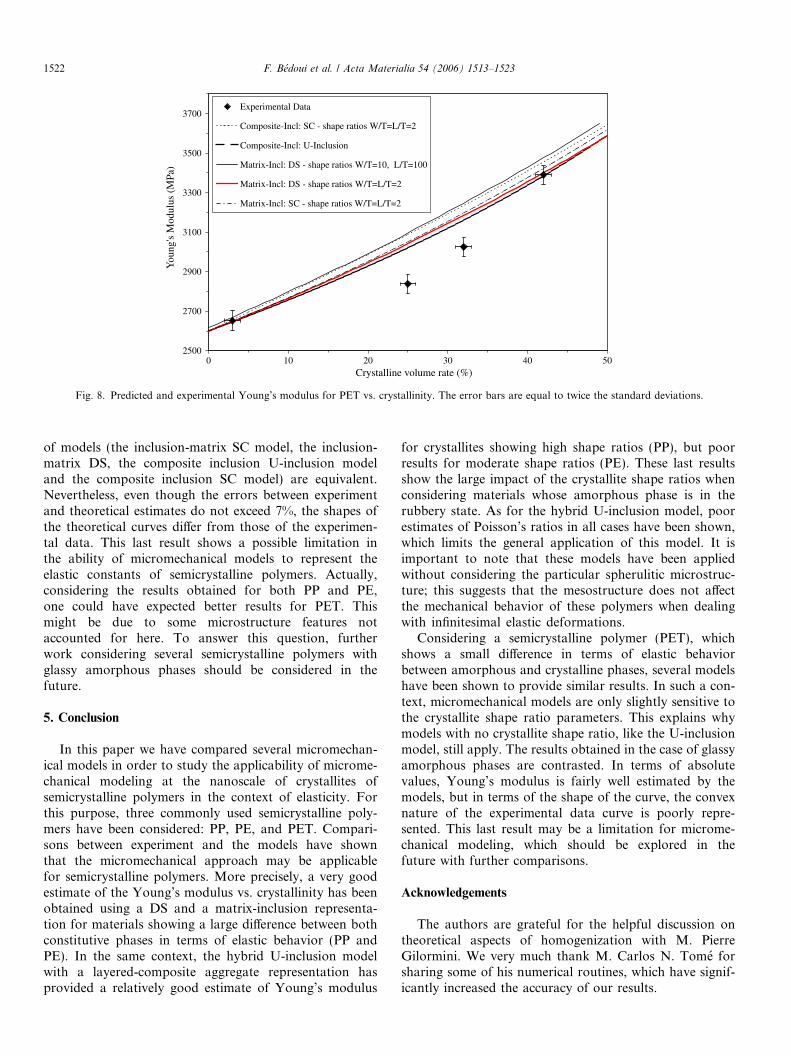
The PET microstructure has been precisely measuredusing X-ray diffraction. Crystallite shape ratios have beenmeasured to be width/thickness = 2 and length/thick-ness = 2. The comparison between experimental dataand Young’s modulus estimates obtained from severalmodels is shown in Fig. 8. It appears that all models pro-vide similar results. Considering the almost cubic shapeof the crystallites, this last result is rather surprising. Inorder to understand it, the crystallite shape ratios weremodified in the inclusion-matrix differential model. Fora large shape ratio, as in PP (width/thickness = 100/12,length/thickness = 1000/12), Young’s modulus estimatesdo not vary significantly. It appears that in the case ofPET, changing the crystallite shape ratio parametershas a small impact on the final results. This feature isdue to the relatively small difference between the twophases in terms of elastic behavior. Then, in the case ofthe amorphous phase in the glassy state, a large number
0807060504
olume rate (%)
32=T
llinity. The error bars are equal to twice the standard deviations.
0052
0072
0092
0013
0033
0053
0073
05040302010Crystalline volume rate (%)
You
ng's
Mod
ulus
(M
Pa)
ataDlatnemirepxE
2=T/L=T/Wsoitarepahs-CS:lcnI-etisopmoC
noisulcnI-U:lcnI-etisopmoC
001=T/L,01=T/Wsoitarepahs-SD:lcnI-xirtaM
2=T/L=T/Wsoitarepahs-SD:lcnI-xirtaM
2=T/L=T/Wsoitarepahs-CS:lcnI-xirtaM
Fig. 8. Predicted and experimental Young’s modulus for PET vs. crystallinity. The error bars are equal to twice the standard deviations.
1522 F. Bedoui et al. / Acta Materialia 54 (2006) 1513–1523
of models (the inclusion-matrix SC model, the inclusion-matrix DS, the composite inclusion U-inclusion modeland the composite inclusion SC model) are equivalent.Nevertheless, even though the errors between experimentand theoretical estimates do not exceed 7%, the shapes ofthe theoretical curves differ from those of the experimen-tal data. This last result shows a possible limitation inthe ability of micromechanical models to represent theelastic constants of semicrystalline polymers. Actually,considering the results obtained for both PP and PE,one could have expected better results for PET. Thismight be due to some microstructure features notaccounted for here. To answer this question, furtherwork considering several semicrystalline polymers withglassy amorphous phases should be considered in thefuture.
5. Conclusion
In this paper we have compared several micromechan-ical models in order to study the applicability of microme-chanical modeling at the nanoscale of crystallites ofsemicrystalline polymers in the context of elasticity. Forthis purpose, three commonly used semicrystalline poly-mers have been considered: PP, PE, and PET. Compari-sons between experiment and the models have shownthat the micromechanical approach may be applicablefor semicrystalline polymers. More precisely, a very goodestimate of the Young’s modulus vs. crystallinity has beenobtained using a DS and a matrix-inclusion representa-tion for materials showing a large difference between bothconstitutive phases in terms of elastic behavior (PP andPE). In the same context, the hybrid U-inclusion modelwith a layered-composite aggregate representation hasprovided a relatively good estimate of Young’s modulus
for crystallites showing high shape ratios (PP), but poorresults for moderate shape ratios (PE). These last resultsshow the large impact of the crystallite shape ratios whenconsidering materials whose amorphous phase is in therubbery state. As for the hybrid U-inclusion model, poorestimates of Poisson’s ratios in all cases have been shown,which limits the general application of this model. It isimportant to note that these models have been appliedwithout considering the particular spherulitic microstruc-ture; this suggests that the mesostructure does not affectthe mechanical behavior of these polymers when dealingwith infinitesimal elastic deformations.
Considering a semicrystalline polymer (PET), whichshows a small difference in terms of elastic behaviorbetween amorphous and crystalline phases, several modelshave been shown to provide similar results. In such a con-text, micromechanical models are only slightly sensitive tothe crystallite shape ratio parameters. This explains whymodels with no crystallite shape ratio, like the U-inclusionmodel, still apply. The results obtained in the case of glassyamorphous phases are contrasted. In terms of absolutevalues, Young’s modulus is fairly well estimated by themodels, but in terms of the shape of the curve, the convexnature of the experimental data curve is poorly repre-sented. This last result may be a limitation for microme-chanical modeling, which should be explored in thefuture with further comparisons.
Acknowledgements
The authors are grateful for the helpful discussion ontheoretical aspects of homogenization with M. PierreGilormini. We very much thank M. Carlos N. Tome forsharing some of his numerical routines, which have signif-icantly increased the accuracy of our results.
F. Bedoui et al. / Acta Materialia 54 (2006) 1513–1523 1523
References
[1] Mac Leish TCB, Larson RG. J Rheol 1998;42:81.[2] Yamada K, Matsumoto S, Tagashira K, Hikosaka M. Polymer
1998;39:5327.[3] Zhu PW, Edward G. Polymer 2004;45:2603.[4] Nishida K, Konishi T, Kanaya T, Kaji K. Polymer 2004;45:1417.[5] Olley RH, Basset DC. Polymer 1982;23:1707.[6] Mendoza R, Regnier R, Seiler W, Lebrun JL. Polymer 2003;44:3363.[7] Lee BJ, Parks DM, Ahzi S. J Mech Phys Solids 1993;41:1651.[8] Lee BJ, Argon AS, Parks DM, Ahzi S, Bartczak Z. Polymer
1993;34:3555.[9] Dahoun A, Aboulfaraj M, G’Sell C, Molinari A, Canova GR. Polym
Eng Sci 1995;35:317.[10] van Dommelen JAW, Parks DM, Boyce MC, Brekelmans WAM,
Baaijens FPT. J Mech Phys Solids 2003;51:519.[11] Nikolov S, Doghri I, Pierard O, Zealouk L, Goldberg A. J Mech Phys
Solids 2002;50:2275.[12] Bedoui F, Diani J, Regnier G. Polymer 2004;45:2433.[13] Scion software, release Beta 4.0.2. Scion Image Corp.; 2000.[14] Guan X, Pichumani R. Polym Eng Sci 2004;44:433.[15] Marco Y, Chevalier L, Chaouche M. Polymer 2002;43:6569.[16] OriginPro Software. Version 6.1. Northampton, MA: OriginLab
Corp.; 2000.[17] Smole MS, Zipper P. Mater Res Innovat 2002;6:55.[18] Ania F, Balta Calleja FJ, Bayer RK, Tshmel A, Naumann I, Michler
GH. J Mater Sci 1996;31:4199.[19] Ward IM. Structure and properties of oriented polymer. Chapman &
Hall; 1997.[20] Tashiro K, Kobayashi M, Tadokora H. Polymer 1996;37:1775.
[21] Tashiro K, Kobayashi M, Tadokora M. Polymer 1992;24:899.[22] Sawatari C, Matsuo M. Macromolecules 1986;19:2653.[23] Choy CL, Leung WP. J Polym Sci Polym Phys Ed 1985;23:1759.[24] Hine PJ, Ward IM. J Mater Sci 1996;31:371.[25] Rutledge GC. Macromolecules 1997;30:2785.[26] Matsuo M, Sawatari C. Polym J 1990;22:518.[27] Gorbusnov AA, Skvortsov AM. Adv Coll Interf Sci 1995;6:31.[28] Janzen J. Polym Eng Sci 1992;32:1242.[29] Ahzi S, Parks DM, Argon AS. ASME AMD 1995;203:31.[30] Gray RW, McGrum NG. J Polym Sci A-2 1969;7:1329.[31] Boyd RH. J Polym Sci Polym Phys Ed 1983;21:493.[32] Spitalsky Z, Bleha T. Polymer 2003;44:1603.[33] Wu S. J Polym Sci Polym Phys Ed 1989;27:723.[34] van Krevelen DW. Properties of polymers. 3rd ed. Amsterdam: Else-
vier; 1990.[35] Eshelby JD. Proc Roy Soc Lond 1957;A241:376.[36] Reuss A. Z Angew Math Mech 1929;9:49.[37] Voigt W. Lehrbuch der Kristallphysik. Leipzig: Teubner; 1928.[38] Hashin Z, Strickman S. J Mech Phys Solids 1962;10:335.[39] Bornert M, Bretheau T, Gilormini P. Homogeneisation en mecanique
des materiaux Tome 1. Edition Hermes; 2001.[40] Mori T, Tanaka K. Acta Metall 1973;21:571.[41] Nemat-Nasser S, Hori M. Micromechanics: overall properties of
heterogeneous materials. 2nd ed. Amsterdam: North Holland; 1999.[42] Gilormini P, Brechet Y. Mod Sim Mater Sci Eng 1999;17:805.[43] Christensen RM. J Mech Phys Solids 1990;38:379.[44] Nikolov S, Doghri I. Polymer 2000;41:1883.[45] Walpole LJJ. J Mech Phys Solids 1969;17:235.[46] Sachs G. Z Vereines Deutscher Ingenieure 1928;72:734.[47] Taylor GI. J Inst Metals 1938;62:307.