Embed Size (px)
DESCRIPTION
Bangladesh export import recent trends
Citation preview
Export, Import, Remittance and FDI: Recent Trends
Bangladesh Economic Update
April 2014
Bangladesh Economic Update, April 2014 Page | 2
Bangladesh Economic Update Volume 5, No. 4, April 2014 Acknowledgement Bangladesh Economic Update is a monthly publication of the Economic Policy Unit of Unnayan Onneshan, a multidisciplinary research organisation based in Dhaka, Bangladesh. The report is prepared by Nahida Sultana and Ebney Ayaj Rana under the guidance of Rashed Al Mahmud Titumir. The Update has been copy edited by Abid Feroz Khan.
© Copyright: Unnayan Onneshan The content of this publication may be reproduced for non-commercial purposes with proper citation (please send output to the address mentioned below). Any other form of reproduction, storage in a retrieval system or transmission by any means for commercial purposes, requires permission from the Unnayan Onneshan. For orders and request, please contact: UNNAYAN ONNESHAN 16/2, Indira Road, Farmgate Dhaka-1215, Bangladesh Tell: + (880-2) 8158274, 9110636 Fax: + (880-2) 8159135 E-mail: [email protected] Web: www.unnayan.org
The current issue of Bangladesh Economic Update attempts to understand the causes of declining growth in Gross Domestic Product (GDP) against the backdrop of recent underperformances in the external sector. Recent political contestations in the country have created an uncertain business environment for setting up new industries resulting in decreased investment demand-induced negative growth in the import of capital machinery.
1. INTRODUCTION The current issue of Bangladesh Economic Update attempts to understand the causes of declining growth in Gross Domestic Product (GDP) against the backdrop of recent underperformances in the external sector due to falling investment demand-induced decreased import of capital machinery, concentration of productive capacity in readymade garments and lack of production diversity in other exporting commodities, declining rate of wage earners’ remittance inflow and unsatisfactory inflow of Foreign Direct Investment (FDI) in the country. External sector possesses upward trend in export earnings, despite slower rate of remittance inflow and import payments during the last fiscal year. Collapse in Rana Plaza and Tazreen Fashion, political instability challenged the export earnings to grow at a decreasing rate in recent years. However, despite these challenges, the growth in RMG sector can especially be ascribed to the increase in knit and woven garments. Moreover, export earnings increased more from non-traditional markets than that of the traditional markets. Import payments showed a decreasing trend because of the lower demand for the imports of crude petroleum and petroleum products. Recent political contestations in the country have created an uncertain business environment for setting up new industries resulting in decreased investment demand-induced negative growth in the import of capital machinery. Opening of letter of credits (LCs) for capital machineries and petroleum products, however, started to increase due to the ‘calmness’ after the election in January 2014. Inflows of remittance slowed in the last few months primarily because of the decline in labour migration in major markets like Saudi Arabia and Malaysia. As a result, this declinig inflow of remitance is likely to exert adverse impact on rural economy since consumption and expenditure of people living in rural areas are largely contingent upon remittance sent by their household members living aborad.
Bangladesh Economic Update, April 2014 Page | 4
Current falling rate of remittance may pose serious challenge to central bank’s attempt to draw an increased foreign exchange reserve, although an increase in foreign exchange reserve is noticed lately.
The country now experienced the increasing trend of the net foreign portfolio investment because of the lower prices of stocks and attractive yield of government securities and appreciation of taka against dollars in recent months. Large gap between commitment and disbursement of foreign direct investment (FDI) over the years has been noticed recently, which can be ascribed mainly to lack of infrastructural facilities and political tumult as well as a good deal of foreign aid trapped in the pipeline. Current account balance has soared compared to capital and financial accounts due mainly to decreased import payments. However, the surplus in current account balance can largely be ascribed to the falling investment demand-induced declined import of capital machinery, which is reckoned as the reason for recent declining trend in the growth of manufacturing sector since the sector is largely dependent on imported machineries for production. In addition, current falling rate of remittance may pose serious challenge to central bank’s attempt to draw an increased foreign exchange reserve, although an increase in foreign exchange reserve is noticed lately. 2. EXPORT EARNINGS Export earnings showed an increasing rate in FY 2012-13 for especially increasing export in the non-traditional markets. Moreover, export earning is increasing from FY 1994-95 to FY 2012-13, although at a discontinuous way. In FY 2012-13, export earnings were USD 27028 million which was 11.21 percent higher than that of the previous fiscal year. The consequences of global economic recession, political crisis in North Africa and the Middle East exacerbated the situation of the import expenditure and the export earnings in Bangladesh in FY 2011-12. In FY 2011-12, the growth rate of export earning was 5.99 percent which was 41.49 percent in FY 2010-11. The decreasing rate of raw jute (25.4 percent), jute goods (7.5 percent) and ceramic products (10.2 percent) decreased the export earnings in FY 2011-12. Growth rate slowed by 5 percent in FY 2011-12 from 41.49 percent in FY 2010-11 because of the flourish in the export of
Bangladesh Economic Update, April 2014 Page | 5
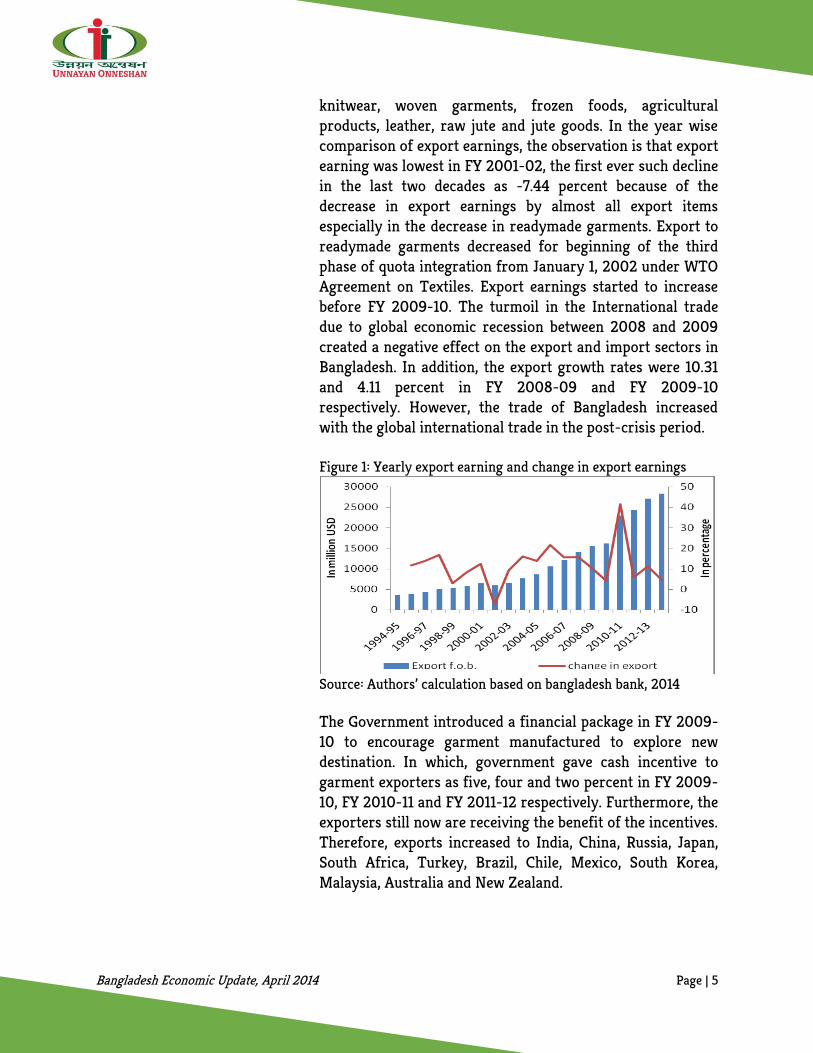
knitwear, woven garments, frozen foods, agricultural products, leather, raw jute and jute goods. In the year wise comparison of export earnings, the observation is that export earning was lowest in FY 2001-02, the first ever such decline in the last two decades as -7.44 percent because of the decrease in export earnings by almost all export items especially in the decrease in readymade garments. Export to readymade garments decreased for beginning of the third phase of quota integration from January 1, 2002 under WTO Agreement on Textiles. Export earnings started to increase before FY 2009-10. The turmoil in the International trade due to global economic recession between 2008 and 2009 created a negative effect on the export and import sectors in Bangladesh. In addition, the export growth rates were 10.31 and 4.11 percent in FY 2008-09 and FY 2009-10 respectively. However, the trade of Bangladesh increased with the global international trade in the post-crisis period. Figure 1: Yearly export earning and change in export earnings
Source: Authors’ calculation based on bangladesh bank, 2014 The Government introduced a financial package in FY 2009-10 to encourage garment manufactured to explore new destination. In which, government gave cash incentive to garment exporters as five, four and two percent in FY 2009-10, FY 2010-11 and FY 2011-12 respectively. Furthermore, the exporters still now are receiving the benefit of the incentives. Therefore, exports increased to India, China, Russia, Japan, South Africa, Turkey, Brazil, Chile, Mexico, South Korea, Malaysia, Australia and New Zealand.
Bangladesh Economic Update, April 2014 Page | 6
Even after political turmoils, the incidence of Tazreen fashion garments and the Rana Plaza, export earnings assumed a positive and satisfactory growth rate in FY 2012-13 and in the first eight months of this current fiscal year.
2.1 Sector Wise Export Earnings Even after political turmoils, the incidence of Tazreen fashion garments and the Rana Plaza, export earnings assumed a positive and satisfactory growth rate in FY 2012-13 and in the first eight months of this current fiscal year. The main reason behind the success is increase in the non-traditional markets and increase in the exports in readymate garments, jute goods and leather. The export of readymade garments reached USD 12233.23 million comprising 81.7 percent of total export receipts during July-February of FY 2013-14 compared to USD 10225.68 million comprising 80.2 percent of total export receipts duing the corresponding period of FY 2012-13. In FY 2012-13, exports from readymate garments, leather, jute products increased by 10, 22 and 21 percent reaspectively whereas the growth of these products were 15, 11 and -1 percent respectively in the corresponding previous fiscal year. Moreover, exports of raw jute and fish and shrimp decreased by four and 25 percent respectively in FY 2012-13 than that of FY 2011-12. From July 31, 2012, banned on export of all white fishes including hilsha and withdrawn the cash incentive on white fishes by the government for FY 2013-14 have created a negative impact on the export on white fish. Hartals, blocked and political instability made losses to exporters as exporters of garment, jute, shrimp, leather and footwear products could not make peoper shipments of goods due to shutdown and many buyers cancelled their meetings and orders of fearing failure to meet the ending date. During July-Januaryof FY 2013-14, export growth rate of Readymade garments, Leather and Fish and shrimp increased by 17.72, 45.38 and 25.73 percent respectively where the growth rate of exports to these products was 9.92, 8.80 and -22.24 percent respectively in the corresponding previous fiscal year. In addition, export growth rate of raw jute, jute goods, fish and shrimp and Readymade garments except leather was positive during July-January of FY 2011-12 as comparison to the same period of the previous fiscal year. Furthermore, in the first quarter of FY 2013-14, export of frozen white fish decraesed around 40 percent because of the higher price charged by the local exporters to the buyers.
Bangladesh Economic Update, April 2014 Page | 7
Furthermore, in the first quarter of FY 2013-14, export of frozen white fish decraesed around 40 percent because of the higher price charged by the local exporters to the buyers.
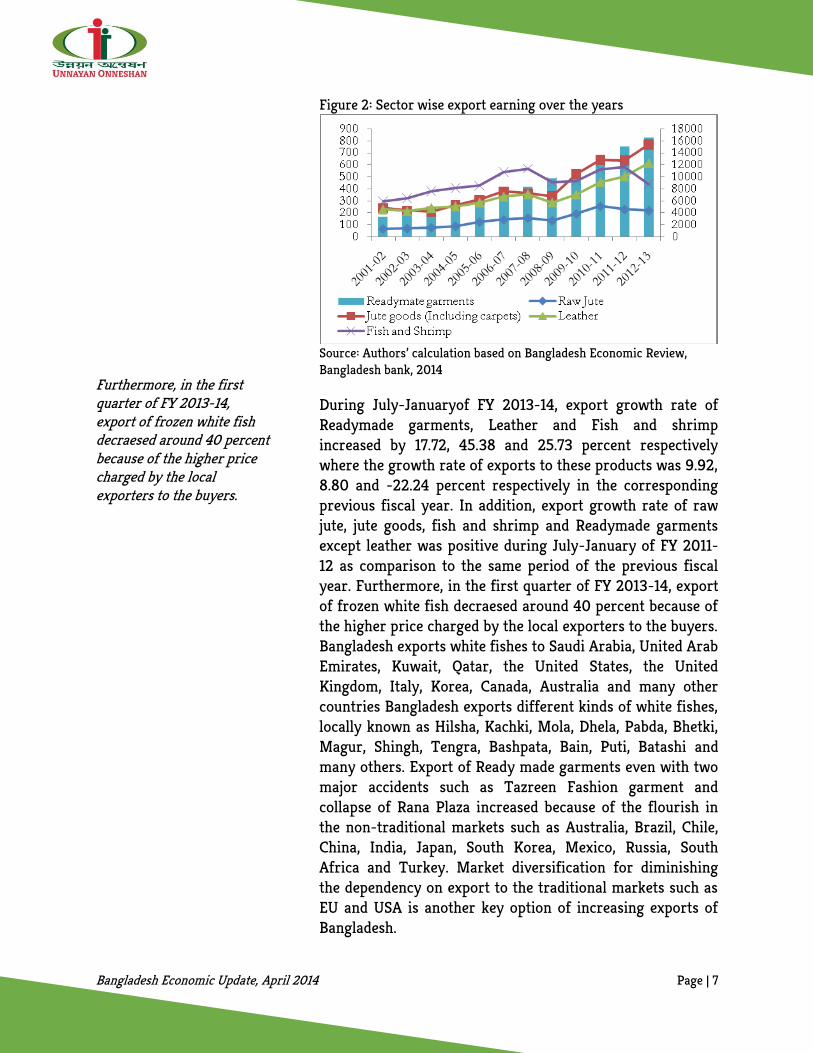
Figure 2: Sector wise export earning over the years
Source: Authors’ calculation based on Bangladesh Economic Review, Bangladesh bank, 2014 During July-Januaryof FY 2013-14, export growth rate of Readymade garments, Leather and Fish and shrimp increased by 17.72, 45.38 and 25.73 percent respectively where the growth rate of exports to these products was 9.92, 8.80 and -22.24 percent respectively in the corresponding previous fiscal year. In addition, export growth rate of raw jute, jute goods, fish and shrimp and Readymade garments except leather was positive during July-January of FY 2011-12 as comparison to the same period of the previous fiscal year. Furthermore, in the first quarter of FY 2013-14, export of frozen white fish decraesed around 40 percent because of the higher price charged by the local exporters to the buyers. Bangladesh exports white fishes to Saudi Arabia, United Arab Emirates, Kuwait, Qatar, the United States, the United Kingdom, Italy, Korea, Canada, Australia and many other countries Bangladesh exports different kinds of white fishes, locally known as Hilsha, Kachki, Mola, Dhela, Pabda, Bhetki, Magur, Shingh, Tengra, Bashpata, Bain, Puti, Batashi and many others. Export of Ready made garments even with two major accidents such as Tazreen Fashion garment and collapse of Rana Plaza increased because of the flourish in the non-traditional markets such as Australia, Brazil, Chile, China, India, Japan, South Korea, Mexico, Russia, South Africa and Turkey. Market diversification for diminishing the dependency on export to the traditional markets such as EU and USA is another key option of increasing exports of Bangladesh.
Bangladesh Economic Update, April 2014 Page | 8
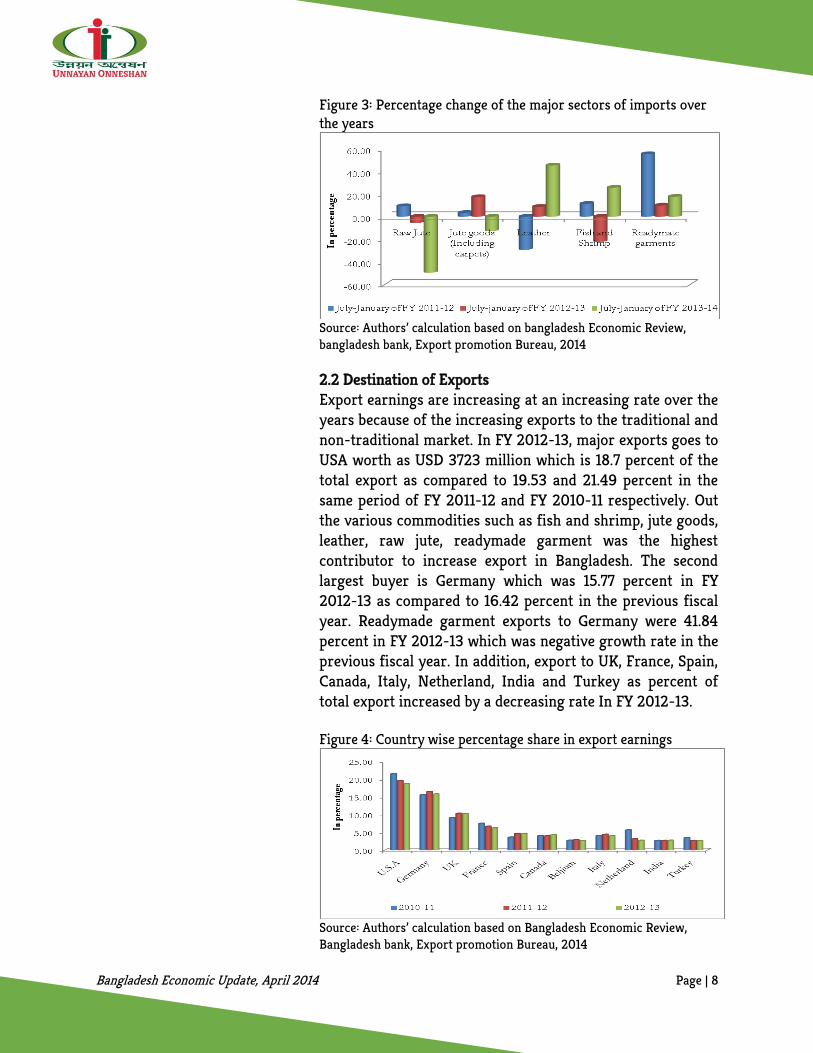
Figure 3: Percentage change of the major sectors of imports over the years
Source: Authors’ calculation based on bangladesh Economic Review, bangladesh bank, Export promotion Bureau, 2014
2.2 Destination of Exports Export earnings are increasing at an increasing rate over the years because of the increasing exports to the traditional and non-traditional market. In FY 2012-13, major exports goes to USA worth as USD 3723 million which is 18.7 percent of the total export as compared to 19.53 and 21.49 percent in the same period of FY 2011-12 and FY 2010-11 respectively. Out the various commodities such as fish and shrimp, jute goods, leather, raw jute, readymade garment was the highest contributor to increase export in Bangladesh. The second largest buyer is Germany which was 15.77 percent in FY 2012-13 as compared to 16.42 percent in the previous fiscal year. Readymade garment exports to Germany were 41.84 percent in FY 2012-13 which was negative growth rate in the previous fiscal year. In addition, export to UK, France, Spain, Canada, Italy, Netherland, India and Turkey as percent of total export increased by a decreasing rate In FY 2012-13. Figure 4: Country wise percentage share in export earnings
Source: Authors’ calculation based on Bangladesh Economic Review, Bangladesh bank, Export promotion Bureau, 2014
Bangladesh Economic Update, April 2014 Page | 9
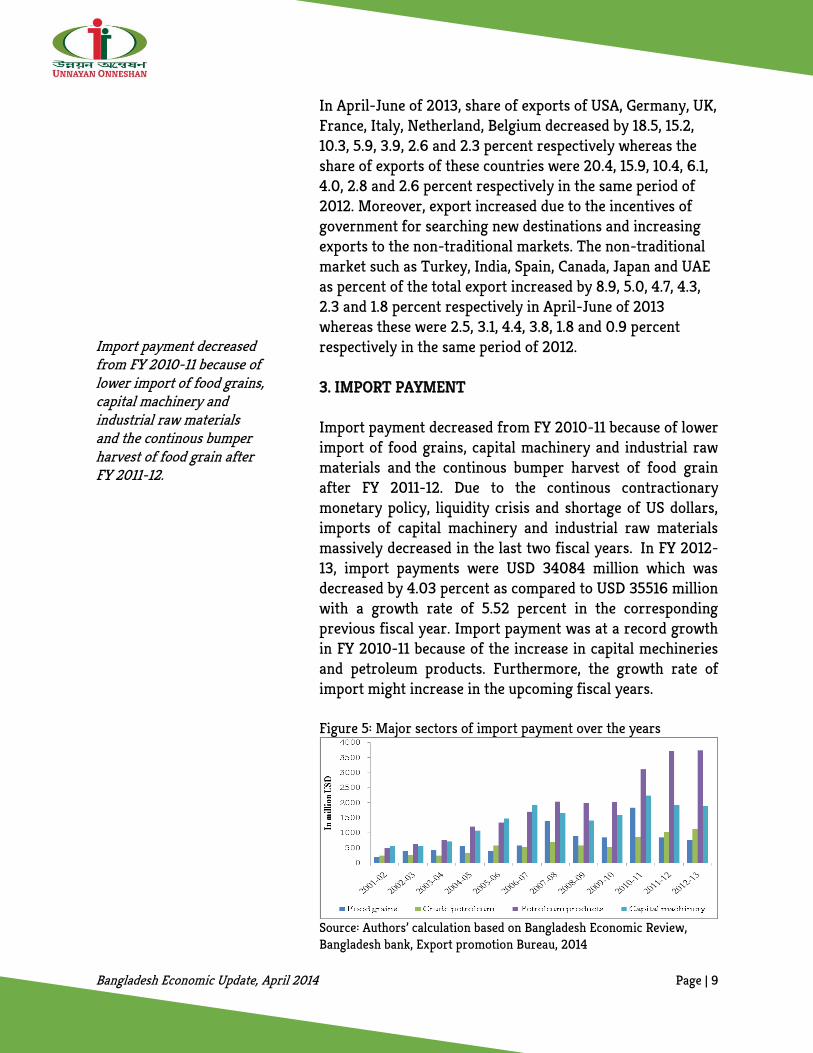
Import payment decreased from FY 2010-11 because of lower import of food grains, capital machinery and industrial raw materials and the continous bumper harvest of food grain after FY 2011-12.
In April-June of 2013, share of exports of USA, Germany, UK, France, Italy, Netherland, Belgium decreased by 18.5, 15.2, 10.3, 5.9, 3.9, 2.6 and 2.3 percent respectively whereas the share of exports of these countries were 20.4, 15.9, 10.4, 6.1, 4.0, 2.8 and 2.6 percent respectively in the same period of 2012. Moreover, export increased due to the incentives of government for searching new destinations and increasing exports to the non-traditional markets. The non-traditional market such as Turkey, India, Spain, Canada, Japan and UAE as percent of the total export increased by 8.9, 5.0, 4.7, 4.3, 2.3 and 1.8 percent respectively in April-June of 2013 whereas these were 2.5, 3.1, 4.4, 3.8, 1.8 and 0.9 percent respectively in the same period of 2012. 3. IMPORT PAYMENT Import payment decreased from FY 2010-11 because of lower import of food grains, capital machinery and industrial raw materials and the continous bumper harvest of food grain after FY 2011-12. Due to the continous contractionary monetary policy, liquidity crisis and shortage of US dollars, imports of capital machinery and industrial raw materials massively decreased in the last two fiscal years. In FY 2012-13, import payments were USD 34084 million which was decreased by 4.03 percent as compared to USD 35516 million with a growth rate of 5.52 percent in the corresponding previous fiscal year. Import payment was at a record growth in FY 2010-11 because of the increase in capital mechineries and petroleum products. Furthermore, the growth rate of import might increase in the upcoming fiscal years. Figure 5: Major sectors of import payment over the years
Source: Authors’ calculation based on Bangladesh Economic Review, Bangladesh bank, Export promotion Bureau, 2014
Bangladesh Economic Update, April 2014 Page | 10
In July of the current fiscal year, import payment increased by 7.8 percent than that of Fy 2012-13 whereas it was a negative growth rate of 3.47 percent in the corresponding previous fiscal year.
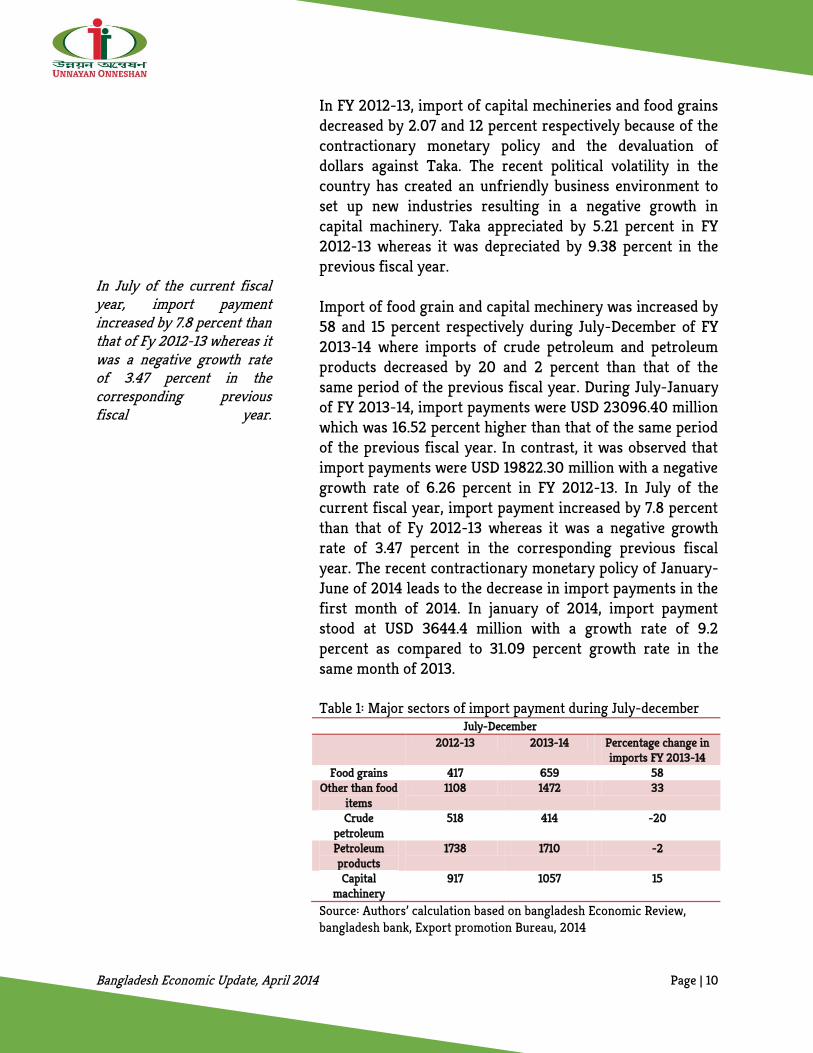
In FY 2012-13, import of capital mechineries and food grains decreased by 2.07 and 12 percent respectively because of the contractionary monetary policy and the devaluation of dollars against Taka. The recent political volatility in the country has created an unfriendly business environment to set up new industries resulting in a negative growth in capital machinery. Taka appreciated by 5.21 percent in FY 2012-13 whereas it was depreciated by 9.38 percent in the previous fiscal year. Import of food grain and capital mechinery was increased by 58 and 15 percent respectively during July-December of FY 2013-14 where imports of crude petroleum and petroleum products decreased by 20 and 2 percent than that of the same period of the previous fiscal year. During July-January of FY 2013-14, import payments were USD 23096.40 million which was 16.52 percent higher than that of the same period of the previous fiscal year. In contrast, it was observed that import payments were USD 19822.30 million with a negative growth rate of 6.26 percent in FY 2012-13. In July of the current fiscal year, import payment increased by 7.8 percent than that of Fy 2012-13 whereas it was a negative growth rate of 3.47 percent in the corresponding previous fiscal year. The recent contractionary monetary policy of January-June of 2014 leads to the decrease in import payments in the first month of 2014. In january of 2014, import payment stood at USD 3644.4 million with a growth rate of 9.2 percent as compared to 31.09 percent growth rate in the same month of 2013. Table 1: Major sectors of import payment during July-december
July-December 2012-13 2013-14 Percentage change in
imports FY 2013-14 Food grains 417 659 58
Other than food items
1108 1472 33
Crude petroleum
518 414 -20
Petroleum products
1738 1710 -2
Capital machinery
917 1057 15
Source: Authors’ calculation based on bangladesh Economic Review, bangladesh bank, Export promotion Bureau, 2014
Bangladesh Economic Update, April 2014 Page | 11
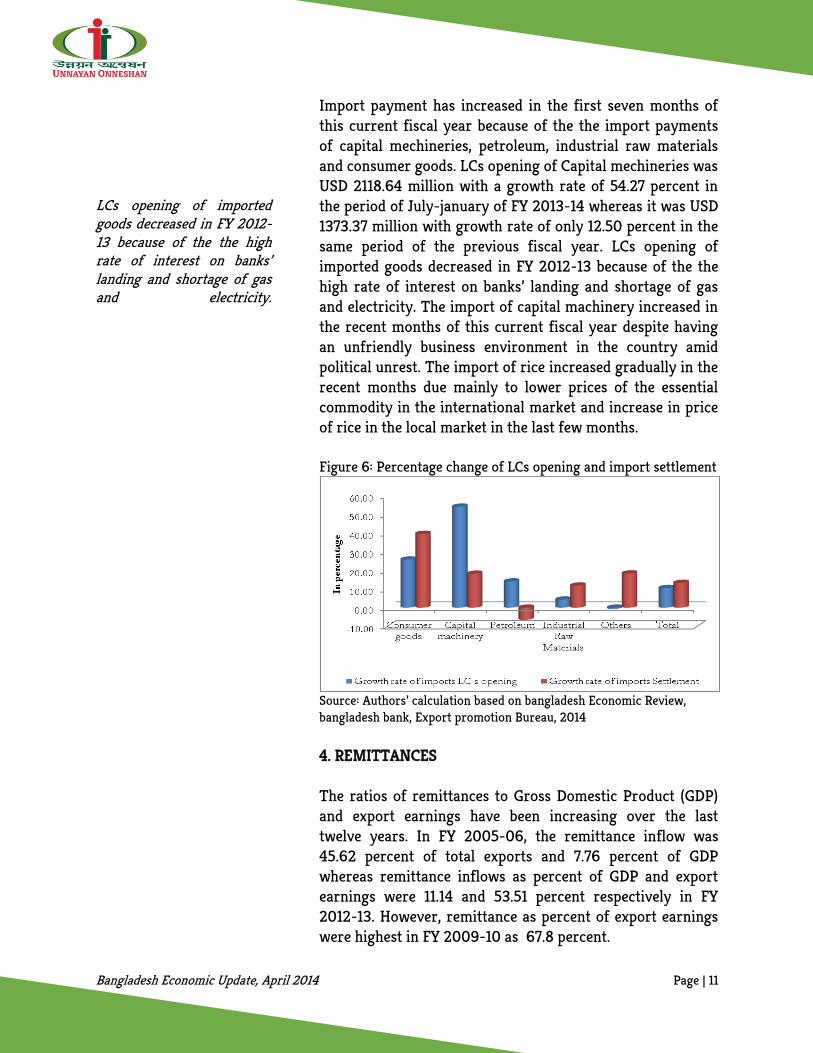
LCs opening of imported goods decreased in FY 2012-13 because of the the high rate of interest on banks’ landing and shortage of gas and electricity.
Import payment has increased in the first seven months of this current fiscal year because of the the import payments of capital mechineries, petroleum, industrial raw materials and consumer goods. LCs opening of Capital mechineries was USD 2118.64 million with a growth rate of 54.27 percent in the period of July-january of FY 2013-14 whereas it was USD 1373.37 million with growth rate of only 12.50 percent in the same period of the previous fiscal year. LCs opening of imported goods decreased in FY 2012-13 because of the the high rate of interest on banks’ landing and shortage of gas and electricity. The import of capital machinery increased in the recent months of this current fiscal year despite having an unfriendly business environment in the country amid political unrest. The import of rice increased gradually in the recent months due mainly to lower prices of the essential commodity in the international market and increase in price of rice in the local market in the last few months. Figure 6: Percentage change of LCs opening and import settlement
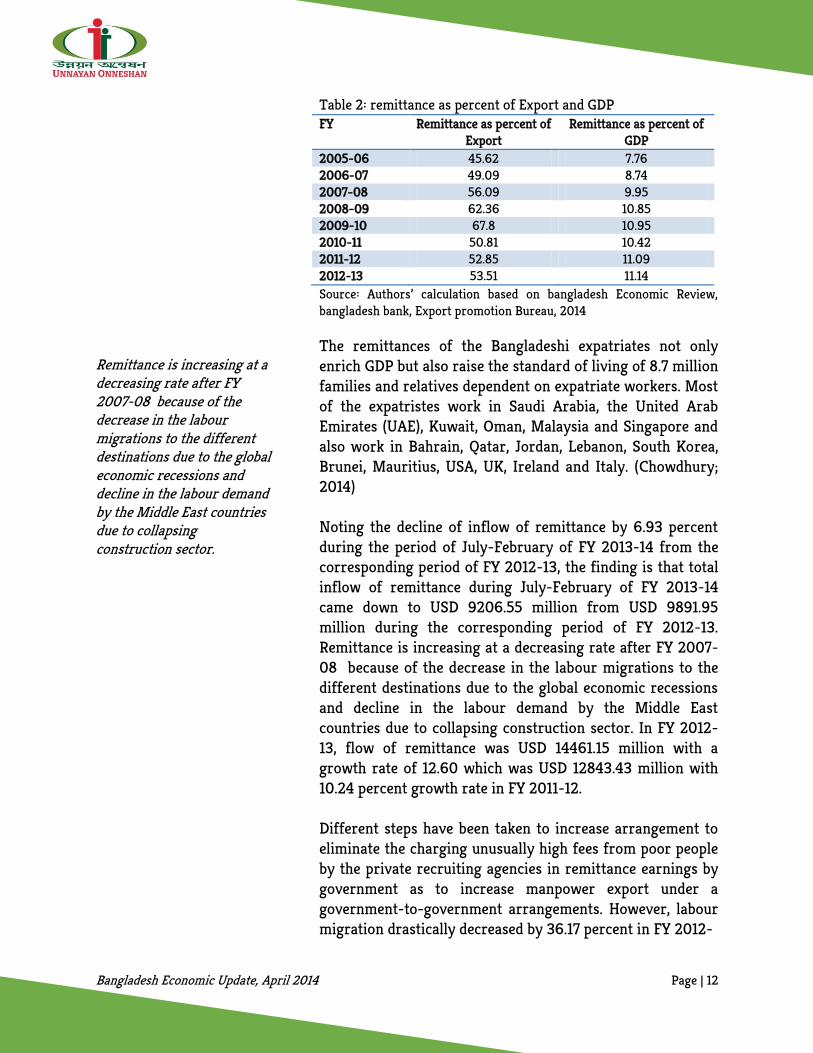
Source: Authors’ calculation based on bangladesh Economic Review, bangladesh bank, Export promotion Bureau, 2014 4. REMITTANCES The ratios of remittances to Gross Domestic Product (GDP) and export earnings have been increasing over the last twelve years. In FY 2005-06, the remittance inflow was 45.62 percent of total exports and 7.76 percent of GDP whereas remittance inflows as percent of GDP and export earnings were 11.14 and 53.51 percent respectively in FY 2012-13. However, remittance as percent of export earnings were highest in FY 2009-10 as 67.8 percent.
Bangladesh Economic Update, April 2014 Page | 12
Remittance is increasing at a decreasing rate after FY 2007-08 because of the decrease in the labour migrations to the different destinations due to the global economic recessions and decline in the labour demand by the Middle East countries due to collapsing construction sector.
Table 2: remittance as percent of Export and GDP FY Remittance as percent of
Export Remittance as percent of
GDP 2005-06 45.62 7.76 2006-07 49.09 8.74 2007-08 56.09 9.95 2008-09 62.36 10.85 2009-10 67.8 10.95 2010-11 50.81 10.42 2011-12 52.85 11.09 2012-13 53.51 11.14 Source: Authors’ calculation based on bangladesh Economic Review, bangladesh bank, Export promotion Bureau, 2014
The remittances of the Bangladeshi expatriates not only enrich GDP but also raise the standard of living of 8.7 million families and relatives dependent on expatriate workers. Most of the expatristes work in Saudi Arabia, the United Arab Emirates (UAE), Kuwait, Oman, Malaysia and Singapore and also work in Bahrain, Qatar, Jordan, Lebanon, South Korea, Brunei, Mauritius, USA, UK, Ireland and Italy. (Chowdhury; 2014) Noting the decline of inflow of remittance by 6.93 percent during the period of July-February of FY 2013-14 from the corresponding period of FY 2012-13, the finding is that total inflow of remittance during July-February of FY 2013-14 came down to USD 9206.55 million from USD 9891.95 million during the corresponding period of FY 2012-13. Remittance is increasing at a decreasing rate after FY 2007-08 because of the decrease in the labour migrations to the different destinations due to the global economic recessions and decline in the labour demand by the Middle East countries due to collapsing construction sector. In FY 2012-13, flow of remittance was USD 14461.15 million with a growth rate of 12.60 which was USD 12843.43 million with 10.24 percent growth rate in FY 2011-12. Different steps have been taken to increase arrangement to eliminate the charging unusually high fees from poor people by the private recruiting agencies in remittance earnings by government as to increase manpower export under a government-to-government arrangements. However, labour migration drastically decreased by 36.17 percent in FY 2012-
Bangladesh Economic Update, April 2014 Page | 13
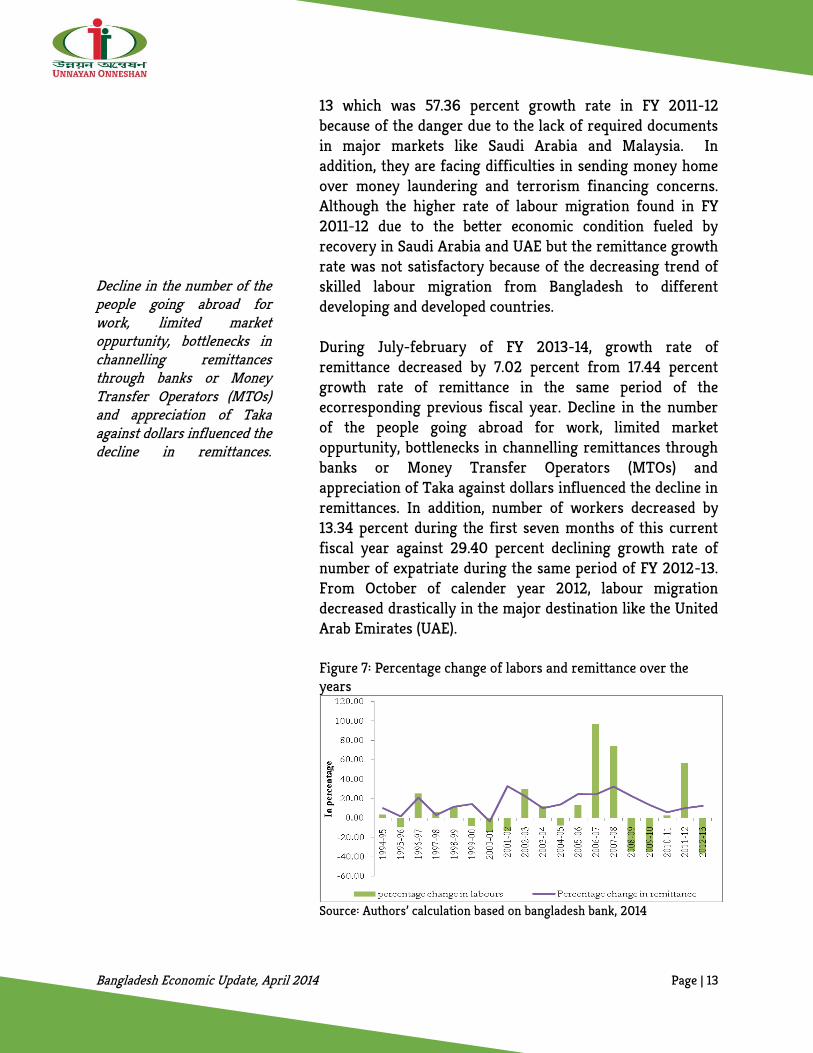
Decline in the number of the people going abroad for work, limited market oppurtunity, bottlenecks in channelling remittances through banks or Money Transfer Operators (MTOs) and appreciation of Taka against dollars influenced the decline in remittances.
13 which was 57.36 percent growth rate in FY 2011-12 because of the danger due to the lack of required documents in major markets like Saudi Arabia and Malaysia. In addition, they are facing difficulties in sending money home over money laundering and terrorism financing concerns. Although the higher rate of labour migration found in FY 2011-12 due to the better economic condition fueled by recovery in Saudi Arabia and UAE but the remittance growth rate was not satisfactory because of the decreasing trend of skilled labour migration from Bangladesh to different developing and developed countries. During July-february of FY 2013-14, growth rate of remittance decreased by 7.02 percent from 17.44 percent growth rate of remittance in the same period of the ecorresponding previous fiscal year. Decline in the number of the people going abroad for work, limited market oppurtunity, bottlenecks in channelling remittances through banks or Money Transfer Operators (MTOs) and appreciation of Taka against dollars influenced the decline in remittances. In addition, number of workers decreased by 13.34 percent during the first seven months of this current fiscal year against 29.40 percent declining growth rate of number of expatriate during the same period of FY 2012-13. From October of calender year 2012, labour migration decreased drastically in the major destination like the United Arab Emirates (UAE). Figure 7: Percentage change of labors and remittance over the years
Source: Authors’ calculation based on bangladesh bank, 2014
Bangladesh Economic Update, April 2014 Page | 14
The declining growth in remittance inflow can be found highly associated with the decreased income of rural people exerting adverse impact on the development of rural economy. Therefore, a decrease in the inflow of remittance will reduce the income of rural households by a signicant amount causing them to be trapped in poverty.
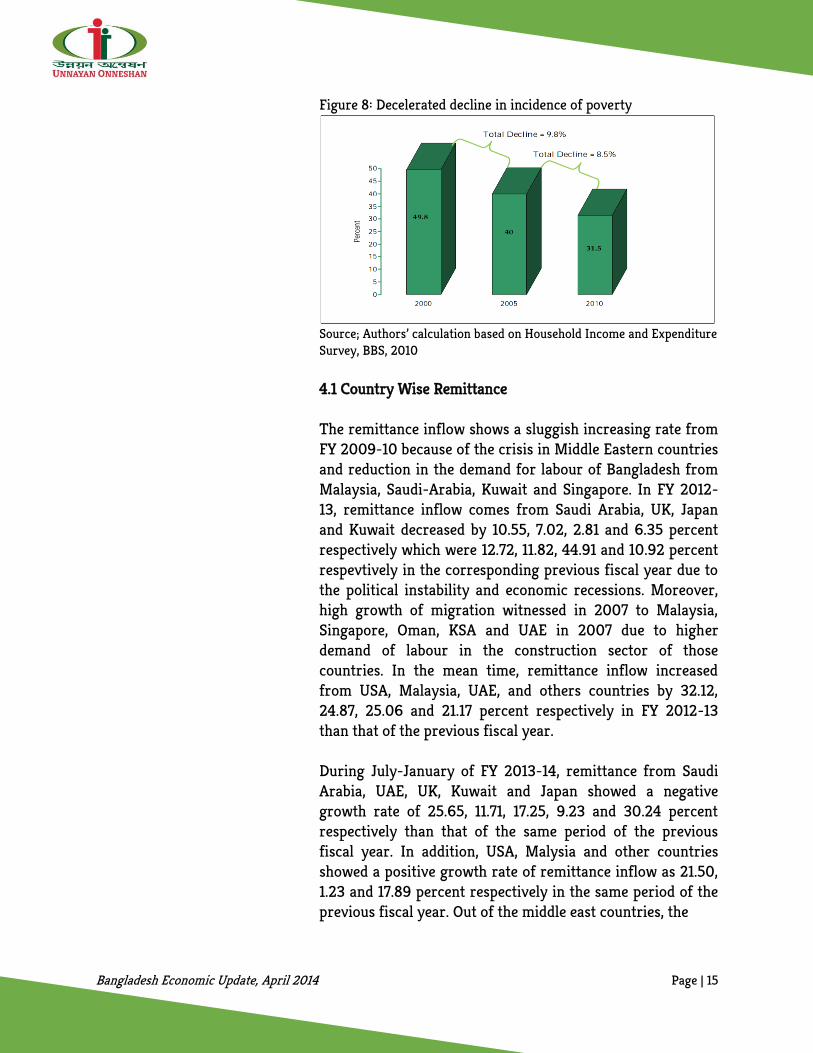
Moreover, the flow in the migration of workers shows a significant growth in FY 2007-2008 due to increase in the employment of skilled manpower in the construction sector in some countries such as Malaysia, Singapore, Oman, KSA and UAE. Later on, labour migration declined in FY 2009-10 by 34.29 percent due to the worldwide financial crisis and banning bangladeshi workers in 2009 by Malaysia in response to malpractice in the recruitment process and the negative impact for massive operation against the foreign workers without valid permits by the malaysian authorities from September 1, 2013. In calender year 2012, labor migration decreased by 37.17 percent because of the decrease in professional, skilled and semi-skilled workers by 31.9, 8.6 and 28.7 percent respectively than that of the calender year 2011. The declining growth in remittance inflow can be found highly associated with the decreased income of rural people exerting adverse impact on the development of rural economy. Percentage share of income of rural households indicates that in 2010, 17.28 percent of total income of rural households came from remittance, whereas it was 12 percent in 2005. That is, between 2005 and 2010, the income of rural households from remittance increases by a 5.28-percentage-point, whereas income from agriculture, business and commerce, professional wages and salary and housing services increases by 1.03, -2.25, 1.47 and 0.08 percentage points respectively during the same period (Bangladesh Bureau of Statistics (BBS), 2010). Therefore, a decrease in the inflow of remittance will reduce the income of rural households by a signicant amount causing them to be trapped in poverty. The recent declining rate of growth in remittance inflow should be addressed with highest priority with a view to accelerating the current decelerated decline in the incidence of poverty, since the incidence of poverty decreased by 9.8 percent between the period of 2000-2005, whereas it decreased by 8.5 percent between 2005-2010.
Bangladesh Economic Update, April 2014 Page | 15
Figure 8: Decelerated decline in incidence of poverty
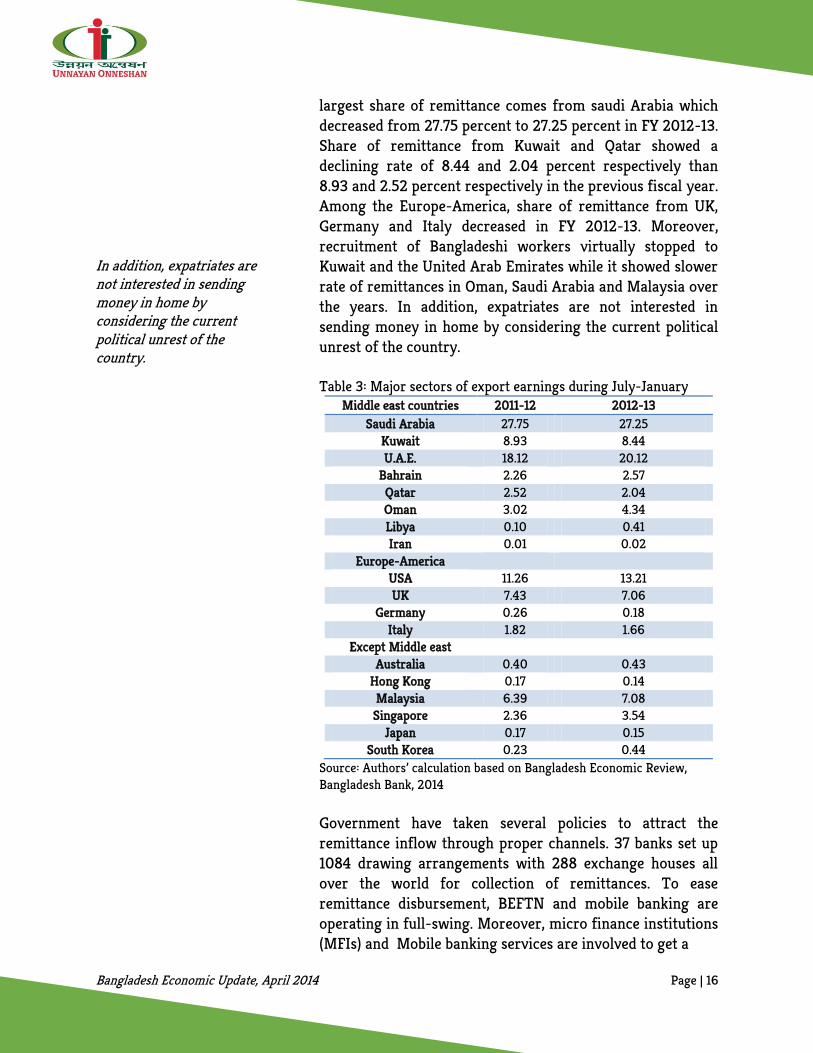
Source; Authors’ calculation based on Household Income and Expenditure Survey, BBS, 2010 4.1 Country Wise Remittance The remittance inflow shows a sluggish increasing rate from FY 2009-10 because of the crisis in Middle Eastern countries and reduction in the demand for labour of Bangladesh from Malaysia, Saudi-Arabia, Kuwait and Singapore. In FY 2012-13, remittance inflow comes from Saudi Arabia, UK, Japan and Kuwait decreased by 10.55, 7.02, 2.81 and 6.35 percent respectively which were 12.72, 11.82, 44.91 and 10.92 percent respevtively in the corresponding previous fiscal year due to the political instability and economic recessions. Moreover, high growth of migration witnessed in 2007 to Malaysia, Singapore, Oman, KSA and UAE in 2007 due to higher demand of labour in the construction sector of those countries. In the mean time, remittance inflow increased from USA, Malaysia, UAE, and others countries by 32.12, 24.87, 25.06 and 21.17 percent respectively in FY 2012-13 than that of the previous fiscal year. During July-January of FY 2013-14, remittance from Saudi Arabia, UAE, UK, Kuwait and Japan showed a negative growth rate of 25.65, 11.71, 17.25, 9.23 and 30.24 percent respectively than that of the same period of the previous fiscal year. In addition, USA, Malysia and other countries showed a positive growth rate of remittance inflow as 21.50, 1.23 and 17.89 percent respectively in the same period of the previous fiscal year. Out of the middle east countries, the
Bangladesh Economic Update, April 2014 Page | 16
In addition, expatriates are not interested in sending money in home by considering the current political unrest of the country.
largest share of remittance comes from saudi Arabia which decreased from 27.75 percent to 27.25 percent in FY 2012-13. Share of remittance from Kuwait and Qatar showed a declining rate of 8.44 and 2.04 percent respectively than 8.93 and 2.52 percent respectively in the previous fiscal year. Among the Europe-America, share of remittance from UK, Germany and Italy decreased in FY 2012-13. Moreover, recruitment of Bangladeshi workers virtually stopped to Kuwait and the United Arab Emirates while it showed slower rate of remittances in Oman, Saudi Arabia and Malaysia over the years. In addition, expatriates are not interested in sending money in home by considering the current political unrest of the country. Table 3: Major sectors of export earnings during July-January
Middle east countries 2011-12 2012-13 Saudi Arabia 27.75 27.25
Kuwait 8.93 8.44 U.A.E. 18.12 20.12
Bahrain 2.26 2.57 Qatar 2.52 2.04 Oman 3.02 4.34 Libya 0.10 0.41 Iran 0.01 0.02
Europe-America USA 11.26 13.21 UK 7.43 7.06
Germany 0.26 0.18 Italy 1.82 1.66
Except Middle east Australia 0.40 0.43
Hong Kong 0.17 0.14 Malaysia 6.39 7.08 Singapore 2.36 3.54
Japan 0.17 0.15 South Korea 0.23 0.44
Source: Authors’ calculation based on Bangladesh Economic Review, Bangladesh Bank, 2014 Government have taken several policies to attract the remittance inflow through proper channels. 37 banks set up 1084 drawing arrangements with 288 exchange houses all over the world for collection of remittances. To ease remittance disbursement, BEFTN and mobile banking are operating in full-swing. Moreover, micro finance institutions (MFIs) and Mobile banking services are involved to get a
Bangladesh Economic Update, April 2014 Page | 17
In general, portfolio investment is a passive investment in securities, which entails no active management or control of the securities by the investor.
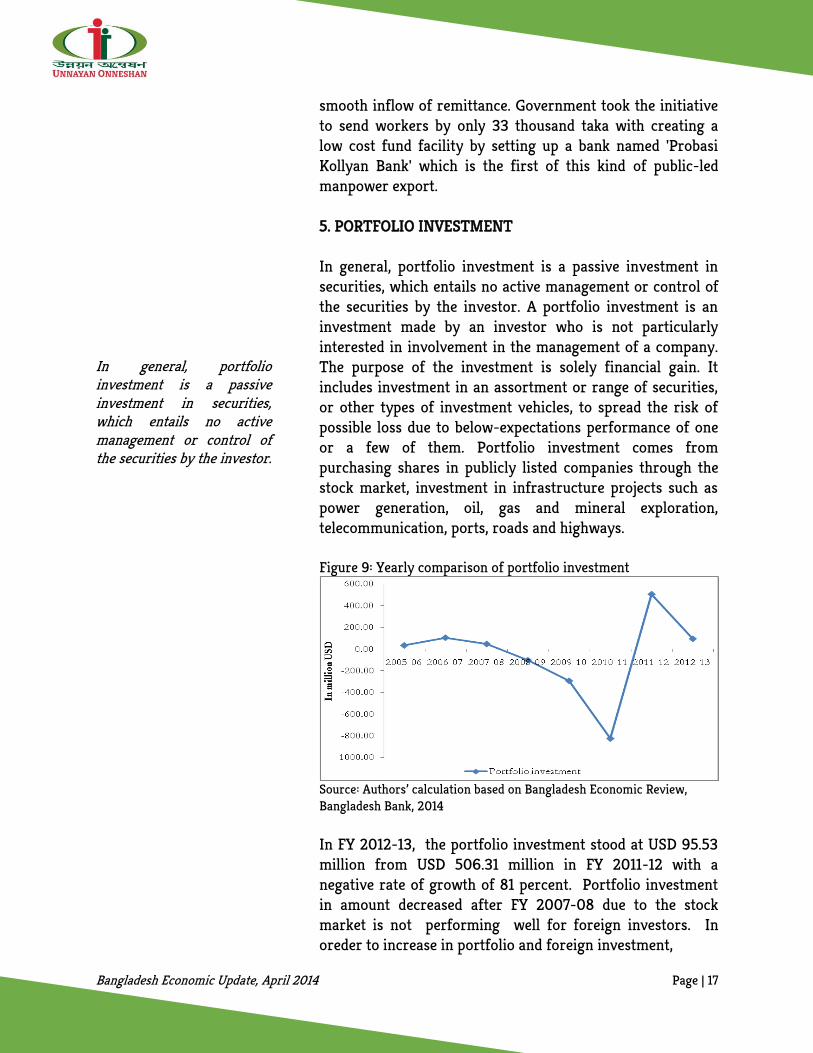
smooth inflow of remittance. Government took the initiative to send workers by only 33 thousand taka with creating a low cost fund facility by setting up a bank named 'Probasi Kollyan Bank' which is the first of this kind of public-led manpower export. 5. PORTFOLIO INVESTMENT In general, portfolio investment is a passive investment in securities, which entails no active management or control of the securities by the investor. A portfolio investment is an investment made by an investor who is not particularly interested in involvement in the management of a company. The purpose of the investment is solely financial gain. It includes investment in an assortment or range of securities, or other types of investment vehicles, to spread the risk of possible loss due to below-expectations performance of one or a few of them. Portfolio investment comes from purchasing shares in publicly listed companies through the stock market, investment in infrastructure projects such as power generation, oil, gas and mineral exploration, telecommunication, ports, roads and highways. Figure 9: Yearly comparison of portfolio investment
Source: Authors’ calculation based on Bangladesh Economic Review, Bangladesh Bank, 2014
In FY 2012-13, the portfolio investment stood at USD 95.53 million from USD 506.31 million in FY 2011-12 with a negative rate of growth of 81 percent. Portfolio investment in amount decreased after FY 2007-08 due to the stock market is not performing well for foreign investors. In oreder to increase in portfolio and foreign investment,
Bangladesh Economic Update, April 2014 Page | 18
In the capital market, foreign portfolio investment showed an irregular trend over the months of 2013 as investors bet on lower prices. In addition, the turn over decreased drastically in August and September in 2013 by 53.31 and 54.31 percent respectively due to the various political uncertainties, strikes and blockades over the months of calendar year 2013.
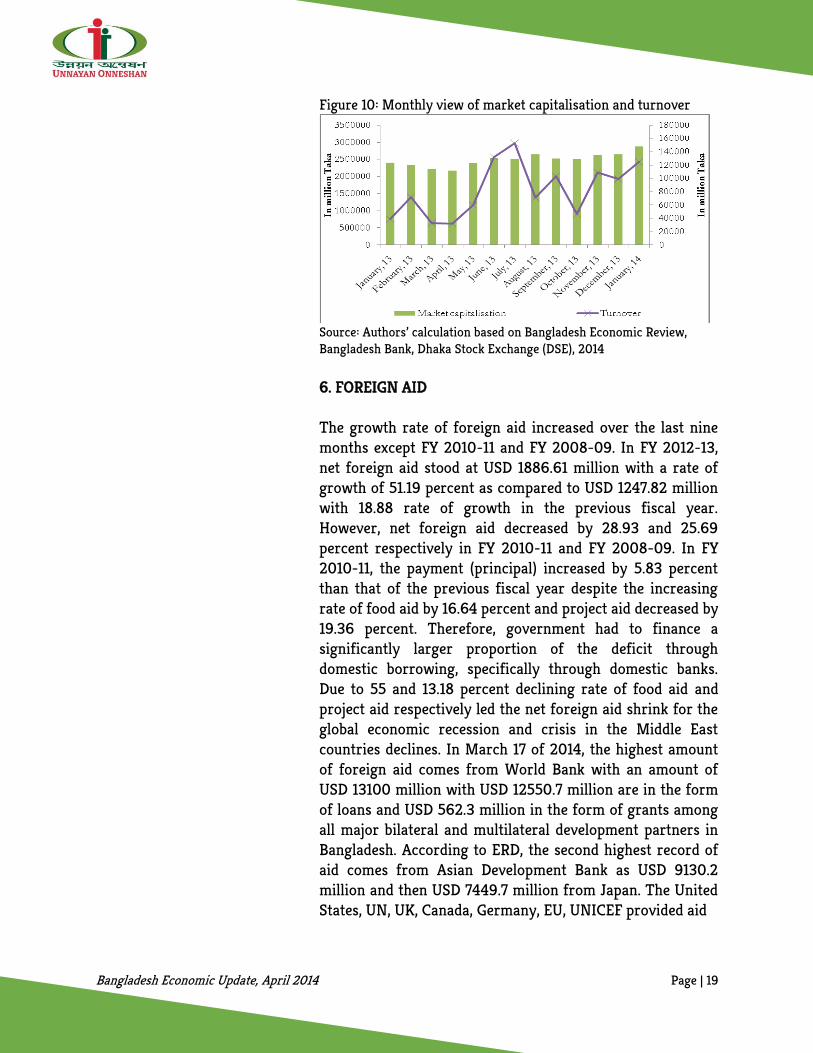
Bangladesh has adopted a liberal industrial policy to attract foreign investment. During July-January of FY 2013-14, total portfolio investment stood at USD 337 million which is 88.27 percent higher as comparison to USD 179 million with a rate of growth 90.43 percent than that of the same period of the previous fiscal year. Portfolio investment showed an increasing trend due to the various policy measures have already taken by the government. In the capital market, foreign portfolio investment showed an irregular trend over the months of 2013 as investors bet on lower prices. Turnover increased by 25.93 percent in January of the calendar year 2013 than that of the negative rate of growth of January, 2012 as -8.90 percent. Foreign investment makes up only around 2% of total investment at DSE, which is lowest in South Asia region. In recent months, lower prices of stocks and attractive yield of government securities and appreciation of taka against dollars showed the increasing trend of the net foreign portfolio investment. At the end of January of 2014 stood higher at 4753.17 as compared to the index of 4266.55 at the end of the previous month of 2013. Total market capitalization of all shares and debentures of the listed securities increased by 8.60 percent from 0.48 percent of the previous month of 2013. Political violence made foreign investors to pack up and get out of the market to save their investment. In addition, the turn over decreased drastically in August and September in 2013 by 53.31 and 54.31 percent respectively due to the various political uncertainties, strikes and blockades over the months of calendar year 2013.
Bangladesh Economic Update, April 2014 Page | 19
Figure 10: Monthly view of market capitalisation and turnover
Source: Authors’ calculation based on Bangladesh Economic Review, Bangladesh Bank, Dhaka Stock Exchange (DSE), 2014 6. FOREIGN AID The growth rate of foreign aid increased over the last nine months except FY 2010-11 and FY 2008-09. In FY 2012-13, net foreign aid stood at USD 1886.61 million with a rate of growth of 51.19 percent as compared to USD 1247.82 million with 18.88 rate of growth in the previous fiscal year. However, net foreign aid decreased by 28.93 and 25.69 percent respectively in FY 2010-11 and FY 2008-09. In FY 2010-11, the payment (principal) increased by 5.83 percent than that of the previous fiscal year despite the increasing rate of food aid by 16.64 percent and project aid decreased by 19.36 percent. Therefore, government had to finance a significantly larger proportion of the deficit through domestic borrowing, specifically through domestic banks. Due to 55 and 13.18 percent declining rate of food aid and project aid respectively led the net foreign aid shrink for the global economic recession and crisis in the Middle East countries declines. In March 17 of 2014, the highest amount of foreign aid comes from World Bank with an amount of USD 13100 million with USD 12550.7 million are in the form of loans and USD 562.3 million in the form of grants among all major bilateral and multilateral development partners in Bangladesh. According to ERD, the second highest record of aid comes from Asian Development Bank as USD 9130.2 million and then USD 7449.7 million from Japan. The United States, UN, UK, Canada, Germany, EU, UNICEF provided aid
Bangladesh Economic Update, April 2014 Page | 20
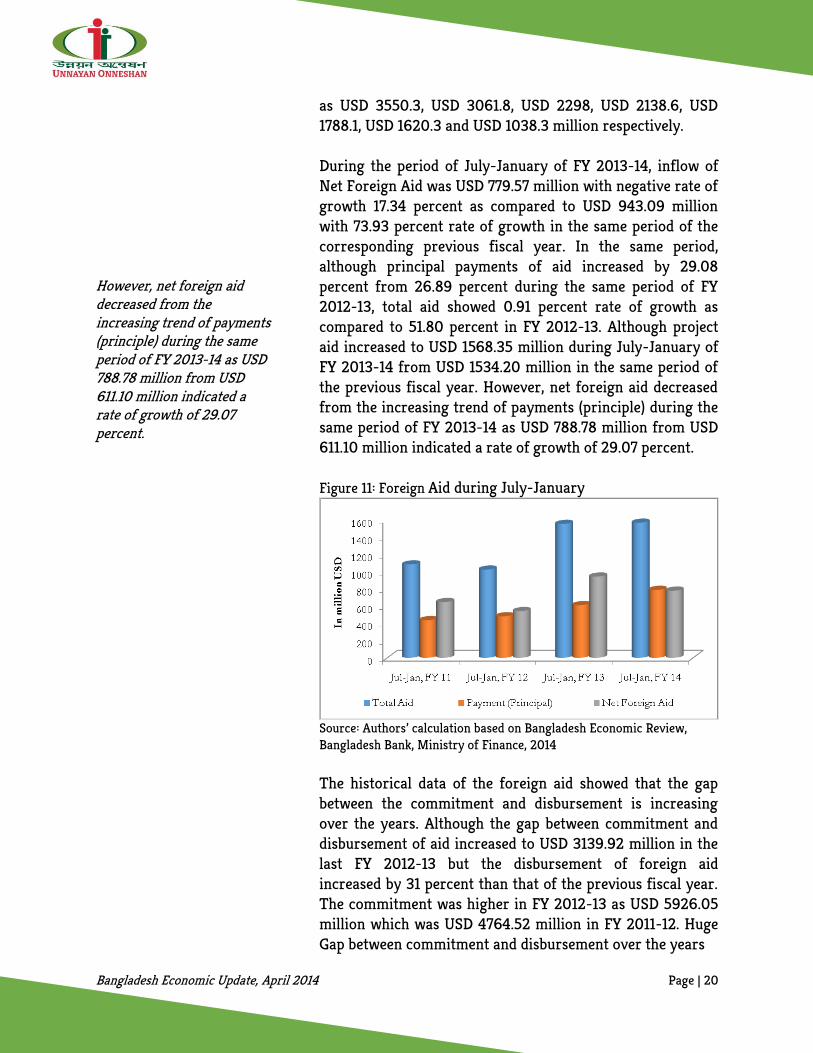
However, net foreign aid decreased from the increasing trend of payments (principle) during the same period of FY 2013-14 as USD 788.78 million from USD 611.10 million indicated a rate of growth of 29.07 percent.
as USD 3550.3, USD 3061.8, USD 2298, USD 2138.6, USD 1788.1, USD 1620.3 and USD 1038.3 million respectively. During the period of July-January of FY 2013-14, inflow of Net Foreign Aid was USD 779.57 million with negative rate of growth 17.34 percent as compared to USD 943.09 million with 73.93 percent rate of growth in the same period of the corresponding previous fiscal year. In the same period, although principal payments of aid increased by 29.08 percent from 26.89 percent during the same period of FY 2012-13, total aid showed 0.91 percent rate of growth as compared to 51.80 percent in FY 2012-13. Although project aid increased to USD 1568.35 million during July-January of FY 2013-14 from USD 1534.20 million in the same period of the previous fiscal year. However, net foreign aid decreased from the increasing trend of payments (principle) during the same period of FY 2013-14 as USD 788.78 million from USD 611.10 million indicated a rate of growth of 29.07 percent. Figure 11: Foreign Aid during July-January
Source: Authors’ calculation based on Bangladesh Economic Review, Bangladesh Bank, Ministry of Finance, 2014 The historical data of the foreign aid showed that the gap between the commitment and disbursement is increasing over the years. Although the gap between commitment and disbursement of aid increased to USD 3139.92 million in the last FY 2012-13 but the disbursement of foreign aid increased by 31 percent than that of the previous fiscal year. The commitment was higher in FY 2012-13 as USD 5926.05 million which was USD 4764.52 million in FY 2011-12. Huge Gap between commitment and disbursement over the years
Bangladesh Economic Update, April 2014 Page | 21
Bangladesh have to repay the principal amount and interest against the outstanding disbursed external loans and also repay the commitment fees and some other charges for funds non-disbursed but committed by the donors.
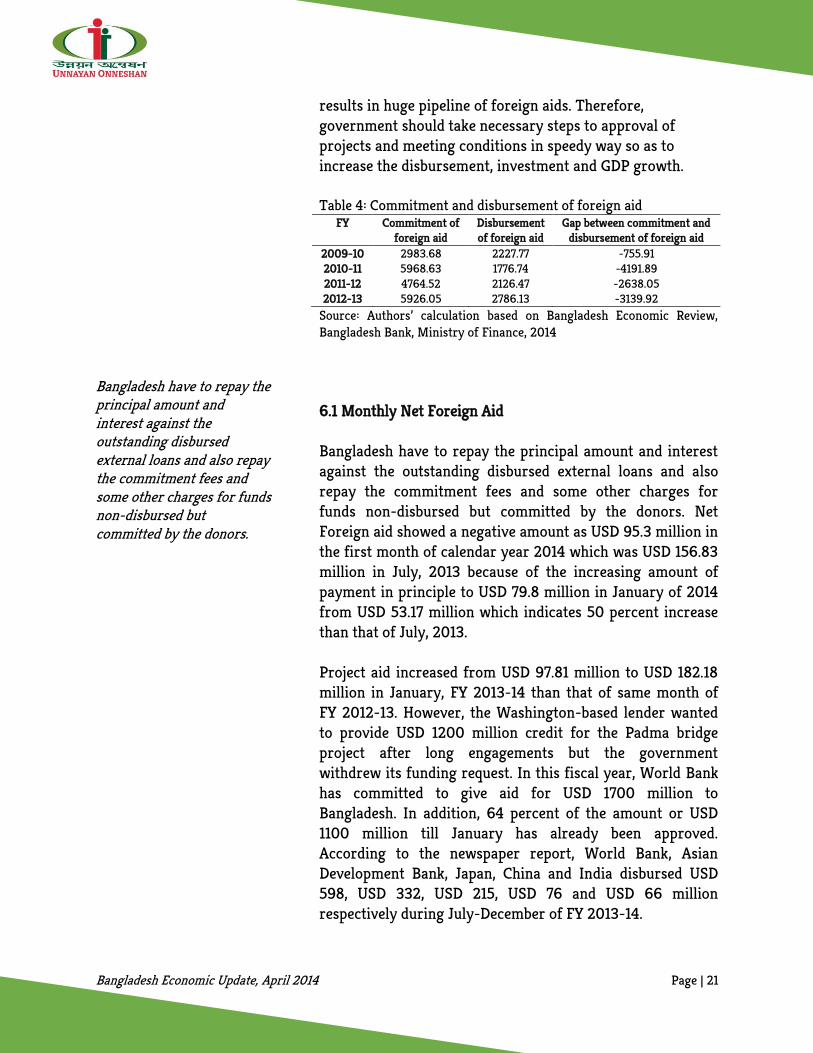
results in huge pipeline of foreign aids. Therefore, government should take necessary steps to approval of projects and meeting conditions in speedy way so as to increase the disbursement, investment and GDP growth. Table 4: Commitment and disbursement of foreign aid
FY Commitment of foreign aid
Disbursement of foreign aid
Gap between commitment and disbursement of foreign aid
2009-10 2983.68 2227.77 -755.91 2010-11 5968.63 1776.74 -4191.89 2011-12 4764.52 2126.47 -2638.05 2012-13 5926.05 2786.13 -3139.92
Source: Authors’ calculation based on Bangladesh Economic Review, Bangladesh Bank, Ministry of Finance, 2014 6.1 Monthly Net Foreign Aid Bangladesh have to repay the principal amount and interest against the outstanding disbursed external loans and also repay the commitment fees and some other charges for funds non-disbursed but committed by the donors. Net Foreign aid showed a negative amount as USD 95.3 million in the first month of calendar year 2014 which was USD 156.83 million in July, 2013 because of the increasing amount of payment in principle to USD 79.8 million in January of 2014 from USD 53.17 million which indicates 50 percent increase than that of July, 2013. Project aid increased from USD 97.81 million to USD 182.18 million in January, FY 2013-14 than that of same month of FY 2012-13. However, the Washington-based lender wanted to provide USD 1200 million credit for the Padma bridge project after long engagements but the government withdrew its funding request. In this fiscal year, World Bank has committed to give aid for USD 1700 million to Bangladesh. In addition, 64 percent of the amount or USD 1100 million till January has already been approved. According to the newspaper report, World Bank, Asian Development Bank, Japan, China and India disbursed USD 598, USD 332, USD 215, USD 76 and USD 66 million respectively during July-December of FY 2013-14.
Bangladesh Economic Update, April 2014 Page | 22
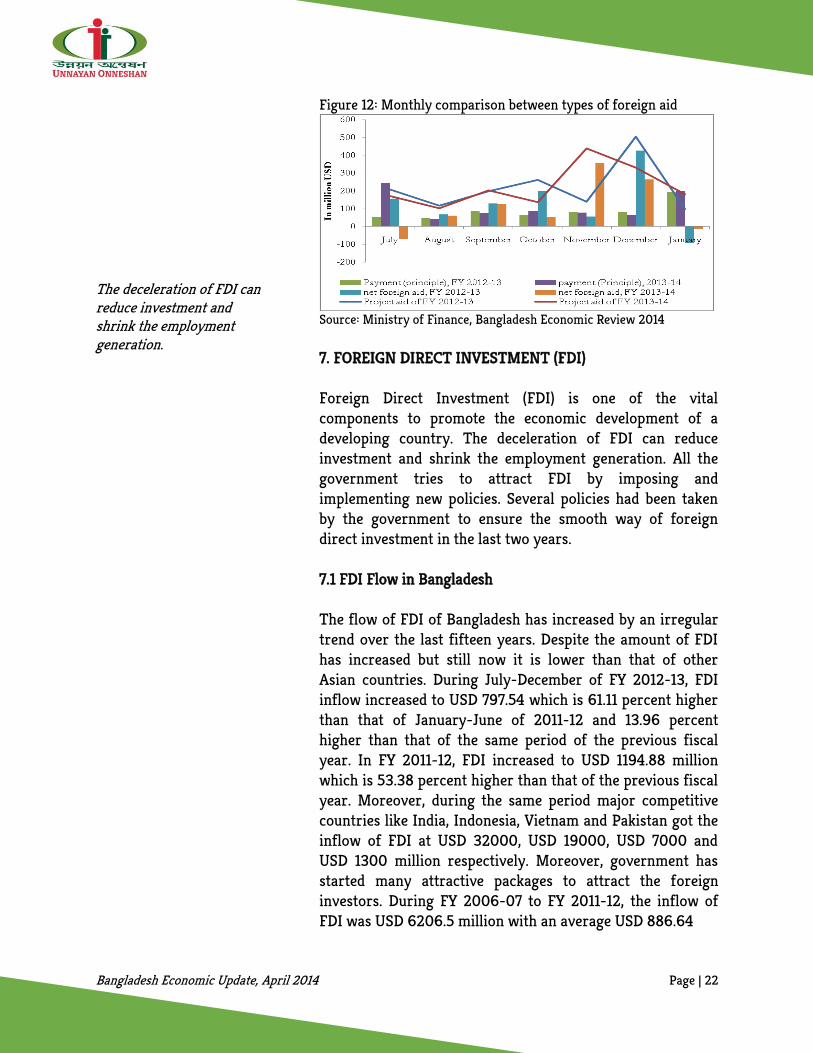
The deceleration of FDI can reduce investment and shrink the employment generation.
Figure 12: Monthly comparison between types of foreign aid
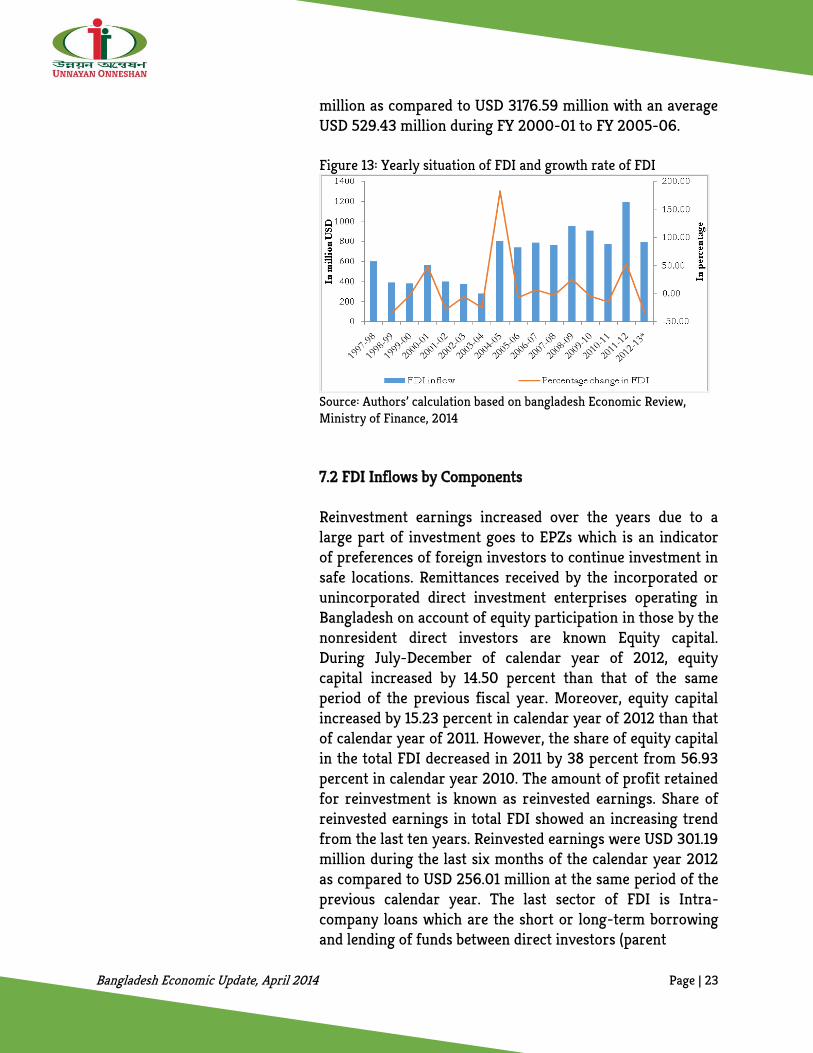
Source: Ministry of Finance, Bangladesh Economic Review 2014 7. FOREIGN DIRECT INVESTMENT (FDI) Foreign Direct Investment (FDI) is one of the vital components to promote the economic development of a developing country. The deceleration of FDI can reduce investment and shrink the employment generation. All the government tries to attract FDI by imposing and implementing new policies. Several policies had been taken by the government to ensure the smooth way of foreign direct investment in the last two years. 7.1 FDI Flow in Bangladesh The flow of FDI of Bangladesh has increased by an irregular trend over the last fifteen years. Despite the amount of FDI has increased but still now it is lower than that of other Asian countries. During July-December of FY 2012-13, FDI inflow increased to USD 797.54 which is 61.11 percent higher than that of January-June of 2011-12 and 13.96 percent higher than that of the same period of the previous fiscal year. In FY 2011-12, FDI increased to USD 1194.88 million which is 53.38 percent higher than that of the previous fiscal year. Moreover, during the same period major competitive countries like India, Indonesia, Vietnam and Pakistan got the inflow of FDI at USD 32000, USD 19000, USD 7000 and USD 1300 million respectively. Moreover, government has started many attractive packages to attract the foreign investors. During FY 2006-07 to FY 2011-12, the inflow of FDI was USD 6206.5 million with an average USD 886.64
Bangladesh Economic Update, April 2014 Page | 23
million as compared to USD 3176.59 million with an average USD 529.43 million during FY 2000-01 to FY 2005-06. Figure 13: Yearly situation of FDI and growth rate of FDI
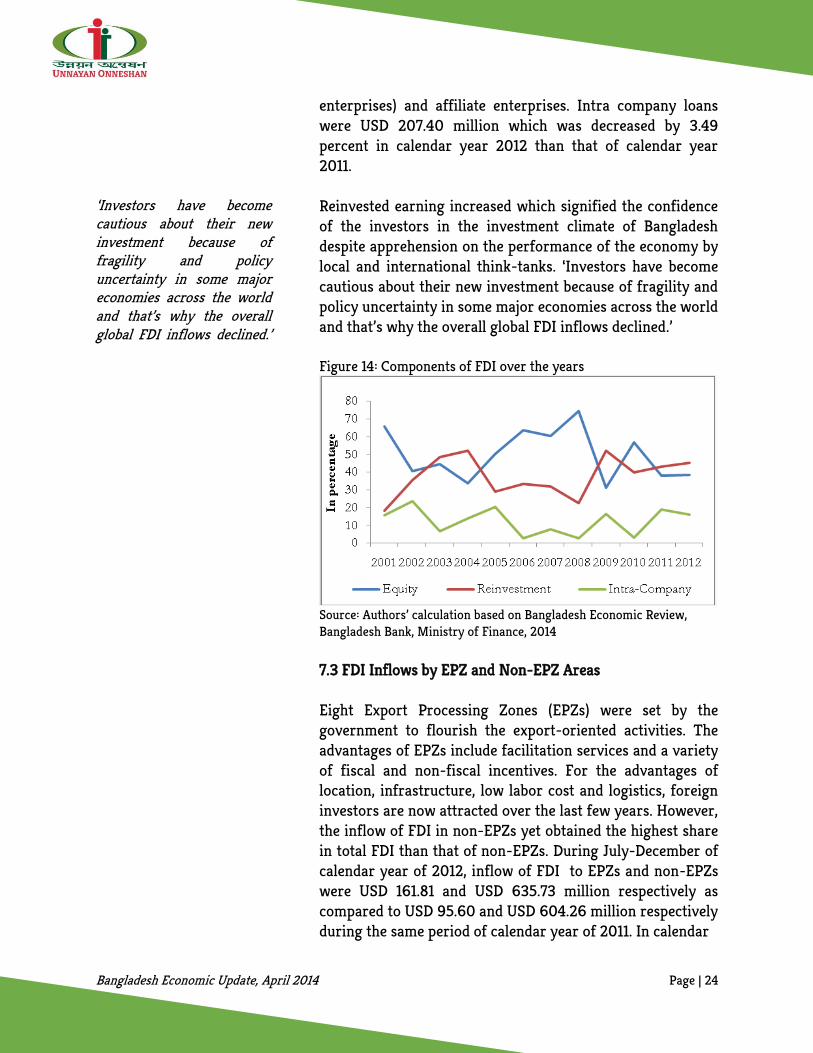
Source: Authors’ calculation based on bangladesh Economic Review, Ministry of Finance, 2014 7.2 FDI Inflows by Components Reinvestment earnings increased over the years due to a large part of investment goes to EPZs which is an indicator of preferences of foreign investors to continue investment in safe locations. Remittances received by the incorporated or unincorporated direct investment enterprises operating in Bangladesh on account of equity participation in those by the nonresident direct investors are known Equity capital. During July-December of calendar year of 2012, equity capital increased by 14.50 percent than that of the same period of the previous fiscal year. Moreover, equity capital increased by 15.23 percent in calendar year of 2012 than that of calendar year of 2011. However, the share of equity capital in the total FDI decreased in 2011 by 38 percent from 56.93 percent in calendar year 2010. The amount of profit retained for reinvestment is known as reinvested earnings. Share of reinvested earnings in total FDI showed an increasing trend from the last ten years. Reinvested earnings were USD 301.19 million during the last six months of the calendar year 2012 as compared to USD 256.01 million at the same period of the previous calendar year. The last sector of FDI is Intra-company loans which are the short or long-term borrowing and lending of funds between direct investors (parent
Bangladesh Economic Update, April 2014 Page | 24
‘Investors have become cautious about their new investment because of fragility and policy uncertainty in some major economies across the world and that’s why the overall global FDI inflows declined.’
enterprises) and affiliate enterprises. Intra company loans were USD 207.40 million which was decreased by 3.49 percent in calendar year 2012 than that of calendar year 2011. Reinvested earning increased which signified the confidence of the investors in the investment climate of Bangladesh despite apprehension on the performance of the economy by local and international think-tanks. ‘Investors have become cautious about their new investment because of fragility and policy uncertainty in some major economies across the world and that’s why the overall global FDI inflows declined.’ Figure 14: Components of FDI over the years
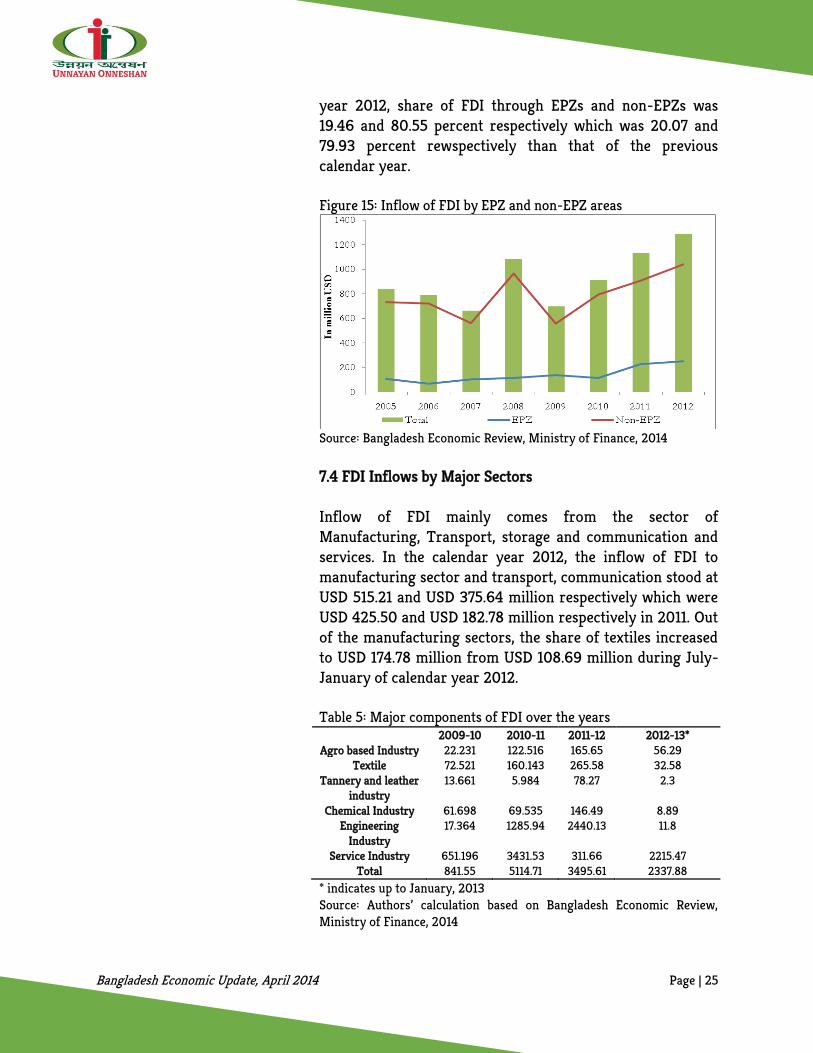
Source: Authors’ calculation based on Bangladesh Economic Review, Bangladesh Bank, Ministry of Finance, 2014 7.3 FDI Inflows by EPZ and Non-EPZ Areas Eight Export Processing Zones (EPZs) were set by the government to flourish the export-oriented activities. The advantages of EPZs include facilitation services and a variety of fiscal and non-fiscal incentives. For the advantages of location, infrastructure, low labor cost and logistics, foreign investors are now attracted over the last few years. However, the inflow of FDI in non-EPZs yet obtained the highest share in total FDI than that of non-EPZs. During July-December of calendar year of 2012, inflow of FDI to EPZs and non-EPZs were USD 161.81 and USD 635.73 million respectively as compared to USD 95.60 and USD 604.26 million respectively during the same period of calendar year of 2011. In calendar
Bangladesh Economic Update, April 2014 Page | 25
year 2012, share of FDI through EPZs and non-EPZs was 19.46 and 80.55 percent respectively which was 20.07 and 79.93 percent rewspectively than that of the previous calendar year. Figure 15: Inflow of FDI by EPZ and non-EPZ areas
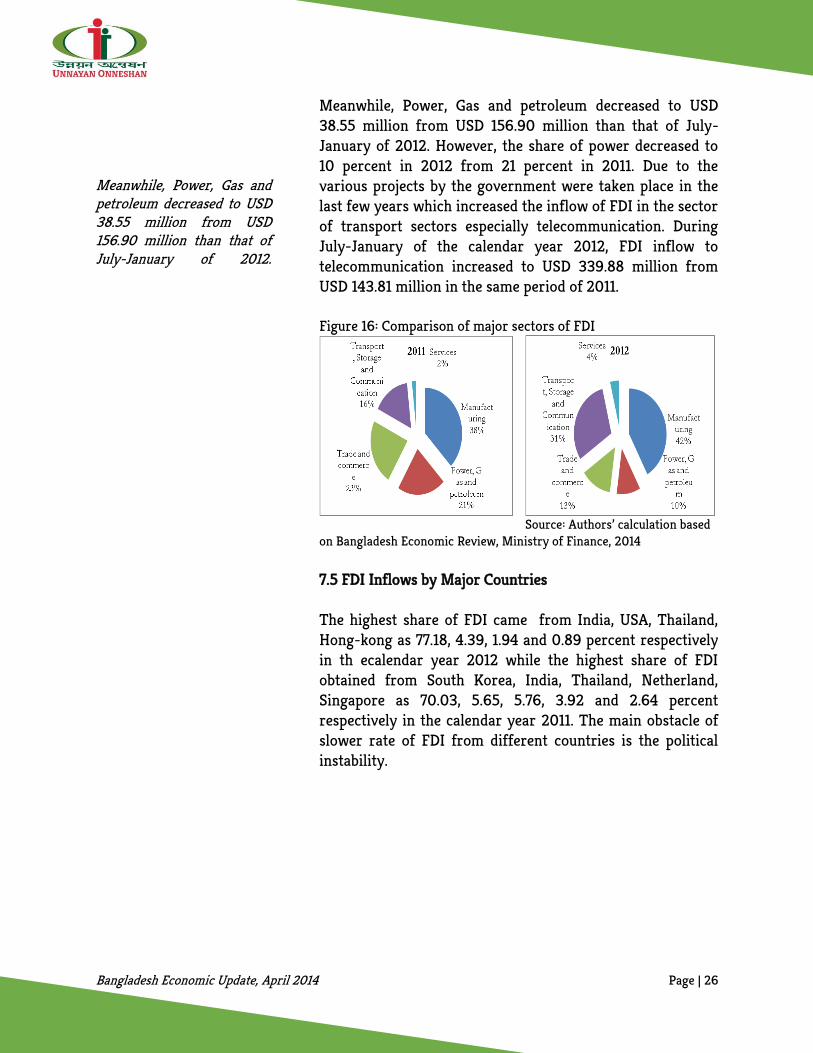
Source: Bangladesh Economic Review, Ministry of Finance, 2014 7.4 FDI Inflows by Major Sectors Inflow of FDI mainly comes from the sector of Manufacturing, Transport, storage and communication and services. In the calendar year 2012, the inflow of FDI to manufacturing sector and transport, communication stood at USD 515.21 and USD 375.64 million respectively which were USD 425.50 and USD 182.78 million respectively in 2011. Out of the manufacturing sectors, the share of textiles increased to USD 174.78 million from USD 108.69 million during July-January of calendar year 2012. Table 5: Major components of FDI over the years
2009-10 2010-11 2011-12 2012-13* Agro based Industry 22.231 122.516 165.65 56.29
Textile 72.521 160.143 265.58 32.58 Tannery and leather
industry 13.661 5.984 78.27 2.3
Chemical Industry 61.698 69.535 146.49 8.89 Engineering
Industry 17.364 1285.94 2440.13 11.8
Service Industry 651.196 3431.53 311.66 2215.47 Total 841.55 5114.71 3495.61 2337.88
* indicates up to January, 2013 Source: Authors’ calculation based on Bangladesh Economic Review, Ministry of Finance, 2014
Bangladesh Economic Update, April 2014 Page | 26
Meanwhile, Power, Gas and petroleum decreased to USD 38.55 million from USD 156.90 million than that of July-January of 2012.
Meanwhile, Power, Gas and petroleum decreased to USD 38.55 million from USD 156.90 million than that of July-January of 2012. However, the share of power decreased to 10 percent in 2012 from 21 percent in 2011. Due to the various projects by the government were taken place in the last few years which increased the inflow of FDI in the sector of transport sectors especially telecommunication. During July-January of the calendar year 2012, FDI inflow to telecommunication increased to USD 339.88 million from USD 143.81 million in the same period of 2011. Figure 16: Comparison of major sectors of FDI
Source: Authors’ calculation based on Bangladesh Economic Review, Ministry of Finance, 2014 7.5 FDI Inflows by Major Countries The highest share of FDI came from India, USA, Thailand, Hong-kong as 77.18, 4.39, 1.94 and 0.89 percent respectively in th ecalendar year 2012 while the highest share of FDI obtained from South Korea, India, Thailand, Netherland, Singapore as 70.03, 5.65, 5.76, 3.92 and 2.64 percent respectively in the calendar year 2011. The main obstacle of slower rate of FDI from different countries is the political instability.
Bangladesh Economic Update, April 2014 Page | 27
Table 6: Share of Major sectors in FDI inflow Country 2010-11 2011-12 2012-13
Saudi Arabia 0.14 0.07 0.00 America 16.55 0.23 4.39 Thailand 1.91 5.76 1.94
India 1.33 5.65 77.18 South Korea 64.07 70.03 0.28
Malaysia 2.68 0.31 0.24 The Netherlands 2.22 3.92 0.10
Singapore 2.60 2.64 0.27 Hong Kong 0.88 0.46 0.89
German 1.64 0.76 0.00 Source: Authors’ calculation based on Bangladesh Economic Review, Ministry of Finance, 2014 Table 7: Incentives and facilities to attract FDI Incentives Facilities 1. The established industries before
1st January, 2012 can enjoy 10 years tax holiday and for the industries which set up after 31st december, 2011 enjoys the tax exemption for the first 2 years is 100 percent and tax exemption is 50 and 25 percent for the next 2 years and next 1 years respectively.
1. No UD, IRC, ERC and renewal of Bond licens, secured and protected bonded area and accords Residentship and Cityzenship
2. Duty free import of construction materials, machineries, office equipment & spare parts, raw materials and finished goods
2. Import on Documentary Acceptance (DA) basic allowed
3. Relief from double taxation and Exemption from divident tax
3. Back to Back L/C
4. Duty & quota free access to EU, Canada, Norway, Australia etc.
4. Import and Export on CM basis allowed
5. 100% foreign ownership permissible and no ceiling on foreign and local investment
5. Import from DTA (Domestic Tariff Area) and 10% sale to DTA (Domestic Tariff Area)
6. Foreign Currency loan from abroad under direct automatic route
6. Sub-contracting with export oriented Industries inside and outside EPZ allowed
Source: Adapted from Export Processing Zones (EPZ), 2014 8. PRIVATE SECTOR LOAN Bangladesh is a developing country with a deficit budget over the years. To finance all of the sectors, it has to face the
Bangladesh Economic Update, April 2014 Page | 28
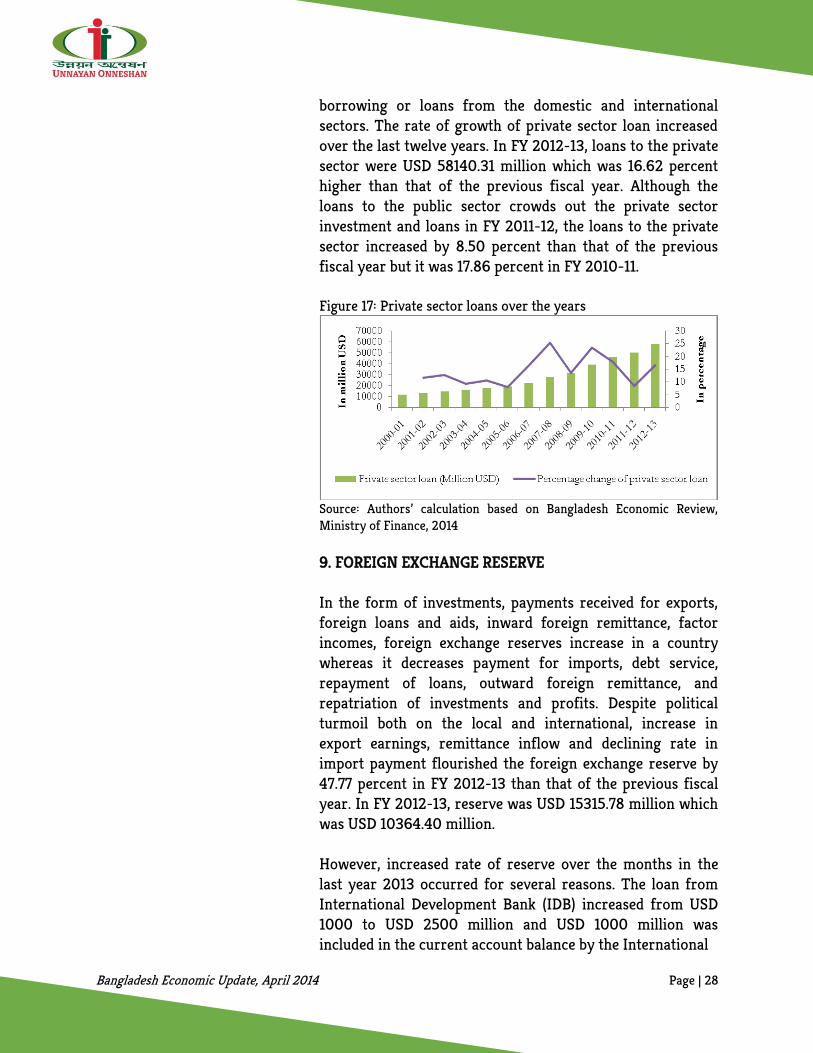
borrowing or loans from the domestic and international sectors. The rate of growth of private sector loan increased over the last twelve years. In FY 2012-13, loans to the private sector were USD 58140.31 million which was 16.62 percent higher than that of the previous fiscal year. Although the loans to the public sector crowds out the private sector investment and loans in FY 2011-12, the loans to the private sector increased by 8.50 percent than that of the previous fiscal year but it was 17.86 percent in FY 2010-11. Figure 17: Private sector loans over the years
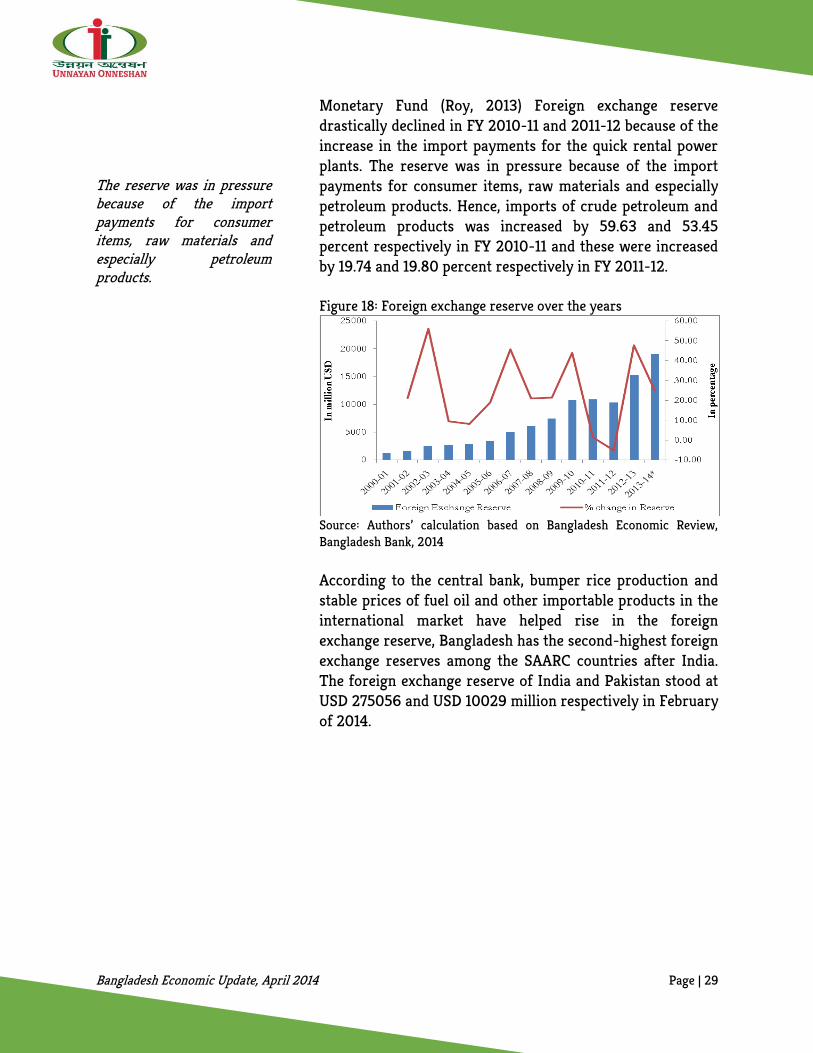
Source: Authors’ calculation based on Bangladesh Economic Review, Ministry of Finance, 2014 9. FOREIGN EXCHANGE RESERVE In the form of investments, payments received for exports, foreign loans and aids, inward foreign remittance, factor incomes, foreign exchange reserves increase in a country whereas it decreases payment for imports, debt service, repayment of loans, outward foreign remittance, and repatriation of investments and profits. Despite political turmoil both on the local and international, increase in export earnings, remittance inflow and declining rate in import payment flourished the foreign exchange reserve by 47.77 percent in FY 2012-13 than that of the previous fiscal year. In FY 2012-13, reserve was USD 15315.78 million which was USD 10364.40 million. However, increased rate of reserve over the months in the last year 2013 occurred for several reasons. The loan from International Development Bank (IDB) increased from USD 1000 to USD 2500 million and USD 1000 million was included in the current account balance by the International
Bangladesh Economic Update, April 2014 Page | 29
The reserve was in pressure because of the import payments for consumer items, raw materials and especially petroleum products.
Monetary Fund (Roy, 2013) Foreign exchange reserve drastically declined in FY 2010-11 and 2011-12 because of the increase in the import payments for the quick rental power plants. The reserve was in pressure because of the import payments for consumer items, raw materials and especially petroleum products. Hence, imports of crude petroleum and petroleum products was increased by 59.63 and 53.45 percent respectively in FY 2010-11 and these were increased by 19.74 and 19.80 percent respectively in FY 2011-12. Figure 18: Foreign exchange reserve over the years
Source: Authors’ calculation based on Bangladesh Economic Review, Bangladesh Bank, 2014 According to the central bank, bumper rice production and stable prices of fuel oil and other importable products in the international market have helped rise in the foreign exchange reserve, Bangladesh has the second-highest foreign exchange reserves among the SAARC countries after India. The foreign exchange reserve of India and Pakistan stood at USD 275056 and USD 10029 million respectively in February of 2014.
Bangladesh Economic Update, April 2014 Page | 30
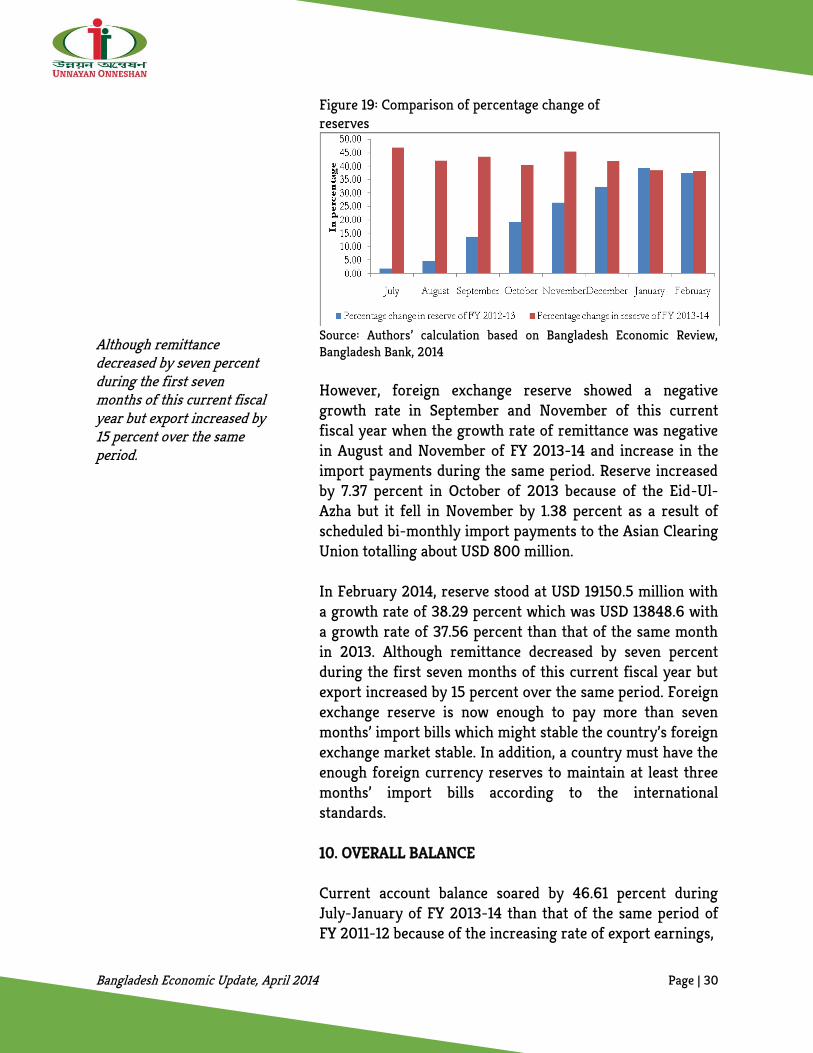
Although remittance decreased by seven percent during the first seven months of this current fiscal year but export increased by 15 percent over the same period.
Figure 19: Comparison of percentage change of reserves
Source: Authors’ calculation based on Bangladesh Economic Review, Bangladesh Bank, 2014 However, foreign exchange reserve showed a negative growth rate in September and November of this current fiscal year when the growth rate of remittance was negative in August and November of FY 2013-14 and increase in the import payments during the same period. Reserve increased by 7.37 percent in October of 2013 because of the Eid-Ul-Azha but it fell in November by 1.38 percent as a result of scheduled bi-monthly import payments to the Asian Clearing Union totalling about USD 800 million. In February 2014, reserve stood at USD 19150.5 million with a growth rate of 38.29 percent which was USD 13848.6 with a growth rate of 37.56 percent than that of the same month in 2013. Although remittance decreased by seven percent during the first seven months of this current fiscal year but export increased by 15 percent over the same period. Foreign exchange reserve is now enough to pay more than seven months’ import bills which might stable the country’s foreign exchange market stable. In addition, a country must have the enough foreign currency reserves to maintain at least three months’ import bills according to the international standards. 10. OVERALL BALANCE Current account balance soared by 46.61 percent during July-January of FY 2013-14 than that of the same period of FY 2011-12 because of the increasing rate of export earnings,
Bangladesh Economic Update, April 2014 Page | 31
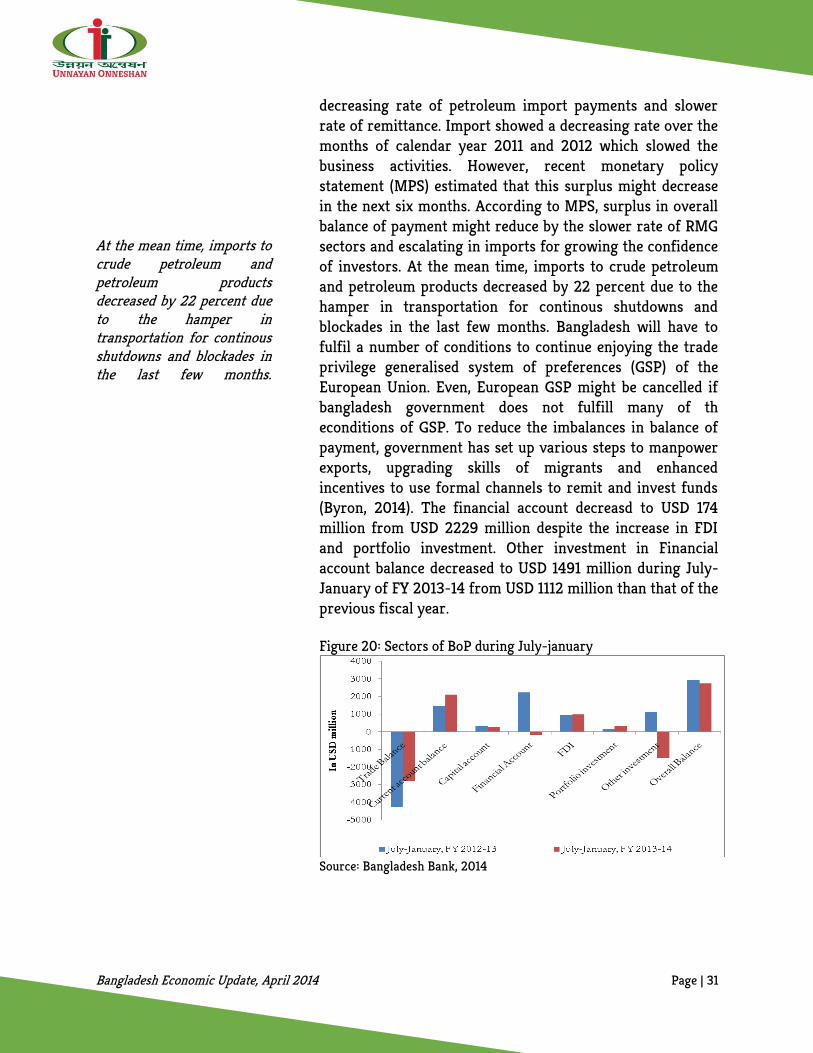
At the mean time, imports to crude petroleum and petroleum products decreased by 22 percent due to the hamper in transportation for continous shutdowns and blockades in the last few months.
decreasing rate of petroleum import payments and slower rate of remittance. Import showed a decreasing rate over the months of calendar year 2011 and 2012 which slowed the business activities. However, recent monetary policy statement (MPS) estimated that this surplus might decrease in the next six months. According to MPS, surplus in overall balance of payment might reduce by the slower rate of RMG sectors and escalating in imports for growing the confidence of investors. At the mean time, imports to crude petroleum and petroleum products decreased by 22 percent due to the hamper in transportation for continous shutdowns and blockades in the last few months. Bangladesh will have to fulfil a number of conditions to continue enjoying the trade privilege generalised system of preferences (GSP) of the European Union. Even, European GSP might be cancelled if bangladesh government does not fulfill many of th econditions of GSP. To reduce the imbalances in balance of payment, government has set up various steps to manpower exports, upgrading skills of migrants and enhanced incentives to use formal channels to remit and invest funds (Byron, 2014). The financial account decreasd to USD 174 million from USD 2229 million despite the increase in FDI and portfolio investment. Other investment in Financial account balance decreased to USD 1491 million during July-January of FY 2013-14 from USD 1112 million than that of the previous fiscal year.
Figure 20: Sectors of BoP during July-january
Source: Bangladesh Bank, 2014
Bangladesh Economic Update, April 2014 Page | 32
Although the economy observed a comfortable current account balance, the decreasing rate of remittance and manpower exports might cause a serious hamper to the economy by reducing employment opportunities and output levels.
11. CONCLUSION Although the economy observed a comfortable current account balance, the decreasing rate of remittance and manpower exports might cause a serious hamper to the economy by reducing employment opportunities and output levels. In addition, declining investment demand-induced decreased import of capital machinery and industrial raw goods may further aggravate the current declining growth in the manufacturing sector. After exploring the implications of unsatisfactory performances of the external sector, the Update concludes that the declining growth in GDP may persist if the indicators of external sector continue assuming current trends. However, in order to address the current structural bottlenecks that impede developments in the external sector of Bangladesh economy, a thorough re-examination of the current trade and industrial policies is pressing. Adoption of a new policy regime aiming at expansion of productive capacities of the country that enhances utilisation of productive resources through enhanced entrepreneurial capabilities and increased production linkages may be fruitful in achieving developments in this sector, thereby fostering growth of the economy.
Bangladesh Economic Update, April 2014 Page | 33
Reference Bangladesh Bank. 2014, Major Economic Indicators: Monthly Update. Dhaka, Bangladesh:
Bangladesh Bank. Available at: http://www.bangladesh-bank.org/econdata/openpdf.php?i=6 [Accessed 19 february 2014].
Bangladesh Bank. 2014, Selected indicators. Dhaka, Bangladesh: Bangladesh Bank. Available at:
http://www.bangladesh-bank.org/econdata/openpdf.php?i=1 [Accessed 19 february 2014].
Bangladesh Bank. 2014, Monthly Economic Trends, Frbruary 2014. Dhaka, Bangladesh:
Bangladesh Bank. Available at: http://www.bangladesh-bank.org/pub/monthly/econtrds/feb14/econtrds.php [Accessed 20 february 2014].
Bangladesh Bureau of Statistics (BBS), 2010. Household Income and Expenditure Survey 2010,
Dhaka: BBS. Ministry of Finance. 2014, Bangladesh Economic Review. Dhaka, Bangladesh: Finance Division,
Ministry of Finance, Government of Bangladesh. Available at: http://www.mof.gov.bd/en/index.php?option=com_content&view=article&id=72&Itemid=11 [Accessed 21 February 2012]
Ministry of Finance. 2014, Monthly fiscal macro update. Dhaka, Bangladesh: Finance Division,
Ministry of Finance, Government of Bangladesh. Available at: http://www.mof.gov.bd/en/index.php?option=com_content&view=article&id=69&Itemid=1
[Accessed 23 February 2012]. Bhattacharya, D. 2003, State of the bangladesh economy in FY 2002-2003 A Macroeconomic
Overview, Dhaka, Bangladesh. Available at: http://www.cpd.org.bd/downloads/IRBD/budgetFY03.pdf [Accessed 23 March 2014 ]
Roy, N. 2013, External Balance: Evolving Explosures. In. Titumir, R.A.M. (ed). Exigency or
Expediency? State of Bangladesh Economy and Development, 2012-13 Dhaka: Shrabon Prokashani. Pp.103-124.
Roy, M., Borsha, F.H. 2013, Hartal: A violent Challenge to the Socio-Economic Development of
Bangladesh, International Journal Of Scientific & Technology Research, vol. 2, no.8, pp.86-97. Bangladesh: Unnayan Onneshan. Available at: http://www.unnayan.org/reports/meu/sept_11/meu_Sept_2011.pdf [Accessed 13 October 2012].
Bangladesh Economic Update, April 2014 Page | 34
CPD 2013. Bangladesh Economy in FY2014 Three Months after the Budget, Three Months before the Elections, Dhaka: Centre for Policy Dialogue, viewed 18 March 2014 <http://cpd.org.bd/wp-content/uploads/2013/10/Bangladesh-Economy-in-FY2014.pdf>
New Age. 2013, Export earning hits record $3b in July, [online] 7 August 2013. Available at:
http://www.newagebd.com/detail.php?date=2013-08-07&nid=60264 [Accessed 2 March 2014]
New Age. 2013, Export Growth To Non-Traditional Markets Boost Rmg Makers, [online] 5
February 2013. Available at: http://news.org.bd/news/business/export-growth-to-non-traditional-markets-boost-rmg-makers/ [Accessed 2 March 2014]
The Daily Star. 2014, Stimulus drives RMG exports to new destinations, [online] 3 February
2014. Available at: http://www.newagebd.com/detail.php?date=2013-08-07&nid=60264 [Accessed 2 March 2014]
The Daily Star. 2013, EU warns of grave consequence if labour standards do not improve,
[online] 5 December 2013. Available at: http://archive.thedailystar.net/beta2/news/eu-warns-of-grave-consequence-if-labour-standards-do-not-improve/ [Accessed 16 March 2014]
The Financial Express. 2013, Country’s frozen white fish export drops by 40pc in Q1 this fiscal,
The Financial Express [online] 27 November. Available at: http://www.thefinancialexpress-bd.com/2013/11/27/6036 [Accessed 23 March 2014]
Chowdhury, J.A. 2014, “Thrust on manpower export brooks no delay”, The Financial Express, 7
January 2014. Viewed 20 March 2014, < http://www.thefinancialexpress-bd.com/2014/01/07/12523 >
Mansur, A.H. 2013, “Record Foreign exchange reserves: A boon or bane?, The Financial Express,
30 December 2013. Viewed 15 March 2013, < http://www.thefinancialexpress-bd.com/2013/12/30/11215/print>
Byron, R.k. 2014, “Surplus in current account soars despite a fall in remittances”, The daily Star,
25 March 2014. Viewed 25 March 2014, < http://www.thedailystar.net/business/surplus-in-current-account-soars-despite-a-fall-in-remittances-10486>
New Age. 2014, Export earning growth falls for third month in Feb, [online] 11 March 2014.
Available at: https://www.google.com/url?sa=t&rct=j&q=&esrc=s&source=web&cd=1&cad=rja&uact=8&ved=0CCcQFjAA&url=http%3A%2F%2Fnewagebd.com%2Fdetail.php%3Fdate%3D201
Bangladesh Economic Update, April 2014 Page | 35
4-03-11%26nid%3D86186&ei=ttMwU_XuB8aErAfgsID4Cg&usg=AFQjCNGbY0Mpm0LuDddR9V8u3LHGi1sF8A&sig2=Z9Uf18Xp-U6hd3CP7MzF4w&bvm=bv.63587204,d.bmk [Accessed 15 March 2014].
New Age. 2014, Export earning growth falls for third month in Feb, [online] 11 March 2014.
Available at: https://www.google.com/url?sa=t&rct=j&q=&esrc=s&source=web&cd=1&cad=rja&uact=8&ved=0CCcQFjAA&url=http%3A%2F%2Fnewagebd.com%2Fdetail.php%3Fdate%3D2014-03-11%26nid%3D86186&ei=ttMwU_XuB8aErAfgsID4Cg&usg=AFQjCNGbY0Mpm0LuDddR9V8u3LHGi1sF8A&sig2=Z9Uf18Xp-U6hd3CP7MzF4w&bvm=bv.63587204,d.bmk [Accessed 15 March 2014.
New Age. 2013, Cash incentive against frozen fish export withdrawn, shrimp reduced, [online]
8 July 2013. Available at: http://newagebd.com/detail.php?date=2013-07-08&nid=56107#.UzDVtKiSx78 [Accessed 14 March 2014].

Bangladesh Economic Update, April 2014 Page | 36
UNNAYAN ONNESHAN 16/2 Indira Road, Farmgate
Dhaka-1215, Bangladesh Tel.: +880 (2) 8158274, +880 (2) 9110636
Fax: +880 (2) 8159135 Email: [email protected] Web: www.unnayan.org