Embed Size (px)
Citation preview
2 $ NASA CR-188286
FINAL REPORT NAS9-17819
METAL HYDRIDE HEAT PUMP ENGINEERING DEMONSTRATION
& EVALUATION MODEL
I
OCTOBER, 1993
SUBMITTED TO txlniia
NATIONAL AERONAUTICS AND SPACE ADMINISTRATION g g , * LYNDON B. JOHNSON SPACE CENTER X F ~ [ J \ L I
UJ c HOUSTON, TEXAS *S a I&-
b - ( 3 ur UJZdc, S w w c
darn UJa4
hUdZ,-. 42 3 r n M . r p c n h i C 3 0 L : coab-4 o C B u J C - a 4 4 I Q 3 C
a f l E " d @ U Z , Q C n I a 3 0 cr c u l ml- v a a a ~ zudzx W X G W
PREPARED BY
HYDROGEN CONSULTANTS, INC. 12420 NORTH DUMONT WAY, LITTLETON, CO 801 25
(303) 79 1 -7972 FAX (303) 791 -7975
https://ntrs.nasa.gov/search.jsp?R=19940028351 2020-05-02T00:35:12+00:00Z
FINAL REPORT NAS9-17819
METAL HYDRIDE HEAT PUMP ENGINEERING DEMONSTRATION
& EVALUATION MODEL
OCTOBER, 1993
PREPARED BY
Tranklin E. M c h , president
HYDROGEN CONSULTANTS, INC. 12420 NORTH DUMONT WAY, LITTLETON, CO 801 25
(303) 791 -7972 FAX (303) 791 -7975
TABLE OF CONTENTS
SECTION SUBJECT PAGE
1 .O Introduction 1.1 Purpose 1.2 Non-Venting Thermal Control 1.3 System Schematic
2.0 Hydrides 2.1 Hydride Quantities and Containment
Thermal Analysis of the MHHP Rates of Heat Absorption and Rejection
Hydrogen Control Plumbing
Temperature Control of the MHHP
Automatic Coolant Temperature Control
Cooling Water Pump
Regeneration Equipment
Data Acquisition and Control System
Heat Load Simulator
Safety
Predelivery Tests at HCI
Post Delivery Atmospherics Tests Transportation Assembly, Installation & Checkout Post Delivery Adjustments
Review of Vacuum Chamber Test Data Successful Test Results Problems Encountered Shortfall in Cooling Capacity Instrumentation Noise Excessive Radiator Temperatures Recommendations for Future Testing
i
LIST OF FIGURES
FIGURE
1-1
1-2
2- 1
2-2
SUBJECT PAGE
1-3
1-5
2-2
2-3
Absorption and Desorption of Hydrogen Gas
Metal Hydride Heat Pump System Schematic
Van't Hoff Plot of MHHP's RechargeICooling Cycle
MHHP - Metal Hydride Subsystem
Radiator Panel Cross-section
Radiator Configuration
Heat Exchanger Sketch
Hydrogen Pressure versus Hydrogen Content for LaNi4.8Sno.22 at 25OC, 42°C and 93°C
Computed MHHP Performance in Hot Environment Effect of Hot Environments andlor High Metabolic Rates on Touch Temperature Limits
25°C Reactor Absorption Rate Test
42°C Reactor Absorption Rate Test Effect of Pressure Ratio on Heat Pumping Rate
Hydrogen Control Plumbing
Desorption Pressure versus Inverse Temperature for MMNi,,AI,., Hydride.
Section View of Back-Pressure Regulator Block Diagram of Water Control Components
Error MagnitudeISign Block of Coolant Temperature Control Circuit
Electronic Timer Schematic
TABLE
Frequency versus Control Voltage for the Voltage Controlled Oscillator
Vernitron Torque Motor
Torque Output versus Applied Voltage
Current versus Applied Voltage
Valve Assembly Housing Sketch
Flow Diversion Through the Coolant Temperature Control Valve
Pressure Changes Through the MHHP Coolant Loop
Pump Flow versus Differential Pressure
Effect of Capacitance on Motor Characteristics
Pump Flow versus AC Supply Voltage
Pump Jacket Pressure Differential
Diagram of the Recharge Process
Block Diagram of the Data Acquisition System
Heat Load Simulator
Pre-Delivery Test Set-Up
MHHP System Overcharge
Radiator Heater Failure Location
LIST OF TABLES
SUBJECT
Properties of Selected Phase Change Materials Radiator Heat Capacity and Masses Cooler Heat Capacity and Masses Hydrogen Plumbing Pressure Drop Calculations
iii
PAGE
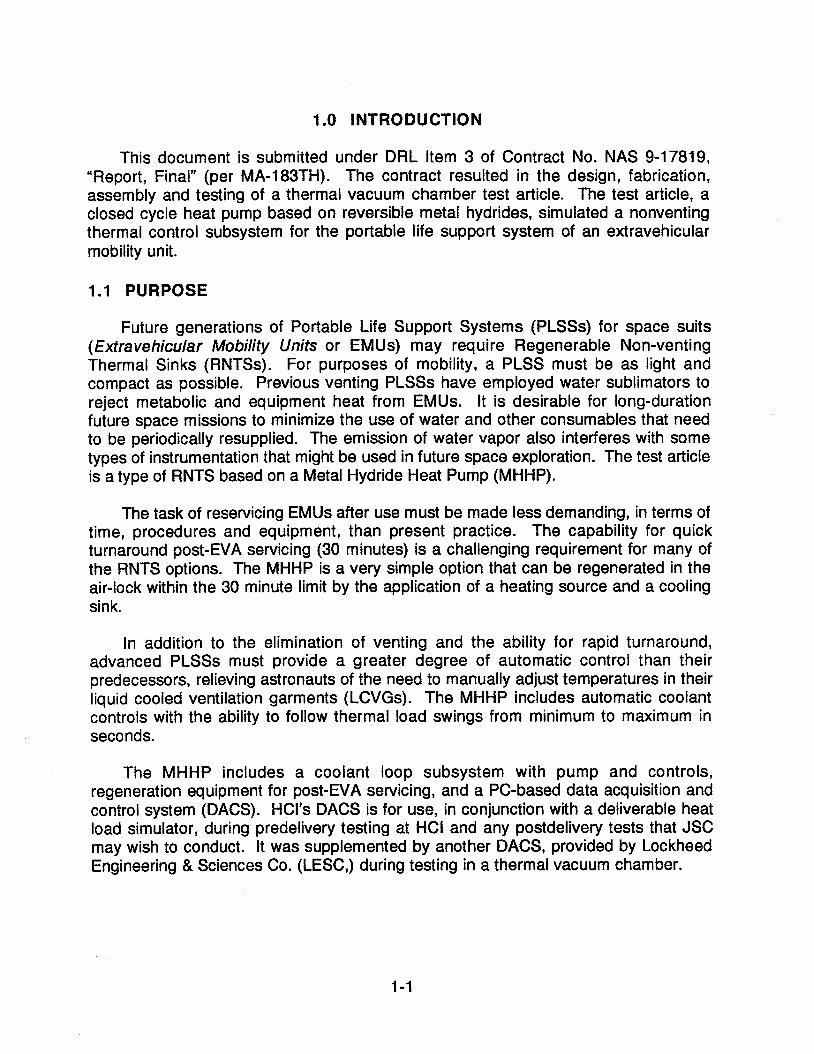
1.0 INTRODUCTION
This document is submitted under DRL Item 3 of Contract No. NAS 9-17819, "Report, Final" (per MA-183TH). The contract resulted in the design, fabrication, assembly and testing of a thermal vacuum chamber test article. The test article, a closed cycle heat pump based on reversible metal hydrides, simulated a nonventing thermal control subsystem for the portable life support system of an extravehicular mobility unit.
1.1 PURPOSE
Future generations of Portable Life Support Systems (PLSSs) for space suits (Extravehicular Mobility Units or EMUs) may require Regenerable Non-venting Thermal Sinks (RNTSs). For purposes of mobility, a PLSS must be as light and compact as possible. Previous venting PLSSs have employed water sublimators to reject metabolic and equipment heat from EMUs. It is desirable for long-duration future space missions to minimize the use of water and other consumables that need to be periodically resupplied. The emission of water vapor also interferes with some types of instrumentation that might be used in future space exploration. The test article is a type of RNTS based on a Metal Hydride Heat Pump (MHHP).
The task of reservicing EMUs after use must be made less demanding, in terms of time, procedures and equipment, than present practice. The capability for quick turnaround post-EVA servicing (30 minutes) is a challenging requirement for many of the RNTS options. The MHHP is a very simple option that can be regenerated in the air-lock within the 30 minute limit by the application of a heating source and a cooling sink.
In addition to the elimination of venting and the ability for rapid turnaround, advanced PLSSs must provide a greater degree of automatic control than their predecessors, relieving astronauts of the need to manually adjust temperatures in their liquid cooled ventilation garments (LCVGs). The MHHP includes automatic coolant controls with the ability to follow thermal load swings from minimum to maximum in seconds.
The MHHP includes a coolant loop subsystem with pump and controls, regeneration equipment for post-EVA servicing, and a PC-based data acquisition and control system (DACS). HCl's DACS is for use, in conjunction with a deliverable heat load simulator, during predelivery testing at HCI and any postdelivery tests that JSC may wish to conduct. It was supplemented by another DACS, provided by Lockheed Engineering & Sciences Co. (LESC,) during testing in a thermal vacuum chamber.
1.2 NON-VENTING THERMAL CONTROL
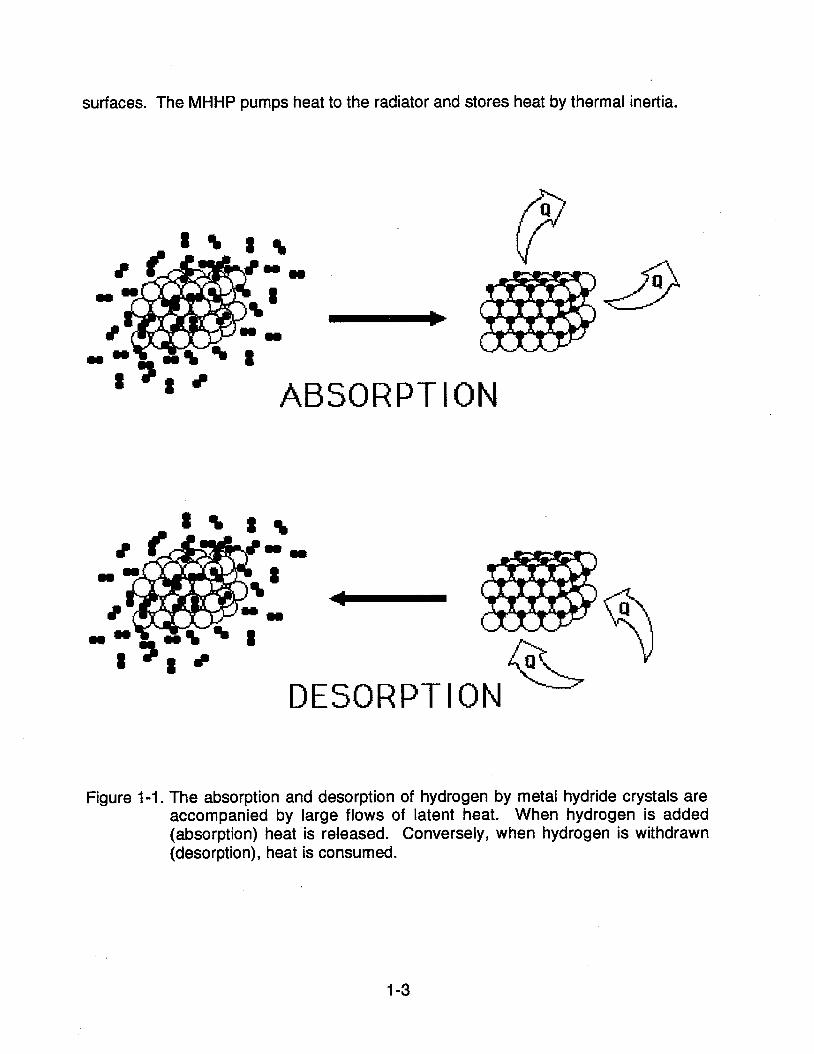
In lieu of venting vapors or gases, there are only two alternatives for managing EMU heat loads in space; heat storage andlor radiation to the environment. All competitive heat storage techniques involve materials that undergo phase changes, consuming latent heat in the process. Table I lists the properties of several phase change materials (PCMs) that are useful for heat storage. Latent heats of phase changes are proportional to the entropy differences between the initial and final phases. The largest entropy changes are observed when the final phase is gaseous. The sublimators on conventional EMUS take advantage of the large entropy change that accompanies the release of water vapor to space.
If venting were permissible, a single metal hydride container could release hydrogen directly to space (no wicks, etc. are necessary) and cool the EMU as effectively as a water sublimator. Table I indicates that for a given latent heat storage capacity, metal hydrides are nearly as compact as water sublimation. The mass of hydride for a sublimator would be several times the equivalent mass of water. However, over time, the mass of consumables is much less with hydrides because the metal is reused--only hydrogen is lost. On a consumable mass basis, the hydrides listed in Table I consume about 115 to 119 as much mass per recharge. Moreover, the hydrogen may be available as a waste product from cryogenic propellant boil-off or gained by electrolysis of water, netting oxygen for breathing.
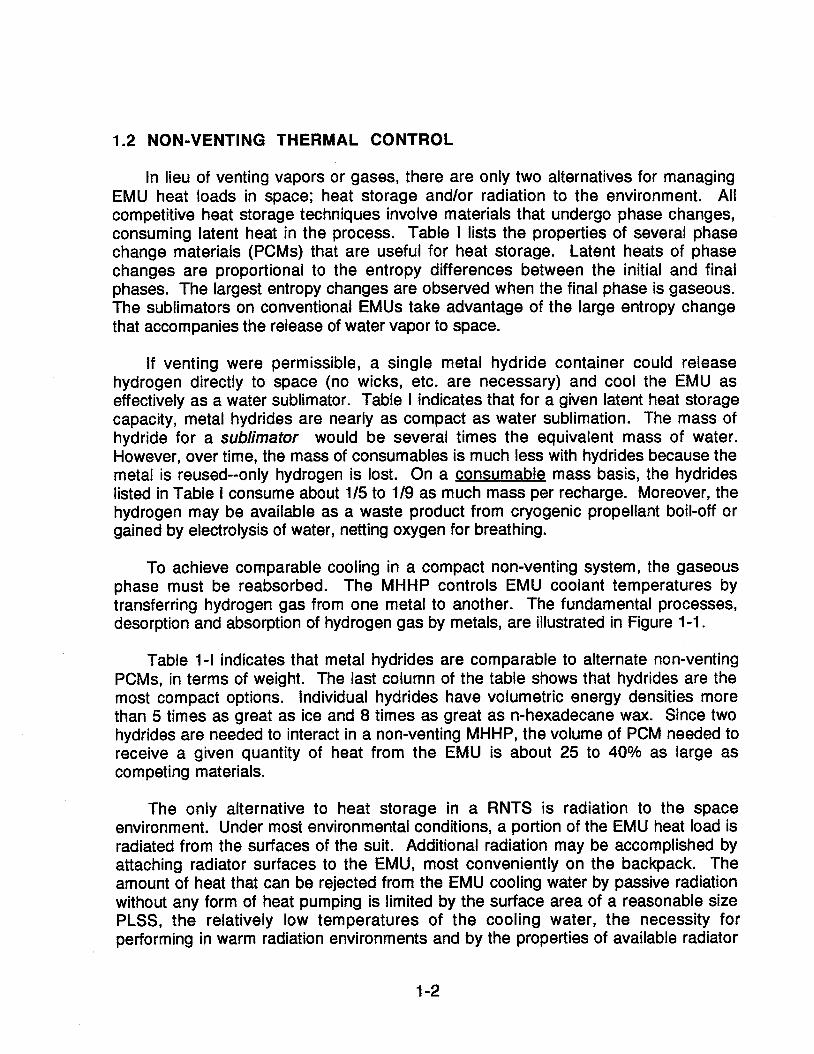
To achieve comparable cooling in a compact non-venting system, the gaseous phase must be reabsorbed. The MHHP controls EMU coolant temperatures by transferring hydrogen gas from one metal to another. The fundamental processes, desorption and absorption of hydrogen gas by metals, are illustrated in Figure 1-1.
Table 1-1 indicates that metal hydrides are comparable to alternate non-venting PCMs, in terms of weight. The last column of the table shows that hydrides are the most compact options. Individual hydrides have volumetric energy densities more than 5 times as great as ice and 8 times as great as n-hexadecane wax. Since two hydrides are needed to interact in a non-venting MHHP, the volume of PCM needed to receive a given quantity of heat from the EMU is about 25 to 40% as large as competing materials.
The only alternative to heat storage in a RNTS is radiation to the space environment. Under most environmental conditions, a portion of the EMU heat load is radiated from the surfaces of the suit. Additional radiation may be accomplished by attaching radiator surfaces to the EMU, most conveniently on the backpack. The amount of heat that can be rejected from the EMU cooling water by passive radiation without any form of heat pumping is limited by the surface area of a reasonable size PLSS, the relatively low temperatures of the cooling water, the necessity for performing in warm radiation environments and by the properties of available radiator
surfaces. The MHHP pumps heat to the radiator and stores heat by thermal inertia.
% -+I
u t - 3 ABSORPTION
SORPTI
Figure 1-1. The absorption and desorption of hydrogen by metal hydride crystals are accompanied by large flows of latent heat. When hydrogen is added (absorption) heat is released. Conversely, when hydrogen is withdrawn (desorption), heat is consumed.
Tablel-l Properties of selected phase change materials for thermal control. The phase changes are indicated by arrows (+) between the initial and final phases; G = gas, L= liquid, S = solid and S* indicates a new solid phase. Note: the MHHP requires hydrides.
Substance Phase Change Temp K kglM3 x MJlkg = GJIM~ (OF) (lb,lftl) (Btullb,) (kstulft3)
Water (sublimator) L + S + G 273 1000 2.259 2.259 (32) (62.4) (972) (60.7)
Ice
Hydrated Eutectic Salt S + L 280 1500 0.126 0.189 (45) (93.6) (54.2) (5.07)
n- Hexadecane S + L 290 770 0.238 0.184 (63) (48.1) (1 02) (4.91)
Glauber's Salt S + L 305 1460 0.251 0.366 (90) (91.1) (1 08) (9.84)
Neopentyl Glycol S +S 31 5 1060 0.131 0.139 (1 08) (66.2) (56.4) (3.73)
Vanadium Dihydride S + S*+G 298 451 7 0.396 1.789 (77) (282) (1 70) (47.9)
1.3 SYSTEM SCHEMATIC
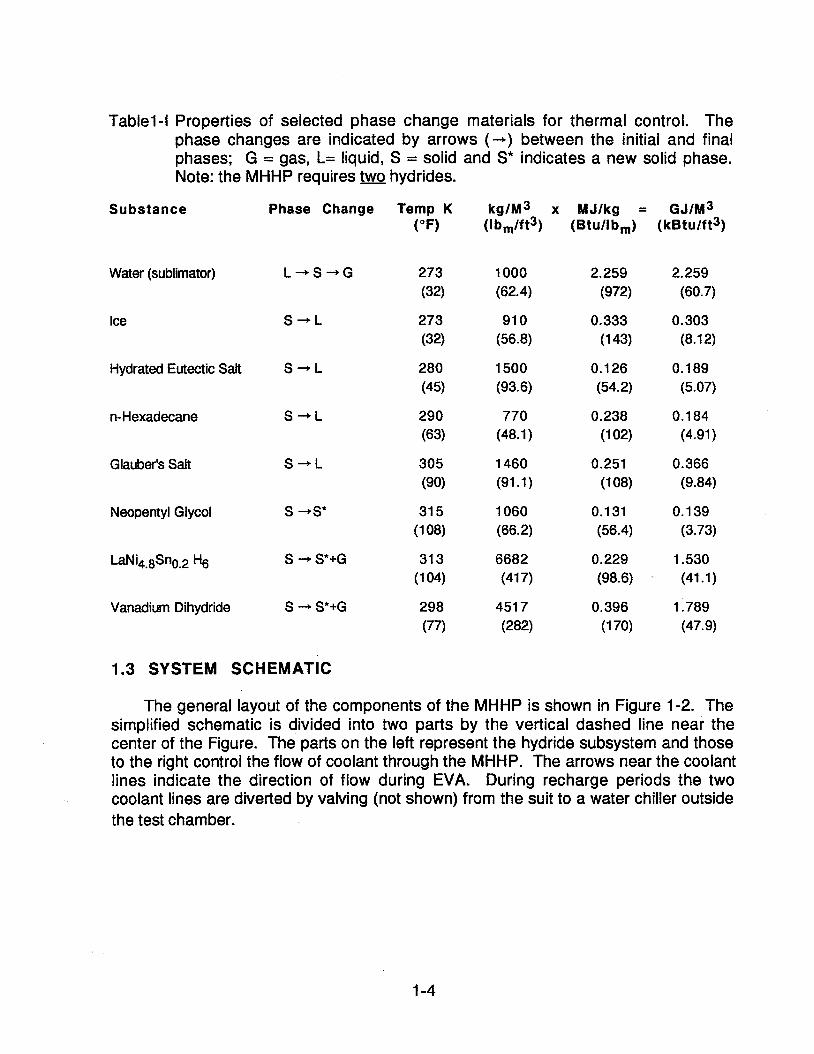
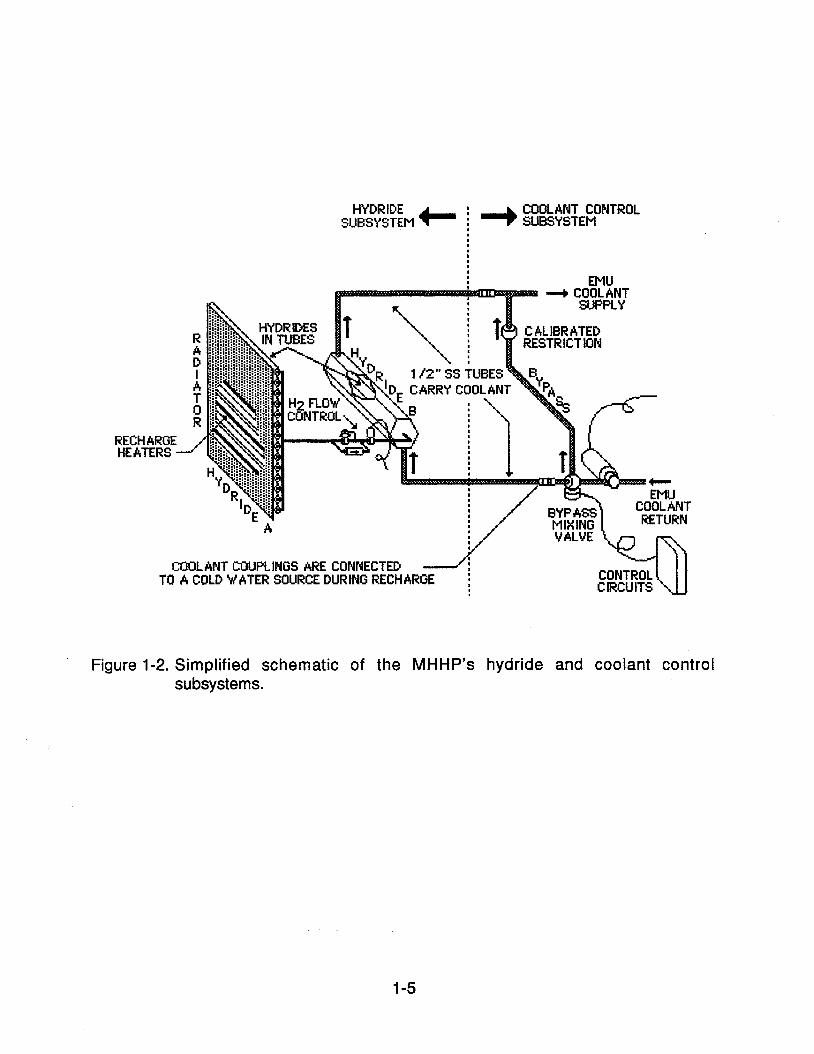
The general layout of the components of the MHHP is shown in Figure 1-2. The simplified schematic is divided into two parts by the vertical dashed line near the center of the Figure. The parts on the left represent the hydride subsystem and those to the right control the flow of coolant through the MHHP. The arrows near the coolant lines indicate the direction of flow during EVA. During recharge periods the two coolant lines are diverted by valving (not shown) from the suit to a water chiller outside the test chamber.
HYDRIDE + I + COOLANT CONTROL SUBSYSTEM SUBSYSTEM
I
EMU
Figure 1-2. Simplified schematic of the MHHP's hydride and coolant control subsystems.
The hydride properties sought for a high performance MHHP are large latent heats of reaction, large hydrogen capacities, composition-independent hydrogen pressure at any given temperature (i.e., flat isotherms), small absorption/desorption hysteresis and high density.
Early in the MHHP development work, the most attractive choice for hydride B (the cooler) seemed to be vanadium dihydride VH,. Its latent heat of reaction and its hydrogen density by weight and volume are larger than competing materials. However, containment problems were discovered that precluded its use in the test article. Various vanadium alloy hydrides, over the course of a few hundred to a few thousand cycles have transformed from typical powdered materials to sponge-like solid masses whose specific volumes are larger than the powdered phase. Ample volume was provided in these tests for the powdered phase (40% void space) and allowance was made for the expanded hydride phase. Early tests behave normally, absorbing and desorbing the full hydrogen capacity of the hydride without damage to the container. Later the containers, be they sturdy Sieverts test reactors or thin-walled MHHP heat exchanger models, begin to swell and eventually crack as the sponge develops inside them. Post mortem inspections find a shiny solid object with considerable mechanical integrity--not just a compacted powder. The solid may be fractured by a mortar and pestle and subsequently ground to a fine powder but the compressive strength is apparently high enough to cause container strain. Electron microscopy, carried out in a separate study (NAS9-18175) at the University of Nevada, Reno, showed that holes are accumulating within the structure of individual particles. Further study showed that if the hydride were cycled in an open top container that did not constrain the growth, a fluffy material developed that was dubbed 'dust bunnies" by HCI test personnel.
Progress has been made in extending the number of cycles before measurable container strain and very sturdy containers with proprietary additives have remained undamaged for a few thousand cycles. However, the use of vanadium dihydride in the thin walled pressure vessels of the MHHP is not acceptable.
The pair of metal hydride alloys used in the MHHP are both derived from lanthanum pentanickel, LaNiS. Tin is substituted for a portion of the nickel in alloy A. Alloy A was made to HCI specifications by Union Molycorp, Washington, PA. Alloy B is composed of mischmetal (a naturally occuring group of rare earth elements including lanthanum), nickel and aluminum. Alloy B was made by Ergenics, Inc., Ringwood, NJ. Similar alloys were investigated during earlier work for JSC (NAS 9-17549) and subsequent experience with them has proven good manufacturing control of engineering properties and long term stability (NAS 10-1 1401, NAS 8-37262). The alloys are annealed to dissolve tin and aluminum gradients prior to hydriding.
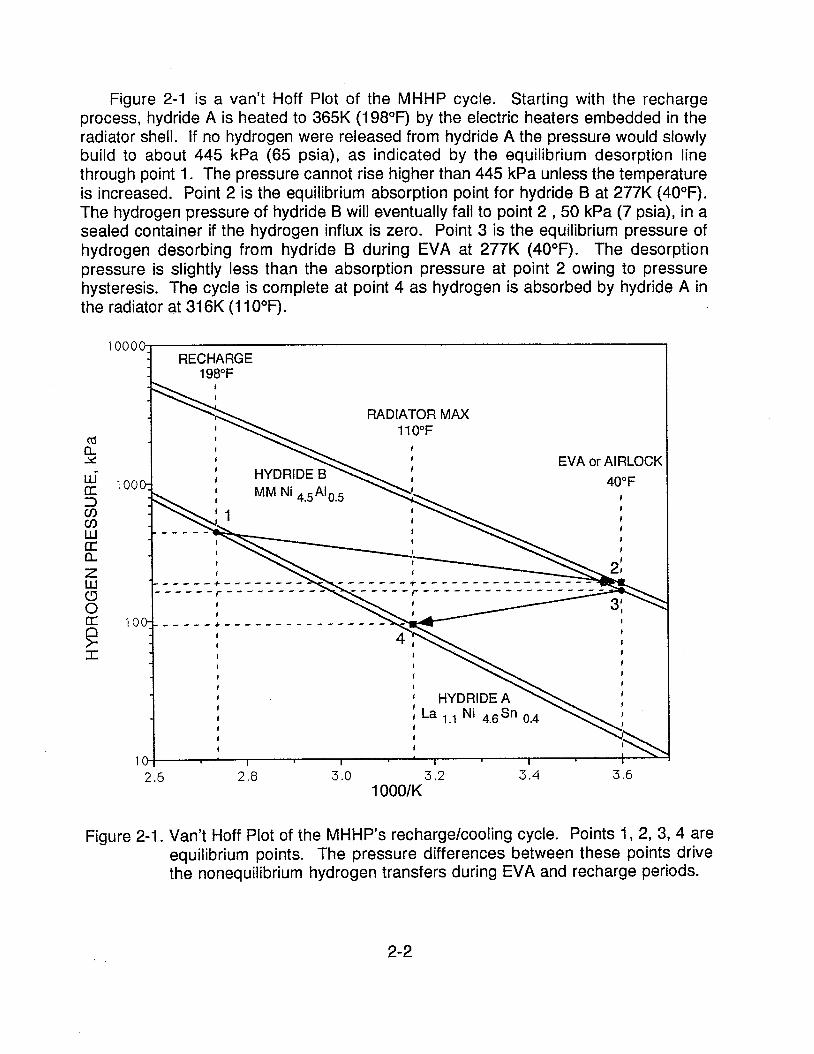
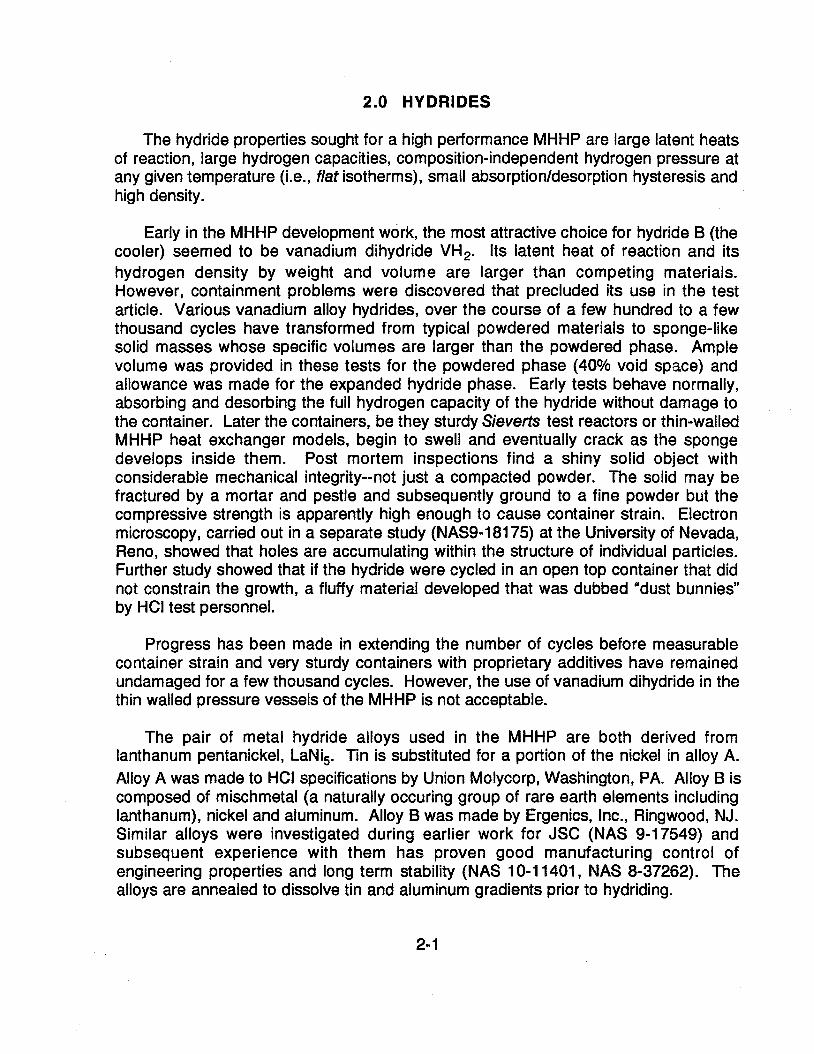
Figure 2-1 is a van't Hoff Plot of the MHHP cycle. Starting with the recharge process, hydride A is heated to 365K (198°F) by the electric heaters embedded in the radiator shell. If no hydrogen were released from hydride A the pressure would slowly build to about 445 kPa (65 psia), as indicated by the equilibrium desorption line through point 1. The pressure cannot rise higher than 445 kPa unless the temperature is increased. Point 2 is the equilibrium absorption point for hydride B at 277K (40°F). The hydrogen pressure of hydride B will eventually fall to point 2 , 50 kPa (7 psia), in a sealed container if the hydrogen influx is zero. Point 3 is the equilibrium pressure of hydrogen desorbing from hydride B during EVA at 277K (40°F). The desorption pressure is slightly less than the absorption pressure at point 2 owing to pressure hysteresis. The cycle is complete at point 4 as hydrogen is absorbed by hydride A in the radiator at 31 6K (1 10°F).
10000~ RECHARGE
198°F
Figure 2-1. Van't Hoff Plot of the MHHP's rechargelcooling cycle. Points 1, 2, 3, 4 are equilibrium points. The pressure differences between these points drive the nonequilibrium hydrogen transfers during EVA and recharge periods.
The actual dynamic hydrogen pressures during recharge (1,2) and EVA (3,4) periods are intermediate between the equilibrium pressures. Pressure ratios shown in Figure 2-1 are 2.3 during EVA and 1.8 on recharge.
For safety reasons and because lower pressure metal hydrides have larger latent heats, the operating pressure range is held as low as feasible. The constraint on how low pressure can be made is not a metallurgical limitation but a practical one based on reasonable tube diameters and flow coefficients of reasonably small regulators, etc.
2.1 HYDRIDE QUANTITIES AND CONTAINMENT
A sketch of the hydride subsystem of the MHHP is shown in Figure 2-2. It is comprised of a radiator containing hydride A, a tube and shell type heat exchanger containing hydride B, and hydrogen plumbing components that control the flow of hydrogen between the two hydrides.
ALUMINUM R AD 1 ATQR ELECTR IC CONTAINING HYDRIDE A HEATERS FOR
DIELECTRIC UNION \ RECHARGE
Figure 2-2. Metal hydride subsystem of the MHHP, comprised of an aluminum radiator containing hydride A, a group of stainless steel heat exchangers containing hydride B, and hydrogen plumbing components.
The extruded aluminum components that form the radiator panels and tubes for hydride A were long lead time items that required extensive finish machine work and assembly process development that could not await final definition of EMU heat loads, suit heat leaks and thermal environments. The radiator dimensions were set at I f t x 2 ft x 3 ft for a total surface area of 16 ft*. The tube spacing in the extrusions was set to contain enough hydride for a 4-hour, 1200 Btulhour EVA (4800 Btu total).
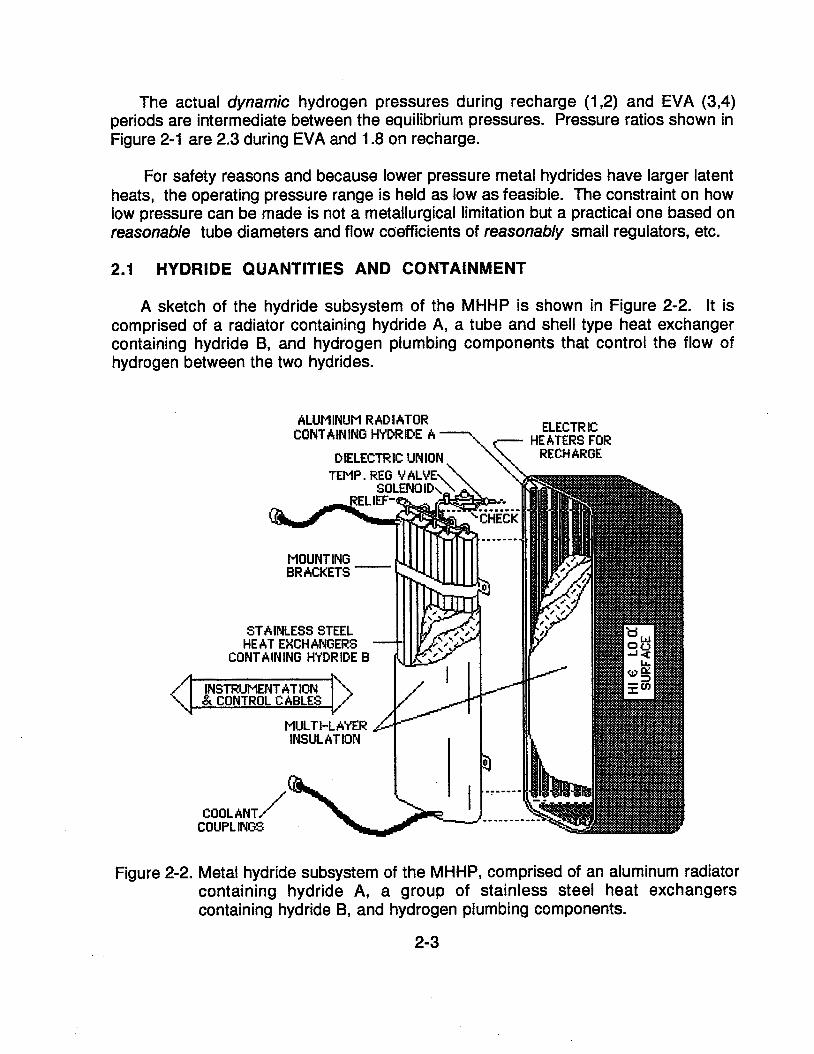
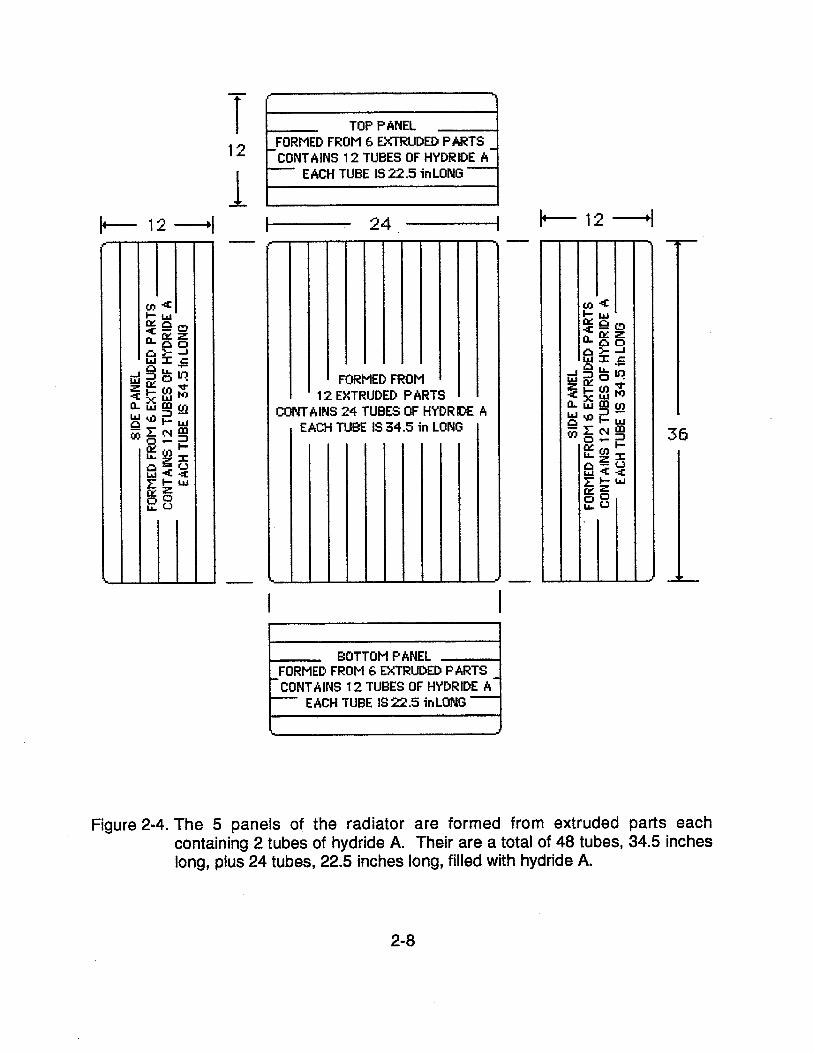
Figure 2-3 is a cross-section of the aluminum extrusion and Figure 2-4 shows how the extruded parts are linked together to form the five radiator panels of the MHHP backpack. As shown in Figure 2-2, the inside of the panels is covered by 3 layers of multi-layer insulation. The internal volume of the tubes in the radiator, minus the space occupied by the filter and filter support "spiders" is 8.125 liters (0.287 ft3) and, at a permissible packing density of 3.5 glcc, the radiator holds 28.4 kg (62.6 Ib) of hydride alloy A, La, ., Ni4.6Sn0.4.
Hydride B is contained in 11 stainless steel heat exchangers connected in series. A sketch of a heat exchanger is shown in Figure 2-6. Each heat exchanger is a hexagonal bundle of 7 tubes containing hydride, surrounded by an outer shell that carries EMU cooling water. The containers are 2 9 long and are mounted in a single row across the inside of the back panel of the radiator. Three layers of multi-layer insulation are wrapped around the group of heat exchangers.
The tubes also contain filters to keep the powdered hydride from migrating out of the container in the hydrogen flow. Aluminum spiders support the filters. The insides of the tubes in the radiator containing hydride A are assembled in the same way.
HVDR I DE,
BORED, 0.593 I.D.
SCALE: 2: 1 DIMENSIONS: l NCHES
Figure 2-3. Cross-section of extruded parts that link together to form the radiator panels.
The weights of the MHHP components are summarized, along with the associated heat capacities in Tables 2-IA and 2-18. The numbers are much larger than they would be if vanadium hydride could be used (see comparison of VH2 with LaNi, in IDR Data Package). Moreover, the effect of changing from vanadium to LaNi,-type hydride in the cooler echos through the whole design, viz.;
less latent heat per Ib of hydride B -+ more hydride weight
less latent heat per Ib of hydrogen -. more hydrogen
more hydrogen -. more hydride A
more hydride A -. larger radiator
AH$AHA < 1 -. larger radiator
Solving the VH2 problem should be a high priority development objective for future use of hydrides in EVA systems.
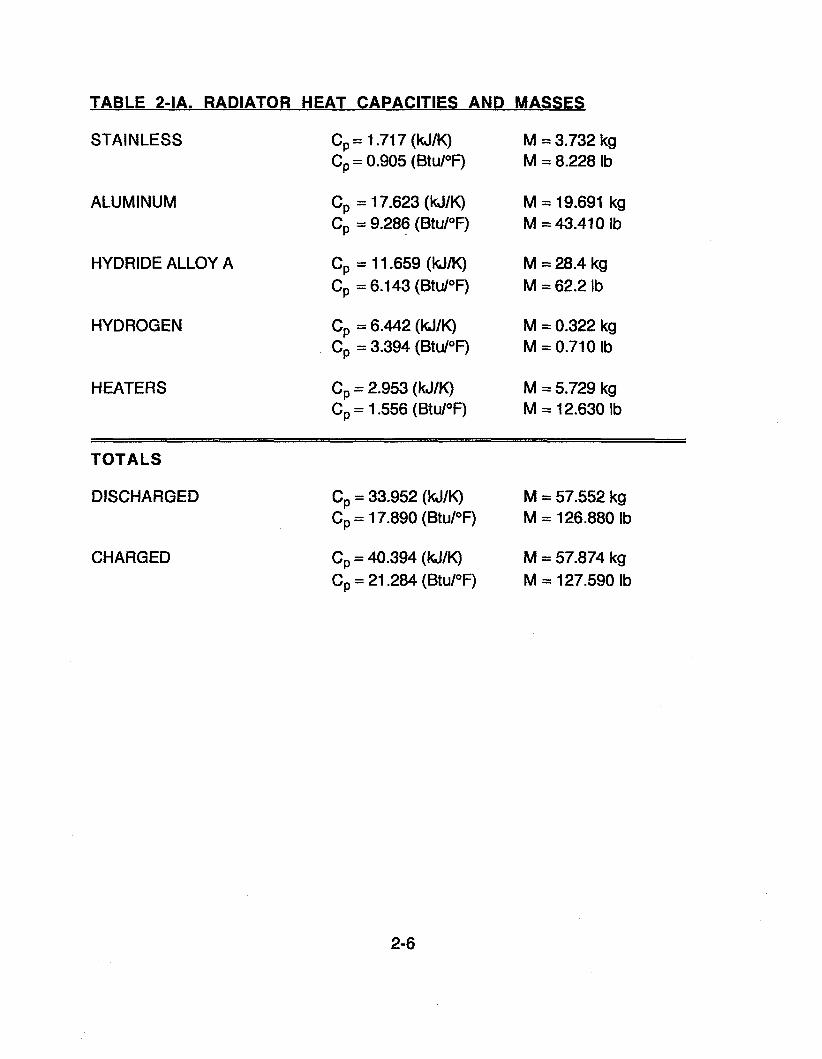
TABLE 2-IA. RADIATOR HEAT CAPACITIES AND MASSES
STAINLESS
ALUMINUM
HYDRIDE ALLOY A C, = 11.659 (MIK) C, = 6.143 (Btu/OF)
HYDROGEN
HEATERS
TOTALS
DISCHARGED
CHARGED
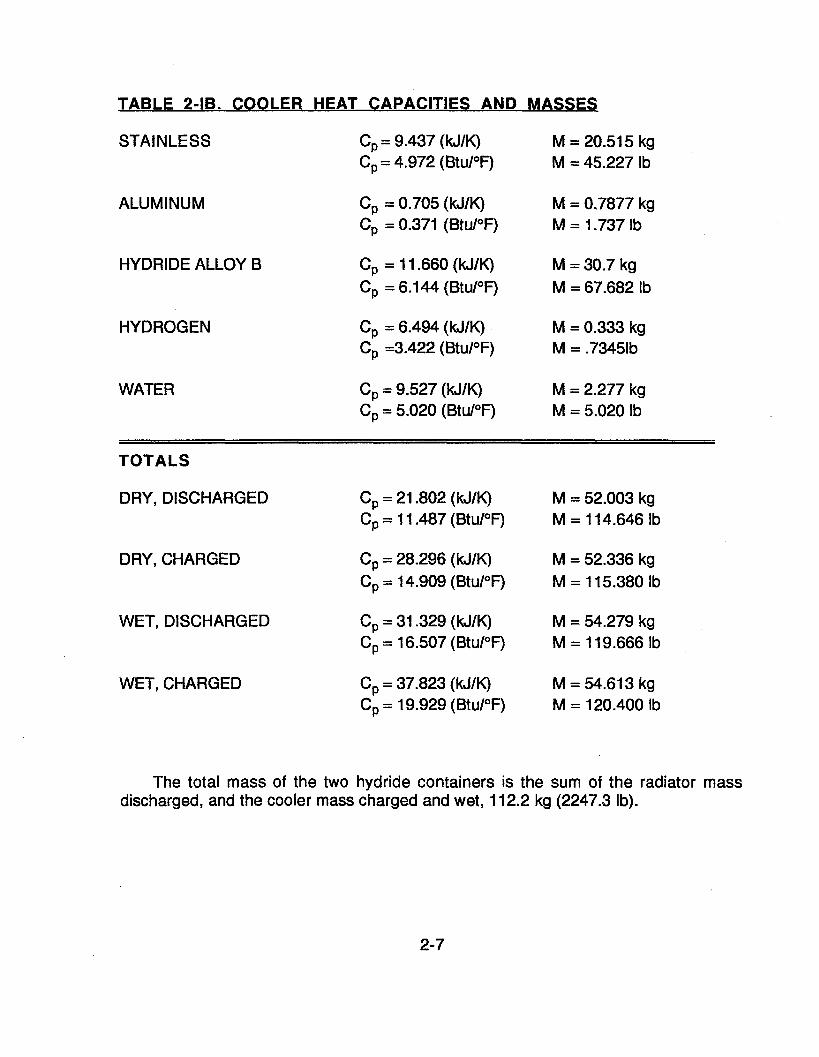
TABLE 2-18. COOLER HEAT CAPACITIES AND MASSES
STAINLESS
ALUMINUM
HYDRIDE ALLOY B C, = 11.660 (WIK) C, = 6.1 44 (Btd°F)
HYDROGEN
WATER
- .
TOTALS
DRY, DISCHARGED C, = 21.802 (kJIK) Cp = 11.487 (BtuPF)
DRY, CHARGED C, = 28.296 (WIK) Cp = 14.909 (BtuI0F)
WET, DISCHARGED C, = 31.329 (WIK) C, = 1 6.507 (BtuI0F)
WET, CHARGED C, = 37.823 (kJlK) C, = 1 9.929 (BtuI0F)
The total mass of the two hydride containers is the sum of the radiator mass discharged, and the cooler mass charged and wet, 112.2 kg (2247.3 Ib).
r Z
TOP PANEL FORMED FROM 6 EXTRUDED PARTS CONT AlNS 1 2 TUBES OF HYDRIDE A - E ACH TUBE IS 22.5 in LONG -
FORMED FROM 1 2 EXTRUDED PARTS
EACH TUBE IS 34.5 in LONG
BOTTOM PANEL FORMED FROM 6 EXTRUDED PARTS - - CONT AlNS 1 2 TUBES OF HYDRIDE A - EACH TUBE IS 22.5 inLONG - I
Figure 2-4. The 5 panels of the radiator are formed from extruded parts each containing 2 tubes of hydride A. Their are a total of 48 tubes, 34.5 inches long, plus 24 tubes, 22.5 inches long, filled with hydride A.
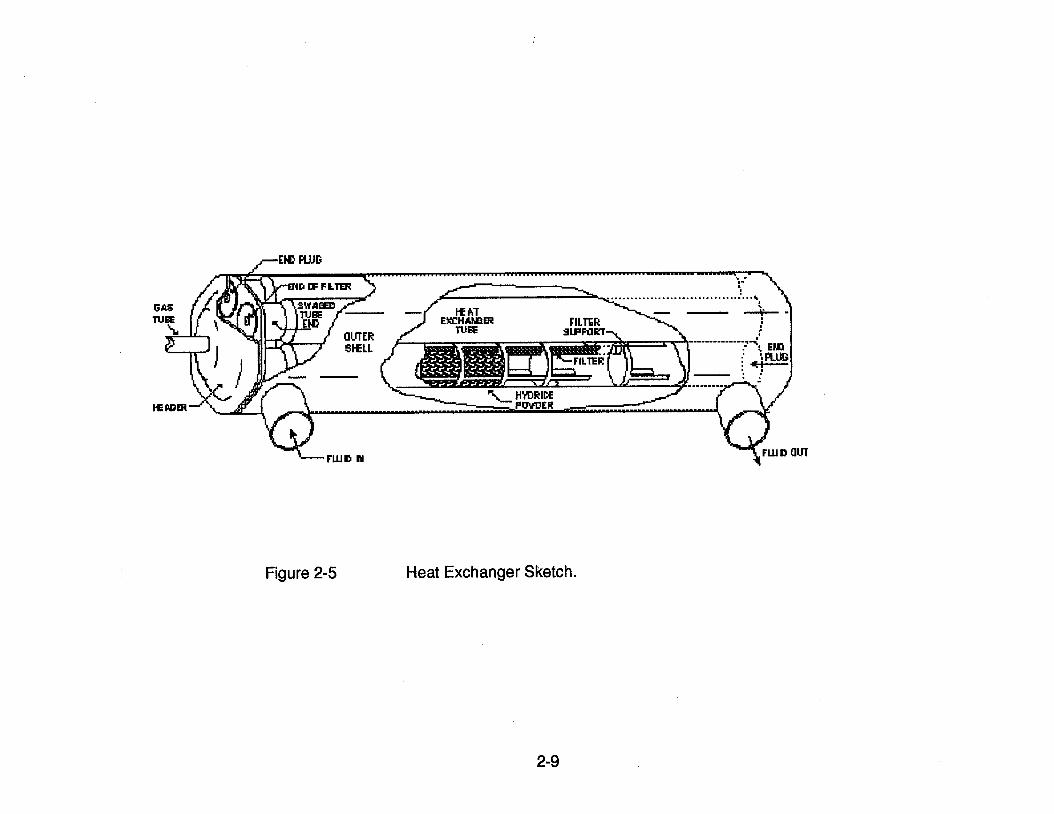
Figure 2-5 Heat Exchanger Sketch.
3.0 THERMAL ANALYSIS OF THE MHHP
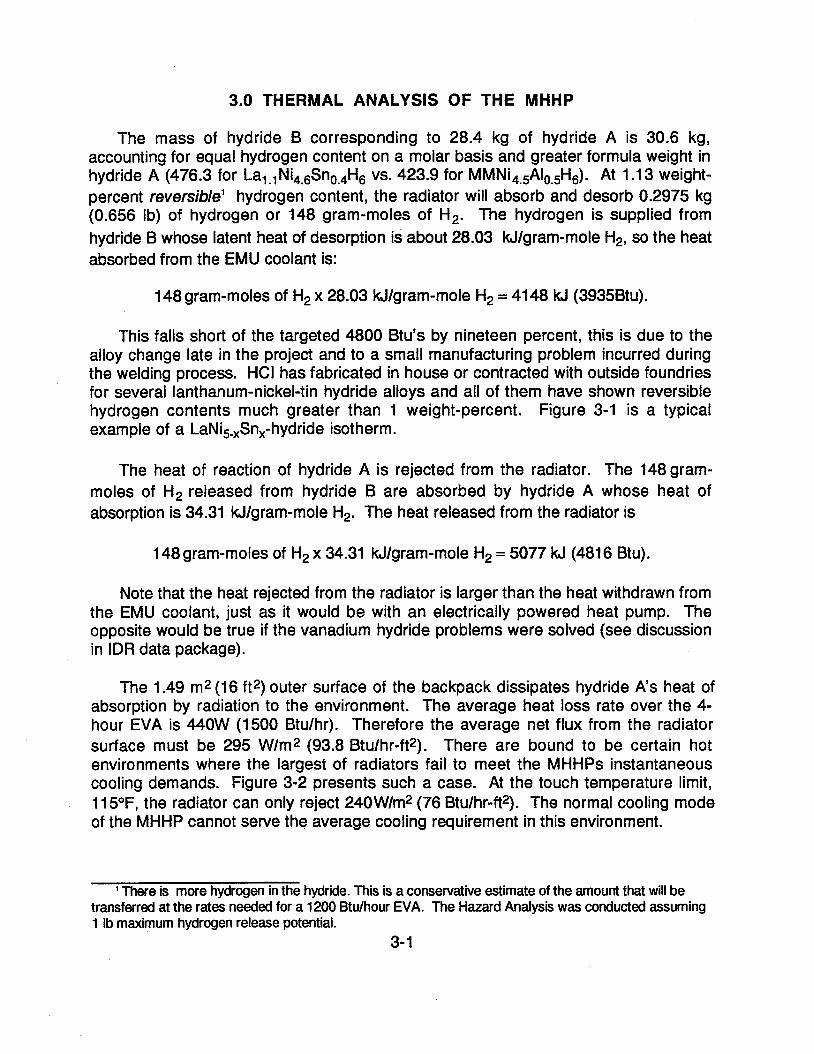
The mass of hydride B corresponding to 28.4 kg of hydride A is 30.6 kg, accounting for equal hydrogen content on a molar basis and greater formula weight in hydride A (476.3 for Lal.1Ni4.6Sno.4H6 VS. 423.9 for MMNi4.,Alo.,H6). At 1.13 weight- percent reversible' hydrogen content, the radiator will absorb and desorb 0.2975 kg (0.656 Ib) of hydrogen or 148 gram-moles of H2. The hydrogen is supplied from hydride B whose latent heat of desorption is about 28.03 Wlgram-mole He, so the heat absorbed from the EMU coolant is:
148 gram-moles of H2 x 28.03 kJlgram-mole H2 = 41 48 kJ (3935Btu).
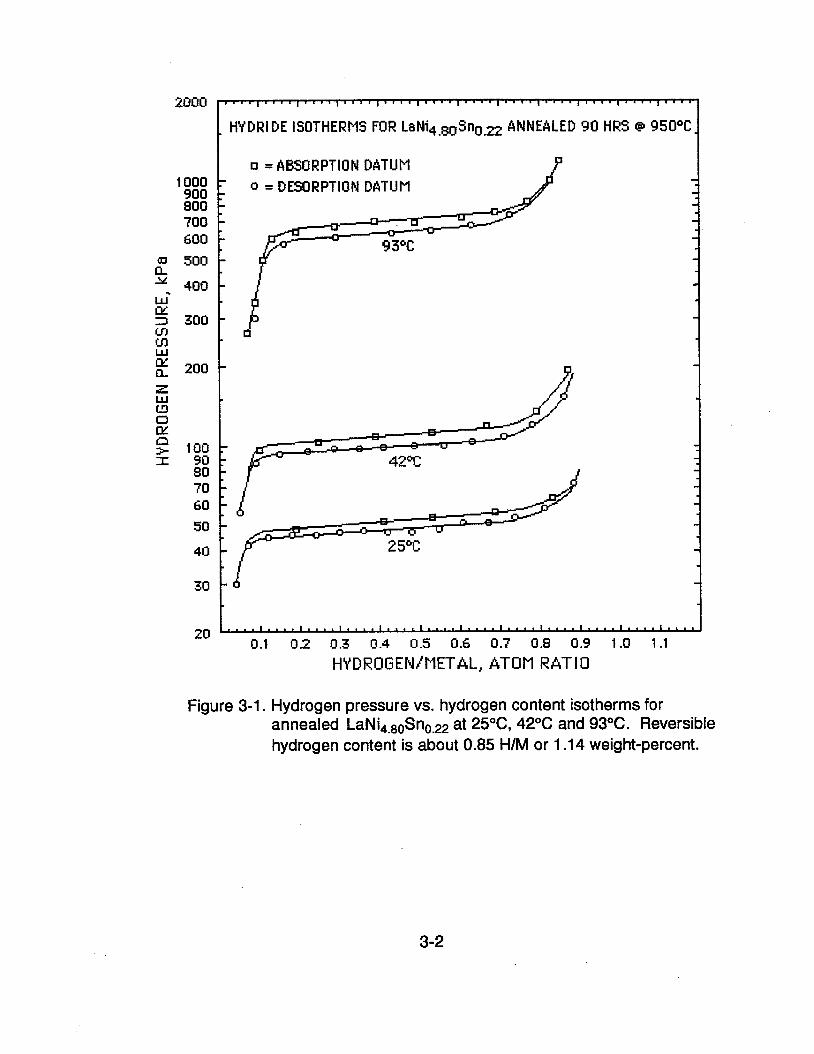
This falls short of the targeted 4800 Btu's by nineteen percent, this is due to the alloy change late in the project and to a small manufacturing problem incurred during the welding process. HCI has fabricated in house or contracted with outside foundries for several lanthanum-nickel-tin hydride alloys and all of them have shown reversible hydrogen contents much greater than 1 weight-percent. Figure 3-1 is a typical example of a LaNi5,Snx-hydride isotherm.
The heat of reaction of hydride A is rejected from the radiator. The 148 gram- moles of H2 released from hydride B are absorbed by hydride A whose heat of absorption is 34.31 kJlgram-mole Ha. The heat released from the radiator is
148 gram-moles of H2 x 34.31 kJ1gram-mole H2 = 5077 kJ (481 6 Btu).
Note that the heat rejected from the radiator is larger than the heat withdrawn from the EMU coolant, just as it would be with an electrically powered heat pump. The opposite would be true if the vanadium hydride problems were solved (see discussion in IDR data package).
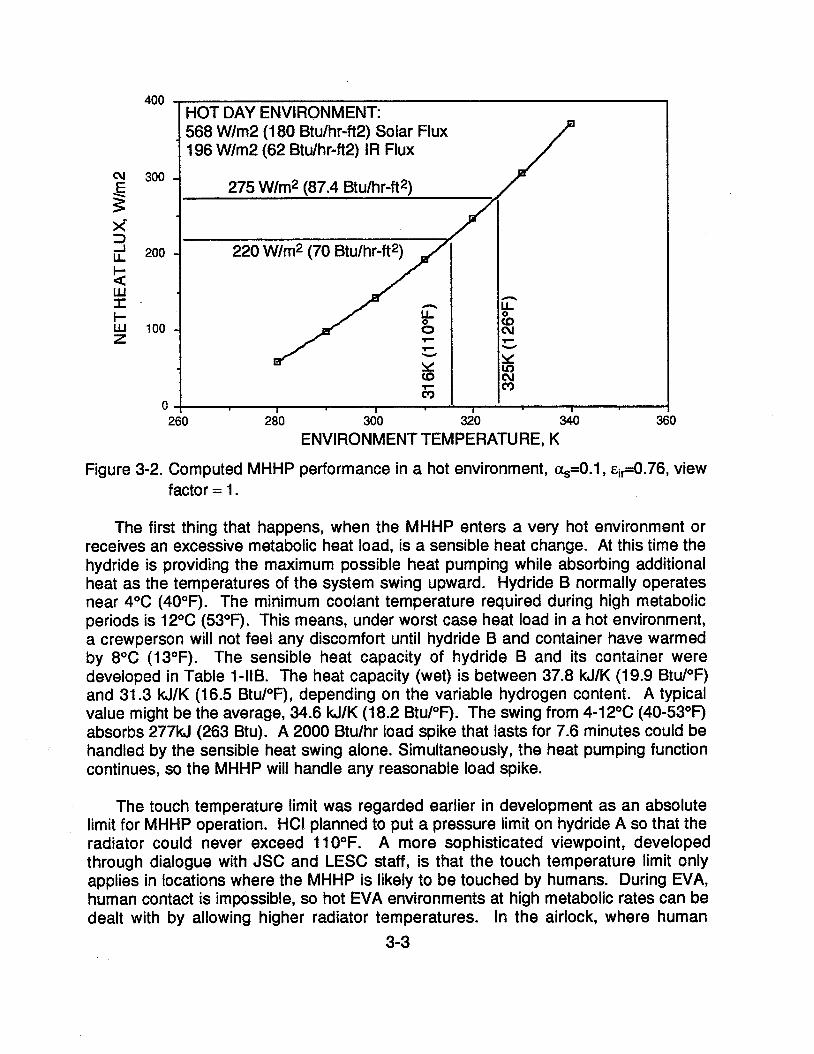
The 1.49 m2 (16 ft2) outer surface of the backpack dissipates hydride A's heat of absorption by radiation to the environment. The average heat loss rate over the 4- hour EVA is 440W (1500 Btulhr). Therefore the average net flux from the radiator surface must be 295 Wlm2 (93.8 Btulhr-ft2). There are bound to be certain hot environments where the largest of radiators fail to meet the MHHPs instantaneous cooling demands. Figure 3-2 presents such a case. At the touch temperature limit, 11 5OF, the radiator can only reject 240W/m2 (76 Btulhr-ft2). The normal cooling mode of the MHHP cannot serve the average cooling requirement in this environment.
' There is more hydrogen in the hydride. This is a conservative estimate of the amount that will be transferred at the rates needed for a 1200 Btdhour EVA. The Hazard Analysis was conducted assuming 1 Ib maximum hydrogen release potential.
3- 1
2000
HYDRIDE ISOTHERMS FOR LaNi4.80Sn~0.22 ANNEALED 90 HRS 49 950°C
= ABSORPTION DATUM 1000 900 Q = DESQRPTION DATUM 800 700 600
500 a 400
w' nL 3 300 # # W
g 200 Z W U 0 nL e 100 I 90
80 70 60
50
40
30
20 0.1 0.2 0.3 0.4 0.5 0.6 0.7 0.8 0.9 1.0 1.1
HVDROGENiMETAL, ATOM RATIO
Figure 3-1. Hydrogen pressure vs. hydrogen content isotherms for annealed LaNi4.80Sno.22 at 25OC, 42OC and 93°C. Reversible hydrogen content is about 0.85 HIM or 1 . I4 weight-percent.
260 280 300 320 340 360
ENVIRONMENT TEMPERATURE, K
Figure 3-2. Computed MHHP performance in a hot environment, as=O.l, ~ i ~ 0 . 7 6 , view factor = I.
The first thing that happens, when the MHHP enters a very hot environment or receives an excessive metabolic heat load, is a sensible heat change. At this time the hydride is providing the maximum possible heat pumping while absorbing additional heat as the temperatures of the system swing upward. Hydride B normally operates near 4°C (40°F). The minimum coolant temperature required during high metabolic periods is 12°C (53°F). This means, under worst case heat load in a hot environment, a crewperson will not feel any discomfort until hydride B and container have warmed by 8OC (13°F). The sensible heat capacity of hydride B and its container were developed in Table 1-118. The heat capacity (wet) is between 37.8 kJ/K (19.9 BtuPF) and 31.3 kJ/K (16.5 BtuI0F), depending on the variable hydrogen content. A typical value might be the average, 34.6 kJ/K (18.2 BtuPF). The swing from 442°C (40-53°F) absorbs 277kJ (263 Btu). A 2000 Btulhr load spike that lasts for 7.6 minutes could be handled by the sensible heat swing alone. Simultaneously, the heat pumping function continues, so the MHHP will handle any reasonable load spike.
The touch temperature limit was regarded earlier in development as an absolute limit for MHHP operation. HCI. planned to put a pressure limit on hydride A so that the radiator could never exceed 110°F. A more sophisticated viewpoint, developed through dialogue with JSC and LESC staff, is that the touch temperature limit only applies in locations where the MHHP is likely to be touched by humans. During EVA, human contact is impossible, so hot EVA environments at high metabolic rates can be dealt with by allowing higher radiator temperatures. In the airlock, where human
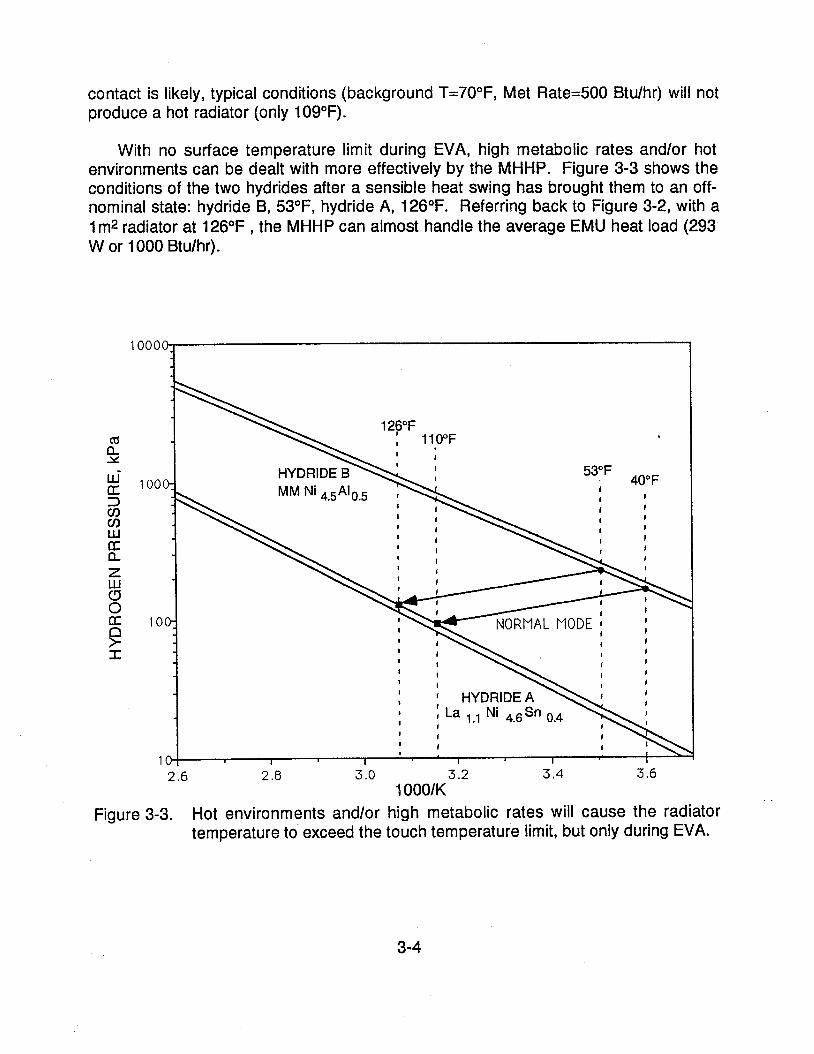
contact is likely, typical conditions (background T=70°F, Met Rate=500 Btulhr) will not produce a hot radiator (only 109°F).
With no surface temperature limit during EVA, high metabolic rates and/or hot environments can be dealt with more effectively by the MHHP. Figure 3-3 shows the conditions of the two hydrides after a sensible heat swing has brought them to an off- nominal state: hydride B, 53"F, hydride A, 126°F. Referring back to Figure 3-2, with a I m2 radiator at 126°F , the MHHP can almost handle the average EMU heat load (293 W or 1000 Btulhr).
Figure 3-3. Hot environments and/or high metabolic rates will cause the radiator temperature to exceed the touch temperature limit, but only during EVA.
3.1 RATES OF HEAT ABSORPTlON AND REJECTION
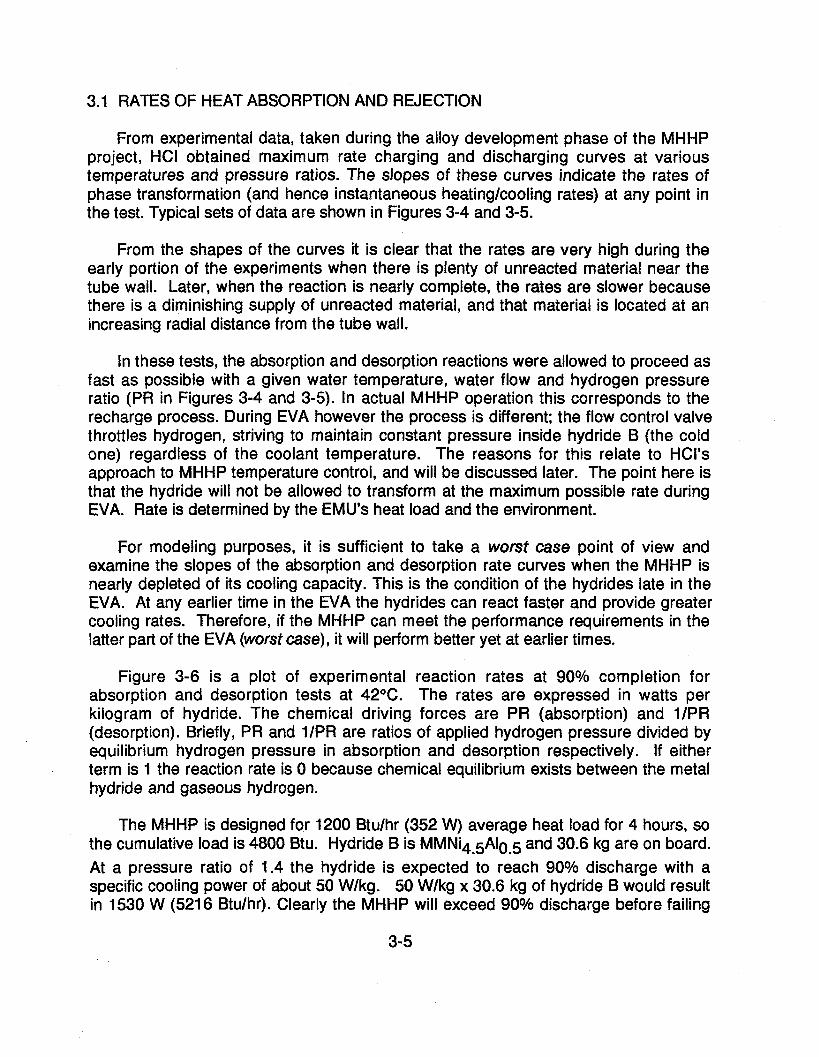
From experimental data, taken during the alloy development phase of the MHHP project, HCI obtained maximum rate charging and discharging curves at various temperatures and pressure ratios. The slopes of these curves indicate the rates of phase transformation (and hence instantaneous heatinglcooling rates) at any point in the test. Typical sets of data are shown in Figures 3-4 and 3-5.
From the shapes of the curves it is clear that the rates are very high during the early portion of the experiments when there is plenty of unreacted material near the tube wall. Later, when the reaction is nearly complete, the rates are slower because there is a diminishing supply of unreacted material, and that material is located at an increasing radial distance from the tube wall.
In these tests, the absorption and desorption reactions were allowed to proceed as fast as possible with a given water temperature, water flow and hydrogen pressure ratio (PR in Figures 3-4 and 3-5). In actual MHHP operation this corresponds to the recharge process. During EVA however the process is different; the flow control valve throttles hydrogen, striving to maintain constant pressure inside hydride B (the cold one) regardless of the coolant temperature. The reasons for this relate to HCl's approach to MHHP temperature control, and will be discussed later. The point here is that the hydride will not be allowed to transform at the maximum possible rate during EVA. Rate is determined by the EMU'S heat load and the environment.
For modeling purposes, it is sufficient to take a worst case point of view and examine the slopes of the absorption and desorption rate curves when the MHHP is nearly depleted of its cooling capacity. This is the condition of the hydrides late in the EVA. At any earlier time in the EVA the hydrides can react faster and provide greater cooling rates. Therefore, if the MHHP can meet the performance requirements in the latter part of the EVA (worst case), it will perform better yet at earlier times.
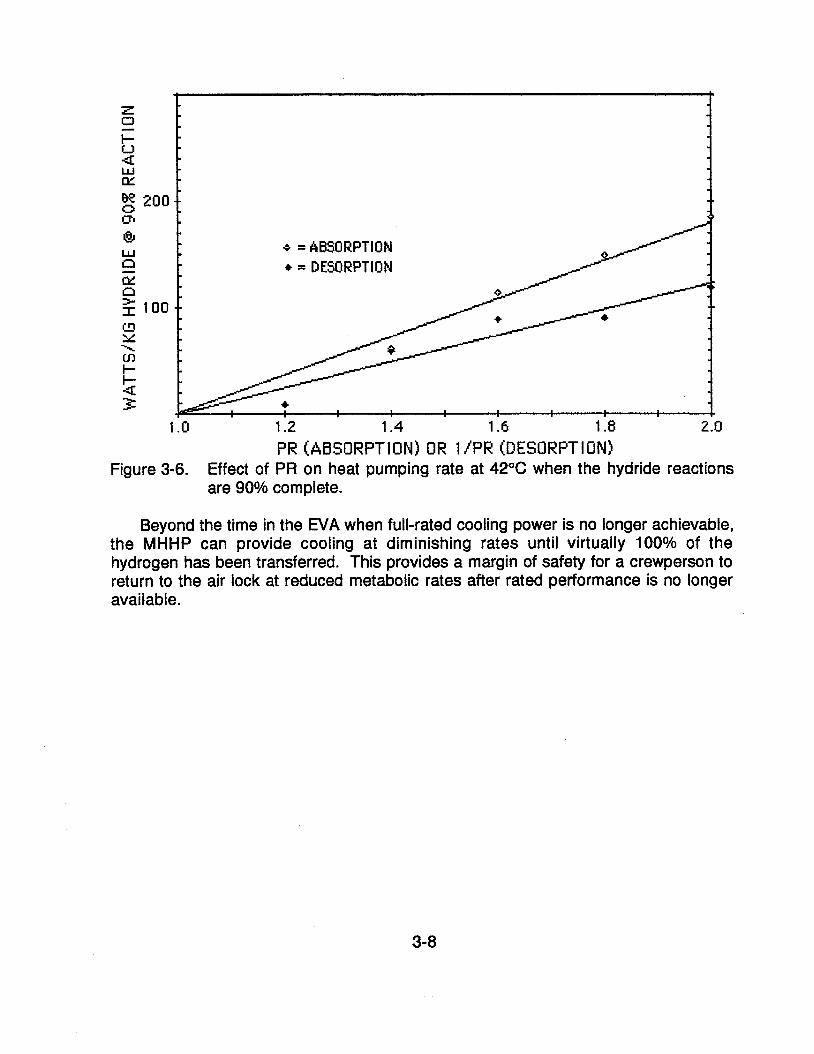
Figure 3-6 is a plot of experimental reaction rates at 90% completion for absorption and desorption tests at 42OC. The rates are expressed in watts per kilogram of hydride. The chemical driving forces are PR (absorption) and IIPR (desorption). Briefly, PR and IIPR are ratios of applied hydrogen pressure divided by equilibrium hydrogen pressure in absorption and desorption respectively. If either term is I the reaction rate is 0 because chemical equilibrium exists between the metal hydride and gaseous hydrogen.
The MHHP is designed for 1200 Btulhr (352 W) average heat load for 4 hours, so the cumulative load is 4800 Btu. Hydride B is MMNi4-5A10.5 and 30.6 kg are on board. At a pressure ratio of 1.4 the hydride is expected to reach 90% discharge with a specific cooling power of about 50 Wlkg. 50 Wlkg x 30.6 kg of hydride B would result in 1530 W (5216 Btulhr). Clearly the MHHP will exceed 90% discharge before failing
to meet the EMU'S much lower cooling demands.
0 0 200 400 600 800 1000 1200 1400 1600 1800
TIME, SECONDS
Figure 3-4. 25°C Absorption, variable pressure ratio'l5.9 mm O.D. x 0.76 mm wall aluminum tube.
The tube wall temperature was monitored during the absorption and desorption rate tests discussed above. From that data an external heat transfer coefficient of 1200 WIm2-K (210 Btulhr-ft2-OF) was determined. This indirect result was confirmed by tests with an electrically heated mock-up of a hydride B container. The total tube surface
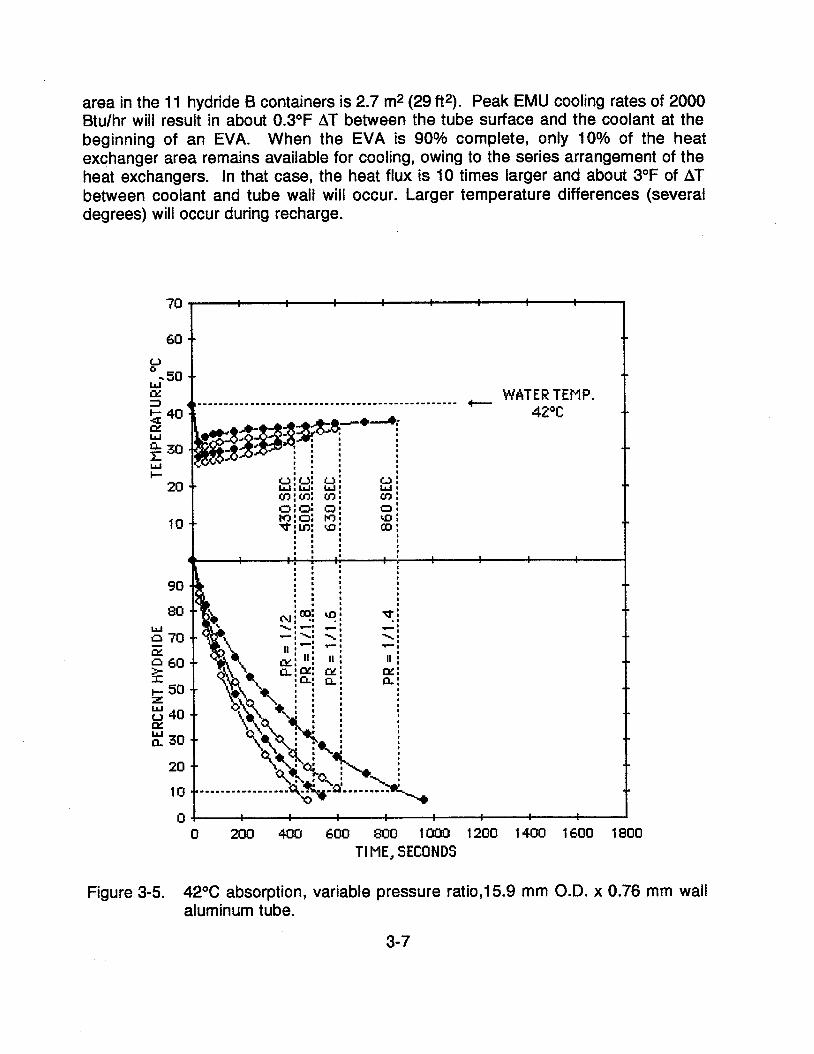
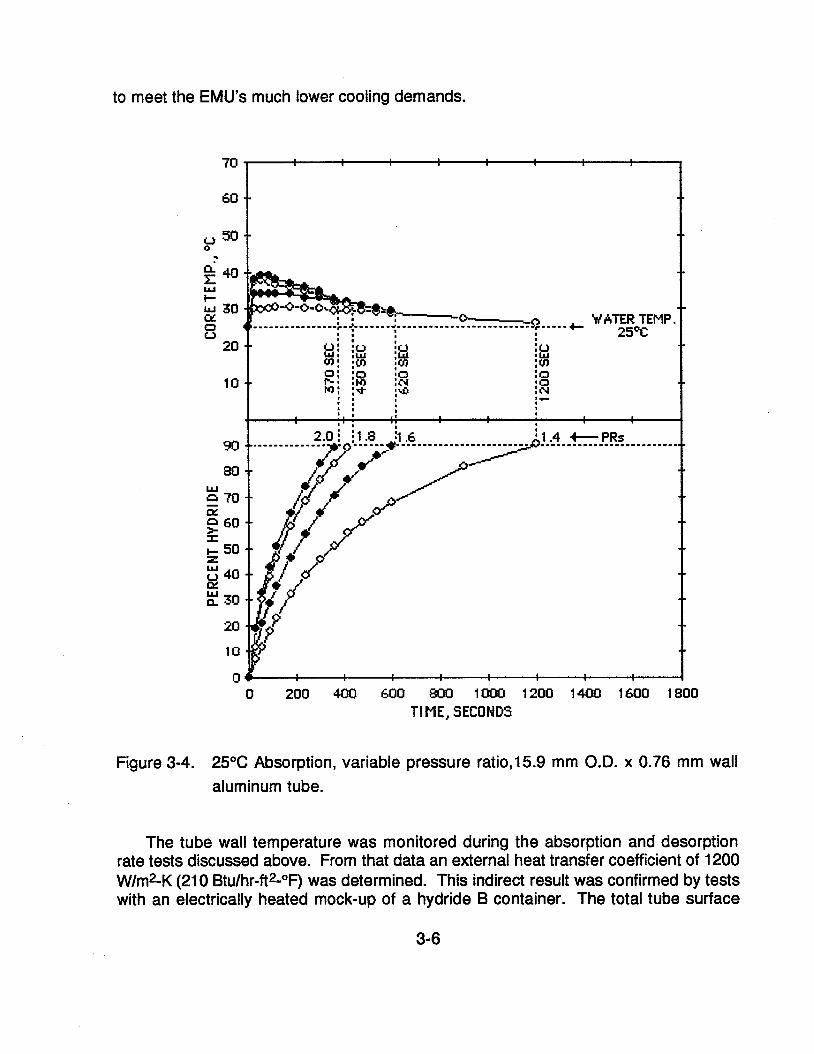
area in the 11 hydride B containers is 2.7 m* (29 ft2). Peak EMU cooling rates of 2000 Btulhr will result in about 0.3OF AT between the tube surface and the coolant at the beginning of an EVA. When the EVA is 90% complete, only 10% of the heat exchanger area remains available for cooling, owing to the series arrangement of the heat exchangers. In that case, the heat flux is 10 times larger and about 3OF of AT between coolant and tube wall will occur. Larger temperature differences (several degrees) will occur during recharge.
-J I 0 200 406 600 800 1000 1200 1400 1600 1800
TI ME, SECONDS
Figure 3-5. 42°C absorption, variable pressure ratio,15.9 mm O.D. x 0.76 mm wail aluminum tube.
1.0 1 :2 1.4 1.6 1 :8 2:0 PR (ABSORPTION) OR 1 /PR (DESORPTION)
Figure 3-6. Effect of PR on heat pumping rate at 42°C when the hydride reactions are 90% complete.
Beyond the time in the EVA when full-rated cooling power is no longer achievable, the MHHP can provide cooling at diminishing rates until virtually 100% of the hydrogen has been transferred. This provides a margin of safety for a crewperson to return to the air lock at reduced metabolic rates after rated performance is no longer available.
4.0 HYDROGEN CONTROL PLUMBING
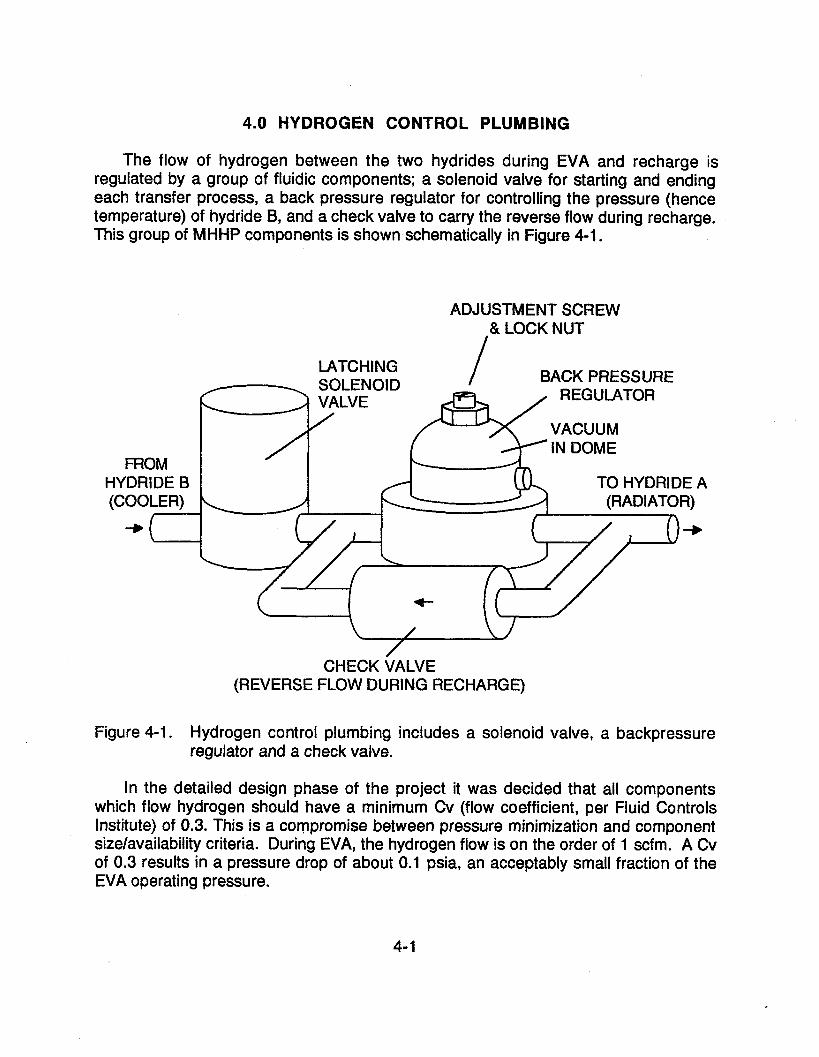
The flow of hydrogen between the two hydrides during EVA and recharge is regulated by a group of fluidic components; a solenoid valve for starting and ending each transfer process, a back pressure regulator for controlling the pressure (hence temperature) of hydride B, and a check valve to carry the reverse flow during recharge. This group of MHHP components is shown schematically in Figure 4-1.
ADJUSTMENT SCREW & LOCK NUT
I LATCHING BACK PRESSURE
REGUMTOR
FROM HYDRIDE B TO HYDRIDE A (COOLER)
+
CHECK VALVE (REVERSE FLOW DURING RECHARGE)
Figure 4-1. Hydrogen control plumbing includes a solenoid valve, a backpressure regulator and a check valve.
In the detailed design phase of the project it was decided that all components which flow hydrogen should have a minimum Cv (flow coefficient, per Fluid Controls Institute) of 0.3. This is a compromise between pressure minimization and component sizelavailability criteria. During EVA, the hydrogen flow is on the order of 1 scfm. A Cv of 0.3 results in a pressure drop of about 0.1 psia, an acceptably small fraction of the EVA operating pressure.
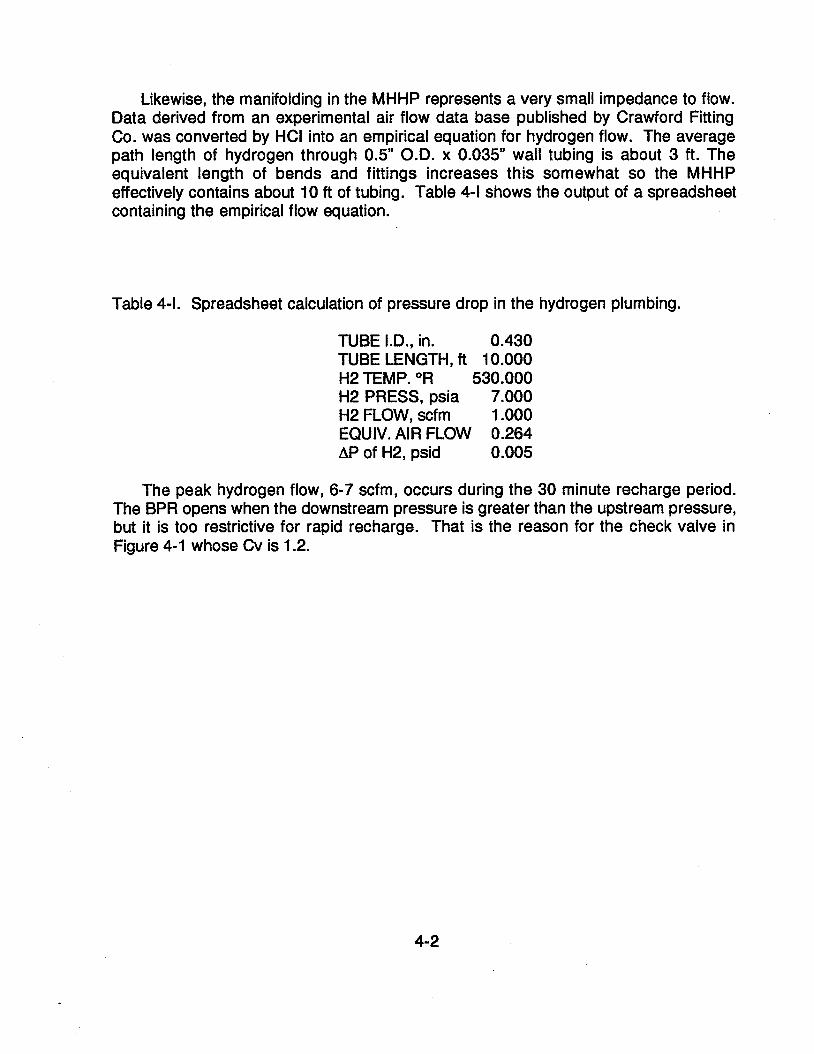
Likewise, the manifolding in the MHHP represents a very small impedance to flow. Data derived from an experimental air flow data base published by Crawford Fitting Co. was converted by HCI into an empirical equation for hydrogen flow. The average path length of hydrogen through 0.5" O.D. x 0.035" wall tubing is about 3 ft. The equivalent length of bends and fittings increases this somewhat so the MHHP effectively contains about 10 ft of tubing. Table 4-1 shows the output of a spreadsheet containing the empirical flow equation.
Table 4-1. Spreadsheet calculation of pressure drop in the hydrogen plumbing.
TUBE I.D., in. 0.430 TUBE LENGTH, ft 10.000 H2 TEMP. OR 530.000 H2 PRESS, psia 7.000 H2 FLOW, scfm 1 .OOO EQUIV. AIR FLOW 0.264 AP of H2, psid 0.005
The peak hydrogen flow, 6-7 scfm, occurs during the 30 minute recharge period. The BPR opens when the downstream pressure is greater than the upstream pressure, but it is too restrictive for rapid recharge. That is the reason for the check valve in Figure 4-1 whose Cv is 1.2.
5.0 TEMPERATURE CONTROL OF THE MHHP
The cooling process in the MHHP does not require extraordinary control methods. It is very straightforward, relying on fundamental design principles and a simple fluidic feedback control to regulate hydride temperatures. Hydrogen flow from hydride B to hydride A during EVA does not require electronic supervision but is purely self- regulated.
The ability of hydrides to regulate their own temperatures is the basis of maintaining the temperature of hydride B just above the freezing point of water. Figure 5-1 shows the hydrogen desorption pressure of MMNi,,AI,, hydride as a function of 1000lK. The freezing point of water, 273 K (32OF), corresponds to 3.66 on the inverse temperature scale. As long as the pressure in the cold hydride container is maintained above 138 kPa (20 psia) the water in the heat exchanger cannot freeze. There are a few caveats and qualifications relating to non-ideal behavior so, to err on the thawed side, the pressure should be controlled somewhat above 138 kPa, say 165 kPa (24 psia). This pressure corresponds to a 278 K (40°F) equilibrium temperature. The sensitivity of hydrogen pressure to temperature change is clearly apparent in this example. The small temperature margin between freezing and 278 K (40°F) results in a 17% change in hydrogen desorption pressure--a substantial fluidic control marcrin.
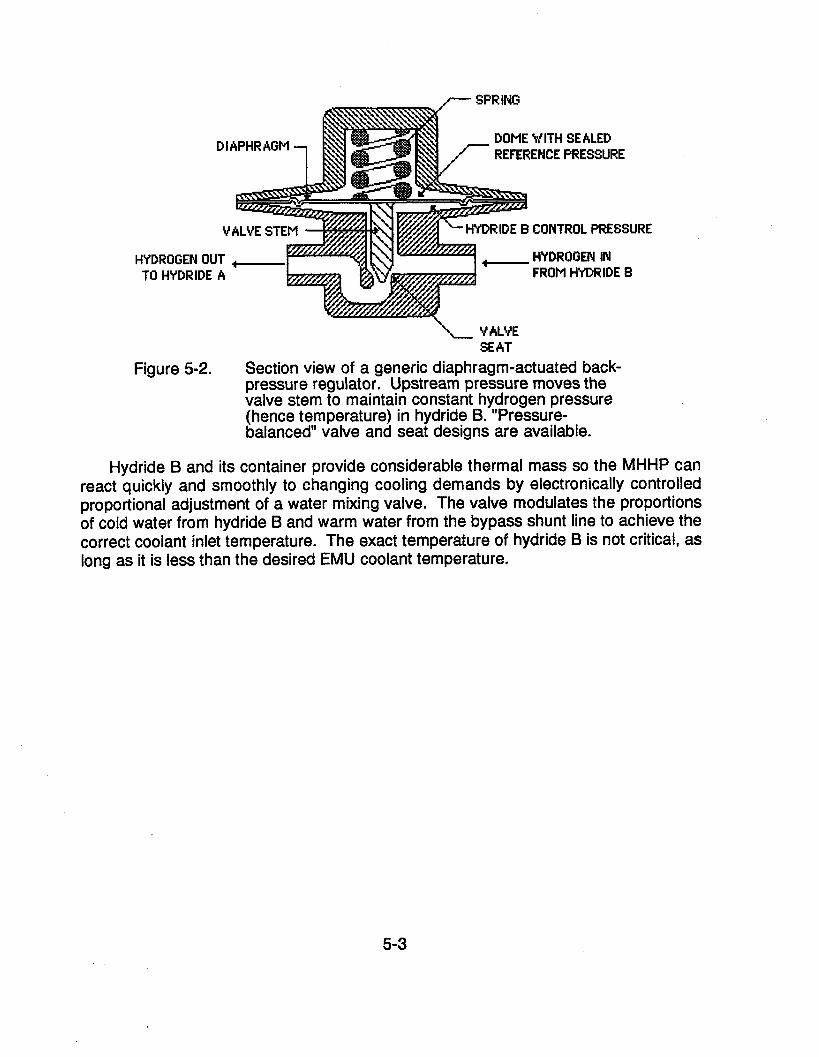
The temperature of hydride B is controlled by a simple diaphragm-operated hydrogen flow control valve. The valve is generically a back pressure regulator (BPR) . Such a valve is shown in Figure 5-2. The BPR is a GO, lnc. Model BP-3 with Part No. 108697 Captured Vent Option. The Captured Vent Option encloses the outside of the diaphragm in a pressure chamber that contains a reference pressure. The adjustment screw sets the backpressure relative to the reference pressure. In the MHHP this pressure is a vacuum so the unit is an absolute backpressure regulator.
The BP-3 has a flow coefficient, C,, of 0.3, a good match to the EVA operating conditions, 1 scfm of hydrogen. The simplified flow equation recommended by the Fluid Controls Institute, Inc. is
Q = 16.05 CVJ- Sp. G. x TOR
At room temperature and 7 psia of operating pressure hydrogen (Sp. G. = 0.0695) the BP-3 should flow about 1 scfm with a 0.1 psia drop, viz:
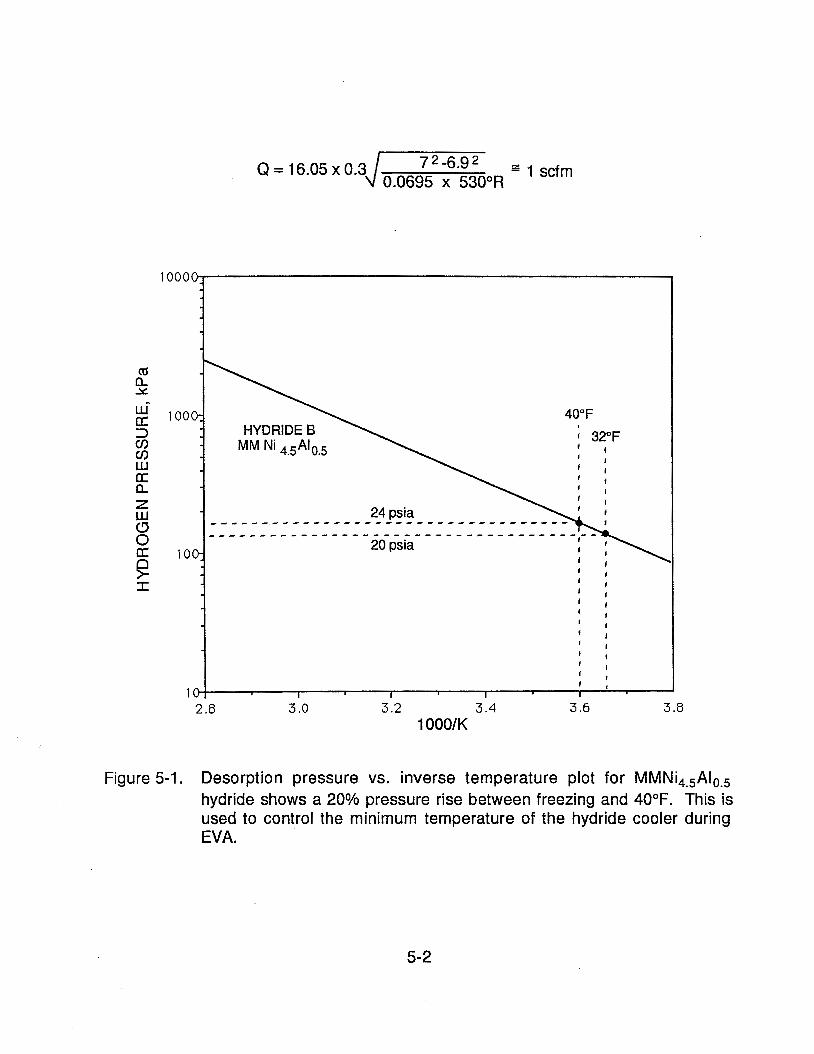
Figure 5-1. Desorption pressure vs. inverse temperature plot for MMNi,.5Alo-5 hydride shows a 20% pressure rise between freezing and 40°F. This is used to control the minimum temperature of the hydride cooler during EVA.
7 SPRING
HYDROGEN 01 TO HYDRIDE
DOME WITH SEALED REFERENCE PRESSURE
UUnmnOEN IN
a -HYDRlDE B CONTROL PRESSURE
A FKum HYDRIDE 8
\ VALVE SEAT
Figure 5-2. Section view of a generic diaphragm-actuated back- pressure regulator. Upstream pressure moves the valve stem to maintain constant hydrogen pressure (hence temperature) in hydride B. "Pressure- balanced" valve and seat designs are available.
Hydride B and its container provide considerable thermal mass so the MHHP can react quickly and smoothly to changing cooling demands by electronically controlled proportional adjustment of a water mixing valve. The valve modulates the proportions of cold water from hydride B and warm water from the bypass shunt line to achieve the correct coolant inlet temperature. The exact temperature of hydride B is not critical, as long as it is less than the desired EMU coolant temperature.
6.0 AUTOMATIC COOLANT TEMPERATURE CONTROL
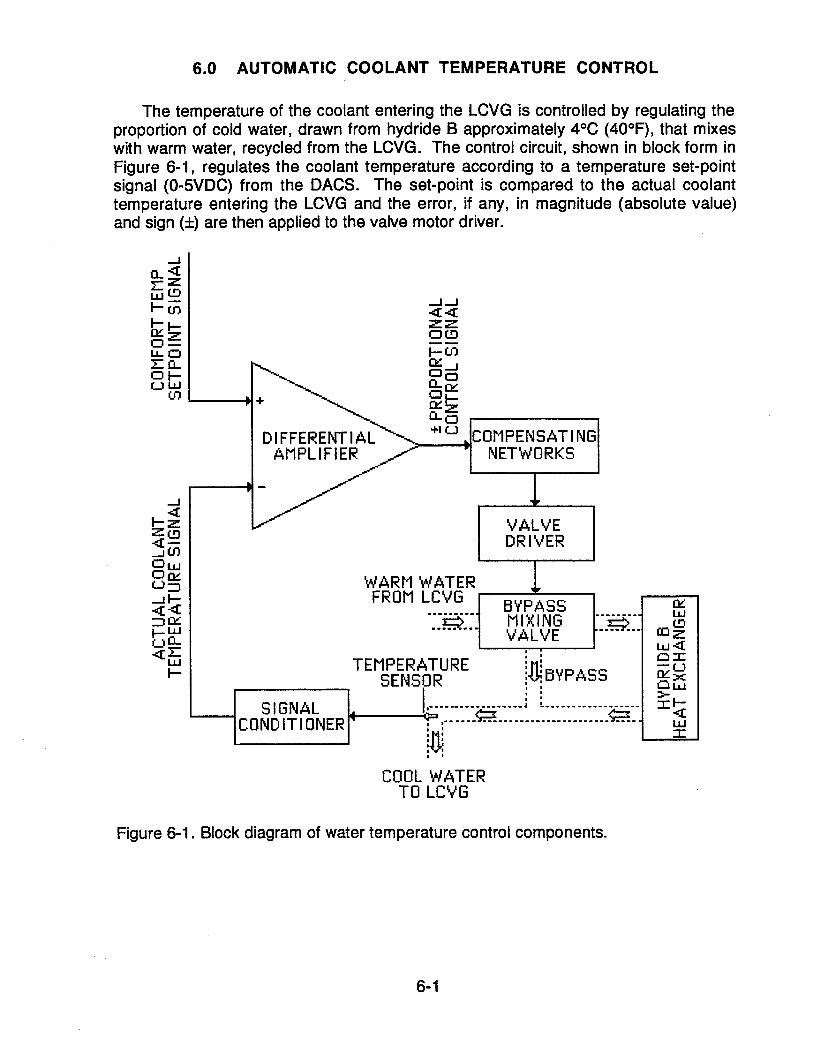
The temperature of the coolant entering the LCVG is controlled by regulating the proportion of cold water, drawn from hydride B approximately 4°C (40°F), that mixes with warm water, recycled from the LCVG. The control circuit, shown in block form in Figure 6-1, regulates the coolant temperature according to a temperature set-point signal (0-5VDC) from the DACS. The set-point is compared to the actual coolant temperature entering the LCVG and the error, if any, in magnitude (absolute value) and sign (k) are then applied to the valve motor driver.
JJ QQ ZIZ o m -- I-tn Ed '=, E& Lo - *IU ,COMPENSATING
NETWORKS
VALVE DRIVER
I WARM WATER FROM LcvG BYPiSS
TEMPERATURE I I
SENSOR , I BYPASS
S l GNAL CONDITIONER
I I
COOL WATER TO LCVG
Figure 6-1. Block diagram of water temperature control components.
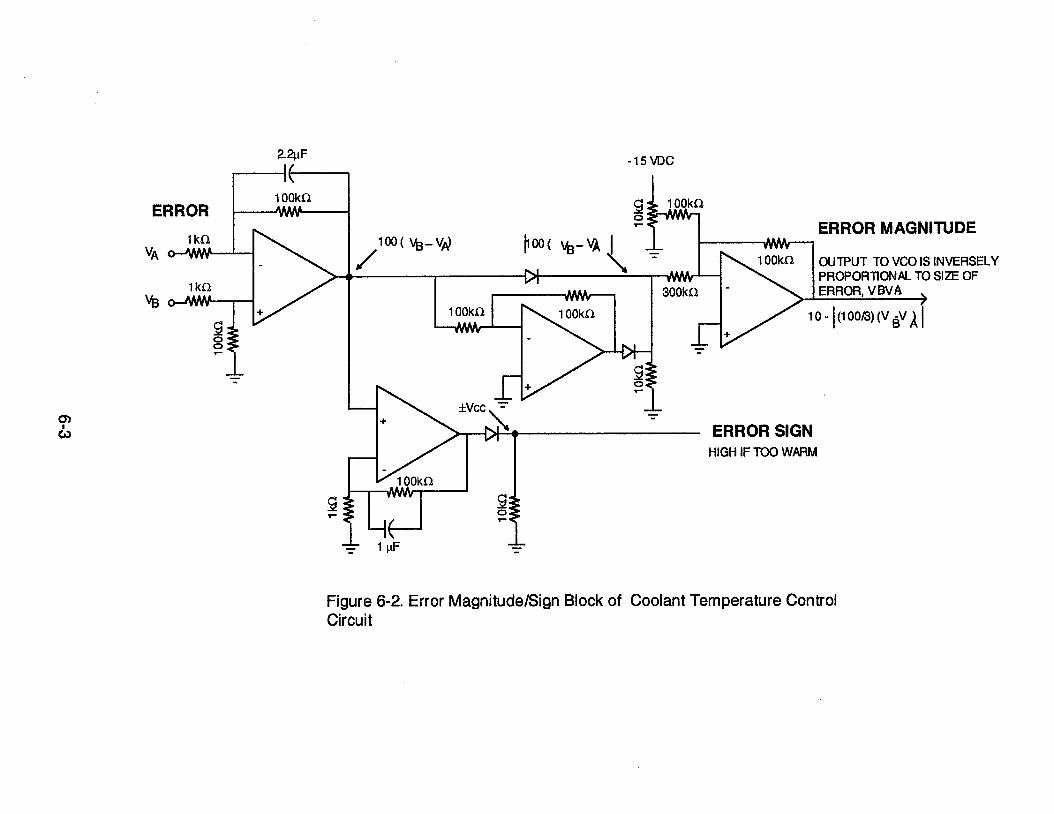
The control circuit is divided into three functional units. The first unit, shown in Figure 6-2 compares the set-point and actual temperatures, amplifies the error and decomposes it into an absolute value and sign. The circuit is built around an LM324 quad op amp. The # I amp acts as a differential amplifier with a gain of 100. Its output is passed through a diode if positive or inverted by #2 amp (gain = 1) if negative. A small flat band is introduced by the diodes but the effect on valve adjustment is inconsequential. In either case the magnitude of the error is fed to #3 amp where it is amplified, summed with -10 VDC and inverted. The reason for the summing and inversion will become apparent in the following discussion of the VCO. The #4 amp of the quad chip is used as a comparator whose output is high or low depending upon the sign of the error. Low output is interpreted by the valve driver as too cold whereas high output is interpreted as too warm.
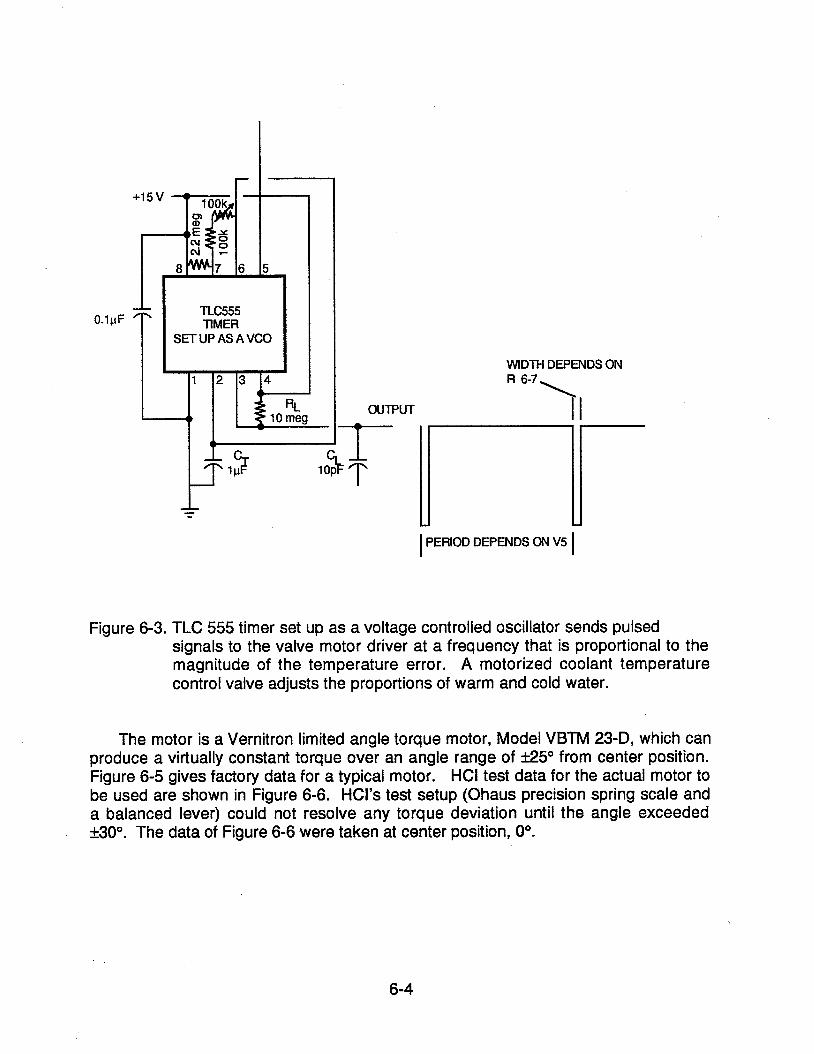
The second unit in the control circuit is simply a voltage controlled oscillator (VCO). Figure 6-3 shows the circuit, built around a TLC 555 timer. The output is high for most of the period of oscillation, which is adjustable by the control voltage on pin 5. Figure 6-4 shows the relationship between frequency and control voltage. The relationship is inverse and this is the reason for the summinglinverting amplifier at the output of the unit shown previously in Figure 6-1. The valve must be adjusted more frequently when the error is large and less frequently when the error is small to act as a proportional controller. The slight nonlinearity in Figure 6-4 is not a problem in this feedback loop. The VCO has been hard-wired to the error magnitudelsign circuit and operated with no difficulties.
The final unit of the valve control circuitry is a solid state switch and a set of 4 MOSFETs. The switch and MOSFETs act like a double pole, double throw (DPDT) switch, supplying the torque motor with pulses of 28 VDC at a frequency and pulse width set by the VCO, and a polarity set by the Sign signal.
1 OOkQ ERROR
1kQ ERROR MAGNITUDE
v~ O+M! OUTPUT TO VCO IS INVERSELY PROPORTIONAL TO SIZE OF
lkQ \rBcAMM
ERROR, VBVA
o - l ( i o o a ( v , y ~ 1
- - - -
ERROR SIGN HIGH IF TOO WARM
L! F
-
Figure 6-2. Error MagnitudeISign Block of Coolant Temperature Control Circuit
I PERIOD DEPENDS ON V5 I
Figure 6-3. TLC 555 timer set up as a voltage controlled oscillator sends pulsed signals to the valve motor driver at a frequency that is proportional to the magnitude of the temperature error. A motorized coolant temperature control valve adjusts the proportions of warm and cold water.
The motor is a Vernitron limited angle torque motor, Model VBTM 23-D, which can produce a virtually constant torque over an angle range of f25O from center position. Figure 6-5 gives factory data for a typical motor. HCI test data for the actual motor to be used are shown in Figure 6-6. HCl's test setup (Ohaus precision spring scale and a balanced lever) could not resolve any torque deviation until the angle exceeded k30°. The data of Figure 6-6 were taken at center position, OO.
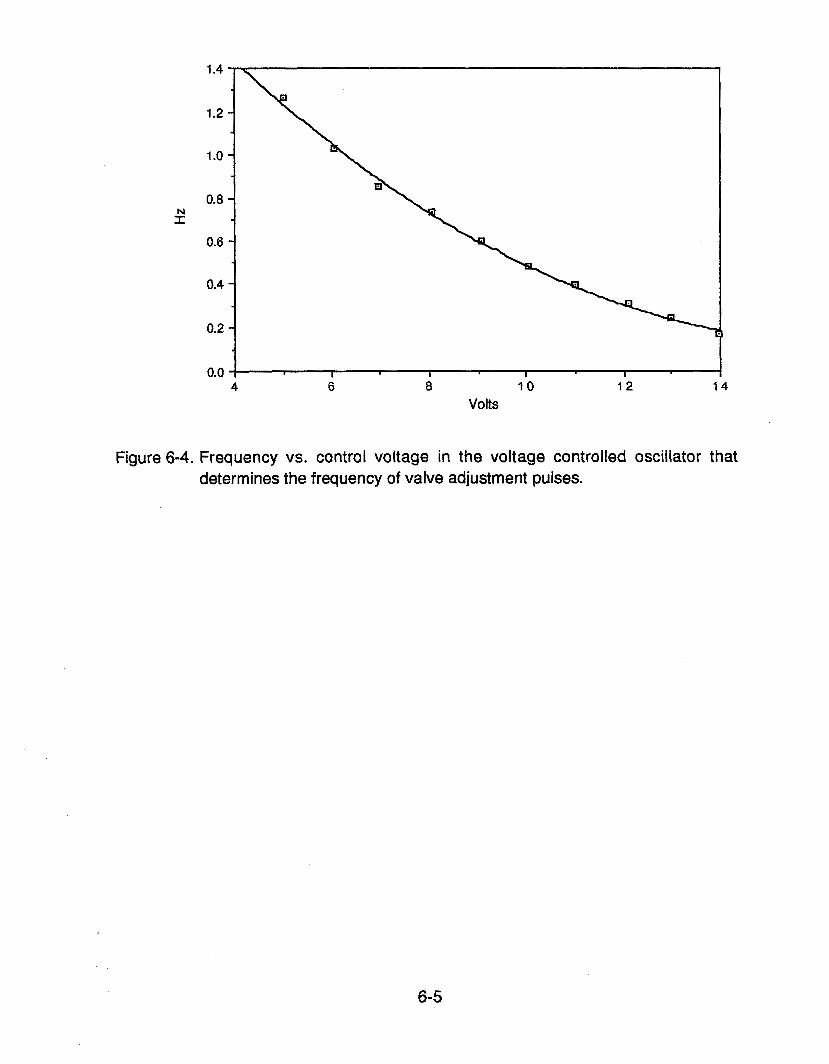
Figure 6-4. Frequency vs. control voltage in the voltage controlled oscillator that determines the frequency of valve adjustment pulses.
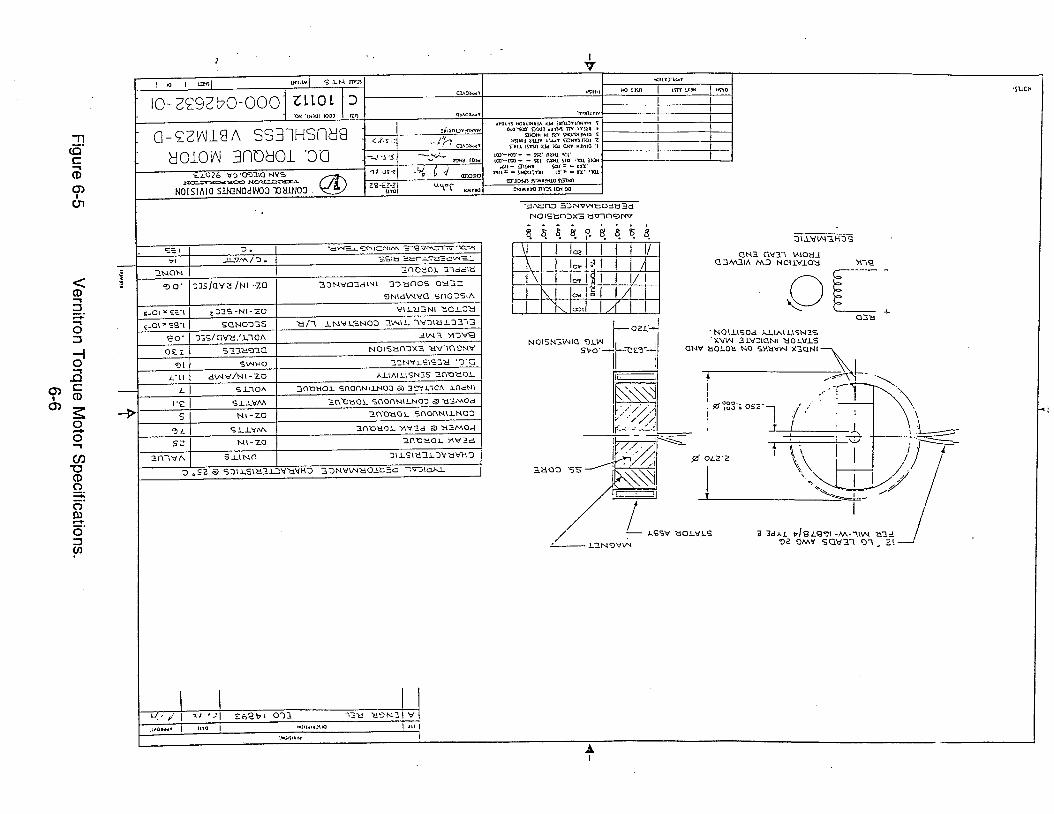
Figure 6-5
Vernitron T
orque Motor S
pecifications. 6-6
0 0 5 10 15 20 25 30
VOLTS, DC
16.8 in. oz. @ 28VDC
l " . ' I " " I ' " ' I ~ ' ~ ~ I ' .
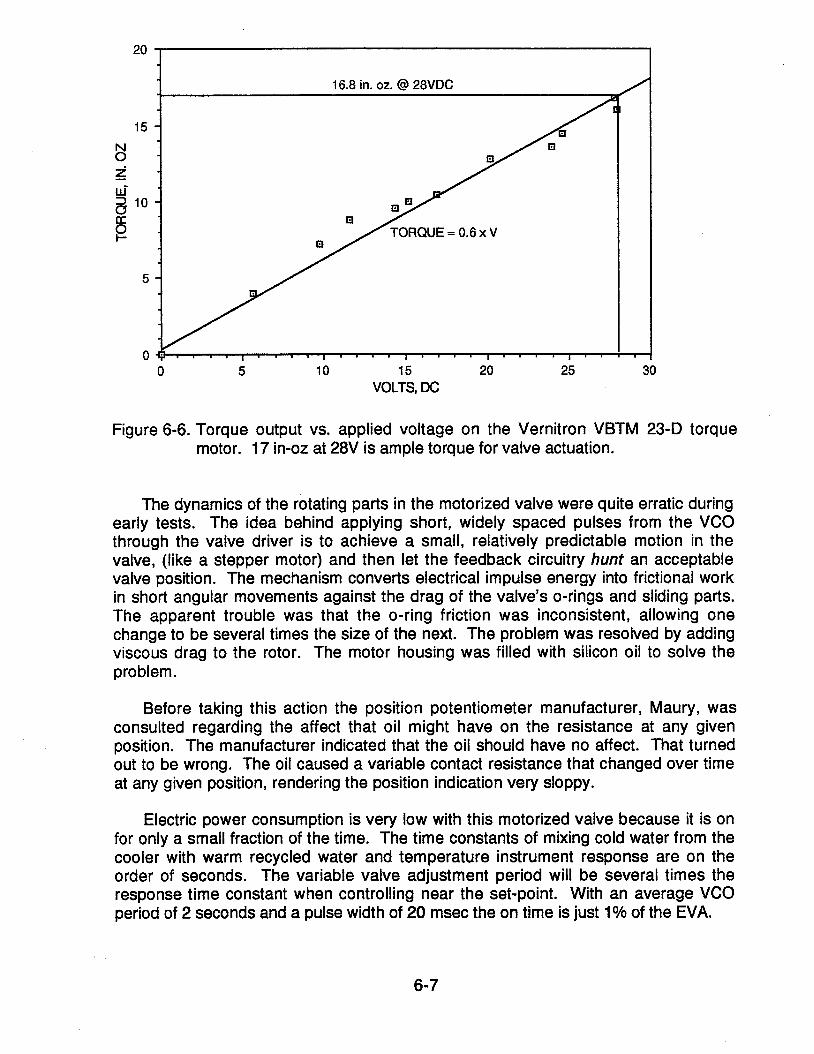
Figure 6-6. Torque output vs. applied voltage on the Vernitron VBTM 23-D torque motor. 17 in-oz at 28V is ample torque for valve actuation.
The dynamics of the rotating parts in the motorized valve were quite erratic during early tests. The idea behind applying short, widely spaced pulses from the VCO through the valve driver is to achieve a small, relatively predictable motion in the valve, (like a stepper motor) and then let the feedback circuitry hunt an acceptable valve position. The mechanism converts electrical impulse energy into frictional work in short angular movements against the drag of the valve's o-rings and sliding parts. The apparent trouble was that the o-ring friction was inconsistent, allowing one change to be several times the size of the next. The problem was resolved by adding viscous drag to the rotor. The motor housing was filled with silicon oil to solve the problem.
Before taking this action the position potentiometer manufacturer, Maury, was consulted regarding the affect that oil might have on the resistance at any given position. The manufacturer indicated that the oil should have no affect. That turned out to be wrong. The oil caused a variable contact resistance that changed over time at any given position, rendering the position indication very sloppy.
Electric power consumption is very low with this motorized valve because it is on for only a small fraction of the time. The time constants of mixing cold water from the cooler with warm recycled water and temperature instrument response are on the order of seconds. The variable valve adjustment period will be several times the response time constant when controlling near the set-point. With an average VCO period of 2 seconds and a pulse width of 20 msec the on time is just 1% of the EVA.
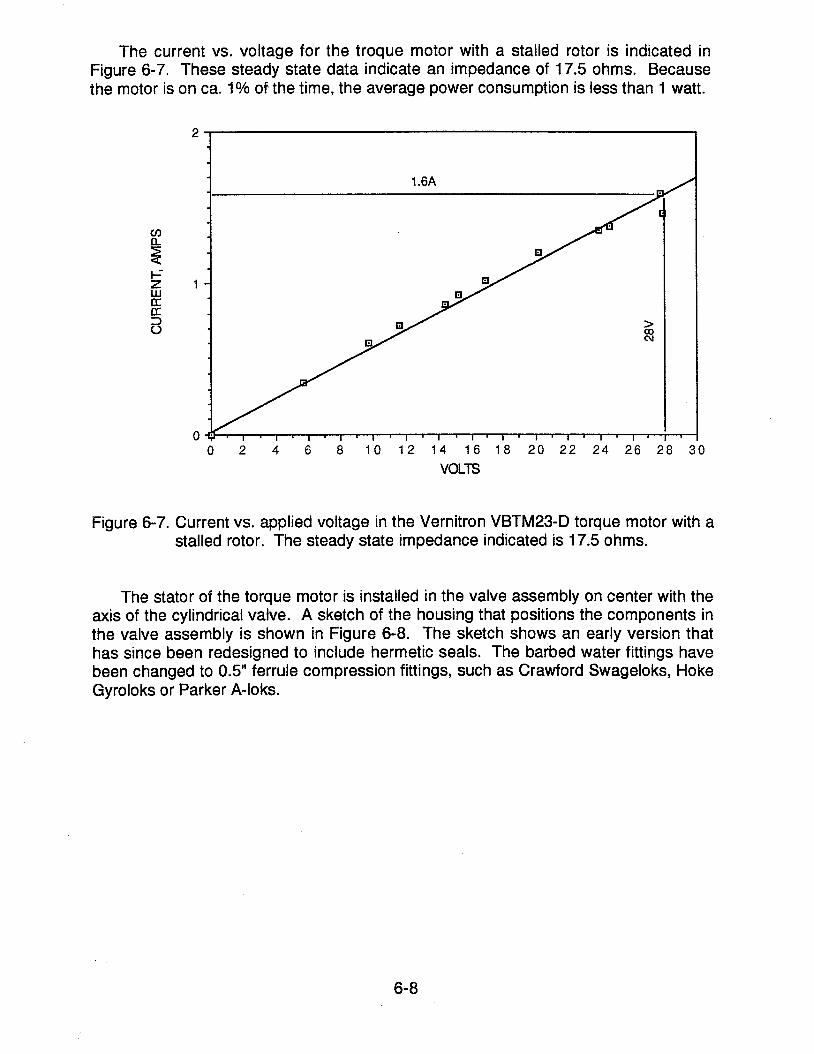
The current vs. voltage for the troque motor with a stalled rotor is indicated in Figure 6-7. These steady state data indicate an impedance of 17.5 ohms. Because the motor is on ca. 1% of the time, the average power consumption is less than 1 watt.
VOLTS
Figure 6-7. Current vs. applied voltage in the Vernitron VBTM23-D torque motor with a stalled rotor. The steady state impedance indicated is 17.5 ohms.
The stator of the torque motor is installed in the valve assembly on center with the axis of the cylindrical valve. A sketch of the housing that positions the components in the valve assembly is shown in Figure 6-8. The sketch shows an early version that has since been redesigned to include hermetic seals. The barbed water fittings have been changed to 0.5 ferrule compression fittings, such as Crawford Swageloks, Hoke Gyroloks or Parker A-loks.
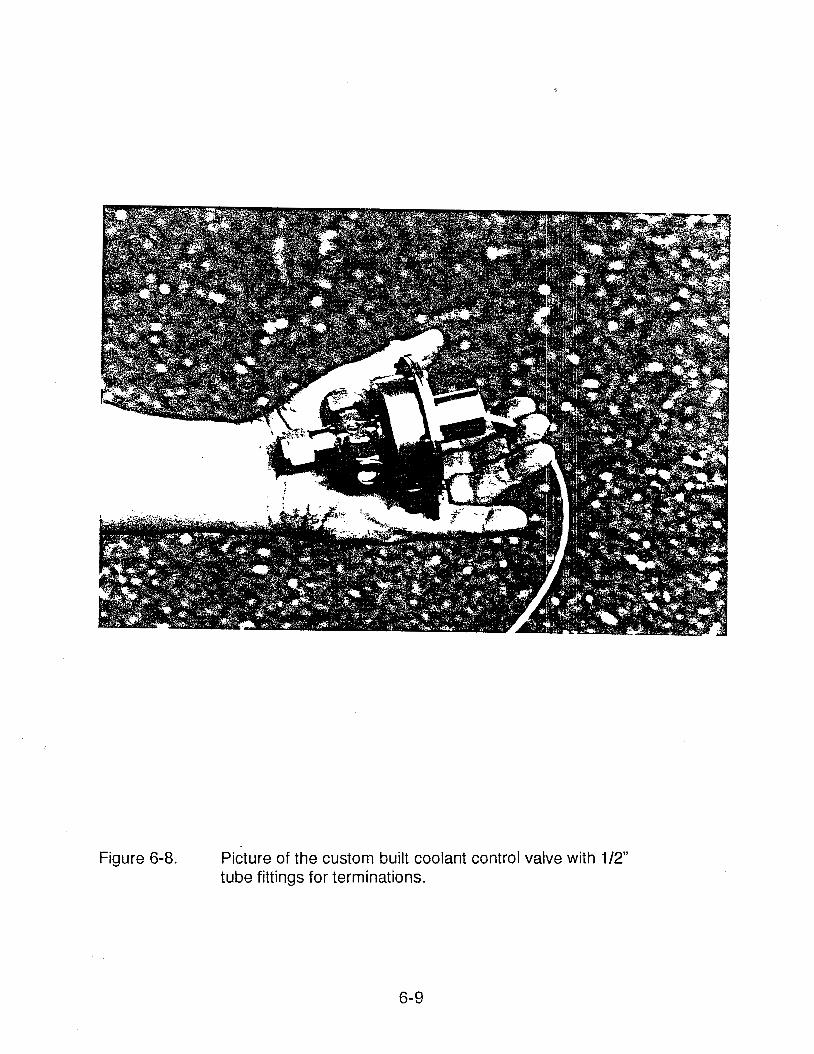
Figure 6-8. Picture of the custom built coolant control valve with 112" tube fittings for terminations.
The rotor is attached to the shaft of the valve, on center with the housing. The brass valve body is a modified Moen rotary valve cartridge, commonly used to regulate water temperature in bathroom showers. Moen's plated brass rotor has been replaced by a stainless steel shaft with sharp metering edges positioned to proportion the flow through each of the two valve orifices as the troque motor swings through its 50" angle range (k25O from center). The valve's body and shaft also serve as the bearing for the torque motor.
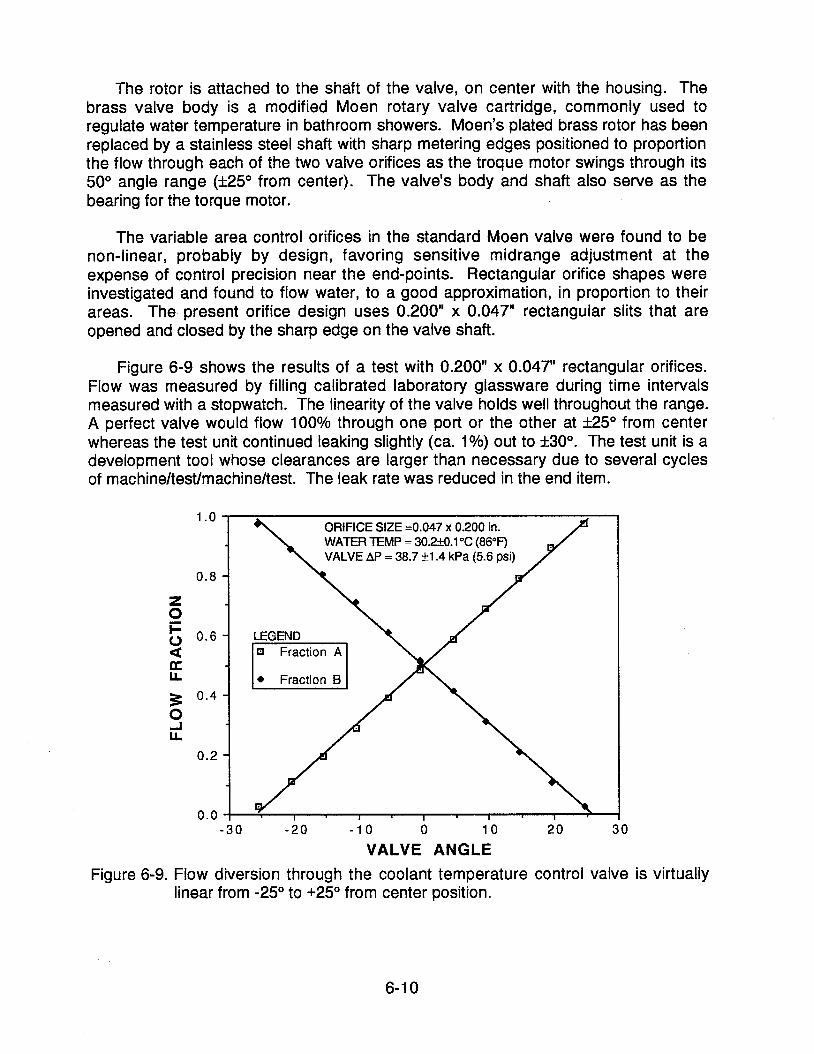
The variable area control orifices in the standard Moen valve were found to be non-linear, probably by design, favoring sensitive midrange adjustment at the expense of control precision near the end-points. Rectangular orifice shapes were investigated and found to flow water, to a good approximation, in proportion to their areas. The present orifice design uses 0.200" x 0.047" rectangular slits that are opened and closed by the sharp edge on the valve shaft.
Figure 6-9 shows the results of a test with 0.200" x 0.047" rectangular orifices. Flow was measured by filling calibrated laboratory glassware during time intervals measured with a stopwatch. The linearity of the valve holds well throughout the range. A perfect valve would flow 100% through one port or the other at k25O from center whereas the test unit continued leaking slightly (ca. 1%) out to f30°. The test unit is a development tool whose clearances are larger than necessary due to several cycles of machine/test/machine/test. The leak rate was reduced in the end item.
-30 - 2 0 -1 0 0 10 2 0 3 0
VALVE ANGLE Figure 6-9. Flow diversion through the coolant temperature control valve is virtually
linear from -25O to +25O from center position.
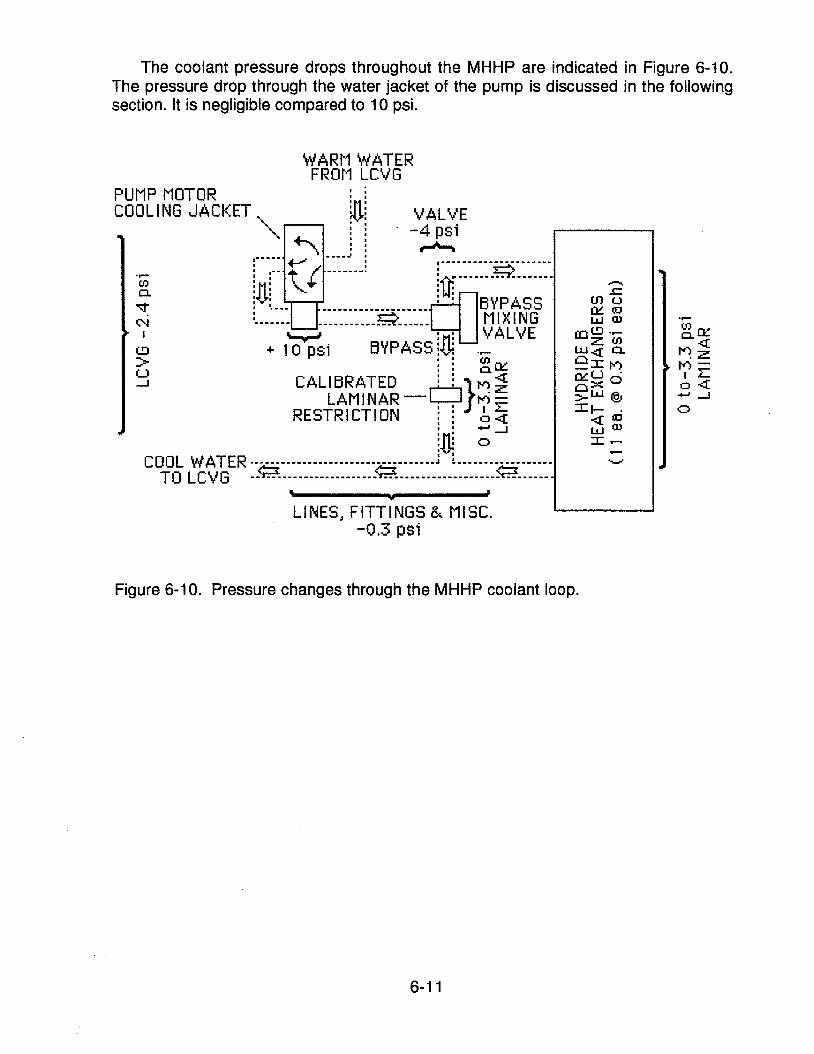
The coolant pressure drops throughout the MHHP are indicated in Figure 6-10. The pressure drop through the water jacket of the pump is discussed in the following section. It is negligible compared to 10 psi.
1 T
#
LINES, FITTINGS & MISC. -0.3 psi u
WARM WATER FROM LCVG
PUMP MOTOR 1 . I I
COOLING JACKET VALVE
Figure 6-10. Pressure changes through the MHHP coolant loop.
- r cn u
05 a W Q)
m CLI .- Z
;-a ,I: M
gg ~ pLL1@ It- @j
2~ I- -
v
5 -4 psi
*
I - - - - -
.- U) 0,
-? BYPASS MIXING N
I cr+ VALVE C3 > U
CALIBRATED I I
-4
I I cCJ
i Q I s COOL WATER . . - - - - - - - - - - - - - - - - - - - - - - - - - - - - - - - - - a
TO LCVG ..= ........-.....---- e -----------.----.- 5 2 - - - - - - -
7.0 COOLING WATER PUMP
The coolant pump is based on a Micropump Model 120-000 pump head. Neither the flow and pressure specifications nor the environmental constraints of vacuum testing could be met with a standard Micropump drive motor. HCI therefore opted to acquire a motor from an alternate source and provide a hermetic housing.
A flight unit would, of course, be DC powered. It was decided however, with JSC concurrence, that the ground test article could use an AC motor in the coolant pump since it is incidental to the main thrust of an MHHP evaluation. A TRW Globe Motor Model 75A 6009, high temperature type, 115 VAC, 60 Hz induction motor was acquired, coupled to the pump with a Micropump sealed magnetic drive, and bench tested. The compact motor (1.688 O.D. x 2.250 long) is rated for 1.4 in-oz of torque at 3000 RPM and meets Mil-M-7969 specifications. Initial testing was conducted with the factory-recommended 3pF capacitor.
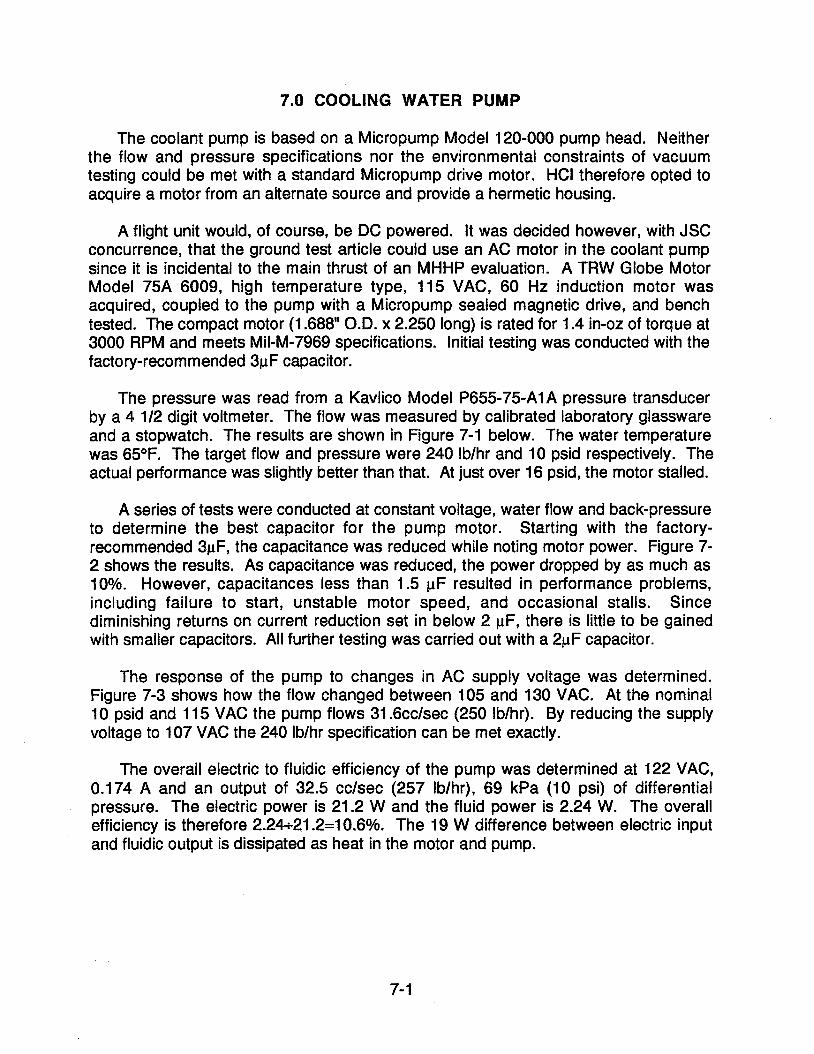
The pressure was read from a Kavlico Model P655-75-AIA pressure transducer by a 4 112 digit voltmeter. The flow was measured by calibrated laboratory glassware and a stopwatch. The results are shown in Figure 7-1 below. The water temperature was 65°F. The target flow and pressure were 240 Iblhr and 10 psid respectively. The actual performance was slightly better than that. At just over 16 psid, the motor stalled.
A series of tests were conducted at constant voltage, water flow and back-pressure to determine the best capacitor for the pump motor. Starting with the factory- recommended 3pF, the capacitance was reduced while noting motor power. Figure 7- 2 shows the results. As capacitance was reduced, the power dropped by as much as 10%. However, capacitances less than 1.5 pF resulted in performance problems, including failure to start, unstable motor speed, and occasional stalls. Since diminishing returns on current reduction set in below 2 pF, there is little to be gained with smaller capacitors. All further testing was carried out with a 2pF capacitor.
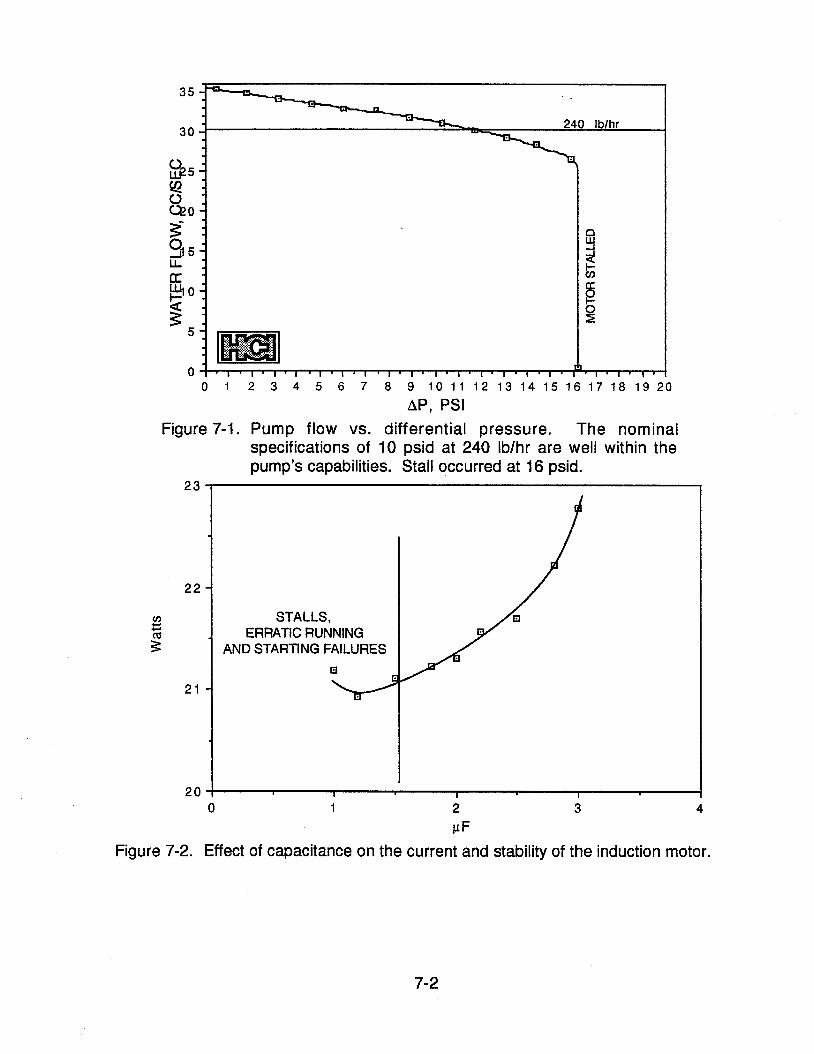
The response of the pump to changes in AC supply voltage was determined. Figure 7-3 shows how the flow changed between 105 and 130 VAC. At the nominal 10 psid and 115 VAC the pump flows 31.6ccIsec (250 Iblhr). By reducing the supply voltage to 107 VAC the 240 Iblhr specification can be met exactly.
The overall electric to fluidic efficiency of the pump was determined at 122 VAC, 0.174 A and an output of 32.5 cclsec (257 Iblhr), 69 kPa (10 psi) of differential pressure. The electric power is 21.2 W and the fluid power is 2.24 W. The overall efficiency is therefore 2.24+21.2=10.6%. The 19 W difference between electric input and fluidic output is dissipated as heat in the motor and pump.
0 1 2 3 4 5 6 7 8 9 10 11 12 13 14 15 1 6 17 1 8 19 20
AP, PSI Figure 7-1. Pump flow vs. differential pressure. The nominal
specifications of 10 psid at 240 Iblhr are well within the pump's capabilities. Stall occurred at 16 psid.
Figure 7-2. Effect of capacitance on the current and stability of the induction motor.
-
-
STALLS, ERRATIC RUNNING
AND STARTING FAILURES
I I I
2pF Capacitor
Figure 7-3. Pump flow vs. ac supply voltage. A 2pF capacitor was used in this test.
L * 100 110 120 130
-
-
-
The motor is surrounded by a water jacket to remove the waste heat. a thermocouple attached to the motor near the outboard bearing (as far radially inward as possible from the water jacket) holds steady at 5-6OC above the coolant temperature after a few minutes of operation. That temperature signal is sent to the Data Acquisition & Control System (DACS) as a test shutdown criterion should overheating occur.
140 I I I
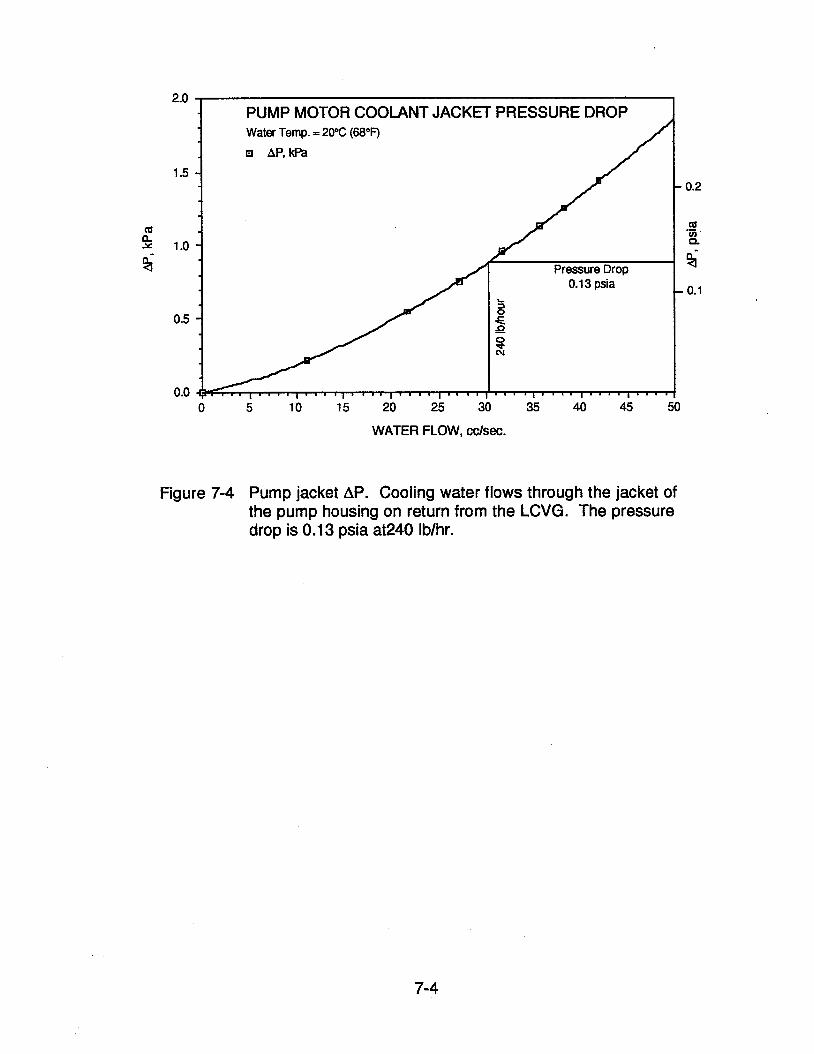
The pressure drop through the water jacket was measured over a range of flow encompassing the required 240 Iblhr. The results are shown in Figure 7-4. At 240 Iblhr the pressure drop is 1.6 kPa (0.23 psi), an acceptably small portion of the 10 psi pressure budget of the MHHP.
AC SUPPLY VOLTAGE
0 5 10 15 20 25 30 35 40 45 50
WATER FLOW, cclsec.
Figure 7-4 Pump jacket AP. Cooling water flows through the jacket of the pump housing on return from the LCVG. The pressure drop is 0.13 psia at240 Iblhr.
8.0 REGENERATION EQUIPMENT
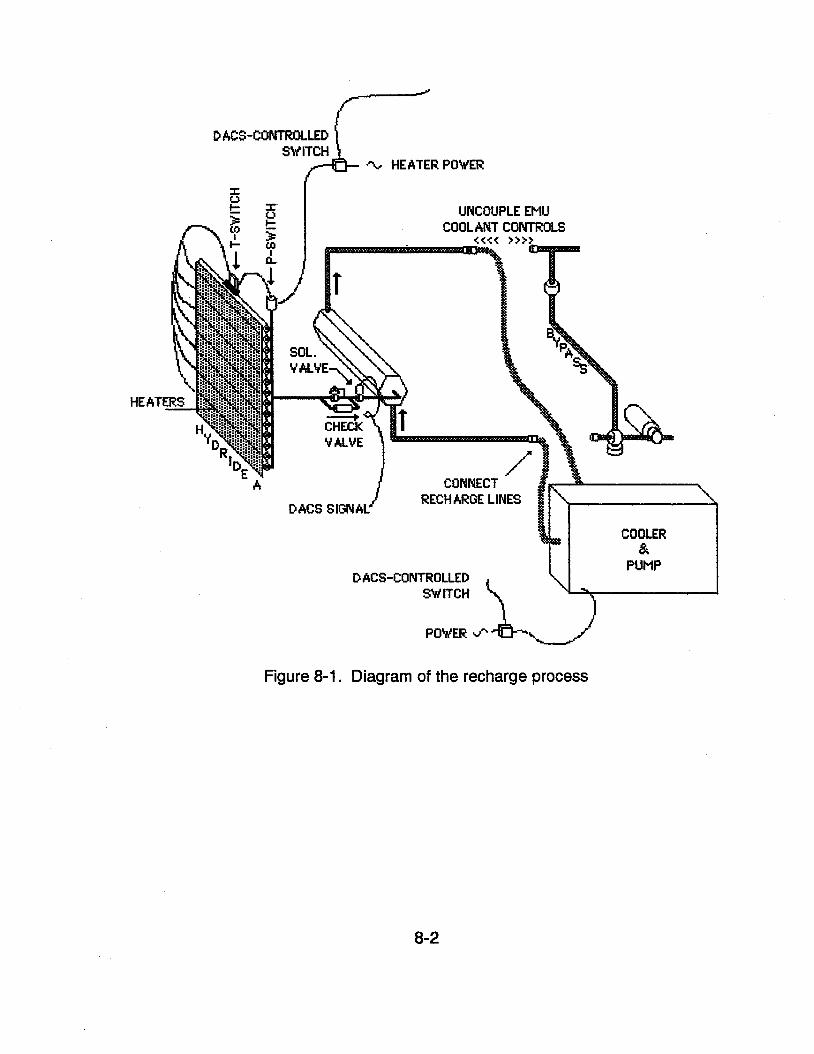
The MHHP is recharged by supplying 208 VAC 3-phase power to the heaters embedded in the radiator while flowing cold water through the cooler. The heaters were supplied by Watlow, built to HCI specifications and checked individually at atmospheric pressure before installation. The heaters worked flawlessly through atmospheric testing at HCI and JSC. However, three of the 36 heaters failed during vacuum chamber tests, indicating that Watlow's terminations on the ends of the heaters did not have sufficient insulation from each other. Their design should be revised before any further testing in vacuum. These failures degraded the test results and endangered the entire test program. The arcing could have (but did not) damaged other components.
Figure 8-1 shows the recharge setup. In a flight unit the EMU coolant control subsystem would be uncoupled from the hydride subsystem during recharge. The water cooler would then be coupled in its place. In the unmanned vacuum chamber tests it was important to maintain a sealed test environment. Therefore the coupling and uncoupling operation was simulated by three-way valves built into the coolant control system.
DACS-controlled power is fed through over-pressure and over-temperature switches to the heaters in the radiator and directly to the cooler. The DACS reads radiator temperature and regulates power onloff to maintain the desired recharge temperature, <200°F. When recharge is complete, all power is switched off and the coolant lines are returned to the EMU coolant control connections in preparation for the next EVA simulation.
D ACS-CONTROLLED SWITCH
% HEATER POWER
POWER fl &d Figure 8-1. Diagram of the recharge process
9.0 HCl's DATA ACQUISITION & CONTROL SYSTEM
During predelivery testing, a PC-based data acquisition and control system (DACS) was used to control and monitor the MHHP. The system was delivered to JSC with the MHHP and was used during atmospheric and vacuum testing. In the latter tests HCl's DACS was supplemented by LESC's DACS.
At the heart of the system is an Epson Equity II+ computer, chosen because it is a competitively priced computer that fits easily into a 19" rack cabinet. It is equipped with a 20 megabyte hard disk, a monochrome monitor and a dot-matrix printer.
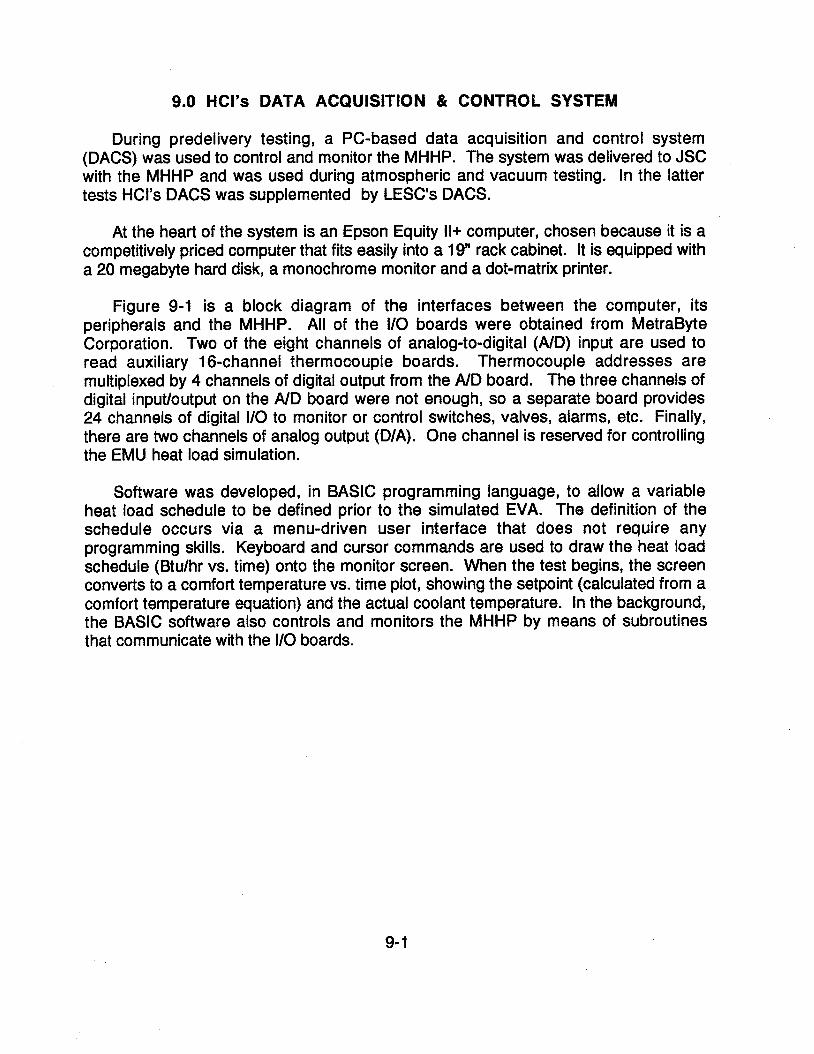
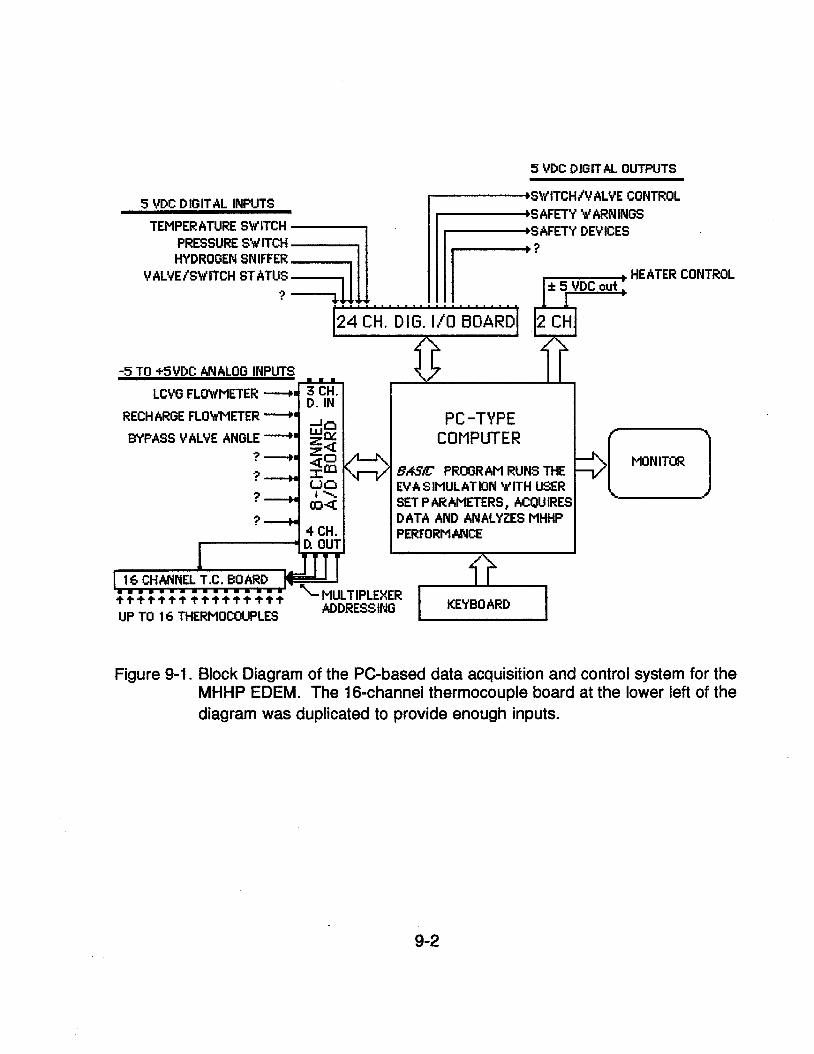
Figure 9-1 is a block diagram of the interfaces between the computer, its peripherals and the MHHP. All of the 110 boards were obtained from MetraByte Corporation. Two of the eight channels of analog-to-digital (AID) input are used to read auxiliary 16-channel thermocouple boards. Thermocouple addresses are multiplexed by 4 channels of digital output from the AID board. The three channels of digital inputloutput on the AID board were not enough, so a separate board provides 24 channels of digital I10 to monitor or control switches, valves, alarms, etc. Finally, there are two channels of analog output (DIA). One channel is reserved for controlling the EMU heat load simulation.
Software was developed, in BASIC programming language, to allow a variable heat load schedule to be defined prior to the simulated EVA. The definition of the schedule occurs via a menu-driven user interface that does not require any programming skills. Keyboard and cursor commands are used to draw the heat load schedule (Btulhr vs. time) onto the monitor screen. When the test begins, the screen converts to a comfort temperature vs. time plot, showing the setpoint (calculated from a comfort temperature equation) and the actual coolant temperature. In the background, the BASIC software also controls and monitors the MHHP by means of subroutines that communicate with the 110 boards.
5 VDC DIGITAL OUTPUTS
5 VDC DIGITAL INPUTS SWITCH& ALVE CONTROL SAFETY W ARN INGS
TEMPERATURE SV ITCH SAFETY DEVICES PREssuRwwlTm HYDROGEN SNIFFER
V ALVEISW ITCH ST ATUS
1 , , . , . , . , . , F; HEATER CONTROL
124 CH. DIG. I/O BOARD] 12 CHI -5 TO +5VDC ANALOG INPUTS
I.
LCVG FLOWMETER ---+-
RECHARGE FLOWMETER PC -TYPE BYPASS VALVE ANGLE -a g@ COMPUTER
&'Mi&: PROGRAM RUNS THE MONITOR
?-+ I -. EVA SIMULATION WITH USER
?-• OPQ SET P AR AMETERS, ACQUIRES ? -- DATA AND ANALYZES MHHP
4 CH. PERFORMANCE 7 D. OUT - 1
16 CHANNEL T.C. BOARD kiiiiiiiiiiiiiiie~ ADDRESSING KEYBOARD UP TO 1 6 THERMOCOUPLES
Figure 9-1. Block Diagram of the PC-based data acquisition and control system for the MHHP EDEM. The 16-channel thermocouple board at the lower left of the diagram was duplicated to provide enough inputs.
10.0 HEAT LOAD SIMULATOR
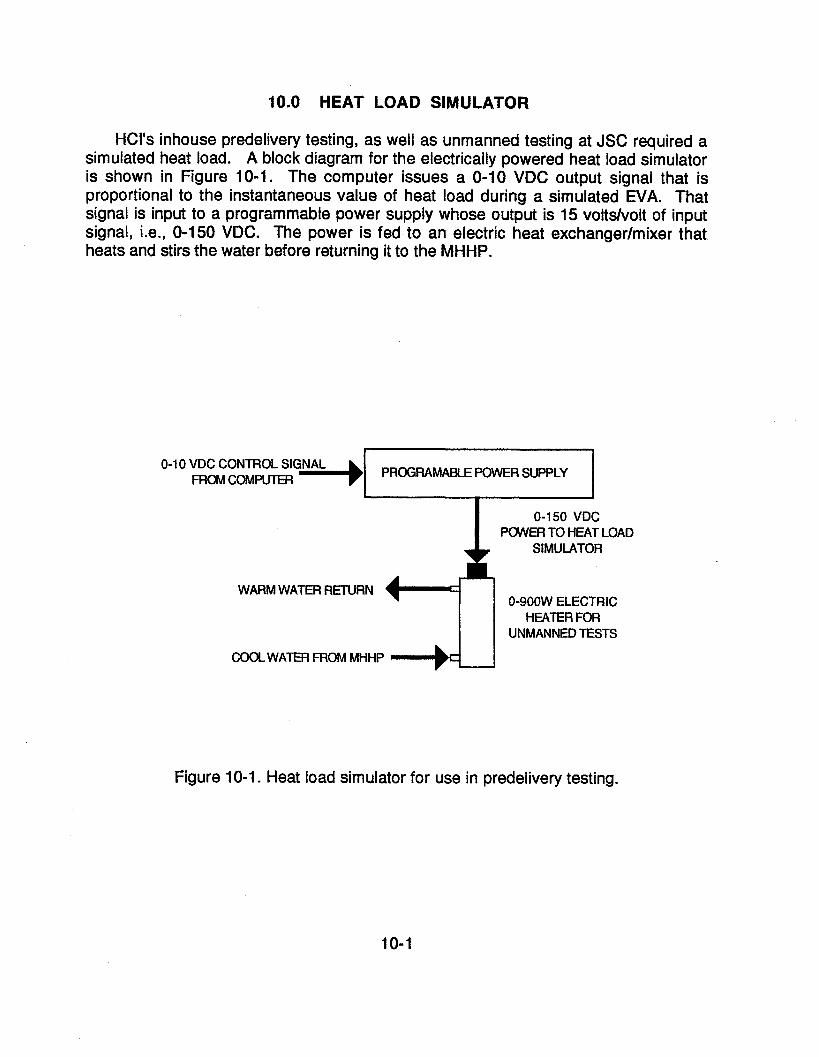
HCl's inhouse predelivery testing, as well as unmanned testing at JSC required a simulated heat load. A block diagram for the electrically powered heat load simulator is shown in Figure 10-1. The computer issues a 0-10 VDC output signal that is proportional to the instantaneous value of heat load during a simulated EVA. That signal is input to a programmable power supply whose output is 15 voltsEvolt of input signal, i.e., 0-150 VDC. The power is fed to an electric heat exchangerlmixer that heats and stirs the water before returning it to the MHHP.
0-1 0 VDC CONTROL SIGNAL Ria* -bI PROGWMABLE POWER SUPPLY
0-1 50 VDC I PWEFI TO HEAT LOAD & SIMULATOR
WARM WATER RETURN 0-900W ELECTRIC
I I HEATER FOR UNMANNED TESTS
C M X WATW FROM MHW r-bd 1
Figure 10-1. Heat load simulator for use in predelivery testing.
11.0 SAFETY
i h e heat pumping process in the MHHP results from chemical reactions between metal powders and hydrogen. Most of the hydrogen is held in the solid state, chemically bound within the powdered metals (metal hydrides). The only hydrogen gas normally present during test operations exists at low to moderate pressures in the plumbing components between the two hydride containers. Nonetheless, pressure relief valves and over-pressure switches are provided, as in any pressurized hydrogen system. The MHHP is a closed system so the only possible cause of over-pressure is overheating of the metal hydrides. This can occur from external heat sources, such as fire or intense radiation, or from run-away recharge heaters.
The normal operating conditions of the MHHP involve very low pressures, less than 100 psig. The hydride subsystem is constructed with a large factor of safety ( >lo). It is significant, for safety purposes, that the dome of the regulator is sealed. The diaphragm of the BPR is the only hydrogen-carrying component in the MHHP that is at all delicate. In the event of diaphragm failure, hydrogen will be captured in the dome which normally contains a vacuum.
Electric heating elements powered by 208 VAC are embedded in the outer shell of the box to supply heat for recharging the MHHP. During recharge periods, cooling water is supplied by a commercial 208 VAC water chiller located outside the vacuum chamber. Recharge conditions produce the highest hydrogen pressures in the MHHP, normally less than 100 psig. Any blockage of the hydrogen flow will lead to a pressure rise in hydride A in the electrically heated radiator. A pressure sensor will indicate this off-nominal condition immediately and heater power will be interrupted. The burst pressure of the aluminum hydride A containerlradiator is over 2000 psig and a pressure relief valve is set for 400 psig so a factor of safety of 5 protects the MHHP from malfunctions that might lead to over-pressure.
During manned tests, a data acquisition and control system (LESC's "DACS") will control and monitor the test conditions and maintain all parameters within acceptable limits. Safe shutdown conditions are defined for all known modes of failure (see Hazard Analysis Document). In general, Safe conditions are passively assured by simply stopping all externally applied forms of energy (heat loads, electric power, radiation, etc.) if a malfunction occurs.
Instrumentation supplied with the MHHP informs the DACS of all pressures, temperatures and flows that are of significance in defining the performance of the MHHP. This includes all data needed to identify the potential problems enumerated in the Hazard Analysis Worksheets.
Hydrogen detectors are included in the environment where MHHP testing takes place. Location of these detectors anticipates vacuum test conditions as well as atmospheric conditions. Environmental instrumentation is the responsibility of JSC
11-1
and its contractors. However HCI recommends the following detector criteria and placement:
At least one detector near the highest point in the vacuum chamber capable of detecting >0.5% H2 in air. This detector is for use when the chamber is open to the atmosphere. More sensitive detectors are available but greater sensitivity often leads to false alarms and needless disruption of work.
If the vacuum chamber is located inside another structure, a second detector of the type described above should be placed near the highest point above the vacuum chamber.
A hydrogen detector should be placed in the exhaust plumbing of the chamber's vacuum pumping system to detect hydrogen leakage during vacuum tests.
Other hydrogen safety recommendations pertinent to MHHP testing are;
I ) train all test personnel in hydrogen fire prevention and fire fighting procedures
2) exclude all ignition sources from the vacuum chamber (there are none in normal operation of the MHHP)
3) provide adequate ventilation when the chamber is open
4) vent the pumping system's exhaust to a location with unrestricted vertical clearance and no nearby structures with elevations greater than the exhaust vent
5) two hydrogen over-pressure relief valves in the MHHP should be connected to the vent stack via 0.1 50 inch minimum I.D. vent lines no longer than 20 ft.
6) if feasible, join the LN2 boil-off vent of the thermal vacuum chamber with the vacuum system's vent duct, as close as possible to the pumping system's outlet, to provide an extra measure of safety (i.e., nitrogen flood).
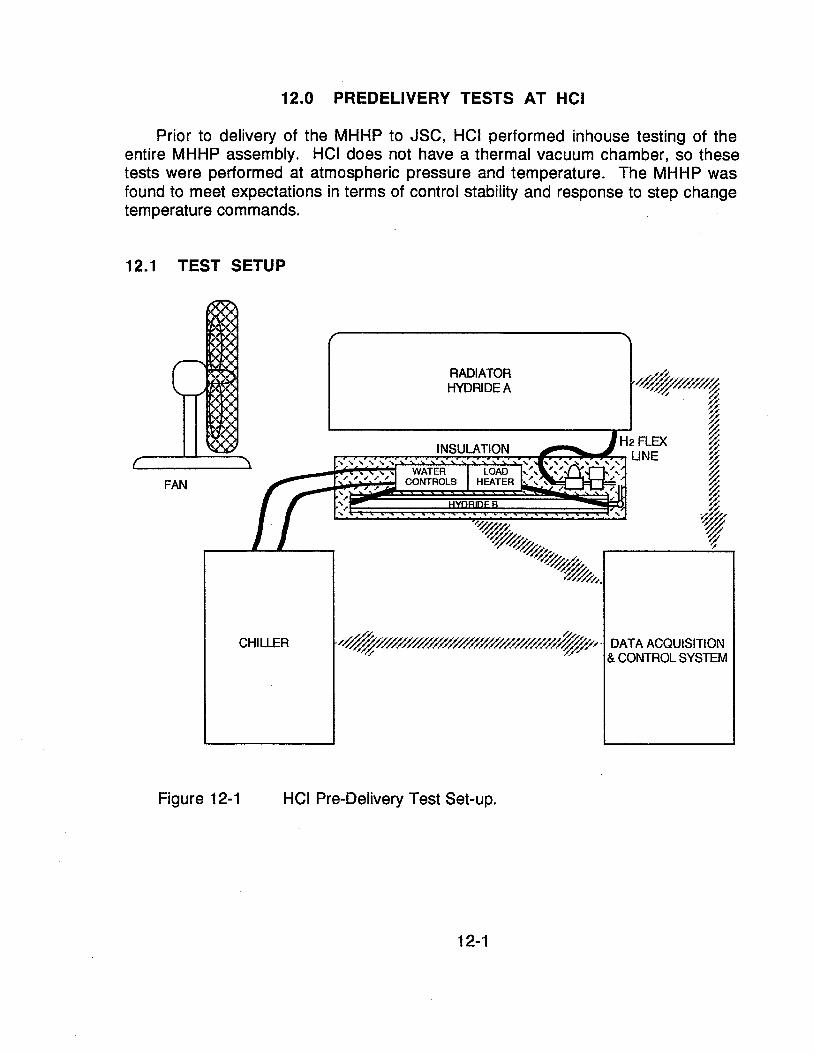
12.0 PREDELIVERY TESTS AT HCI
Prior to delivery of the MHHP to JSC, HCI performed inhouse testing of the entire MHHP assembly. HCI does not have a thermal vacuum chamber, so these tests were performed at atmospheric pressure and temperature. The MHHP was found to meet expectations in terms of control stability and response to step change temperature commands.
12.1 TEST SETUP
Figure 12-1 HCI Pre-Delivery Test Set-up.
13.0 POST-DELIVERY ATMOSPHERIC TESTS
13.1 Transportation
The MHHP with DACS and water chiller were loaded into a rented van and transported from HCI in Littleton, Colorado to JSC in Houston, Texas. Post-delivery inspection at JSC showed that no damage had occurred during transportation. A Quantum Instrument Model BT-44 flammable gas detector was passed slowly over any location where hydrogen leakage was possible due to damage during transport but no leaks were found.
13.2 Assembly, Installation and Checkout
The MHHP, DACS and water chiller were assembled at JSC in the same way as during atmospheric tests at HCI (see Figure 12.1). Several tests were conducted under automatic control by the DACS to confirm operational status. All systems functioned nominally except that the software installed in the DACS was not the latest version and contained several "bugs". It was possible to work around the "bugsn and demonstrate EVA simulations and recharge operations.
The rapid response to downward changes in temperature set point are facilitated by the Thermal Mass of Hydride B and its container. As quickly as the control valve moves to a new position, a variable amount of 40°F water is mixed with warm coolant return flow to achieve the desired comfort temperature. Upward temperature changes, within the range of the control valve, occur just as rapidly. Upward changes in comfort temperature that require complete recycle of the cooling water are not affected by the MHHP because the control valve completely stops the flow of 40°F water. Upward swings in comfort temperature with the coolant control valve in the 100% recycle position occur by accumulation of metabolic and equipment heat loads in the recycled coolant.
The MHHP is designed to minimize the thermal mass of the portion of the system that must be heated during an upward swing in comfort temperature. Reports of over cooling and long uncomfortably cold periods of thermal recovery during actual EVAs convinced HCI that minimizing the thermal inertia of the coolant loop was essential. The MHHP has only the heat load simulator, the pump, the control valve and a short length of tubing in the water loop when the valve is in the 100% recycle position. Except for the tubing, each of the parts of the water loop are heat sources.
The load simulation heater does not have the thermal inertia of a human body. Otherwise, the MHHP is identical to a flight unit. Auxiliary heat exchangers, like the onboard computer, radio, CQ absorber, condenser, etc., should be coupled directly and, if possible, passively to the Hydride B heat sink. HCl's temperature control
electronics are contained in a vacuum tight can coupled directly to Hydride B. Any heat source that can operate between 40°F and 80°F should be coupled in this passive way to the heat sink rather than in series with the water loop.
13.3 Post-Delivery Adjustments
Additional HCI staff traveled to JSC to update the software and install some insulation that was purposefully omitted during atmospheric tests due to condensation of atmospheric water. An additional modification, requested by JSC, included the installation of an additional analog input channel to read a shunt-type ammeter. This was necessary because the Sorenson DC power supply for the load simulation heater did not have a voltage signal out.
14.0 REVIEW OF VACUUM CHAMBER TEST DATA
JSC and Lockheed test personnel are to be commended on the thoroughness and quality of the thermal vacuum chamber testing of the MHHP. The basic principles of operation of the MHHP are very simple, but a fully instrumented experiment controlled and monitored by a remote computer is not. Neither is the operation of a thermal vacuum chamber. Despite difficulties encountered with the test article and its instrumentation, the test crew acquired an extensive set of test data from which a great deal can be learned and applied in future work.
The following discussion of the test results will focus first on what went right during the tests. Then the problems encountered will be discussed along with the causes that are apparent from the test data and from post test analysis of the equipment at HCI.
14.1 Sucessful Test Results
The top level viewpoint of the test work is very positive. A thorough and safe test program was carried out with no major component failures. The equipment, previously developed and tested only in atmospheric conditions, functioned properly in a vacuum chamber. Aside from some electric heater connectors that arced and failed in vacuum, the remainder of the equipment functioned well. A water-jacketed coolant pump, a coolant temperature control valve, an electric load simulation heaterlheat exchanger and an electronic temperature controller were designed, built from components at HCI and sealed in vacuum tight enclosures. The equipment passed predelivery leak inspections but, until it performed in a vacuum chamber without overheating or arcing at connectors, confidence in the equipment was guarded.
Although the coolant temperature control data are rather noisy, it is clear that the onboard electronics and coolant control valve held tight control of coolant supply temperature, just as in HCl's predelivery testing and atmospheric tests at JSC. The vacuum-jacketed automatic water valves that switched the coolant plumbing configuration from "EVA" to "REGENw worked as required. These valves were necessary to permit EVA simulations and regeneration events without opening the vacuum chamber.
The group of temperature sensors in the cool hydride module (B) showed the progressive consumption of the MHHP's heat sink capacity during the course of an EVA. This method of monitoring reserve cooling capacity can be carried forward to other types of hydride coolers. The radiator temperature sensors also performed as designed and pointed out a couple of problems that would have been difficult to diagnose without them.
14.2 Problems Encountered
Although the performance of the MHHP met expectations qualitatively, there were some shortcomings in terms of total cooling capacity and excessive radiator temperatures. Also a noisy temperature instrument in the coolant supply line failed to accurately indicate coolant supply temperature. Since the coolant supply temperature is a major performance criterion of the project, high quality temperature data at that location is particularly important. Erratic temperature data at this point also led to erratic heat flow calculations.
Failure of 3 of the 36 heaters in the radiator panels occurred due to arcing at the point where the 208 VAC leads entered the heater sheath. Other failures included accidental destruction of the AID converters and multiplexer boards due to a wiring error, erratic operation of the water flow meters supplied by HCI. The backpressure regulator also showed some nonideal flow dependence.
Each of the problems mentioned above is discussed in more detail below.
14.2.1 Shortfall in Cumulative Cooling Capacity
The most significant deficiency noted in the test data is an apparent lack of cumulative cooling capacity. The 30679 grams of hydride B have a capacity for absorbing 3935 Btu during the course of an EVA. The test results show heat sink capacities in the neighborhood of only 2500 Btu. The reasons for this are apparent from the test data and from post test analysis of the equipment at HCI. The reasons include overcharging with hydrogen, heater failures and incomplete regeneration.
The equipment was returned to HCI containing 32.5 psia of hydrogen pressure at 68°F. This is on the absorption plateau of hydride B, indicating that the MHHP contained too much hydrogen. As delivered, the pressure in the MHHP was about 20 psia. This pressure is between the room temperature plateaux of hydrides A and B, indicating that hydride A is fully charged and hydride B is depleted. Figure 14.1 illustrates the difference between the proper hydrogen charge and the way the equipment was returned.
Further evidence of overcharging is apparent at the end of each test. If hydride B had been completely discharged during the course of a test, the system pressure would fall off the desorption plateau toward the end of the test. At the end of every test the pressure rose, indicating that hydride A was saturated and that hydride B was not depleted.
To understand the consequences of overcharging the MHHP, it is only necessary to realize what would happen if both hydrides were completely saturated. The MHHP operates by transferring hydrogen from one hydride to the other. The MHHP is a closed system. If both hydrides are saturated there can be no transfer. The
14-2
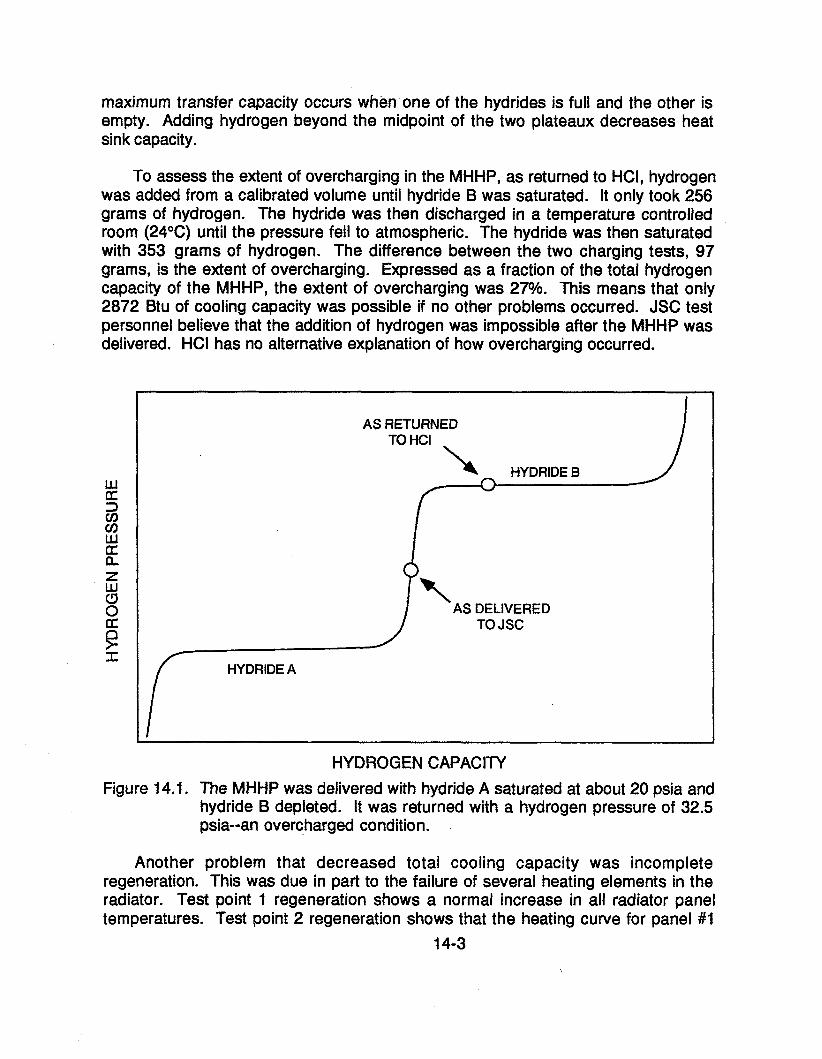
maximum transfer capacity occurs when one of the hydrides is full and the other is empty. Adding hydrogen beyond the midpoint of the two plateaux decreases heat sink capacity.
To assess the extent of overcharging in the MHHP, as returned to HCI, hydrogen was added from a calibrated volume until hydride B was saturated. It only took 256 grams of hydrogen. The hydride was then discharged in a temperature controlled room (24OC) until the pressure fell to atmospheric. The hydride was then saturated with 353 grams of hydrogen. The difference between the two charging tests, 97 grams, is the extent of overcharging. Expressed as a fraction of the total hydrogen capacity of the MHHP, the extent of overcharging was 27%. This means that only 2872 Btu of cooling capacity was possible if no other problems occurred. JSC test personnel believe that the addition of hydrogen was impossible after the MHHP was delivered. HCI has no alternative explanation of how overcharging occurred.
AS RETURNED TO HCI
AS DELIVERED
HYDRIDE A
HYDROGEN CAPACITY
Figure 14.1. The MHHP was delivered with hydride A saturated at about 20 psia and hydride I3 depleted. It was returned with a hydrogen pressure of 32.5 psia--an overcharged condition.
Another problem that decreased total cooling capacity was incomplete regeneration. This was due in part to the failure of several heating elements in the radiator. Test point I regeneration shows a normal increase in all radiator panel temperatures. Test point 2 regeneration shows that the heating curve for panel # I
14-3
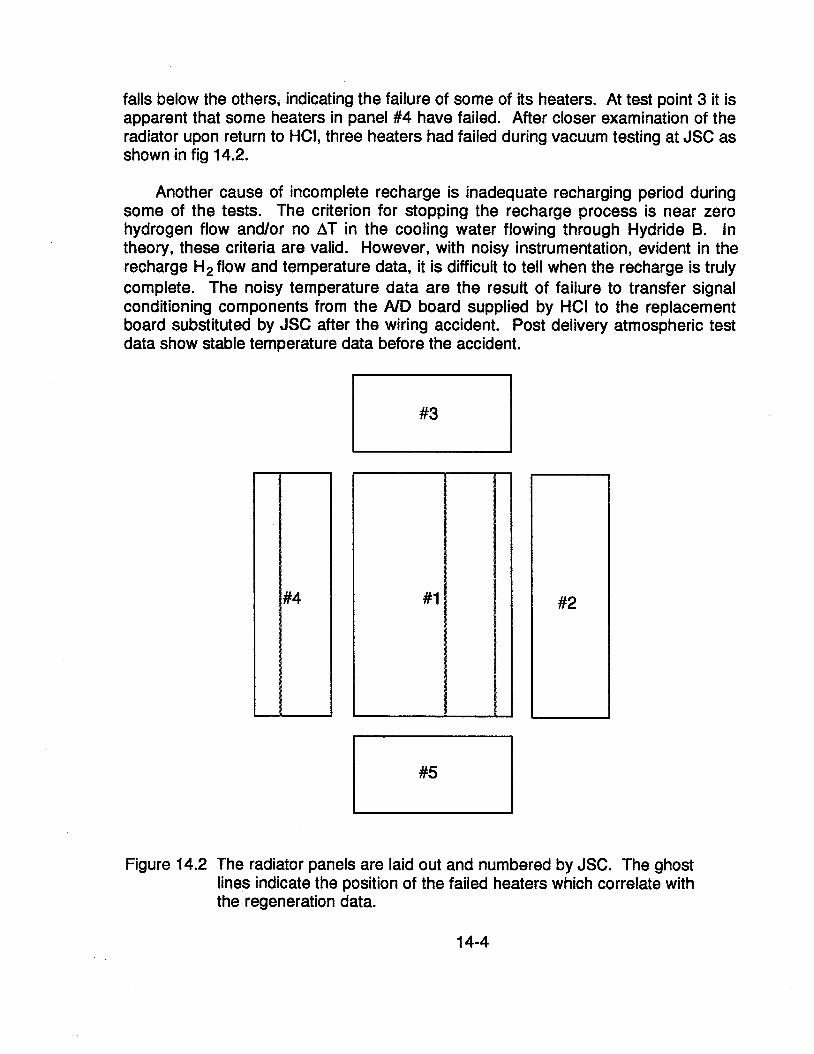
falls below the others, indicating the failure of some of its heaters. At test point 3 it is apparent that some heaters in panel #4 have failed. After closer examination of the radiator upon return to HCI, three heaters had failed during vacuum testing at JSC as shown in fig 14.2.
Another cause of incomplete recharge is inadequate recharging period during some of the tests. The criterion for stopping the recharge process is near zero hydrogen flow andlor no AT in the cooling water flowing through Hydride B. in theory, these criteria are valid. However, with noisy instrumentation, evident in the recharge H p flow and temperature data, it is difficult to tell when the recharge is truly complete. The noisy temperature data are the result of failure to transfer signal conditioning components from the AID board supplied by HCI to the replacement board substituted by JSC after the wiring accident. Post delivery atmospheric test data show stable temperature data before the accident.
Figure 14.2 The radiator panels are laid out and numbered by JSC. The ghost lines indicate the position of the failed heaters which correlate with the regeneration data.
After the heaters failed, some of the radiator panels required nearly an hour to reach a temperature plateau. For that reason, whatever limited amount of regeneration that was possible with the disabled radiator panel could not have been accomplished sooner. Regeneration periods of as little as 30 minutes were used periodically throughout the test schedule. A test imediately following a short regeneration period would necessarily result in short capacity.
A reasonable work-around for the failed heaters might have been to use the IR lamps to heat the cooler radiator panels closer to the design regeneration temperature.
14.2.2 Instrumentation Noise
During inhouse checkout of the MHHP at HCI several sources of instrument noise were identified and filtered out prior to delivery at JSC. The lnterpoint DCIDC power supply in the temperature control circuit is a source of intense high frequency noise. One lnterpoint power supply failed in service for no apparent reason. A spare lnterpoint power supply also failed on the shelf after little more than a year. lnterpoint felt no obligation to replace the failed spare, even though it had never been used. Because of the noise problem, the lack of reliability and the warrantee policies of Interpoint, this component will be eliminated from future PLSS equipment supplied by HCI. Another source of noise identified in pre delivery tests was the 28 VDC square wave frequency modulation pulses fed from a bank of MOSFETs to the coolant control valve. As always, the environment was identified as an additional source of instrument noise. The vacuum chamber test environment may have introduced new sources of noise that were not anticipated in the design of the filters at HCI.
Since nothing in the MHHP depends on high frequency response, it was relatively easy to filter out high frequency noise. Filters were installed at various locations throughout the system during checkout. LC and RC dampers were installed in the temperature controller to quiet the noisy lnterpoint power supply. A bank of RC filters was built up on a small circuit board installed at the A/D interface. These filters were designed to stabilize the signals from the AD590 temperature sensors on their way into the EXP16 multiplexer. Other filters were built onto the DAS8 board at the analog input terminals. The only signal that could not be cleaned up at HCI was the coolant control valve position pot voltage. The problem was traced to the variable resistance of a film of silicon oil installed in the coolant control valve motor for a damping fluid. This could not be remedied without changing the design of the valve.
The filters worked well during pre delivery tests at HCI and during post delivery atmospheric tests at JSC. Unfortunately, there was a wiring accident during installation of the current shunt into the DACS system. This accident destroyed all of
14-5
the AID boards and multiplexers. During replacement with new boards, some of the filters were left out.
The circuit board with the bank of AD590 filters was transferred to the new board correctly. However, several filters that were installed directly onto the DAS8 AID board were not transferred to the new board. This includes the filters for the hydrogen flowmeter and, most important of all, the coolant supply temperature input from an AD590 directly to Channel #O. This is the probable cause of the noisy coolant supply temperature signal and hydrogen flowmeter signal.
14.2.3 Excessive Radiator Temperatures
There were significant uncertainties in how this previously untried heat pumping system would behave in a thermal vacuum chamber. At every point in the design process where uncertainties were encountered, HCI opted to err on the side of a design decision that gave maximum assurance of good performance. It is easier to explain why something is slightly out of specifications than to explain why something almost worked! NASA's touch temperature limit is well below the maximum radiator temperatures observed during the test work.
The selection of alloys was one of those judgement calls that was affected by schedule, the availability of alloys and HCl's policy to accept overperformance to avoid the risk of failure. Major delays and difficulties were experienced in procuring custom melted alloy A from outside sources. Ergenics had enough mischmetal- nickel-aluminum alloy on the shelf to complete the MHHP. The alloy had a higher pressure-temperature curve than HCI might have specified if there had been no procurement problems with alloy A. Under the circumstances, it was a good decision. Further delays were avoided, the alloy was affordable and the MHHP worked well.
Future use of metal hydride heat pumps for EVA may employ a more stable hydride B formulation to get the radiator temperatures down. The problem may also be dealt with procedurally. A short period of relaxation prior to returning to the air lock will drop the radiator temperature to the touch temperature limit. Higher radiator temperatures during EVA present no unusual risks, since so many other surfaces outside the airlock may reach uncomfortably high temperatures. The high radiator temperature assures better performance in hot environments.
14.3 Recommendations for Future Testing
Many of the problems encountered during the vacuum chamber tests could have been eliminated or made less difficult through closer communication. The best circumstances for future test work should involve HCI, JSC and contractors working together to set up the tests, trouble shoot the equipment and instrumentation and diagnose early test results. This was the case with the post delivery atmospheric tests at JSC. HCI, JSC and LESC worked together effectively to deal with the installation requirements, startup problems and software problems.
The basic MHHP principles are very simple. An extensive set of instrumentation, the interaction of two computers with data acquisition and control systems, and a simulated space environment are not simple. Specialists in each of these areas must work together to maximize the information gained at the conclusion of years of work by everyone involved.