Embed Size (px)
Citation preview

SANDIA REPORT SAND2006-7014 Unlimited Release Printed November 2006
Erbium Hydride Decomposition Kinetics Robert M. Ferrizz Prepared by Sandia National Laboratories Albuquerque, New Mexico 87185 and Livermore, California 94550 Sandia is a multiprogram laboratory operated by Sandia Corporation, a Lockheed Martin Company, for the United States Department of Energy’s National Nuclear Security Administration under Contract DE-AC04-94AL85000. Approved for public release; further dissemination unlimited.

2
Issued by Sandia National Laboratories, operated for the United States Department of Energy by Sandia Corporation. NOTICE: This report was prepared as an account of work sponsored by an agency of the United States Government. Neither the United States Government, nor any agency thereof, nor any of their employees, nor any of their contractors, subcontractors, or their employees, make any warranty, express or implied, or assume any legal liability or responsibility for the accuracy, completeness, or usefulness of any information, apparatus, product, or process disclosed, or represent that its use would not infringe privately owned rights. Reference herein to any specific commercial product, process, or service by trade name, trademark, manufacturer, or otherwise, does not necessarily constitute or imply its endorsement, recommendation, or favoring by the United States Government, any agency thereof, or any of their contractors or subcontractors. The views and opinions expressed herein do not necessarily state or reflect those of the United States Government, any agency thereof, or any of their contractors. Printed in the United States of America. This report has been reproduced directly from the best available copy. Available to DOE and DOE contractors from U.S. Department of Energy Office of Scientific and Technical Information P.O. Box 62 Oak Ridge, TN 37831 Telephone: (865) 576-8401 Facsimile: (865) 576-5728 E-Mail: [email protected] Online ordering: http://www.osti.gov/bridge Available to the public from U.S. Department of Commerce National Technical Information Service 5285 Port Royal Rd. Springfield, VA 22161 Telephone: (800) 553-6847 Facsimile: (703) 605-6900 E-Mail: [email protected] Online order: http://www.ntis.gov/help/ordermethods.asp?loc=7-4-0#online

3
SAND2006-7014 Unlimited Release
Printed November 2006
Erbium Hydride Decomposition Kinetics
Robert M. Ferrizz Neutron Generator Design Science and Engineering Department
Sandia National Laboratories P.O. Box 5800
Albuquerque, New Mexico 87185-MS0867
Abstract Thermal desorption spectroscopy (TDS) is used to study the decomposition kinetics of erbium hydride thin films. The TDS results presented in this report are analyzed quantitatively using Redhead’s method to yield kinetic parameters (EA~54.2 kcal/mol), which are then utilized to predict hydrogen outgassing in vacuum for a variety of thermal treatments. Interestingly, it was found that the activation energy for desorption can vary by more than 7 kcal/mol (0.30 eV) for seemingly similar samples. In addition, small amounts of less-stable hydrogen were observed for all erbium dihydride films. A detailed explanation of several approaches for analyzing thermal desorption spectra to obtain kinetic information is included as an appendix.

4
Intentionally Left Blank
5
Contents Introduction .........................................................................................................................7 Approach .............................................................................................................................7 Experimental .......................................................................................................................8 TDS Results ........................................................................................................................9 Discussion .........................................................................................................................11 pre-exponential factor ...........................................................................................11 reaction order .......................................................................................................12 outgassing predictions ..........................................................................................16 pressure considerations ........................................................................................18 wildcard: small, low temperature peak ................................................................20 Conclusions .......................................................................................................................21 Acknowledgements ...........................................................................................................22 Appendix A: determining kinetic parameters from thermal desorption spectra ...............23 Appendix B: thermal desorption system – technical description ......................................27 Appendix C: comments on potential energy diagrams .....................................................31 Appendix D: diffusion ......................................................................................................35 References .........................................................................................................................37

6
Intentionally Left Blank
7
Introduction Rare earth films are used as hydrogen occluders for various scientific and industrial applications. Hydrogen desorption kinetics are important for understanding how processing steps effect the final state of the hydride film. Kinetics predicts the rate at which thermodynamic equilibrium is approached, and is often the controlling mechanism for determining the actual film composition. For example, kinetic limitations can result in “quasi-stable” hydride phases during occluder film loading1. Likewise, kinetics directly impacts the amount of hydrogen remaining after thermal vacuum processing. This impact may be slight or negligible, provided the appropriate materials and processing conditions are chosen. Or, this impact may be critical if the kinetic barrier to decomposition is too low. Thermal desorption spectroscopy (TDS) is an experimental tool ideally suited for studying desorption kinetics. This report utilizes TDS to investigate the decomposition kinetics of erbium hydride films. Emphasis is placed on erbium hydride decomposition with respect to thermal vacuum processing. Approach Thermal desorption spectroscopy (TDS), also known as temperature programmed desorption (TPD), has been used as a tool to study the kinetics of surface processes since the early 1960’s, when Redhead published his analysis of the desorption process assuming a simple power law2.
nAD
AD k
dtd
r θθ=−= (1)
Equation 1 states that the rate of desorption (rD) of species A is a function of the surface coverage (θA) and a rate constant (kD) for desorption. The rate constant varies exponentially with temperature according to the Arrhenius expression (see equation 2).
⎟⎠⎞
⎜⎝⎛ −
=kTEkk A
oD exp (2)
Redhead derived from equations 1 and 2, after making a few reasonable assumptions, a method to analyze a thermal desorption (TD) spectrum to obtain EA, the activation energy for desorption, which is the key parameter for describing reaction kinetics. There are many published reports that utilize Redhead’s method and other, more complicated methods to analyze desorption spectra to obtain kinetic parameters. A detailed explanation and comparison of these procedures has been published by Masel3 and de Jong et al.4. Hydride decomposition is one of the most complex systems for kinetic analysis, due to the many steps involved, any of which may ultimately be rate-limiting. Appendix A details several methods for quantitative analysis of TD spectra to determine reaction kinetics.
8
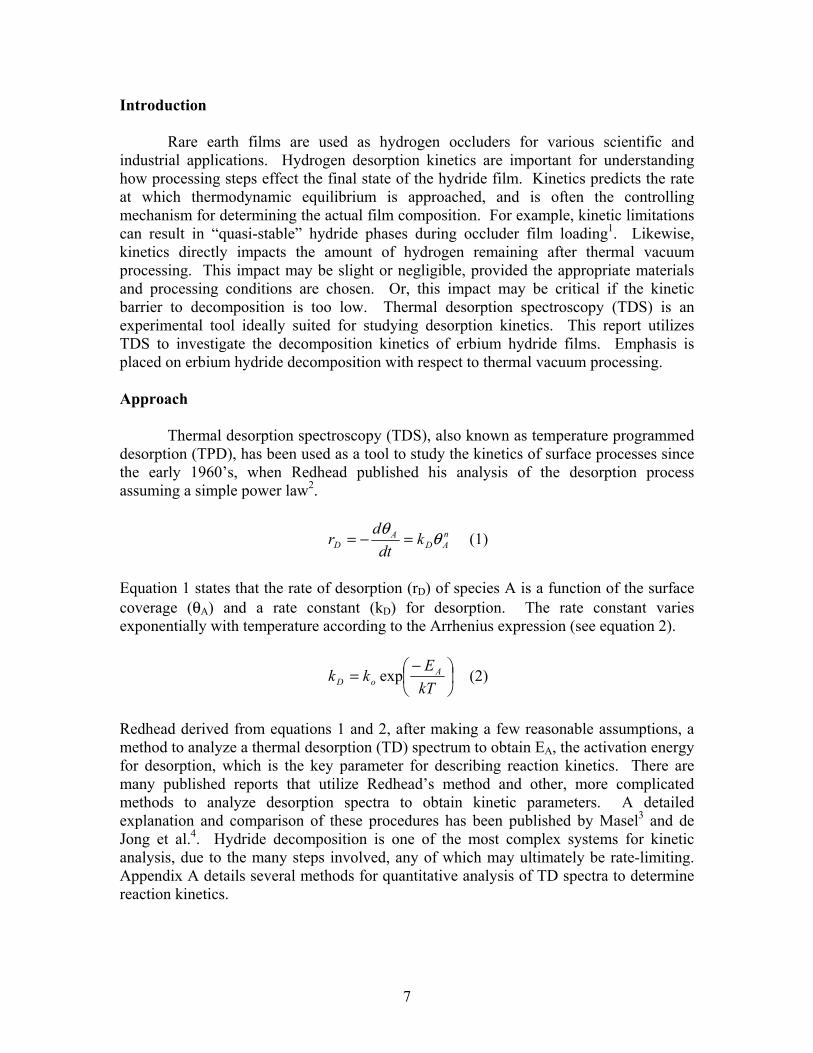
In this report, hydride desorption kinetics are treated empirically, with the goal of accurately describing the experimentally observed decomposition behavior. A single rate equation is utilized to quantitatively analyze the desorption data. This approach assumes that a single reaction step is rate-limiting, and is a common approach found in the literature5-8. Ideally, kinetic analysis would encompass a detailed understanding of all mechanistic steps inherent in a particular process. As discussed in Appendix B, this is a significant undertaking, requiring a large array of well-defined samples to fully explore, and is beyond the scope of this study. Experimental A TDS experiment requires a sample heating scheme to linearly ramp the sample temperature, and a detector, ideally a mass spectrometer, to measure the desorption products. The resultant TD (or TPD) spectrum is a plot of the desorption rate (as recorded by the detector) versus sample temperature. Appendix C gives a full description of the thermal desorption system used to generate the experimental results presented in this report. Figure 1 illustrates a typical TD spectrum, and also includes representative plots of the surface coverage (i.e. fractional coverage) and the rate constant over the course of the TDS experiment.
Figure 1: Simulated TDS spectrum3. Generally, the surface coverage of species A is high at the beginning of the temperature ramp, and the coverage decreases to zero after desorption has concluded. The rate constant increases exponentially with temperature, as described by the Arrhenius expression. Since the rate of desorption is a function of both coverage and the rate constant, a maximum in rate will occur where the rate constant is high, but there is still a significant amount of species A on the surface. In Redhead’s analysis, the temperature of the peak in desorption rate is the critical parameter in determining the activation energy for desorption.
9
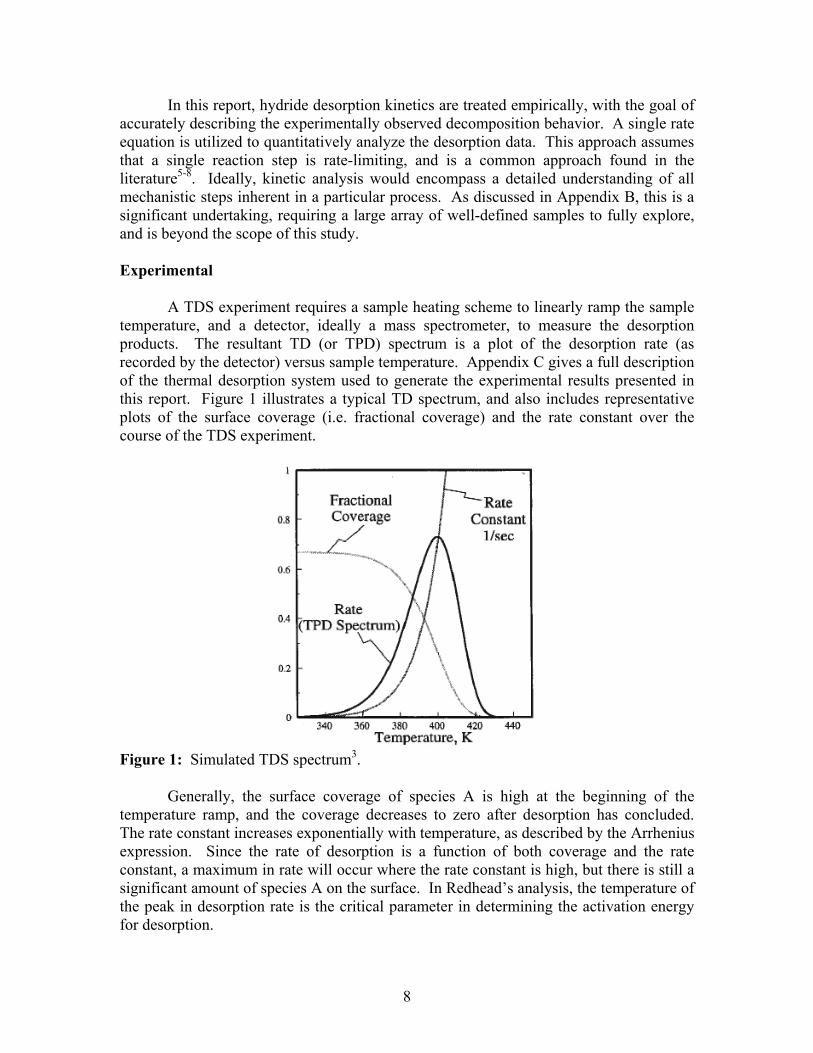
TDS results are presented for four similar erbium hydride films, referred to herein as “targets”. A heating rate of 0.5 C/s was used for each sample. Targets A and B were both loaded in a pressure-composition-temperature (PCT) apparatus at 450 C and 500 Torr D2 for 1 hour, after activation at 450 C for 1 hour. According to Lundin’s phase diagram9,10, these conditions should produce β-phase erbium hydride films with a gas-to-metal (G:M) ratio near 2.0. X-ray diffraction (XRD) of samples loaded under similar conditions, and the subjective “color criteria” (blue) both indicate that these samples consisted largely of ErD2. Unfortunately, the sample history for Targets C and D is unknown. What is known is that both samples were intended to be dihydrides with a G:M near 2.0. TDS Results Target A was cut into four roughly equal sections using “tin snips,” and all four target quarters were thermally desorbed in the TDS system. Since the four samples were prepared from the same target, it is expected that the desorption kinetics will be nearly identical for each sample, and any differences can be attributed to uncertainty inherent to the experimental procedure. A representative D2 desorption spectrum (target quarter, run 4) is presented in Figure 2. In addition to D2, small amounts of H2 and HD desorption (not shown) were also detected. The amount of protium “impurity” is not a focus of this report, and inconsequential with respect to desorption kinetics.
100 200 300 400 500 600 700Temperature (C)
×25
Figure 2: D2 thermal desorption spectrum (Target A, run 4). In Figure 2, the primary D2 desorption peak is observed at roughly 540 C. Additionally, a smaller desorption peak is clearly resolved near 350 C. Qualitatively, the large D2 desorption peak represents the thermal decomposition of erbium dihydride. The origin of the smaller desorption peak at lower temperature is unclear at present. Table 1 presents the peak maxima for all four target quarters, and a statistical analysis to determine the experimental uncertainty.

10
Table 1: Desorption peak maximum temperatures (TP) and EA for Target A quarters.
Primary Peak Small Peak Run # TP (C) TP (C)
1 542 345 2 540 350 3 510 322 4 545 362
Average 534.1 344.6 Median 540.9 347.7
Standard Deviation (C) 16.1 16.9 95% Confidence (C) 15.8 16.6
EA (kcal/mol) 54.2 41.2 The analysis yields a temperature of 534±16 C for the maximum in desorption rate due to hydride decomposition. Using Redhead’s method, this value was then used to solve for the activation energy for desorption. This result is also presented in Table 1. The initial estimate for EA is obtained assuming that ln(EA/kTP) equals 3.64. Redhead’s equation is then solved iteratively to yield the final result. The pre-exponential factor, ko, is assumed to be 1013 s-1 for these calculations, and the reaction is assumed to be 1st order. Note that a 2nd order reaction with an initial coverage equal to one will yield the same results. Redhead analysis for Target A yields an activation energy of 54.2 ± 1.1 kcal/mol for the primary desorption peak. Converted to other common energy units, EA equals 227 kJ/mol or 2.35 eV. This value is consistent with the value of 61 kcal/mol reported by Beavis11 for tritium desorption from 50 days old erbium tritide films. Likewise, this value is very similar to the differential heat of reaction for the phase change of erbium dihydride to an erbium-hydrogen solid solution, which is reported9,10 to be 53.0 ± 0.2 kcal/mol. Target B was cut into smaller fragments, three of which were thermally desorbed at 0.5 C/s in the TDS system. Targets C and D were desorbed intact. Shown in Table 2 are the (average) peak maximum desorption temperatures for hydride decomposition for all four targets, and the corresponding activation energies for desorption as determined using Redhead’s method. Table 2: Summary of TP and EA for Targets A, B, C, and D.
Target TP (C) EA (kcal/mol) A 534 ± 16.1 54.2 B 558 ± 15.5 55.9 C 638 61.4 D 539 54.5
The desorption peak maximum temperatures (TP) for Targets A and D are nearly identical, and TP for Target B is in relatively close agreement, as well. However, note that TP for Target C is 638 C, nearly 100 C more than that observed for the other samples. This is a significant difference in decomposition kinetics a seemingly identical sample.
11
In other hydride systems6,12-23, the observed rate of hydrogen desorption is a often a complex function of film structure and composition, depending on factors such as the surface oxide layer, grain size, stress, and stoichiometry. It is likely that one or more such effects are responsible for the stability of the hydride for Target C. A comprehensive investigation of the factors that control the thermal decomposition of erbium hydride is underway, and will be the topic of future reports. It is conceivable that the differing results for Target C are due to experimental error. However, the small, low temperature desorption peak for Target C is observed near 375 C, similar to all other samples. Also, consider that the standard deviation of TP for Targets A and B is approximately 15 C, much smaller than the observed 100 C difference. It is unlikely that a gross experimental error is the reason for the difference in hydride decomposition kinetics for Target C. Discussion It is relatively straight-forward to determine the expected final stoichiometry (i.e. gas:metal ratio) of an occluder film for an assortment of thermal treatments in vacuum. The rate of desorption is defined in Equation 1. Solving this differential equation for first order desorption yields Equation 3, while second order desorption yields Equation 4.
( )tkDo −= expθθ (3)
tkDo
o
θθθ
+=
1 (4)
Both of these equations express concentration as a function of time. Using these relationships, it is possible to predict outgassing rates, assuming the kinetic parameters for desorption are known. Activation energy was calculated using Redhead’s method, as detailed above. The pre-exponential factor and reaction order are discussed below. Pre-exponential Factor For gas phase and surface reactions, empirical evidence and transition state theory both show that ko typically equals 1013 s-1 within an order of magnitude or two. Theoretically, this result is derived from the fact that kT/hP is approximately equal to 1013 s-1, while the ratio of the partition functions (q‡ / qR; where ‡ ≡ transition state and R ≡ reactants) is generally equal to unity (but can vary between 10-2 and 102) and the transmission coefficient pre-factor varies from 10-3 to 103. The rate constant pre-exponential factor (ko) is a function of these three terms, and it is difficult to predict exactly what the result will be for a given reaction. A general rule of thumb is that, if the system gains in degrees of freedom approaching the transition state, then ko will be > 1013 s-1. Conversely, if the system loses degrees of freedom approaching the transition state, then ko will be < 1013 s-1. Experimentally, ko is known to vary between 1010 and 1016 s-1. Bimolecular surface reactions involving hydrogen recombination on metal surfaces typically possess ko values ranging from 1012 s-1 for Pd and Pt to 1014.5 s-1 for Ru. (For further details, see Masel3.) Recently, Xiong et al24 applied the Kissinger method (i.e.
12
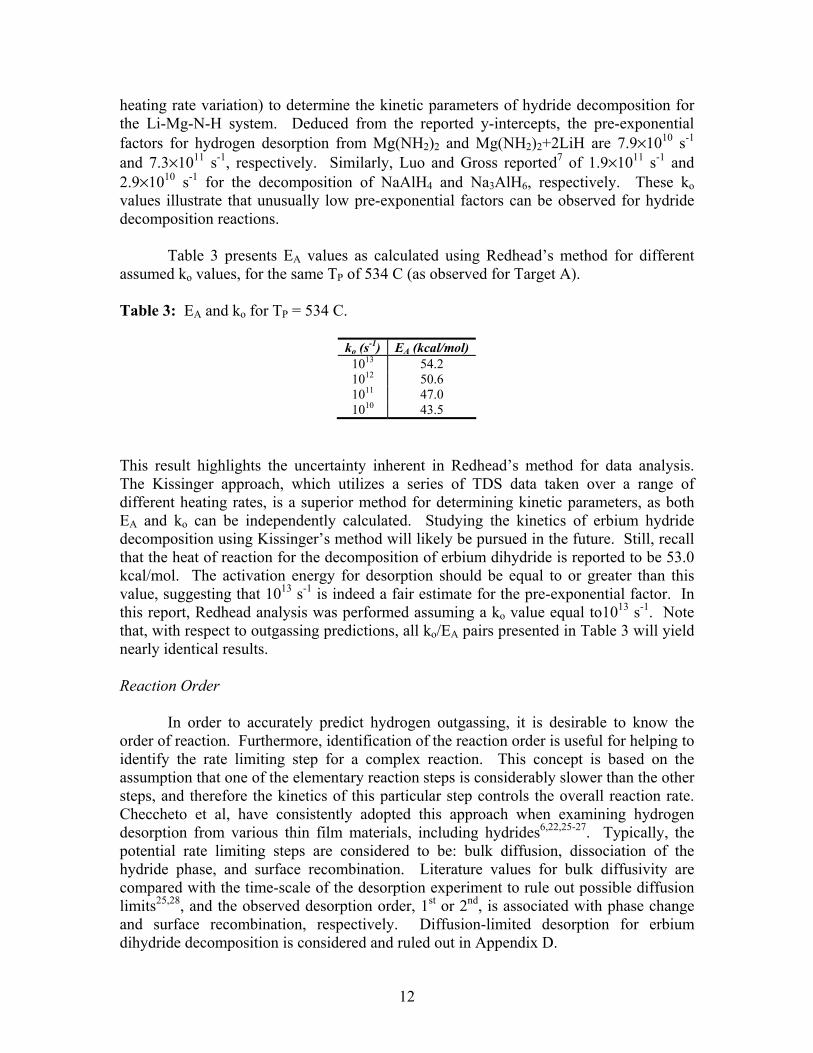
heating rate variation) to determine the kinetic parameters of hydride decomposition for the Li-Mg-N-H system. Deduced from the reported y-intercepts, the pre-exponential factors for hydrogen desorption from Mg(NH2)2 and Mg(NH2)2+2LiH are 7.9×10¹⁰ s-1 and 7.3×10¹¹ s-1, respectively. Similarly, Luo and Gross reported7 of 1.9×10¹¹ s-1 and 2.9×10¹⁰ s-1 for the decomposition of NaAlH4 and Na3AlH6, respectively. These ko values illustrate that unusually low pre-exponential factors can be observed for hydride decomposition reactions. Table 3 presents EA values as calculated using Redhead’s method for different assumed ko values, for the same TP of 534 C (as observed for Target A). Table 3: EA and ko for TP = 534 C.
ko (s-1) EA (kcal/mol) 1013 54.2 1012 50.6 1011 47.0 1010 43.5
This result highlights the uncertainty inherent in Redhead’s method for data analysis. The Kissinger approach, which utilizes a series of TDS data taken over a range of different heating rates, is a superior method for determining kinetic parameters, as both EA and ko can be independently calculated. Studying the kinetics of erbium hydride decomposition using Kissinger’s method will likely be pursued in the future. Still, recall that the heat of reaction for the decomposition of erbium dihydride is reported to be 53.0 kcal/mol. The activation energy for desorption should be equal to or greater than this value, suggesting that 1013 s-1 is indeed a fair estimate for the pre-exponential factor. In this report, Redhead analysis was performed assuming a ko value equal to1013 s-1. Note that, with respect to outgassing predictions, all ko/EA pairs presented in Table 3 will yield nearly identical results. Reaction Order In order to accurately predict hydrogen outgassing, it is desirable to know the order of reaction. Furthermore, identification of the reaction order is useful for helping to identify the rate limiting step for a complex reaction. This concept is based on the assumption that one of the elementary reaction steps is considerably slower than the other steps, and therefore the kinetics of this particular step controls the overall reaction rate. Checcheto et al, have consistently adopted this approach when examining hydrogen desorption from various thin film materials, including hydrides6,22,25-27. Typically, the potential rate limiting steps are considered to be: bulk diffusion, dissociation of the hydride phase, and surface recombination. Literature values for bulk diffusivity are compared with the time-scale of the desorption experiment to rule out possible diffusion limits25,28, and the observed desorption order, 1st or 2nd, is associated with phase change and surface recombination, respectively. Diffusion-limited desorption for erbium dihydride decomposition is considered and ruled out in Appendix D.
13
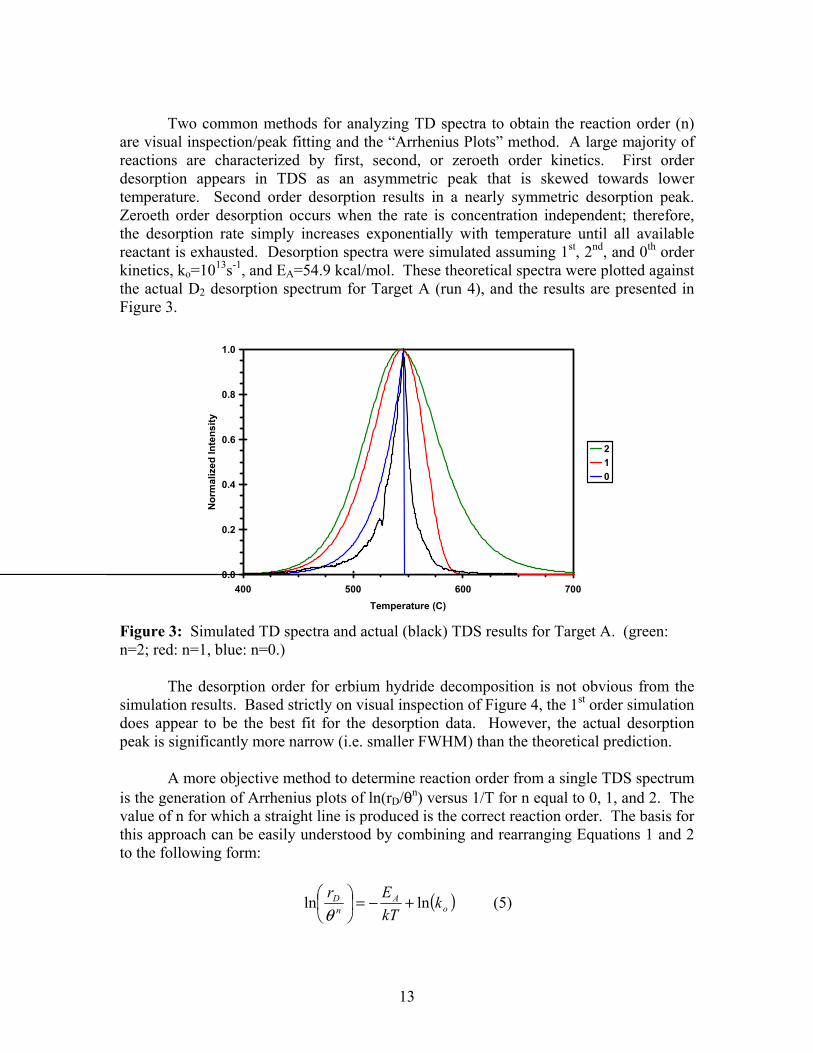
Two common methods for analyzing TD spectra to obtain the reaction order (n) are visual inspection/peak fitting and the “Arrhenius Plots” method. A large majority of reactions are characterized by first, second, or zeroeth order kinetics. First order desorption appears in TDS as an asymmetric peak that is skewed towards lower temperature. Second order desorption results in a nearly symmetric desorption peak. Zeroeth order desorption occurs when the rate is concentration independent; therefore, the desorption rate simply increases exponentially with temperature until all available reactant is exhausted. Desorption spectra were simulated assuming 1st, 2nd, and 0th order kinetics, ko=1013s-1, and EA=54.9 kcal/mol. These theoretical spectra were plotted against the actual D2 desorption spectrum for Target A (run 4), and the results are presented in Figure 3.
0.0
0.2
0.4
0.6
0.8
1.0
400 500 600 700Temperature (C)
Nor
mal
ized
Inte
nsity
210
Figure 3: Simulated TD spectra and actual (black) TDS results for Target A. (green: n=2; red: n=1, blue: n=0.) The desorption order for erbium hydride decomposition is not obvious from the simulation results. Based strictly on visual inspection of Figure 4, the 1st order simulation does appear to be the best fit for the desorption data. However, the actual desorption peak is significantly more narrow (i.e. smaller FWHM) than the theoretical prediction. A more objective method to determine reaction order from a single TDS spectrum is the generation of Arrhenius plots of ln(rD/θn) versus 1/T for n equal to 0, 1, and 2. The value of n for which a straight line is produced is the correct reaction order. The basis for this approach can be easily understood by combining and rearranging Equations 1 and 2 to the following form:
( )oA
nD k
kTEr lnln +−=⎟
⎠⎞
⎜⎝⎛θ
(5)
14
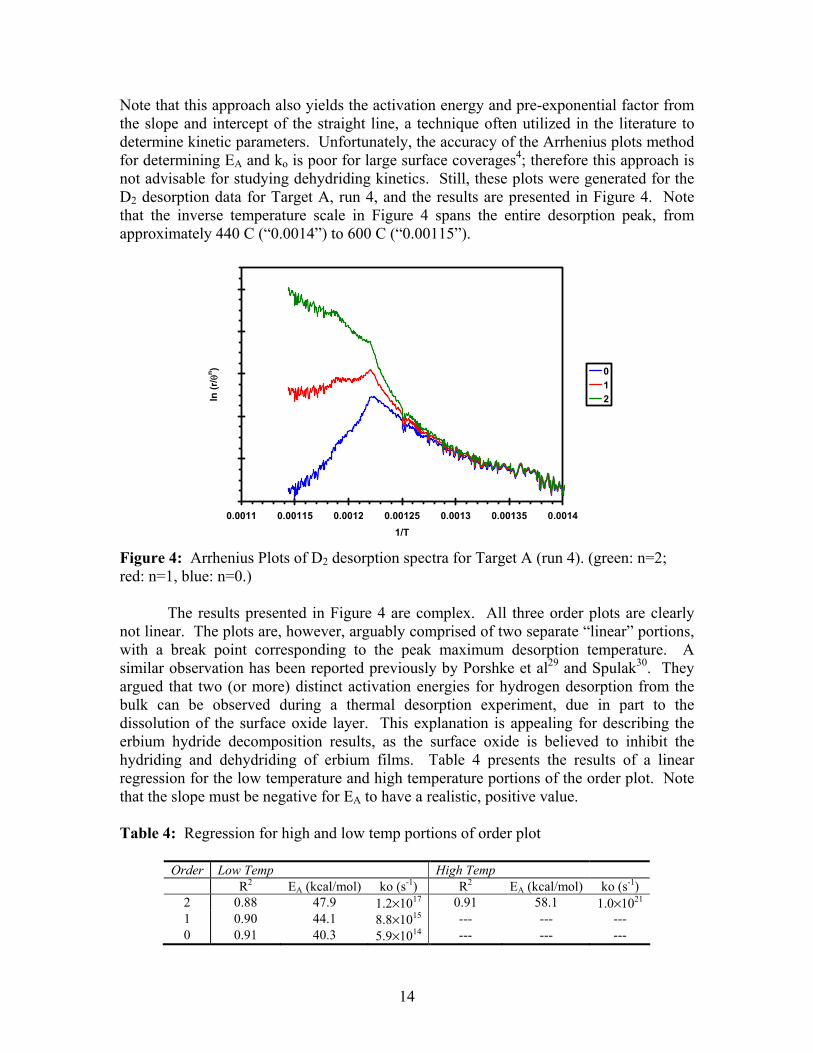
Note that this approach also yields the activation energy and pre-exponential factor from the slope and intercept of the straight line, a technique often utilized in the literature to determine kinetic parameters. Unfortunately, the accuracy of the Arrhenius plots method for determining EA and ko is poor for large surface coverages4; therefore this approach is not advisable for studying dehydriding kinetics. Still, these plots were generated for the D2 desorption data for Target A, run 4, and the results are presented in Figure 4. Note that the inverse temperature scale in Figure 4 spans the entire desorption peak, from approximately 440 C (“0.0014”) to 600 C (“0.00115”).
0.0011 0.00115 0.0012 0.00125 0.0013 0.00135 0.00141/T
ln (r
/ θn ) 0
12
Figure 4: Arrhenius Plots of D2 desorption spectra for Target A (run 4). (green: n=2; red: n=1, blue: n=0.) The results presented in Figure 4 are complex. All three order plots are clearly not linear. The plots are, however, arguably comprised of two separate “linear” portions, with a break point corresponding to the peak maximum desorption temperature. A similar observation has been reported previously by Porshke et al29 and Spulak30. They argued that two (or more) distinct activation energies for hydrogen desorption from the bulk can be observed during a thermal desorption experiment, due in part to the dissolution of the surface oxide layer. This explanation is appealing for describing the erbium hydride decomposition results, as the surface oxide is believed to inhibit the hydriding and dehydriding of erbium films. Table 4 presents the results of a linear regression for the low temperature and high temperature portions of the order plot. Note that the slope must be negative for EA to have a realistic, positive value. Table 4: Regression for high and low temp portions of order plot
Order Low Temp High Temp R2 EA (kcal/mol) ko (s-1) R2 EA (kcal/mol) ko (s-1)
2 0.88 47.9 1.2×10¹⁷ 0.91 58.1 1.0×10²¹ 1 0.90 44.1 8.8×10¹⁵ --- --- --- 0 0.91 40.3 5.9×10¹⁴ --- --- ---
15
This approach does provide a reasonable fit to the data. The results suggest that the kinetics are second order after the peak maximum temperature, and zero, first, or second order before. The activation energy for the low temperature (440 to 540 C) portion of the desorption curve is significantly lower than expected, and the pre-exponential factors are greater than expected, but still within reason. For the high temperature portion of the desorption curve, an activation energy of 58.1 kcal/mol and a ko of 1.0×10²¹ are determined. However, Porshke and Spulak both state that the kinetic parameters for the higher temperature linear fit are a combination of multiple factors, and should not be analyzed as the activation energy for desorption. By arbitrarily choosing optimal values for kinetic parameters (not the parameters presented in Table 4), it is possible to simulate a TD spectrum that changes from zero or first order kinetics to second order kinetics that closely agrees with the actual experimental data (results not shown). However, this simulation is very sensitive to the kinetic parameters chosen, and odd-shaped desorption spectra are easily simulated for small (less than 1 kcal/mol) changes to the activation energy. As mentioned above, the Arrhenius plots method is not recommended for the analysis of hydride samples, and the discussion presented in this paragraph should be viewed accordingly. The results presented in Figure 4 suggest that the activation energy changes over the course of the thermal desorption experiment. However, rather than a step change, as implied by two distinct linear curve fits, it is feasible that the change is gradual and varies with hydrogen concentration. This is precisely what is modeled by the Elovich equation. As detailed in Appendix A, the activation energy is adjusted using an interaction parameter, αE, that effectively increases or decreases EA as a function of coverage. A negative value for αE will decrease the apparent magnitude of EA as coverage decreases. This is manifest in a TD spectrum as a narrowing of the desorption peak (and a shift to higher temperatures). Typically, a negative αE is visualized as attractive adsorbate-adsorbate interactions. Therefore, as coverage decreases, the strength of these interactions decrease, and it becomes easier to desorb the remaining species. For example, assuming that EA = 49.4 kcal/mol and αE = -7 kcal/mol, the apparent activation energy is initially 56.4 kcal/mol, and it decreases to 49.4 kcal/mol as coverage approaches zero. First and second order desorption spectra were simulated assuming attractive interactions using the Elovich equation, and the results are presented in Figure 5. Clearly, a better fit is obtained than is presented in Figure 3. In particular, the second order fit is almost exact. The physical implication of the interaction parameter is not obvious for the case of hydrogen desorption from the bulk of a hydride film. It is possible that changes in film stress or surface chemistry as desorption proceeds can mimic the effect of attractive or repulsive interactions.
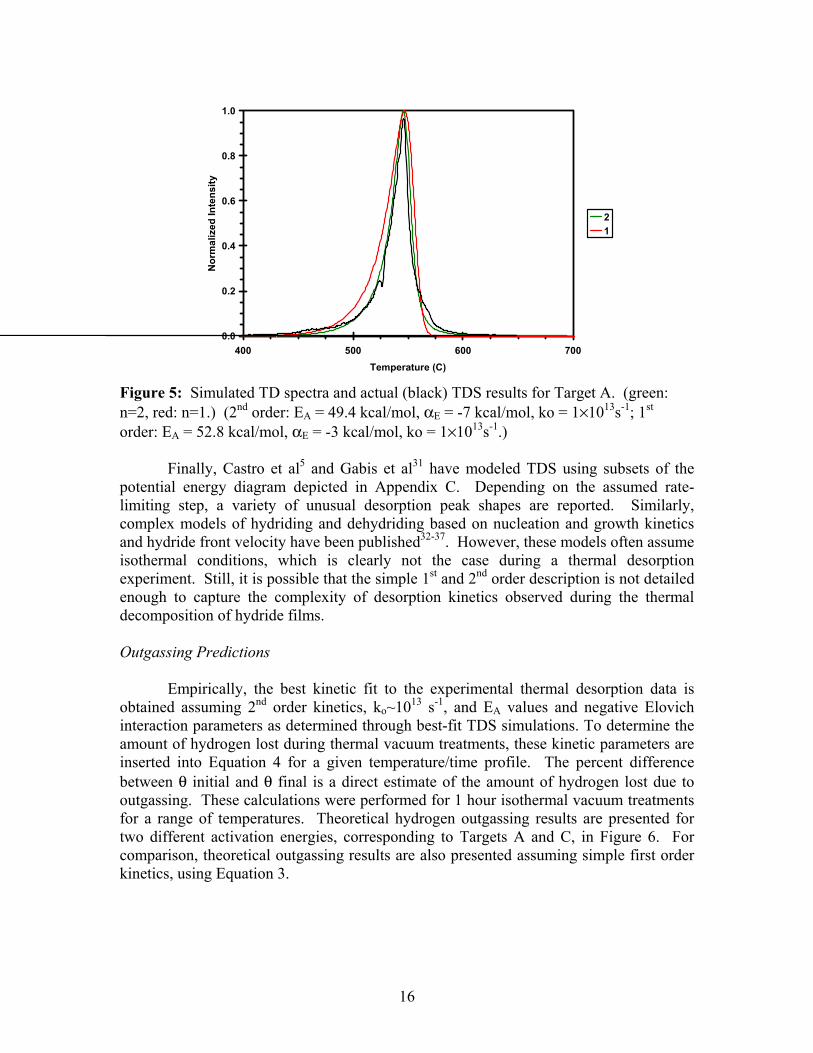
16
0.0
0.2
0.4
0.6
0.8
1.0
400 500 600 700Temperature (C)
Nor
mal
ized
Inte
nsity
21
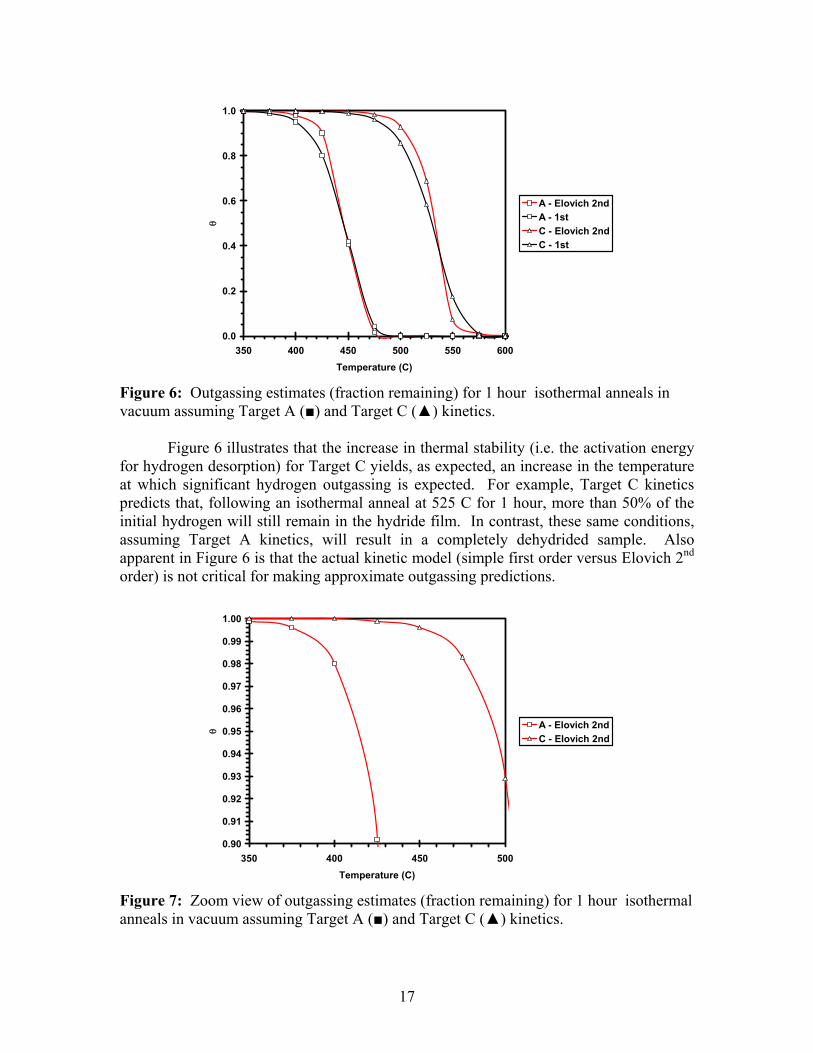
Figure 5: Simulated TD spectra and actual (black) TDS results for Target A. (green: n=2, red: n=1.) (2nd order: EA = 49.4 kcal/mol, αE = -7 kcal/mol, ko = 1×10¹³s-1; 1st order: EA = 52.8 kcal/mol, αE = -3 kcal/mol, ko = 1×10¹³s-1.) Finally, Castro et al5 and Gabis et al31 have modeled TDS using subsets of the potential energy diagram depicted in Appendix C. Depending on the assumed rate-limiting step, a variety of unusual desorption peak shapes are reported. Similarly, complex models of hydriding and dehydriding based on nucleation and growth kinetics and hydride front velocity have been published32-37. However, these models often assume isothermal conditions, which is clearly not the case during a thermal desorption experiment. Still, it is possible that the simple 1st and 2nd order description is not detailed enough to capture the complexity of desorption kinetics observed during the thermal decomposition of hydride films. Outgassing Predictions Empirically, the best kinetic fit to the experimental thermal desorption data is obtained assuming 2nd order kinetics, ko~1013 s-1, and EA values and negative Elovich interaction parameters as determined through best-fit TDS simulations. To determine the amount of hydrogen lost during thermal vacuum treatments, these kinetic parameters are inserted into Equation 4 for a given temperature/time profile. The percent difference between θ initial and θ final is a direct estimate of the amount of hydrogen lost due to outgassing. These calculations were performed for 1 hour isothermal vacuum treatments for a range of temperatures. Theoretical hydrogen outgassing results are presented for two different activation energies, corresponding to Targets A and C, in Figure 6. For comparison, theoretical outgassing results are also presented assuming simple first order kinetics, using Equation 3.
17
0.0
0.2
0.4
0.6
0.8
1.0
350 400 450 500 550 600Temperature (C)
θA - Elovich 2ndA - 1stC - Elovich 2ndC - 1st
Figure 6: Outgassing estimates (fraction remaining) for 1 hour isothermal anneals in vacuum assuming Target A (■) and Target C (▲) kinetics. Figure 6 illustrates that the increase in thermal stability (i.e. the activation energy for hydrogen desorption) for Target C yields, as expected, an increase in the temperature at which significant hydrogen outgassing is expected. For example, Target C kinetics predicts that, following an isothermal anneal at 525 C for 1 hour, more than 50% of the initial hydrogen will still remain in the hydride film. In contrast, these same conditions, assuming Target A kinetics, will result in a completely dehydrided sample. Also apparent in Figure 6 is that the actual kinetic model (simple first order versus Elovich 2nd order) is not critical for making approximate outgassing predictions.
0.90
0.91
0.92
0.93
0.94
0.95
0.96
0.97
0.98
0.99
1.00
350 400 450 500Temperature (C)
θ A - Elovich 2ndC - Elovich 2nd
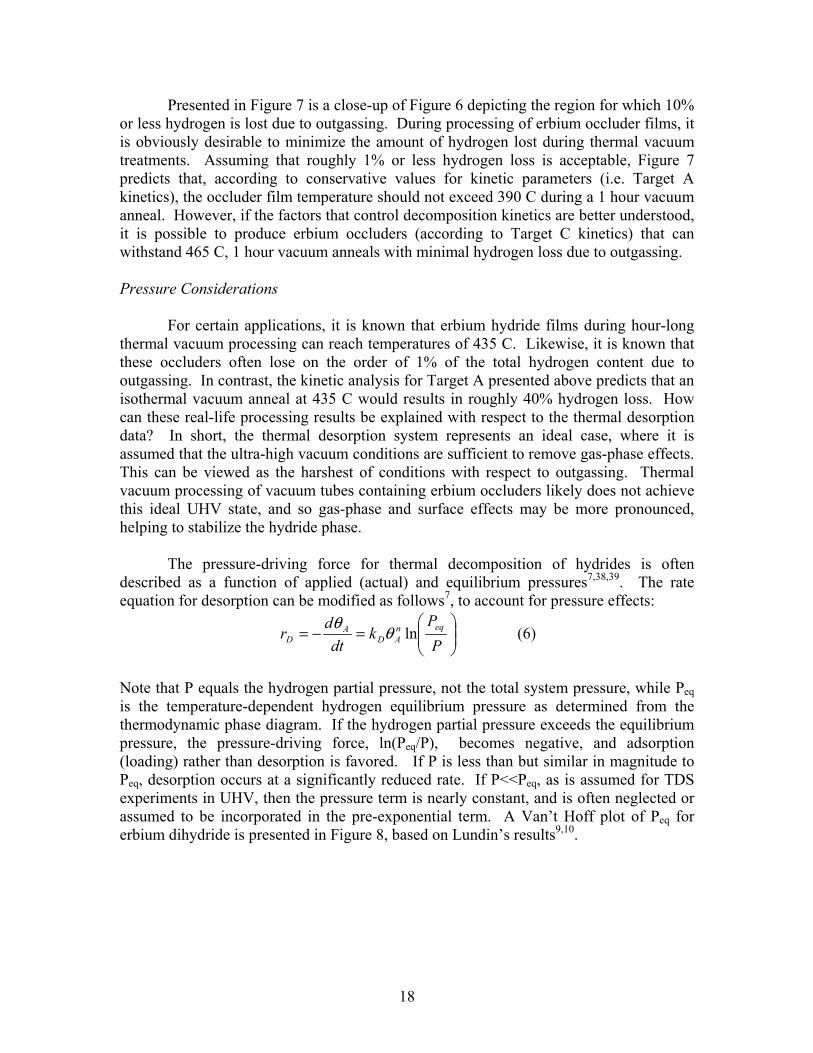
Figure 7: Zoom view of outgassing estimates (fraction remaining) for 1 hour isothermal anneals in vacuum assuming Target A (■) and Target C (▲) kinetics.
18
Presented in Figure 7 is a close-up of Figure 6 depicting the region for which 10% or less hydrogen is lost due to outgassing. During processing of erbium occluder films, it is obviously desirable to minimize the amount of hydrogen lost during thermal vacuum treatments. Assuming that roughly 1% or less hydrogen loss is acceptable, Figure 7 predicts that, according to conservative values for kinetic parameters (i.e. Target A kinetics), the occluder film temperature should not exceed 390 C during a 1 hour vacuum anneal. However, if the factors that control decomposition kinetics are better understood, it is possible to produce erbium occluders (according to Target C kinetics) that can withstand 465 C, 1 hour vacuum anneals with minimal hydrogen loss due to outgassing. Pressure Considerations For certain applications, it is known that erbium hydride films during hour-long thermal vacuum processing can reach temperatures of 435 C. Likewise, it is known that these occluders often lose on the order of 1% of the total hydrogen content due to outgassing. In contrast, the kinetic analysis for Target A presented above predicts that an isothermal vacuum anneal at 435 C would results in roughly 40% hydrogen loss. How can these real-life processing results be explained with respect to the thermal desorption data? In short, the thermal desorption system represents an ideal case, where it is assumed that the ultra-high vacuum conditions are sufficient to remove gas-phase effects. This can be viewed as the harshest of conditions with respect to outgassing. Thermal vacuum processing of vacuum tubes containing erbium occluders likely does not achieve this ideal UHV state, and so gas-phase and surface effects may be more pronounced, helping to stabilize the hydride phase. The pressure-driving force for thermal decomposition of hydrides is often described as a function of applied (actual) and equilibrium pressures7,38,39. The rate equation for desorption can be modified as follows7, to account for pressure effects:
⎟⎟⎠
⎞⎜⎜⎝
⎛=−=
PP
kdt
dr eqn
ADA
D lnθθ (6)
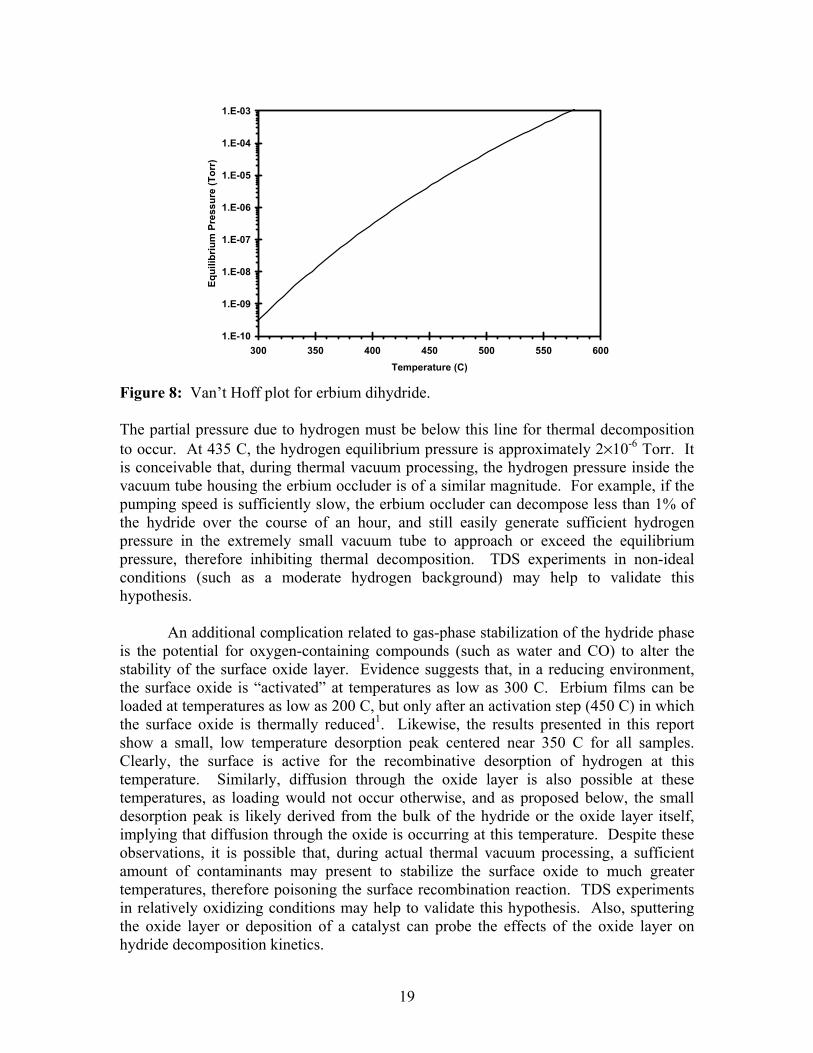
Note that P equals the hydrogen partial pressure, not the total system pressure, while Peq is the temperature-dependent hydrogen equilibrium pressure as determined from the thermodynamic phase diagram. If the hydrogen partial pressure exceeds the equilibrium pressure, the pressure-driving force, ln(Peq/P), becomes negative, and adsorption (loading) rather than desorption is favored. If P is less than but similar in magnitude to Peq, desorption occurs at a significantly reduced rate. If P<<Peq, as is assumed for TDS experiments in UHV, then the pressure term is nearly constant, and is often neglected or assumed to be incorporated in the pre-exponential term. A Van’t Hoff plot of Peq for erbium dihydride is presented in Figure 8, based on Lundin’s results9,10.
19
1.E-10
1.E-09
1.E-08
1.E-07
1.E-06
1.E-05
1.E-04
1.E-03
300 350 400 450 500 550 600Temperature (C)
Equi
libriu
m P
ress
ure
(Tor
r)
Figure 8: Van’t Hoff plot for erbium dihydride. The partial pressure due to hydrogen must be below this line for thermal decomposition to occur. At 435 C, the hydrogen equilibrium pressure is approximately 2×10⁻⁶ Torr. It is conceivable that, during thermal vacuum processing, the hydrogen pressure inside the vacuum tube housing the erbium occluder is of a similar magnitude. For example, if the pumping speed is sufficiently slow, the erbium occluder can decompose less than 1% of the hydride over the course of an hour, and still easily generate sufficient hydrogen pressure in the extremely small vacuum tube to approach or exceed the equilibrium pressure, therefore inhibiting thermal decomposition. TDS experiments in non-ideal conditions (such as a moderate hydrogen background) may help to validate this hypothesis. An additional complication related to gas-phase stabilization of the hydride phase is the potential for oxygen-containing compounds (such as water and CO) to alter the stability of the surface oxide layer. Evidence suggests that, in a reducing environment, the surface oxide is “activated” at temperatures as low as 300 C. Erbium films can be loaded at temperatures as low as 200 C, but only after an activation step (450 C) in which the surface oxide is thermally reduced1. Likewise, the results presented in this report show a small, low temperature desorption peak centered near 350 C for all samples. Clearly, the surface is active for the recombinative desorption of hydrogen at this temperature. Similarly, diffusion through the oxide layer is also possible at these temperatures, as loading would not occur otherwise, and as proposed below, the small desorption peak is likely derived from the bulk of the hydride or the oxide layer itself, implying that diffusion through the oxide is occurring at this temperature. Despite these observations, it is possible that, during actual thermal vacuum processing, a sufficient amount of contaminants may present to stabilize the surface oxide to much greater temperatures, therefore poisoning the surface recombination reaction. TDS experiments in relatively oxidizing conditions may help to validate this hypothesis. Also, sputtering the oxide layer or deposition of a catalyst can probe the effects of the oxide layer on hydride decomposition kinetics.
20
Even if the recombinative desorption of H2 at the surface oxide is not rate-limiting, it is possible that the oxygen content near the phase boundary can impact the observed decomposition kinetics. Checcheto et al present a schematic diagram of the potential energy diagram at the phase boundary25. They note that the activation energy is a combination of the heat of dissociation of the hydride phase, the heat of solution in the metal phase, and the activation energy for diffusion in the metal phase. It is likely that oxygen concentration in the metal phase will impact the metal phase energies to some extent, potentially stabilizing the hydride. The oxygen concentration in the metal may be impacted by the concentration of gas phase contaminants. Wild-Card: small, low-temperature peak An interesting facet to studying kinetics via thermal desorption spectroscopy is the potential observation of multiple binding states in a material. Generally, a species that occupies different chemical states in the same material will be bound to each distinct state with a different energy barrier. Simply stated, the activation energy for desorption will be different for each distinct chemical state. For example, hydrogen in erbium can occupy octahedral and tetrahedral sites in the β phase, or it can be found in trihydride domains, solid solution, surface sites, the surface oxide layer, at grain boundaries, or bound at the erbium/support interface. Assuming that the different binding energies associated with each of these distinct states is rate-limiting, thermal desorption experiments performed on erbium hydride samples can potentially yield multiple hydrogen desorption peaks. The ratio of the areas of these different peaks is a direct measure of the relative populations of hydrogen at these different sites. Recall that a small, low temperature peak was observed in all hydrogen desorption spectra, in addition to the primary desorption peak. This peak is a “wild-card” with respect to the outgassing analysis presented above. Peak area analysis concludes that this low temperature desorption feature accounts for roughly 1 to 2% of the total amount of hydrogen that desorbs for each sample. It is likely that this hydrogen species accounts for a fraction (or the entirety) of the hydrogen outgassing that is observed during erbium occluder film processing. What is the origin of this peak? Why is this hydrogen species not desorbed immediately after loading? It is unlikely that this low temperature desorption feature is due to hydrogen adsorbed at the surface or grain boundaries. The hydride films studied in this report were approximately 5000 Å in thickness. Erbium dihydride is known to be face-centered cubic (CaF2 type) with a lattice parameter of 5.126 Å9,10. Simple geometric considerations would suggest that the hydride film is composed of approximately 975 monolayers, and that the relative amount of hydrogen at the surface is around 0.1% of the total amount stored in the bulk of the film. Likewise, the film is known to consist of columnar grains of a size of roughly 5000 Å. Geometric considerations suggest that approximately 0.1% of the total amount of hydrogen will exist at grain boundaries. The amount of hydrogen that desorbs at low temperatures is an order of magnitude greater than what is accounted for due to the surface layer and grain boundaries. Instead, it is calculated that the hydrogen desorbed at low temperature would fill roughly 75 Å of the 5000 Å hydride film. This value is in close agreement with the actual thickness of the
21
surface oxide layer, and also in close agreement with the thickness of the theorized “denuded zone” that exists directly below the oxide layer for tritiated erbium occluder films. Still, the origin of this source of low-temperature hydrogen is unclear at present, and will be explored further in future reports. It is curious that this low temperature desorption feature is observed at all, considering that the erbium films studied in this report were loaded at temperatures in excess of 400 C. Outgassing predictions based on the kinetic parameters for this low temperature desorption feature suggest that less than 10% of this hydrogen species would remain after only 3 seconds at 450 C in ultra-high vacuum conditions. This time increases to about 15 seconds at 400 C. Typically, hydride films are loaded at a specified temperature and pressure. The manner in which the samples are extracted from the loading apparatus is critical in determining whether or not this hydrogen species should theoretically be present or not. For example, if the films are held at temperature for any significant length of time as the system is evacuated, it is expected this low temperature species will be completely outgassed. However, the pressure-driving force must be considered. The equilibrium pressure for erbium dihydride at 400 C is approximately 3×10⁻⁷ Torr, and it continues to decrease with decreasing temperature. After evacuation, it is possible that the background hydrogen pressure is still sufficient to favor adsorption rather than desorption, therefore stabilizing the occluder film. Another possibility is that this hydrogen species does indeed fully desorb after loading, and that ambient storage conditions are sufficient to “re-load” this state. However, erbium films loaded with deuterium still desorb primarily D2 during this low temperature desorption peak. It is expected that this peak would primarily consist of H2 if contamination during storage is responsible for populating this state. This does not preclude the possibility of diffusion from the bulk hydride as a deuterium source. The differential heat of reaction for the phase change of erbium dihydride to an erbium-hydrogen solid solution, however, would suggest that this deuterium source would not be available at such low temperatures. (It should be noted that the protium contamination is indeed twice to five times as large during this low temperature desorption peak as compared to the primary desorption peak at higher temperatures.) Conclusions The TDS results presented in this report provide the basis for a fundamental understanding of the kinetics of erbium hydride decomposition. Kinetic analysis has illustrated that measurable properties, such as the gas-to-metal ratio obtained after loading and thermal vacuum treatments, can be impacted by hydrogen desorption kinetics. For a given application, the thermal stability of the hydride film, and therefore desorption kinetics, is a key consideration during materials selection and processing. Kinetic parameters were determined for erbium dihydride, and utilized to predict hydrogen outgassing in vacuum for a variety of thermal treatments. Gas-phase (pressure) effects were considered that can potentially enhance hydride stability and alter outgassing predictions for non-ideal environments. It was found that the activation energy for desorption can vary by more than 7 kcal/mol (0.30 eV) for seemingly similar samples.
22
Small amounts of less-stable hydrogen were found to be present in all erbium dihydride films. Many open-ended questions were introduced, such as what is the actual rate-limiting step for desorption? How do factors such as film structure and composition control desorption kinetics? A systematic study of the factors that control hydride decomposition kinetics will be explored in future reports. The goal of these studies will be to understand and possibly enhance film stability, and identify any “danger zones” (i.e. processing cliffs) that produce unstable films. Finally, hydrogen desorption studies represent the “base case” for future helium desorption studies. It is proposed that, ultimately, the processing “knobs” that control dehydriding kinetics may also impact the kinetics of helium release from tritiated occluder films. At the very least, it is theorized that helium desorption kinetics can be used as a measure and predictor of helium retention. Therefore, TDS may become a powerful tool for understanding and optimizing helium retention properties. Acknowledgements Sandia National Laboratories are a multiprogram laboratories operated by Sandia Corporation, a Lockheed Martin Company, for the United States Department of Energy’s National Nuclear Security Administration under Contract DE-AC04-94AL85000. Special thanks to Mike Mangan and Kim Carrejo-Simpkins for their help with initial testing and configuration of the thermal desorption system used for this study, Barry Ritchey for continued technical support and maintenance of the thermal desorption system, Craig Tewell and Saskia King for their insights into erbium film thermodynamics and kinetics, and for providing loaded samples for experimentation, and Lisa Walla for valuable discussions and data concerning erbium film processing.

23
Appendix A - Determining kinetic parameters from thermal desorption spectra There are many different analytical procedures for deriving kinetic parameters from TD spectra. For a comprehensive review and detailed explanation of these procedures, please refer to Masel3 and de Jong et al.4. The defining equations for the rate of desorption (equations 1 and 2) include all three kinetic parameters of interest: n, ko, and EA. The reaction order, n, is the exponent of the concentration term in the rate law, and often provides important clues to the mechanism of a reaction. For a surface reaction, 1st order kinetics (n=1) often implies dependence on one reactant (i.e. the breaking of a single bond), such as the desorption of molecular NO chemisorbed to a metal surface. In contrast, 2nd order kinetics (n=2) suggests the importance of two separate species in the rate-limiting step for desorption, such as the recombinative desorption of hydrogen gas, as shown in the following chemical equation:
)()(2 2 gHadsH ⎯→⎯ (A1) Equation A1 is of particular importance to hydride decomposition reactions, as the surface recombination of adsorbed hydrogen is often cited as the rate-limiting-step for desorption. The pre-exponential factor, ko, is part of the Arrhenius equation (equation 2) and is generally assumed to be temperature-independent. Using transition state theory as a basis, the pre-exponential factor can be roughly viewed as the frequency of attempts to cross the energy barrier, which is dependent on the “freedom” of the transition state. A value of 1013/s is typically chosen for ko. The activation energy, EA, is the key quantity in the Arrhenius equation that defines the rate constant. EA is the amount of energy that is needed for a particular reaction to take place. In terms of hydride decomposition, EA might represent the energy barrier for surface recombination of adsorbed hydrogen, the barrier for hydrogen diffusion from the bulk to the surface, or the barrier for decomposition of the hydride at the metal-hydride interface, among others; any of which may be the rate-limiting-step for hydrogen desorption. As suggested in Section 1 of this report, the simplest approach for determining kinetic parameters from TD spectra is Redhead’s method. This derivation assumes that the temperature varies linearly with time, and that rD is measured directly (i.e. the mass spectrometer signal) during a TDS experiment. Equation A2 illustrates the linear temperature dependence with time, where β is the heating rate.
tTT o β+= (A2) Upon substituting Equation A2 into Equation 1, and noting that the maximum in desorption rate occurs when the derivative of the rate with respect to temperature is zero (Equation A3), the relationship shown as Equation A4 can be deduced. (See Masel3 for details).
0=dTdrD (A3)
24
⎟⎟⎠
⎞⎜⎜⎝
⎛−= −
P
Ano
P
A
kTE
nk
kTE
exp12 θ
β (A4)
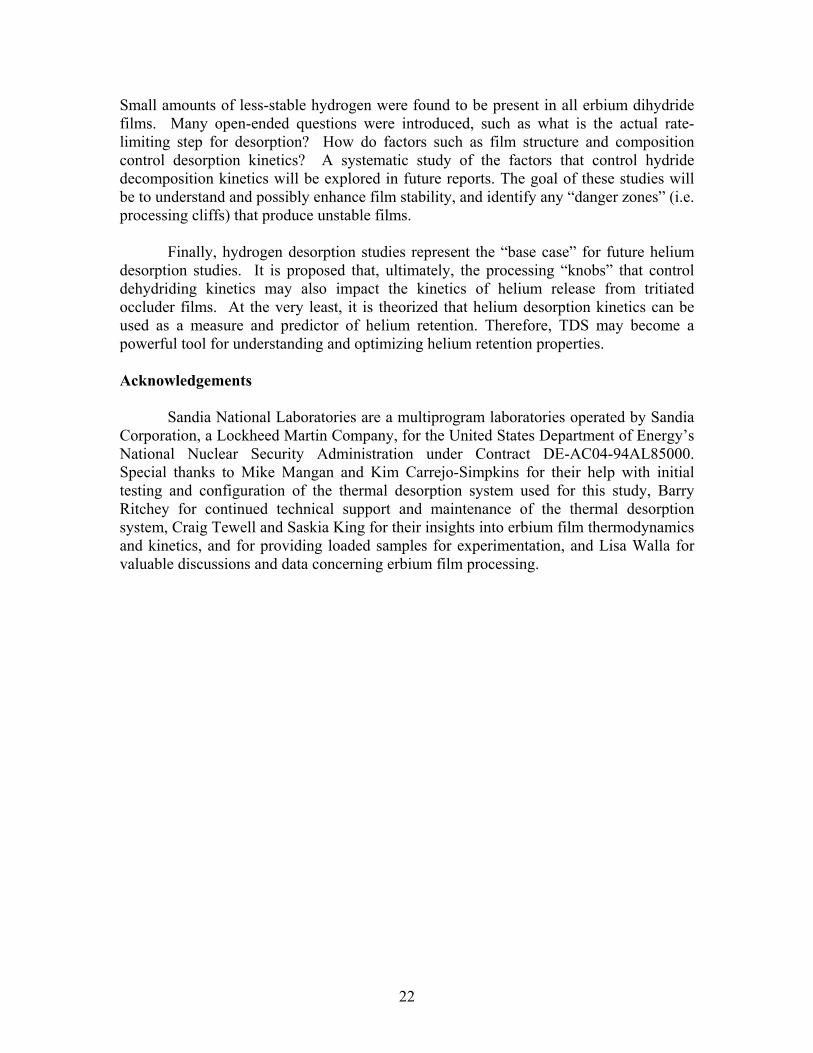
TP is the temperature of the maximum of the TDS curve. For 1st or 2nd order desorption, Equation 6 can be rearranged to yield Equation A5. Note that, due to symmetry considerations, surface coverage at the peak maximum temperature is half the initial coverage (θo) for 2nd order reactions.
⎟⎟⎠
⎞⎜⎜⎝
⎛−⎟⎟
⎠
⎞⎜⎜⎝
⎛=
−
P
AnoPo
P
A
kTETk
kTE lnln
1
βθ
(A5)
Equation A5 can be solved iteratively for EA given the peak maximum temperature from the TD spectrum, the experimental heating rate, and an assumption for the pre-exponential factor. A further simplification4 assumes that ln(EA/kTP) ~ 3.64. This introduces an error of only ±1.5% provided that ko/β falls between 108 and 1013 K-1. An improvement over the Redhead method for determining EA is the Kissinger method, which utilizes multiple desorption spectra obtained at different heating rates. Equation A4 can be re-written as follows:
⎟⎟⎠
⎞⎜⎜⎝
⎛−=−
P
APn
o
A
kTET
nkkE
exp2
1 βθ (A6)
Taking the natural log of both sides and rearranging terms yields:
⎟⎟⎠
⎞⎜⎜⎝
⎛+=⎟⎟
⎠
⎞⎜⎜⎝
⎛−1
2
lnln no
A
P
AP
nkkE
kTET
θβ (A7)
A plot of ln(TP
2/β) versus 1/TP yields a straight line, with a slope equal to EA/k. TDS simulation is another method for determining kinetic parameters. Expanding upon Equation 1 yields the following:
⎟⎠⎞
⎜⎝⎛ −
=−=−=kTEk
dtdT
dTd
dtdr An
AoAA
D expθθθ (A8)
From Equation A2, dT/dt equals β. Therefore:
⎟⎠⎞
⎜⎝⎛ −
−=kTEk
dTd An
AoA expθ
βθ (A9)
25
Using numerical methods (e.g. Euler Method), θi+1 can be derived from Equation A9 for a given temperature step and initial conditions (To, θi) for an assumed set of kinetic parameters. The instantaneous reaction rate (rD) is determined using Equation A10.
dTdr A
Dθβ−= (A10)
This iterative process will yield a thermal desorption spectrum for the assumed kinetic parameters. Simple trial and error will yield a best fit theoretical TD spectrum for the actual desorption data. An additional term can be included in Equation A9 to account for interactions between desorbing species, typically visualized as “adsorbate-adsorbate interactions”. For attractive interactions, the absolute value of the heat of adsorption (i.e. the apparent magnitude of EA) will increase. Likewise, repulsive interactions will lead to an apparent decrease in EA. These interactions are coverage-dependent, and will result in fairly significant changes to the peak shape and temperature of maximum desorption rate in a TD spectrum. Equation A11, known as the Elovich equation, is a modified version of Equation A9 that incorporates this interaction parameter, αE.
⎟⎠⎞
⎜⎝⎛ −−
−=kT
EkdTd EAn
AoA )(exp θαθ
βθ (A11)
There are many methods for deriving kinetic parameters from desorption spectra. These methods vary in complexity, accuracy, feasibility, and experimental effort. In this author’s opinion, the methods detailed above (Redhead, Kissinger, and Euler simulation) are most efficient for studying the kinetics of hydride decomposition reactions.

26
Intentionally Left Blank
27
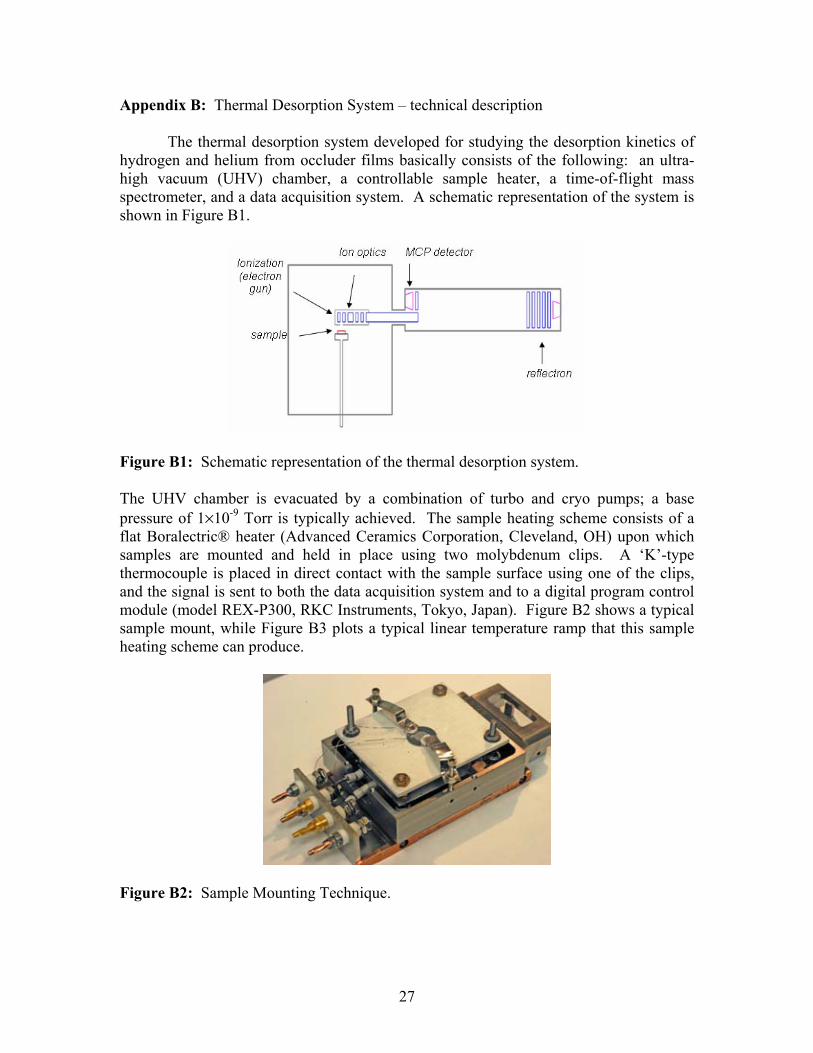
Appendix B: Thermal Desorption System – technical description The thermal desorption system developed for studying the desorption kinetics of hydrogen and helium from occluder films basically consists of the following: an ultra-high vacuum (UHV) chamber, a controllable sample heater, a time-of-flight mass spectrometer, and a data acquisition system. A schematic representation of the system is shown in Figure B1.
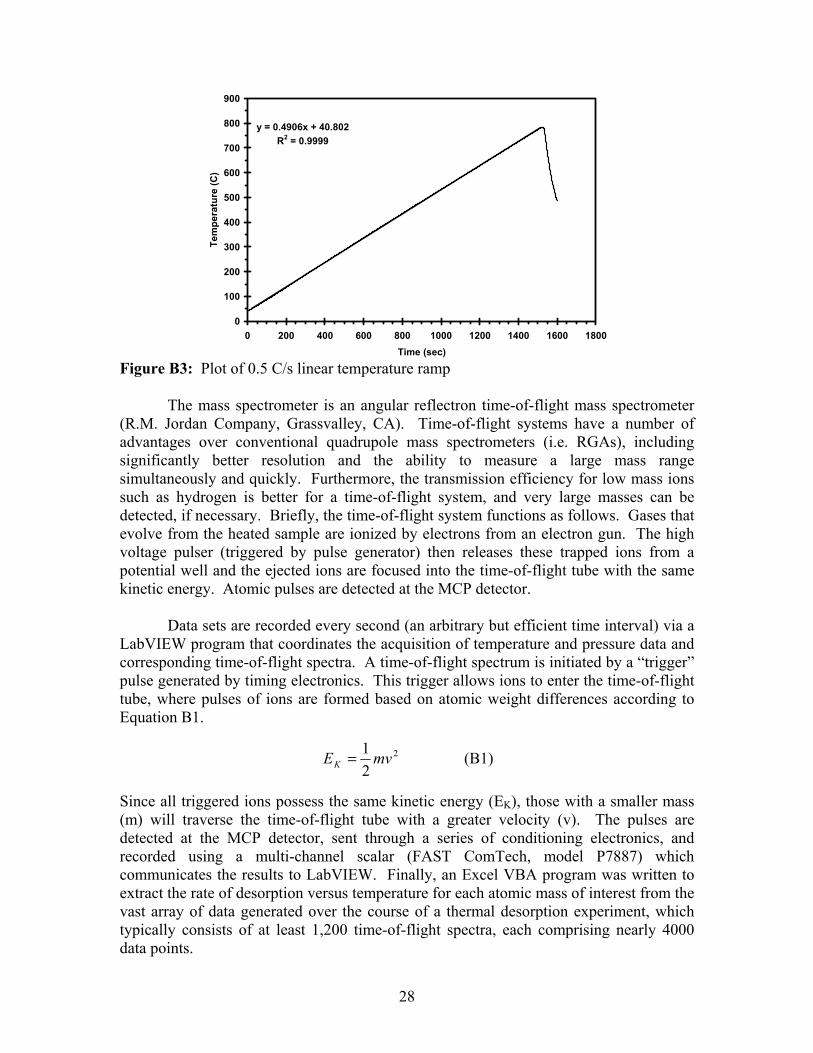
Figure B1: Schematic representation of the thermal desorption system. The UHV chamber is evacuated by a combination of turbo and cryo pumps; a base pressure of 1×10⁻⁹ Torr is typically achieved. The sample heating scheme consists of a flat Boralectric® heater (Advanced Ceramics Corporation, Cleveland, OH) upon which samples are mounted and held in place using two molybdenum clips. A ‘K’-type thermocouple is placed in direct contact with the sample surface using one of the clips, and the signal is sent to both the data acquisition system and to a digital program control module (model REX-P300, RKC Instruments, Tokyo, Japan). Figure B2 shows a typical sample mount, while Figure B3 plots a typical linear temperature ramp that this sample heating scheme can produce.
Figure B2: Sample Mounting Technique.
28
y = 0.4906x + 40.802R2 = 0.9999
0
100
200
300
400
500
600
700
800
900
0 200 400 600 800 1000 1200 1400 1600 1800Time (sec)
Tem
pera
ture
(C)
Figure B3: Plot of 0.5 C/s linear temperature ramp The mass spectrometer is an angular reflectron time-of-flight mass spectrometer (R.M. Jordan Company, Grassvalley, CA). Time-of-flight systems have a number of advantages over conventional quadrupole mass spectrometers (i.e. RGAs), including significantly better resolution and the ability to measure a large mass range simultaneously and quickly. Furthermore, the transmission efficiency for low mass ions such as hydrogen is better for a time-of-flight system, and very large masses can be detected, if necessary. Briefly, the time-of-flight system functions as follows. Gases that evolve from the heated sample are ionized by electrons from an electron gun. The high voltage pulser (triggered by pulse generator) then releases these trapped ions from a potential well and the ejected ions are focused into the time-of-flight tube with the same kinetic energy. Atomic pulses are detected at the MCP detector. Data sets are recorded every second (an arbitrary but efficient time interval) via a LabVIEW program that coordinates the acquisition of temperature and pressure data and corresponding time-of-flight spectra. A time-of-flight spectrum is initiated by a “trigger” pulse generated by timing electronics. This trigger allows ions to enter the time-of-flight tube, where pulses of ions are formed based on atomic weight differences according to Equation B1.
2
21 mvEK = (B1)
Since all triggered ions possess the same kinetic energy (EK), those with a smaller mass (m) will traverse the time-of-flight tube with a greater velocity (v). The pulses are detected at the MCP detector, sent through a series of conditioning electronics, and recorded using a multi-channel scalar (FAST ComTech, model P7887) which communicates the results to LabVIEW. Finally, an Excel VBA program was written to extract the rate of desorption versus temperature for each atomic mass of interest from the vast array of data generated over the course of a thermal desorption experiment, which typically consists of at least 1,200 time-of-flight spectra, each comprising nearly 4000 data points.
29
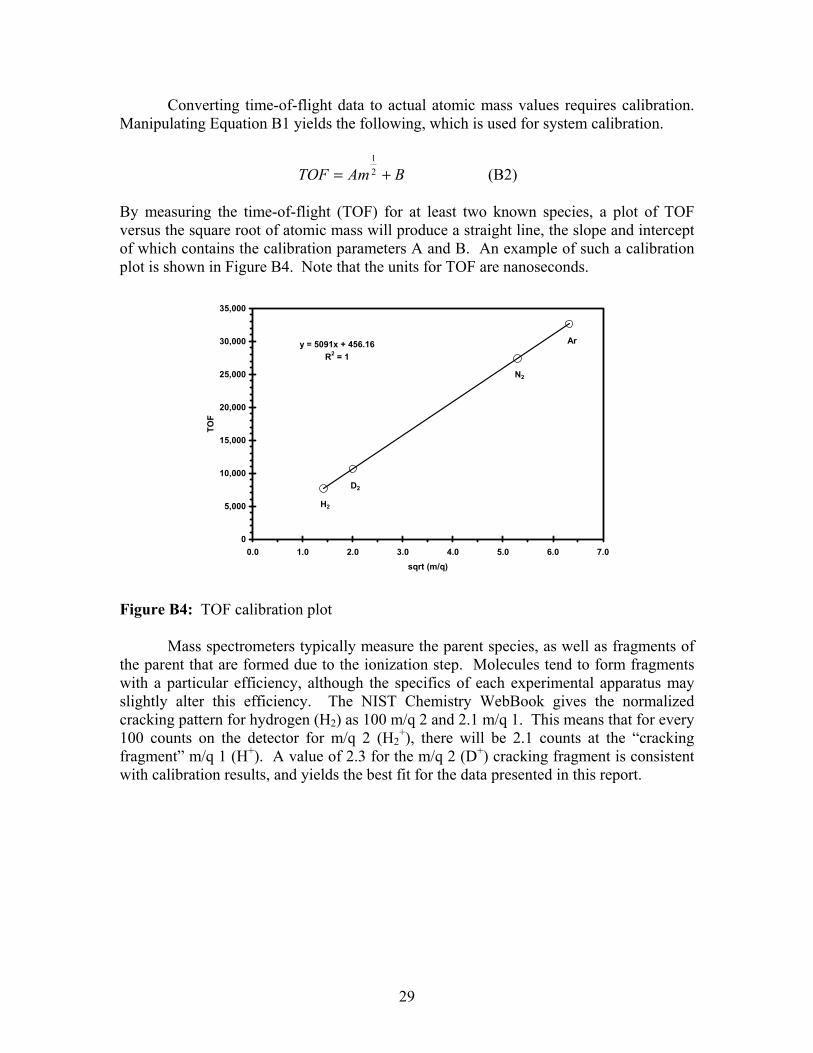
Converting time-of-flight data to actual atomic mass values requires calibration. Manipulating Equation B1 yields the following, which is used for system calibration.
BAmTOF += 21
(B2) By measuring the time-of-flight (TOF) for at least two known species, a plot of TOF versus the square root of atomic mass will produce a straight line, the slope and intercept of which contains the calibration parameters A and B. An example of such a calibration plot is shown in Figure B4. Note that the units for TOF are nanoseconds.
y = 5091x + 456.16R2 = 1
0
5,000
10,000
15,000
20,000
25,000
30,000
35,000
0.0 1.0 2.0 3.0 4.0 5.0 6.0 7.0sqrt (m/q)
TOF
D2
H2
N2
Ar
Figure B4: TOF calibration plot Mass spectrometers typically measure the parent species, as well as fragments of the parent that are formed due to the ionization step. Molecules tend to form fragments with a particular efficiency, although the specifics of each experimental apparatus may slightly alter this efficiency. The NIST Chemistry WebBook gives the normalized cracking pattern for hydrogen (H2) as 100 m/q 2 and 2.1 m/q 1. This means that for every 100 counts on the detector for m/q 2 (H2
+), there will be 2.1 counts at the “cracking fragment” m/q 1 (H+). A value of 2.3 for the m/q 2 (D+) cracking fragment is consistent with calibration results, and yields the best fit for the data presented in this report.

30
Intentionally Left Blank
31
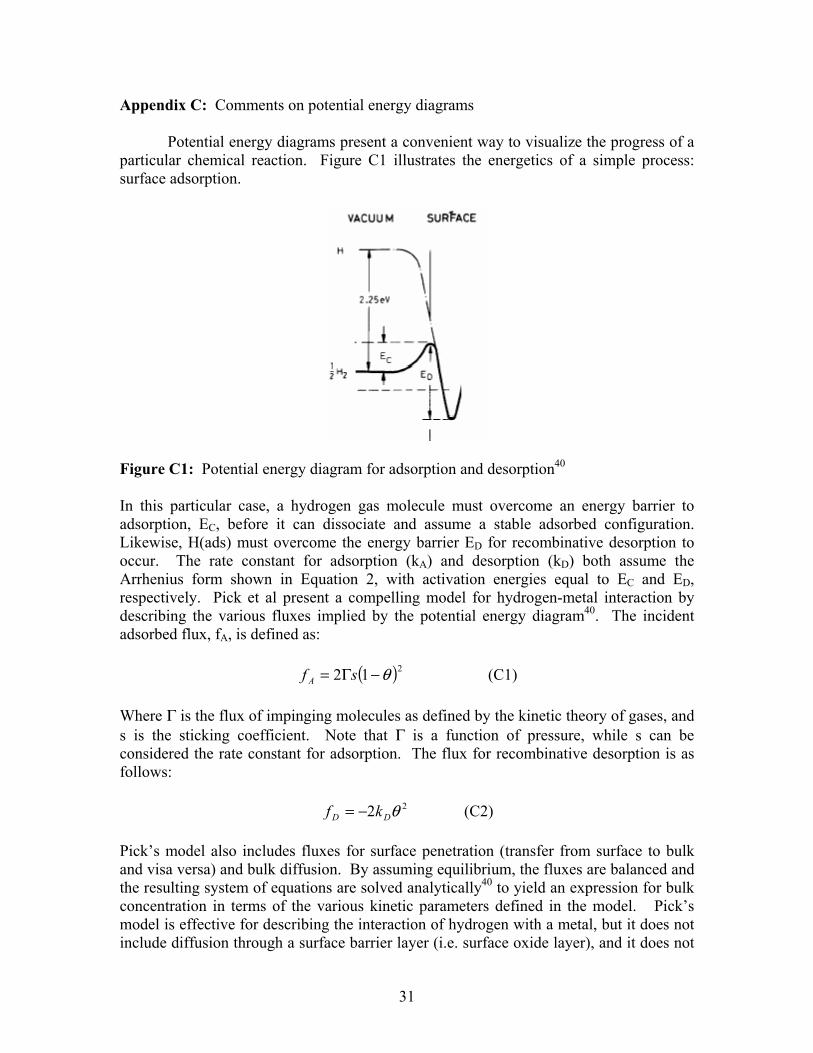
Appendix C: Comments on potential energy diagrams Potential energy diagrams present a convenient way to visualize the progress of a particular chemical reaction. Figure C1 illustrates the energetics of a simple process: surface adsorption.
Figure C1: Potential energy diagram for adsorption and desorption40 In this particular case, a hydrogen gas molecule must overcome an energy barrier to adsorption, EC, before it can dissociate and assume a stable adsorbed configuration. Likewise, H(ads) must overcome the energy barrier ED for recombinative desorption to occur. The rate constant for adsorption (kA) and desorption (kD) both assume the Arrhenius form shown in Equation 2, with activation energies equal to EC and ED, respectively. Pick et al present a compelling model for hydrogen-metal interaction by describing the various fluxes implied by the potential energy diagram40. The incident adsorbed flux, fA, is defined as:
( )212 θ−Γ= sf A (C1) Where Γ is the flux of impinging molecules as defined by the kinetic theory of gases, and s is the sticking coefficient. Note that Γ is a function of pressure, while s can be considered the rate constant for adsorption. The flux for recombinative desorption is as follows:
22 θDD kf −= (C2) Pick’s model also includes fluxes for surface penetration (transfer from surface to bulk and visa versa) and bulk diffusion. By assuming equilibrium, the fluxes are balanced and the resulting system of equations are solved analytically40 to yield an expression for bulk concentration in terms of the various kinetic parameters defined in the model. Pick’s model is effective for describing the interaction of hydrogen with a metal, but it does not include diffusion through a surface barrier layer (i.e. surface oxide layer), and it does not

32
include phase changes in the bulk (i.e. hydrogen solid solution to hydride phase). Additionally, solving the time-dependent equations (i.e. equilibrium is not assumed for all partial steps) is considerably more difficult41. Presented in Figure C2 is one possible representation of the potential energy diagram for a metal hydride system. This figure illustrates the complexity of the system in question. At the surface, there are fluxes for adsorption, desorption, surface penetration, and diffusion from bulk to the surface. The hydrogen concentration in the oxide layer, solid solution, and hydride phase are characterized by Fick’s Law (see Equation C3), with Arrhenius-type diffusivities different for each individual layer.
2
2
)(zCTD
tC
∂∂=
∂∂ (C3)
Interface boundary conditions are assigned that maintain conservation of mass, with the solid solution-hydride boundary incorporating the activation energy for phase transformation. Additionally, the solid solution-hydride interface is a Stefan-type moving boundary. Finally, the chemical state of the oxide layer is temperature-dependent, with stoichiometric and sub-stoichiometric oxides likely described by differing kinetic parameters.
Figure C2: Potential energy diagram for metal-hydride system. It is theoretically possible to describe the hydrogen flux (i.e. hydrogen concentration) throughout the layers depicted in Figure C2 using a system of simultaneous differential equations. Indeed, these equations have already been published for subsets of the metal-hydride system depicted in Figure C2 by Mavrikakis et al42-45 and others31,46-48. Ideally, these equations would be solved to yield the time-dependent hydrogen concentration profile throughout the thin film system. In theory, this solution would completely define the system, and a TD spectrum could be generated by simply plotting the flux due to recombinative desorption as a function of time (i.e. temperature). Unfortunately, at present there are too many unknowns to accurately solve this system of equations. Due

33
to the significant effort involved in pursuing this approach, coupled with the modest-at-best return on this potential investment, it is concluded that numerically simulating the kinetics of hydriding and dehydriding based on a system of simultaneous differential equations abstractly visualized in Figure C2 is beyond the scope of this study at this time. In the future, a comprehensive study may help unravel the complexities of hydride decomposition. Some possible experiments include sputtering the oxide layer to reveal a pristine hydride surface, thereby removing any diffusion or recombination limits due to the presence of oxygen. Deposition of a catalyst such as Pt or Pd on the surface of the sample will enhance recombination rates, thereby effectively removing surface recombination as a barrier to hydrogen desorption. Similarly, increasing or decreasing the overall film thickness will effect hydrogen desorption if diffusion in the bulk is rate limiting.

34
Intentionally Left Blank

35
Appendix D: Diffusion Diffusion-limited desorption generally appears as a broad peak spanning hundreds of degrees in a TD spectrum. An approach adopted in a number of kinetic research publications25,28 compares the estimated diffusion time necessary to traverse the film thickness versus the characteristic time for desorption during the thermal desorption experiment. The first value, τDIF, is estimated from the random-walk expression:
Dd
DIF
2
=τ (D1) where d is the film thickness, and D is the diffusivity. The characteristic desorption time, τDES, is determined from the following simple expression:
βτ P
DESTΔ
= (D2)
where ΔTP is the width of the desorption peak and β is the heating rate. Note that the value of the diffusion constant in Equation D1 is temperature-dependent, and the value used should correspond to the peak maximum temperature. Unfortunately, diffusivity data for the erbium system is not readily available (if it even exists), so τDIF cannot be conclusively determined. However, atomic theory suggests that the diffusion of hydrogen in yttrium and erbium are expected to be qualitatively and even quantitatively similar, and diffusivity data for the yttrium system is available in the literature49-51, due to interest in yttrium hydride as a switchable mirror. Presented in Table D1 are the Arrhenius parameters published by Majer et al50 for hydrogen diffusivity in various yttrium hydrides. Theory suggests that hydrogen diffusion in the metal should be even faster. Table D1: Arrhenius parameters for hydrogen diffusivity in yttrium hydride (YHx).
x Do (cm2/s) EA (eV) D @ 540 C (cm2/s) 1.91 4.8x10⁻⁴ 0.53 5.43x10⁻⁹ 1.95 9.0x10⁻⁵ 0.40 1.66x10⁻⁸ 2.03 1.0x10⁻⁴ 0.38 2.84x10⁻⁸
Given that the heating rate for the desorption experiments was 0.5 C/s and the observed peak width was approximately 75 C, τDES is calculated to be 150 s. If τDIF << τDES, then diffusion is not limiting. Since the films studied for this report were approximately 5000 Å in thickness, it can be argued that diffusion is significant for diffusivity (D) values of roughly 10-10 cm2/s or smaller, which would results in a τDIF values of 25 s or more. As shown in Table D1, the diffusivity value does not approach the critical value determined above. Indeed, this approximate method predicts that diffusion in the hydride (or metal) is only an issue for temperatures near 125 C or below. However, erbium hydride decomposition is complex, with diffusion through the surface oxide potentially representing a limiting step for desorption. As diffusivity values for yttrium oxide were unavailable, this remains a possibility.
36
Assuming that hydrogen diffusion in yttrium is indeed a realistic model for the erbium system, it should be noted that yttrium hydride decomposes at 620 K (~350 C), a value significantly less than that observed for erbium dihydride. This strongly suggests that diffusion is not limiting erbium’s high temperature hydrogen desorption peaks. Also, Gabis et al31 have recently published a report on the kinetics of hydrogen desorption from erbium hydride powder samples. A key assumption of their data analysis is that diffusion is fast (i.e. non-limiting), such that the concentration gradients in the solid solution and hydride phases are nearly zero. The preliminary conclusion is that, at the high temperatures of the dihydride decomposition reaction, diffusion is not a limiting factor in the observed desorption kinetics.
37
References 1. Tewell, C. R., King, S.H. Observations of metastable erbium trihydride. Sandia
National Laboratories report SAND2006-0461J (2006). 2. Redhead, P. A. Thermal desorption of gases. Vacuum 12, 253-258 (1962). 3. Masel, R. I. Principles of Adsorption and Reaction on Solid Surfaces (John Wiley
& Sons, Inc., 1996). 4. de Jong, A. M., and Niemantsverdriet, J.W. Thermal desorption analysis:
comparative test of ten commonly applied procedures. Surface Science 233, 355-365 (1990).
5. Castro, F. J., and Meyer, G. Thermal desorption spectroscopy (TDS) method for hydrogen desorption characterization (I): theoretical aspects. Journal of Alloys and Compounds 330-332, 59-63 (2002).
6. Checchetto, R., Gratton, L.M., Miotello, A., Tosami, A., and Scardi, P. Structural evolution and thermal stability of deuterated titanium thin films. Physical Review B 58, 4130-4137 (1998).
7. Luo, W. a. G., K.J. A kinetic model of hydrogen absorption and desorption in Ti-doped NaAlH4. Journal of Alloys and Compounds 385, 224-231 (2004).
8. Beavis, L. C. Thermal desorption measurements for estimating bakeout characteristics of vacuum devices. Journal of Vacuum Science and Technology 20, 972-977 (1982).
9. Lundin, C. E. The erbium-hydrogen system. Transactions of the Metallurgical Society of AIME 242, 903-907 (1968).
10. Lundin, C. E. Thermodynamics of the erbium-deuterium system. Transactions of the Metallurgical Society of AIME 242, 1161-1165 (1968).
11. Beavis, L. C. Metal tritides helium emission. Sandia National Laboratories report SAND79-0645 (1980).
12. Fromm, E., and Uchida, H. Surface phenomena in hydrogen absorption kinetics of metals and intermetallic compounds. Journal of the Less-Common Metals 131, 1-12 (1987).
13. Kondo, M., Asano, K., and Iijima, Y. Effect of nickel addition and microstructure on absorption and desorption behavior of hydrogen in LaNi5. Journal of Alloys and Compounds 393, 269-273 (2005).
14. Lehmhus, D., and Rausch, G. Tailoring titanium hydride decomposition kinetics by annealing in various atmospheres. Advanced Engineering Materials 6, 313-330 (2004).
15. Butera, R. A., Weaver, J.H., Peterman, D.J., Franciosi, A., and Peterson, D.T. Hydrogen diffusion and hydride formation at the metal-hydride interface. Journal of Chemical Physics 79, 2395-2399 (1983).
16. Kojima, Y., Watanabe, M., Yamada, M., and Tanaka, K. Phase stability and thermal desorption properties of Ti3Al hydrides. Journal of Alloys and Compounds 359, 272-277 (2003).
38
17. Schlapbach, L., Seiler, A., Stucki, F. and Siegmann, H.C. Surface effects and the formation of metal hydrides. Journal of Less-Common Metals 73, 145-160 (1980).
18. Allain, M., and Heuser, B.J. Lattice strain measurements of deuteride formation in epitaxial Nb: additional results and further insights into past measurements. Physical Review B 72, 54102-1-11 (2005).
19. Hughey, M. P., and Cook, R.F. Stress development kinetics in plasma-enhanced chemical-vapor-deposited silicon nitride films. Journal of Applied Physics 97, 114914-1-10 (2005).
20. Malinowski, M. E. Thermal decomposition of titanium deuteride thin films. Journal of Less-Common Metals 89, 27-35 (1983).
21. Cohen, D., Zeiri, Y., and Mintz, M.H. Model calculations for hydride nucleation on oxide-coated metallic surfaces: surface- and diffusion-related parameters. Journal of Alloys and Compounds 184, 11-23 (1992).
22. Checchetto, R., Bazzanella, N., Miotello, A., and Principi, G. Deuterium thermal desorption from FeTi thin films. Journal of Alloys and Compounds 356-357, 521-525 (2003).
23. Bloch, J., and Mintz, M.H. Kinetics and mechanisms of metal hydrides formation - a review. Journal of Alloys and Compounds 253-254, 529-541 (1997).
24. Xiong, Z., Hu, J., Wu, G., Chen, P., Luo, W., Gross, K., and Wang, J. Thermodynamic and kinetic investigations of the hydrogen storage in the Li-Mg-N-H system. Journal of Alloys and Compounds 398, 235-239 (2005).
25. Checchetto, R., Bazzanella, N., Miotello, A., Brusa, R.S., Zecca, A., and Mengucci, A. Deuterium storage in nanocrystalline magnesium thin films. Journal of Applied Physics 95, 1989-1995 (2004).
26. Checchetto, R., Miotello, A., Tosello, C., Principi, G., and Mengucci, P. Deuterium thermal desorption from FeAl thin films. Journal of Physics: Condensed Matter 14, 6307-6320 (2002).
27. Checchetto, R., Miotello, A., and Brusa, R.S. Deuterium effusion from nanocrystalline boron nitride thin films. Journal of Physics: Condensed Matter 13, 5853-5864 (2001).
28. Stern, A., Resnik, A., and Shaltiel, D. Thermal desorption spectra of the PdHx system in a powder form. Journal of Physics F: Metal Physics 14, 1625-1639 (1984).
29. Porschke, E., Shaltiel, D., Klatt, K.H., and Wenzl, H. Hydrogen desorption from tantalum with segregated oxide surface layers. Journal of Physics and Chemistry of Solids 47, 1003-1011 (1986).
30. Spulak, R. G. Thermal desorption of deuterium from tantalum films. Journal of the Less-Common Metals 153, L25-L29 (1989).
31. Gabis, I. E., Voit, A.P., Evard, E.A., Zaika, Y.V., Chernov, I.A., and Yartys, V.A. Kinetics of hydrogen desorption from the powders of metal hydrides. Journal of Alloys and Compounds 404-406, 312-316 (2005).
39
32. Rudman, P. S. Hydriding and Dehydriding Kinetics. Journal of the Less-Common Metals 89, 93-110 (1983).
33. Berlouis, L. E. A., Aguado, R., Hall, P.J., Morris, S., Chandrasekaran, L., and Dodd, S.B. Dehydriding kinetics of a Mg-9.5 wt% V sample studied by high pressure differential scanning calorimetry. Journal of Alloys and Compounds 356-357, 584-587 (2003).
34. Ares, J. R., Cuevas, F., and Percheron-Guegan, A. Microstructural effects in the hydrogenation kinetics of commercial-type LaNi5 alloy. Journal of Alloys and Compounds 404-406, 327-331 (2005).
35. Kircher, O., and Fichtner, M. Kinetic studies of the decomposition of NaAlH4 doped with a Ti-based catalyst. Journal of Alloys and Compounds 404-406, 339-342 (2004).
36. Fernandez, J. F. a. S., C.R. Simultaneous TDS-DSC measurements in magnesium hydride. Journal of Alloys and Compounds 356-357, 348-352 (2003).
37. Bloch, J. The kinetics of a moving metal hydride layer. Journal of Alloys and Compounds 312, 135-153 (2000).
38. Wang, X. L., and Suda, S. Kinetics of the hydriding-dehydriding reactions of the hydrogen-metal hydride systems. International Journal of Hydrogen Energy 17, 139-147 (1992).
39. Karty, A., Grunzweig-Genossar, J., and Rudman, P.S. Hydriding and dehydriding kinetics of Mg in a Mg/Mg2Cu eutectic alloy: pressure sweep method. Journal of Applied Physics 50, 7200-7209 (1979).
40. Pick, M. A., and Sonnenberg, K. A model for atomic hydrogen-metal interactions - application to recycling, recombination and permeation. Journal of Nuclear Materials 131, 208-220 (1985).
41. Davenport, J. W., Dienes, G.J., and Johnson, R.A. Surface effects on the kinetics of hydrogen absorption by metals. Physical Review B 25, 2165-2174 (1982).
42. Franz, A. J., Mavrikakis, M., and Gland, J.L. Hydrogen energetics in a-Si:H as determined by a combination of mean-field modeling and experimental evolution data. Physical Review B 57, 3927-3938 (1998).
43. Mavrikakis, M., Schwank, J.W., and Gland, J.L. A mean-field modeling study of the interaction between hydrogen and a palladium (110) single crystal. Journal of Chemical Physics 105, 8398-8403 (1996).
44. Mavrikakis, M., Schwank, W., and Gland, J.L. The effects of exposure time and pressure on the temperature-programmed desorption spectra of systems with bulk states. Surface Science 355, L385-L392 (1996).
45. Mavrikakis, M., Schwank, J.W., and Gland, J.L. Temperature programmed desorption spectra of systems with concentration gradients in the solid lattice. Journal of Physical Chemistry 100, 11389-11395 (1996).
46. Zaika, Y., Chernov, I., and Gabis, I. Modeling high-temperature TDS-spectra peaks of metal-hydrogen systems. Journal of Alloys and Compounds 404-406, 332-334 (2005).
40
47. Castro, F. J., Sanchez, A.D., and Meyer, G. Bulk effects in thermal desorption spectroscopy. Journal of Chemical Physics 109, 6940-6946 (1998).
48. Cuevas, F., and Hirscher, M. Hydrogen solubility and diffusivity in amorphous La14Ni86 films. Acta Materialia 51, 701-712 (2003).
49. Di Vece, M., and Kelly, J.J. Electrochemical study of hydrogen diffusion in yttrium hydride switchable mirrors. Journal of Alloys and Compounds 356-357, 156-159 (2003).
50. Majer, G., Gottwald, J., Peterson, D.T., and Barnes, R.G. Model-independent measurements of hydrogen diffusivity in the yttrium dihydrides. Journal of Alloys and Compounds 330-332, 438-442 (2002).
51. van der Molen, S. J., Welling, M.S., and Griessen, R. Correlated electromigration of H in switchable mirror YH3. Physical Review Letters 85, 3882-3885 (2000).

41
Distribution: 1 MS 0871 C.L. Renschler, 2720 1 MS 0335 J.P. Brainard, 2720 1 MS 0867 M.O. Eatough, 2725 1 MS 0867 J.F. Browning, 2725 1 MS 0335 J.M. Elizando-Decanini, 2725 1 MS 0867 L.I. Espada, 2725 5 MS 0867 R.M. Ferrizz, 2725 1 MS 0867 D.R. Kammler, 2725 1 MS 0335 S.T. Montgomery, 2725 1 MS 0335 T.W. Scofield, 2725 1 MS 0335 C.S. Snow, 2725 1 MS 0867 M.B. Ritchey, 2725 1 MS 0867 L.E. Pope, 2725 1 MS 0869 M.A. El, 2722 1 MS 0869 L.A. Walla, 2722 1 MS 0869 K.W. Meredith, 2722 1 MS 0869 L.C. Beavis, 2722 1 MS 0515 L.A. Paz, 2723 1 MS 0515 R.J. Stiers, 2723 1 MS 0862 C.C. Busick, 2701 1 MS 0855 S.H. King, 2701 1 MS 0335 B.H. Cole, 2701 1 MS 0871 R.J. Antepenko, 2736 1 MS 0871 H.C. Peebles, 2736 1 MS 0871 C.A. Mehrhoff, 2736 1 MS 0871 R. Ohlhausen, 2736 1 MS 0855 N.A. Lapetina, 2732 1 MS 0855 R.A. Roach, 2732 1 MS 1361 C.R. Tewell, 6754 1 MS 0435 R.J. Koss, 2122 1 MS 1245 R. Goeke, 2452 1 MS 1411 M.A. Rodriguez, 1822 1 MS 1415 R.R. Wixom, 1112 2 MS 9018 Central Tech. Files, 8944 2 MS 0899 Technical Library, 4536


![Tunable Erbium-Doped Fiber Lasers Using Various Inline Fiber … · 2016-02-18 · erbium-doped fiber lasers [4], distributed feedback fiber lasers [5], and Brillouin erbium-doped](https://img.pdfslide.us/doc/110x75/5f5d6d92d306cb22521e3c0b/tunable-erbium-doped-fiber-lasers-using-various-inline-fiber-2016-02-18-erbium-doped.jpg)