Embed Size (px)
Citation preview

ELECTROCHEMICAL HYDRIDE GENERATION AND ATOM TRAPPING ATOMIC ABSORPTION SPECTROMETRY FOR
DETERMINATION OF ANTIMONY
A THESIS SUBMITTED TO THE GRADUATE SCHOOL OF NATURAL AND APPLIED SCIENCES
OF MIDDLE EAST TECHNICAL UNIVERSITY
BY
�PEK MENEMENL�O�LU
IN PARTIAL FULFILLMENT OF THE REQUIREMENTS FOR THE DEGREE OF MASTER OF SCIENCE
IN
CHEMISTRY
JUNE 2004

Approval of the Graduate School of Natural and Applied Sciences
Prof. Dr. Canan Özgen
Director
I certify that this thesis satisfies all the requirements as a thesis for the
degree of Master of Science.
Prof. Dr. Hüseyin ��çi
Head of Department
This is to certify that we have read this thesis and that in our opinion it is fully
adequate, in scope and quality, as a thesis for the degree of Master of
Science.
Prof. Dr. O. Yavuz Ataman
Supervisor
Examining Committee Members Prof. Dr. R. Sezer Aygün (CHEM, METU)
Prof. Dr. O. Yavuz Ataman (CHEM, METU)
Prof. Dr. E. Hale Göktürk (CHEM, METU)
Prof. Dr. Mürvet Volkan (CHEM, METU)
Assist. Prof. Dr.Nusret Erta� (Gazi University)

I hereby declare that all information in this document has been
obtained and presented in accordance with academic rules and ethical
conduct. I also declare that, as required by these rules and conduct, I
have fully cited and referenced all material and results that are not
original to this work.
Name, Last name: �pek Menemenlio�lu
Signature :

iv
ABSTRACT
ELECTROCHEMICAL HYDRIDE GENERATION AND ATOM TRAPPING ATOMIC ABSORPTION SPECTROMETRY FOR DETERMINATION OF
ANTIMONY
Menemenlio�lu, �pek
M.S., Department of Chemistry
Supervisor: Prof. Dr. O. Yavuz Ataman
June 2004, 82 pages
Electrochemical hydride generation is a suitable alternative to common
hydride generation by NaBH4 which is widely used for the detection of
volatile elements such as As, Se, Sb, Sn, Bi, Ge, Te and Pb. In this study, a
thin-layer flow through electrochemical cell was designed. Lead and
platinum foils were employed as cathode and anode materials, respectively,
for the generation of antimony hydride. Argon was used as the carrier gas.
The inlet arm of the conventional quartz tube atomizer was used for on-line
preconcentration of generated hydrides. A portion of the inlet arm was
heated externally to the collection temperature for trapping the analyte
species which were generated electrochemically. For the revolatilization of

v
the trapped species, the trap was further heated to the revolatilization
temperature and hydrogen gas was introduced into the system 10 seconds
afterwards. The experimental operation conditions for electrochemical
hydride generation which include the acidities and flow rates of catholyte and
anolyte solutions, carrier gas flow rate and the applied electric current, were
optimized. For trapping, collection and revolatilization temperatures and
hydrogen flow rates were optimized. Analyses of standard reference
materials were performed to check the accuracy of the proposed method. 3�
limit of detections were found as 1.03 ng ml-1 and 0.053 ng ml-1 with and
without employing the trap, respectively. The trap has provided 20 fold
sensitivity improvement.
Keywords: Electrochemical Hydride Generation, Preconcentration, Atomic
Absorption Spectrometry, Quartz Trap, Sb

vi
ÖZ
ELEKTROK�MYASAL H�DRÜR OLU�TURMALI VE ATOM TUZAKLI ATOM�K ABSORPS�YON SPEKTROMETR� KULLANILARAK
ANT�MON TAY�N�
Menemenlio�lu, �pek
Yüksek Lisans, Kimya Bölümü
Tez Yöneticisi: Prof. Dr. O. Yavuz Ataman
Haziran 2004, 82 sayfa
Elektrokimyasal hidrür olu�turma As, Se, Sb, Sn, Bi, Ge, Te ve Pb gibi uçucu
elementlerin tayininde yaygın olarak kullanılan NaBH4 ile hidrür olu�turma
tekni�ine bir seçenek olarak sunulmu�tur. Bu çalı�mada ince tabakalı, akı�
sistemli elektrokimyasal hücre tasarlanmı�tır. Antimon hidrür olu�turmak için,
katot ve anot maddeleri olarak sırasıyla kur�un ve platin folyolar
kullanılmı�tır. Ta�ıyıcı gaz olarak sisteme argon gönderilmi�tir. Hat üzerinde
önzenginle�tirme için kuvars atomla�tırıcının giri� kolu kullanılmı�tır.
Elektrokimyasal olarak olu�turulan analit türlerinin tutulması için kuvars
atomla�tırıcının giri� kolu dı�arıdan ısıtılmı�tır. Tutulan türleri yeniden
buharla�tırmak için tuzak daha yüksek bir sıcaklık olan geri buharla�tırma

vii
sıcaklı�ına ısıtılmakta ve sisteme ısıtmanın ba�langıcından 10 saniye sonra
hidrojen akı�ı verilmektedir. Elektrokimyasal hidrür olu�turma parametereleri
olan katolit ve anolit çözeltilerinin asitli�i ve akı� hızları, ta�ıyıcı gaz akı� hızı
ve uygulanan elektrik akımı optimize edilmi�tir. Tuzak için ise, toplama ve
geri buharla�tırma sıcaklıkları ve hidrojen akı� hızı optimize edilmi�tir.
Önerilen metodun do�rulu�unu ölçmek için standart referans maddelerin
analizi yapılmı�tır. 3� tayin limiti tuzaksız ve tuzaklı olarak sırasıyla 1.03 ng
ml-1 ve 0.053 ng ml-1 olarak bulunmu�tur. Tuzak kullanılarak duyarlılıkta 20
kat artı� elde edilmi�tir.
Anahtar Kelimeler: Elektrokimyasal Hidrür Olu�turma, Önzenginle�tirme,
Atomik Absorpsiyon Spektrometri, Kuvars Tuzak, Sb

viii
To my family,

ix
ACKNOWLEDGEMENTS
I wish to express my gratitude to my supervisor Prof. Dr. O. Yavuz Ataman
for his guidance, encouragement and understanding throughout the
research.
I am deeply grateful to Dr. Deniz Korkmaz for her endless help, guidance
and contribution in every part of this study.
I would like to thank to Dr. Oktay Cankur and Ça�la Pınar Öztürk for their
help and support.
I offer special thanks to O�uz Özgiller for his understanding, patience and
the support he has given to me.
Finally, I would like to thank my sister Dilek and my parents for their endless
understanding, patience, encouragement and support.
x
TABLE OF CONTENTS
ABSTRACT………………………………………………………………..
iv
ÖZ…………………………………………………………………………..
vi
DEDICATION……………………………………………………………..
viii
ACKNOWLEDGEMENTS…………………………………………….....
ix
TABLE OF CONTENTS.…………………………………………………
x
LIST OF TABLES…………………………………………………………
xiii
LIST OF FIGURES………………………………………….…………....
xiv
CHAPTER
1. INTRODUCTION……………………………………………………
1
1.1 Atomic Absorption Spectrometry……………………….…….
1
1.1.1 Flame Atomic Absorption Spectrometry…………………..
1
1.2 Atom Traps for Flame Atomic Absorption Spectrometry……
2
1.2.1 Slotted Quartz Tube……………….……………..........
2
1.2.2 Water-Cooled Silica Trap………………..………….....
3
1.2.3 Water-Cooled Silica Trap Combined with Slotted Quartz Tube……………………………………………..
3
1.2.4 Slotted Quartz Tube as an Atom Trap………………..
4
1.3 Hydride Generation……...…………………………………….. 1.3.1 Hydride Generation and Atom Traps………………….
5
8

xi
1.4 Electrochemical Hydride Generation…………………………
9
1.4.1 Advantages and Disadvantages of ECHG…………...
10
1.4.2 Electrode Materials……………………………………..
12
1.4.2.1 Reactions on the Cathode Surface………..
12
1.4.2.2 Pre-treatment of the Cathode Surface……
13
1.4.3 Electrochemical Hydride Generators
13
1.4 Interferences..………………………………………………….
14
1.4.1 Interferences in Chemical Hydride Generation……..
14
1.4.2 Interferences in ECHG…………………………………
15
1.5 Determination of Antimony …………………………….……
17
1.6 Aim of the Study………………………………………………
20
2. EXPERIMENTAL…………………………………………………….
21
2.1 Chemicals………………………………………...……………
21
2.2 Apparatus and Materials……………………………………..
21
2.3 Atomic Absorption Spectrometer……………………………
22
2.4 Electrochemical Cell………………………………………….
23
2.5 Electrochemical Hydride Generation System……………...
24
2.6 Trap System…………………………………………………...
26
2.7 Experimental Procedure……………………………………...
28
2.8 Accuracy Check……………………………………………….
32
3. RESULTS AND DISCUSSION…………………………………….
33
3.1 Optimization of Experimental Operation Conditions in ECHG ………………………………………………..............
34
3.1.1 Optimization of Anolyte Acidity ………..................... 34
xii
3.1.2 Optimization of Catholyte Acidity.............................
35
3.1.3 Optimization of Anolyte Flow Rate…………………..
35
3.1.4 Optimization of Catholyte Flow Rate………………...
36
3.1.5 Optimization of Carrier Gas Flow Rate……………... 37 3.1.6 Influence of Applied Electric Current………………...
38
3.2 Determination of Sb (V) by ECHG………………………….
39
3.3 Analytical Figures of Merit…………………………………..
40
3.4 Comparison of Electrochemical Hydride Generation and Chemical Hydride Generation………………………….……
41
3.5 Efficiency of Electrochemical Hydride Generation………..
43
3.6 Optimization of Trap Conditions…………………………….
43
3.6.1 Optimization of Collection and Revolatilization Temperatures…........................................................
44
3.6.2 Influence of the Time Period between Turning the
Heat on and Introducing H2 flow at Revolatilization Step……...................................................................
45
3.6.3 Optimization of Hydrogen Flow Rate………………..
46
3.7 Effect of Collection Time on the Absorbance Signal……..
48
3.8 Determination of Sb (V) with the Quartz Trap…………….
49
3.9 Quartz Trap Leached in HF…………………………………
50
3.10 Analytical Figures of Merit…………………………………
50
3.11 Interference Studies………………………………………..
52
3.12 Analysis of Standard Reference Materials………………. 57
4. CONCLUSIONS……………………………………………………..
58
REFERENCES…………………………………………………………. 60

xiii
LIST OF TABLES
TABLES 2.1 The relation between the applied voltage and the trap
temperature…………………………………………………………… 3.1 Absorbance Signals for Sb (III) and Sb (V) mixtures……………... 3.2 Comparison of Chemical and Electrochemical Hydride
Generation Tecniques……………………………………………….. 3.3 Comparison of Results for Sb with Different ECHG Systems……
28
41
44
54
3.4 Results of the analysis of standard reference materials………….
59

xiv
LIST OF FIGURES
FIGURES
2.1 Scheme of the electrochemical flow through cell…………………
23
2.2 Scheme of the electrochemical hydride generation system……..
25
2.3 Scheme of the quartz t-tube used as trap…………………………
26
2.4 Temperature inside the trap after increasing the trap voltage from 2.2 V (400 oC) to 6.6 V (1030 oC)…………………………….
2.5 Collecting SbH3 in silica trap………………………………………... 2.6 Flow chart for the trap process……………………………………...
28
30
31
3.1 Optimization of anolyte acidity………………………………………
34
3.2 Optimization of catholyte acidity…………………………………….
35
3.3 Optimization of anolyte flow rate……………………………………
36
3.4 Optimization of catholyte flow rate………………………………….
37
3.5 Optimization of carrier gas flow rate………………………………..
38
3.6 Influence of the applied electric current on the absorbance signal…………………………………………………………………..
39
3.7 Calibration plot for electrochemical hydride generation of Sb…...
41
3.8 Calibration plot for chemical hydride generation of Sb…………...
42
3.9 Influence of collection and revolatilization temperatures………… 45

xv
3.10 Influence of time period between turning the heat on and introducing H2 flow at revolatilization step………………………
46
3.11 Optimization of H2 flow rate………………………………………..
47
3.12 The typical signal shape observed for 1.5 ng Sb………………..
48
3.13 Peak height absorbance values for different collection times….
49
3.14 Calibration plot for collection of hydrides………………………… 3.15 Interference of arsenic, selenium, tin and lead on
electrochemical hydride generation without trap………………
51
53
3.16 Interference of arsenic, selenium, tin and lead on electrochemical hydride generation with trap………………….
54
3.17 Interference of nickel, copper, cobalt and iron on electrochemical hydride generation without trap………………
55
3.18 Interference of nickel, copper, cobalt and iron on electrochemical hydride generation with trap………………….
56

1
CHAPTER I
INTRODUCTION
1.1 Atomic Absorption Spectrometry
Atomic absorption spectrometry (AAS) is based on the absorption of
electromagnetic radiation by neutral, ground state atoms produced by an
atomizer. This technique has become the most widely used single-
element technique for the determination of metals [1]. In 1955, Walsh [2]
introduced hollow cathode light sources, flame atomizers and a
modulated system and showed that the system works as a quantitative
analytical tool. Flame AAS was accepted as an analytical technique in
1960s after the introduction of the first commercial flame atomic
absorption spectrophotometer in 1959. Since then, the technique has
been widely used as it provides high sensitivity, accuracy and precision.
1.1.1 Flame Atomic Absorption Spectrometry
In flame AAS, a solution of the sample is nebulized by a flow of gaseous
oxidant, mixed with a gaseous fuel, and carried into a flame where
atomization occurs [3]. The analyte atoms pass rapidly and continuously
through the measurement zone while the solution is being aspirated and
2
only the equilibrium concentration of the atoms are measured; the
residence time of the analyte atoms in the optical path is around 0.1 ms
which limits the sensitivity of flame AAS. Sensitivity of the system also
depends on the nebulization efficiency which is the ratio of the sample
reaching the flame to the amount of sample introduced to nebulizer [4].
Several techniques have been reported to improve the sensitivity of flame
atom cells. These techniques involve two mechanisms. In the first one,
employing long-tube absorption cells, a Delves’ cup [5] or a slotted-tube
atom trap, the time spent by ground-state atoms in the optical path of the
spectrophotometer is increased. In the other technique, the analyte is
preconcentrated and then released for atomization in a more
concentrated form, which produces a transient signal (in-situ atom
trapping) [6, 7, 8].
1.2 Atom Traps for Flame Atomic Absorption Spectrometry
In the atom traps for flame AAS, the primary concept is in situ
preconcentration of analyte atoms in the body of the flame; by this way
higher population of the analytes would be available for atomic absorption
measurements and preconcentration could be achieved without the
usage of additional chemicals. Several traps have been developed to
provide this.
1.2.1 Slotted Quartz Tube
The slotted quartz tube was first utilized by Watling [9] who has placed a
heated slotted quartz tube with two slots at 1200 to each other on the
conventional flame. The sensitivities of the elements Ag, As, Bi, Cd, Sb,

3
Se, Sn and Pb were increased by 2-5 fold. It is thought that the increased
sensitivity is due to the reduced flame speed, longer optical path and the
increased lifetime of free analyte atoms in the flame [10]. In addition to
obtaining an increase in sensitivity, the precision is also increased.
1.2.2 Water-Cooled Silica Trap
This technique was developed by Lau et al. [11] by placing a water
cooled silica tube with 4 mm o.d. and 3 mm i.d. on an air-acetylene flame.
A sample solution is aspirated for a measured time interval and after the
aspiration is stopped, water flow through the tube is replaced by air.
Rapid heating of the silica tube is achieved and the trapped analyte
species are released into the beam of the hollow cathode lamp.
Consequently, a peak shaped analyte signal is obtained. This type of trap
increased the sensitivity of the determination of volatile elements by 8-40
times [12].
Coating of the silica surface with aluminum or vanadium oxides improved
the reproducibility in the determination of As, Cd, Pb, Se and Zn and also
increased the lifetime of the silica trap tube [13].
1.2.3 Water-Cooled Silica Trap Combined with Slotted Quartz Tube
Erta� [14] introduced the trap system which is a combination of a water-
cooled trapping system and the slotted quartz tube. The sensitivities for
Pb and Cd were increased 50-200 times by positioning a slotted quartz
tube and double slotted quartz tubes on the water-cooled atom trap. This
increase is attributed to the increase in the residence time of the analyte
atoms in the optical path.

4
Another trap designed by Matusiewicz [15] is composed of a slotted tube
atom trap with a water-cooled silica tube trap passing through it. In this
study, determination of Ag, Cd, Cu, Fe, In, Pb, Tl and Zn in beer was
performed.
1.2.4 Slotted Quartz Tube as an Atom Trap
Huang et al. [16] utilized the slotted quartz tube for preconcentration of
the analyte atoms. The slotted quartz tube is placed directly above the
flame with the narrower slot at the bottom. At a fixed collection time the
sample solution is aspirated and preconcentration is achieved. Flame
conditions are altered to atomize the preconcentrated atoms. 70-270 fold
increase compared to conventional flame AAS was achieved for volatile
elements.
Erta� et al. [7] investigated the analytical performance of three trap
systems for determination of Cd and Pb in water samples. Water-cooled
U-shaped silica trap, water-cooled U-shaped silica trap combined with a
slotted silica tube and the slotted silica tube trap were investigated in the
study. In the first trap design, the water-cooled U-shaped silica tube is
centered on the flame and the sample solution is aspirated for a
deliberate time interval to trap the analyte species. Analyte aspiration is
stopped; the silica tube is allowed to heat up by removing the cooling
water by a blast of air and consequently the trapped species were
released into the optical path of the spectrometer and the signal is
measured. In the second trap design which is the combination of water-
cooled U-shaped silica trap and slotted silica tube, the analyte atoms are
preconcentrated on the water-cooled U-shaped silica tube surface and
the trapped species are atomized by changing the flame conditions.
During this procedure, water passes through the tube continuously. In

5
slotted tube trap, the sample solution is aspirated for a measured time
interval and the analytes are collected on the inner surface of the slotted
silica tube. Flame conditions are changed and the atomization of the
trapped species is provided. Investigation of these trap systems have
shown that the slotted silica tube trap which provided 137 and 90 fold
increase in the sensitivities of Cd and Pb respectively is the most
sensitive, effective and simplest device among these three traps.
1.3 Hydride Generation
Hydride generation (HG) is the most widely used gas phase sample
introduction technique in atomic spectroscopy for the determination of the
analytes with ions that can readily be converted into stable hydride
derivatives and transferred into an excitation source in that form. The
technique is limited to a small number of elements, which include arsenic,
antimony, bismuth, germanium, lead, selenium, tellurium and tin. These
elements can form their covalent hydrides (AsH3, SbH3, BiH3, GeH4,
PbH4, H2Se, H2Te and SnH4) in the reaction performed in acidic media
and in the presence of a reducing agent. Although the number of the
elements is limited, HG is a valuable technique for the determination of
very low levels of these elements.
Hydride generation was first used as sample introduction technique in
atomic spectrometry in 1969 by Holak [17] to determine arsenic. Braman
et al. [18] used sodium tetrahydroborate (NaBH4) as the reducing agent
in the reaction of arsine generation in 1972. In 1978, Thompson and co-
workers used ICP-AES for determination of arsenic, antimony, bismuth,
selenium and tellurium, with their hydrides being generated in the
reaction with NaBH4 in a continuous flow-reaction system. Since 1978,
HG has been studied extensively. Different aspects of the analytical
6
capabilities of the HG reaction with respect to speciation analysis and
multielement determinations are being investigated and also procedures
for eliminating the interferences are being developed. Nowadays, HG is
conveniently used for introducing As, Bi, Sb, Pb, Se, Te or Sn into
different atomizers of atomic absorption spectrometry (AAS) and into
excitation sources of atomic emission spectrometry (AES) [19].
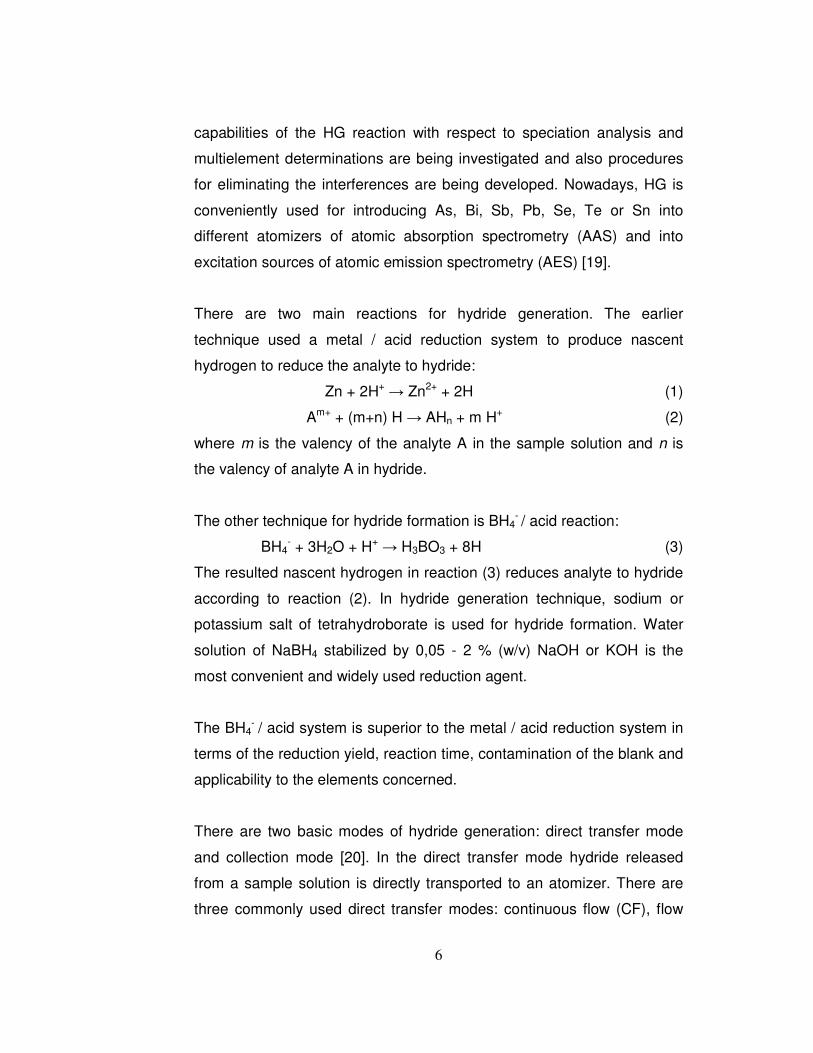
There are two main reactions for hydride generation. The earlier
technique used a metal / acid reduction system to produce nascent
hydrogen to reduce the analyte to hydride:
Zn + 2H+ � Zn2+ + 2H (1)
Am+ + (m+n) H � AHn + m H+ (2)
where m is the valency of the analyte A in the sample solution and n is
the valency of analyte A in hydride.
The other technique for hydride formation is BH4- / acid reaction:
BH4- + 3H2O + H+ � H3BO3 + 8H (3)
The resulted nascent hydrogen in reaction (3) reduces analyte to hydride
according to reaction (2). In hydride generation technique, sodium or
potassium salt of tetrahydroborate is used for hydride formation. Water
solution of NaBH4 stabilized by 0,05 - 2 % (w/v) NaOH or KOH is the
most convenient and widely used reduction agent.
The BH4- / acid system is superior to the metal / acid reduction system in
terms of the reduction yield, reaction time, contamination of the blank and
applicability to the elements concerned.
There are two basic modes of hydride generation: direct transfer mode
and collection mode [20]. In the direct transfer mode hydride released
from a sample solution is directly transported to an atomizer. There are
three commonly used direct transfer modes: continuous flow (CF), flow
7
injection (FI) and batch. Continuous flow hydride generation is the most
popular mode of hydride generation. In this mode, a sample solution and
a tetrahydroborate solution at constant flows are mixed; a purge gas is
introduced into this mixture. Then, the liquid and the gas are separated in
the gas-liquid separator. There are two outlets of the gas-liquid separator;
one of these is for the gaseous hydride with hydrogen and purge gas flow
to the atomizer and the other one is for the liquid effluent drained. In the
flow injection mode the experimental arrangement is similar to CF mode,
the main difference is that instead of the sample flow as in the continuous
flow a constant flow of carrier acid is used. A certain volume of the
sample is injected and subsequently dispersed into the carrier stream. In
the batch mode, first a batch of acidified sample solution and then the
reducing agent (mostly tetrahydroborate solution) are placed inside a
batch generator which is a vessel made of glass or plastic serving both
as the reactor and the gas-liquid separator. After this, the purge gas flow
is introduced to improve stripping the hydride out of the reaction mixture.
Released hydride and the hydrogen formed from the decomposition of
the reducing agent are supported by the purge gas flow to the atomizer.
The batch mode has lost its popularity with the development of CF and FI
modes.
In the collection mode, the hydride is trapped in a collection device until
the generation is completed and then transported to an atomizer at once.
In this mode, after the hydride evolution has been finished the collected
hydride can be atomized by two different ways. In the first one, the
collected hydride is released from the collection device and transported to
the atomizer on line, and in the second way it can be stored and
atomized off line. There are also two ways of hydride collection. In the
first way the released hydride is bubbled from the reaction mixture into an
absorbing solution and in the second way it is collected in a closed vessel
under pressure or in a cold trap [20].

8
The principal advantages of the hydride generation technique include;
providing chemical preseparation of the analyte from possible matrix
interferents, being a more efficient sample introduction system than
conventional pneumatic nebulization, obtaining low limit of detections and
applicability to inorganic and/or organic speciation (As, Ge, Sb, Se, Sn
and Te). On the other hand, it is prone to interferences by concomitants
which reduce the efficiency of the technique, and the rate of hydride
generation can be kinetically controlled and slowed in cases which
necessitate collection apparatus prior to introduction of the hydrides to
the source or atom cell and also in this technique the oxidation state of
the analyte of interest may be critical as in the case of Sb (III) and Sb (V)
[21].
1.3.1 Hydride Generation and Atom Traps
The trapping of volatile analyte species on heated surfaces is well known
and is one of the most popular techniques in atomic spectrometry. The
hydride forming elements can be trapped in graphite tubes or on
platforms, which are coated with modifiers or uncoated, on silica surfaces
and tungsten coils or tubes.
A novel silica trap for lead determination by hydride generation atomic
absorption spectrometry was proposed by Korkmaz [6], who has used
externally heated silica tubing as the trapping medium. The Pb species
were trapped at 500 0C and released at 750 0C. For a trapping period of
60 seconds, the limit of detection was found as 19 ng ml-1.
Guo and Guo [22] collected SeH2 on gold wire that was heated to 200 0C
and released the trapped species by heating the trap to 600 0C. The gold
wire was placed in the inlet arm of the quartz tube atomizer. The use of

9
tungsten coil for on-line preconcentration of bismuthine formed by NaBH4
reduction was studied by Cankur [23]. The hydrides were trapped on a
tungsten coil previously heated to 270 0C and revolatilized by increasing
the coil temperature to 1200 0C and by using a mixture of argon and
hydrogen the revolatilized species were transported to the quartz T-tube.
Employing this trap, a limit of detection of 0.0027 ng ml-1 was obtained
with 18 ml of sample volume.
In another study by Korkmaz [8] a quartz tube was proposed for
collecting SbH3. A 0.8 mm Ni-Cr wire with a resistance of 1 � was coiled
around a 40 mm quartz tube and that tube was connected to the inlet arm
of the atomizer by Tygon® tubing. Voltage was applied to heat the wire
and subsequently the quartz tube. The analyte species were collected at
the collection temperature and then revolatilized at the revolatilization
temperature by introducing hydrogen gas flow into the tube. Using this
trap, a detection limit of 3.9 pg ml-1 was obtained for a collection time of
120 seconds (8 ml sample).
1.4 Electrochemical Hydride Generation
Generation of the volatile hydrides of As, Se, Sb, Sn, Ge, Pb, Bi and Te
electrochemically is an example of electrolytic sample pre-treatment in
trace element analysis. It has the advantage of nearly 100% sample
introduction compared to solution nebulization which is 5-10%. Further
advantages of the technique include having increased sensitivity
following removal of interfering elements of the sample matrix and
collecting the hydrides to achieve even a higher sensitivity [24].
Electrochemical hydride generation (ECHG) was introduced to atomic
spectroscopy in the batch arrangement by Rigin [25] to reduce As and Sn

10
to the hydrides in alkaline media for detection by atomic absorption and
atomic fluorescence. In their study, a discontinuous electrolytic hydride
generation system (batch generator) with platinum or lead spiral cathode
was used. Chen and Han [24] used a simple batch generator with a
platinum cathode and observed the influence of the acidity of the
electrolyte, the current and the carrier gas flow on the absorbance signal.
The first thin-layer flow through electrochemical cells were developed by
Brockman [26,27] et al. and Lin and co-workers [28, 29, 30] to combine
the advantages of flow injection analysis and the electrochemical hydride
generation technique. In the flow injection arrangement, catholyte and
anolyte solutions are pumped at continuous flows through cathode and
anode channels of an electrolytic flow cell respectively. The sample is
injected into the catholyte stream which is used as a carrier. In the
continuous flow mode, the sample is in the catholyte solution and it flows
through the cathode channel continuously. In both of these modes the
hydrides and hydrogen, formed at the cathode compartment are
separated from the waste solution in a subsequent gas-liquid separator
using a purge gas flow [20].
Electrochemical hydride generation technique was developed as an
alternative to the original chemical generation technique because it has
several advantages compared to the chemical approach.
1.4.1 Advantages and Disadvantages of ECHG
Electrochemical hydride generation relieves the use of sodium
tetrahydroborate in acidic media as the reduction system that is
commonly used in chemical hydride generation. This technique can also
be performed in alkaline media. NaBH4 is an expensive reagent which is
considered as a potential source of contamination and also unstable in

11
solution form and has to be freshly prepared each working day. Using
ECHG technique with a flow injection hydride generator, low consumption
of expensive, high purity acids and sample as well as a high sample
throughput and automation can be achieved. It does not depend on the
oxidation state of the analyte when using cathode materials with high
hydrogen overvoltage like Pb or amalgamated Ag. The interferences in
the solution phase by matrix elements, like Fe, Cu, Ni, Co etc., and in the
gas phase by other hydride forming elements can be reduced (dependent
on the cathode material used) compared to chemical hydride generation.
This technique is appropriate to speciation analyses such as the
speciation of inorganic arsenic and selenium or the determination of
arsenic in different oxidation states. Speciation can be done by choosing
the cathode material according to its influence on the analyte oxidation
state. For example, for the speciation of Sb (V) and Sb (III) glassy carbon
or fibrous carbon electrodes can be employed as both of these electrodes
are selective to Sb (III) but not to Sb (V). On the other hand, there are
some problems in ECHG. Solid electrode surface must be reproducible
therefore the cathode surface should be conditioned daily, before
changing the sample type or when the signal does not return to baseline.
Dependent on the cathode material and operating parameters, the
formation of hydrides can be negatively or positively affected; transition
metal ions which are reduced and deposited on the cathode surface
interfere with the hydride formation. The deposition of these metals alters
the cathode surface physico-chemically and changes the hydrogen
overvoltage and consequently a depression of the analytical signal can
be observed [24].

12
1.4.2 Electrode Materials
The electrodes used in ECHG should not become involved in chemical or
electrochemical reactions that take place at their surfaces. Generally
employed cathode materials include Pd wire, Pt foils (0.025mm thick) or
Pt sheets, Pt wire, Pt covered Ag wool, Ag foil, Ag wool, Ag wire,
amalgamated Ag foil, Cu cuttings, Cu powder, polished vitreous carbon,
reticulated and crushed vitreous carbon, fibrous carbon, pyrolytic
graphite, Pb covered fibrous carbon, Pb sheet (1mm thick), Pb wire, Mo
sheet, Cd sheet. Because of their inertness to the sample matrix, the
most useful cathode materials are carbon in its different forms and Pb.
The only disadvantage for Pb cathode is its being susceptible to
interferences by some matrix elements at higher concentrations and the
carbon cathode needs a pre-reduction step. As an anode material
generally platinum foils are used because of their inertness against the
permanent formation of oxygen in the anodic half cell [24].
1.4.2.1 Reactions on the Cathode Surface
Generation of hydrides on the surface of the cathode is a three step
reaction: deposition of the hydride forming elements on to the surface of
the cathode and their reduction; formation of the hydrides; desorption of
the hydrides. Before hydrogenation can take place, the hydride forming
element has to be deposited on the cathode surface. The deposition is
connected with the reduction of analyte in the acidified solution which is a
charge transfer reaction [24].
The processes involved in electrochemical hydride generation can be
summarized by the following overall reactions:
Me + X +n e- � Me-X (4)

13
Me-X + m e- + m H3O+ � Me-XHm + H2O (5)
Me-XHm � Me + XHm � (6)
where Me is the cathode surface, X the hydride forming element and the
source of hydrogen can be the hydronium ion or water [31].
Simultaneously, water is reduced to hydrogen on the cathode whereas it
is oxidized in the separated anodic chamber and oxygen is formed [21].
1.4.2.2 Pre-treatment of the Cathode Surface
Pre-treatment of the cathode surface should be done to enhance
repeatability. Two procedures are given in the literature; chemical one
using chromic-sulfuric acid or hot nitric acid and the electrochemical one
by anodic polarization. The most simple and useful procedure to clean
the surfaces of Pb and Cd cathodes is treating them with semi-
concentrated hot nitric acid for a few seconds and subsequent rinsing
[24].
1.4.3 Electrochemical Hydride Generators
The electrochemical hydride generators are generally composed of three
components: a flow system, the electrochemical cell and a gas-liquid
separator.
The flow system is employed for the transport of the electrolyte and the
sample solutions. The electrochemical cell is the primary part of the
electrochemical hydride generators. It is also composed of three parts:
anode chamber, cathode chamber and an ion-exchange membrane. The
hydrides are produced in the cathode chamber on the surface of the

14
cathode. The ion-exchange membrane separates the anode and cathode
chambers physically and prevents the diffusion of anode products into the
cathode chamber. The hydrides and the excess of hydrogen are rinsed
out of the electrochemical cell with the catholyte and separated from the
aqueous solution in the gas-liquid separator and swept into the atomizer
with an auxiliary carrier gas stream [24].
1.4 Interferences
In atomic absorption spectrometry two types of interferences are
observed; spectral and nonspectral. Spectral interferences are observed
due to radiation absorbed by species other than free atoms of the analyte
and nonspectral interferences are due to the influence of sample
constituents on the analyte signal.
Hydride generation atomic absorption spectrometry is less prone to
spectral interferences than conventional liquid sampling atomic
absorption spectrometry as the analyte is separated from the matrix [20].
1.4.1 Interferences in Chemical Hydride Generation
The main limitation of the chemical generation of volatile hydrides with
tetrahydroborate is the interferent effects of inorganic compounds.
Inorganic interferents are divided into three groups: i) strong oxidants; ��)
ions of transition and noble metals; and iii) other species including ions of
other hydride forming elements. Three mechanisms have been
suggested to explain the effects of these elements: tetrahydroborate
depletion; formation of insoluble species between the interferent ion and
the analyte after the hydride has formed; and decomposition of hydrides

15
on metal borides, or on colloidal metals formed by the reduction of the
interferent ion [32]. The tetrahydroborate depletion mechanism is based
on the competition between interferent ions and the analyte for reduction
by tetrahydroborate and it was first suggested by Pierce et al. [33]. Meyer
et al. [34] suggested the formation of insoluble species between the
interferent ion and the hydride. Welz and Melcher [35] first supported the
idea for this mechanism but later on they proposed that this mechanism
was overwhelmed by the decomposition of hydrides on colloidal metals
and this decomposition was effective at lower interferent ion
concentrations [36]. Smith [37] proposed that the interferences in
chemical hydride generation were based on the reduction of the
interferent ion to its metallic form and the co-precipitation of the analyte or
adsorption and decomposition of the hydride formed. Kirkbright et al. [38]
attributed the interferences to the adsorption and decomposition of the
hydride by the dispersed elemental forms of the interfering ions.
1.4.2 Interferences in Electrochemical Hydride Generation
Electrochemical hydride generation suffers from the same kinds of
interferences as chemical generation. The tolerance limits are different
than those of chemical hydride generation and are dependent on the
cathode material employed in the electrochemical cell. As the reactions
take place on the cathode surface in electrochemical hydride generation,
the interferent effects from concomitant species are related with the
available surface of the cathode, the residence time of the reducible
species in the cathode compartment and the concentration of the
concomitant species. Reducible species on the cathode include: the
analyte; protons from the acid; and interferents. When the reduction
products of the interferent are gases or soluble species, the nature of the
cathode surface is not modified and the interference mechanism is the

16
competition of the interferents and the analyte species for available
reduction sites on the cathode. If reduction products are solid species,
such as transition metals, they can be deposited on the cathode surface,
modify its nature, and/or pass to the catholyte and act as liquid phase
interferences. The interferences from different elements are related to
their standard potentials [E0(Mn+/M0)]. Therefore, the elements with
positive standard potentials, such as copper and platinum can be easily
reduced in an acidic medium to their metallic forms, whereas those with
negative potentials, such as zinc, cannot be reduced.
The interferences in electrochemical hydride generation can be controlled
by selecting the cathode material and the generation conditions. For
example, lead and reticulated vitreous carbon electrodes show different
performance and behavior with respect to interferences. Under the
hydride generation conditions used, interfering ions reduced to metals are
deposited on the lead surface; on the other hand, the surface of the
reticulated vitreous carbon electrode surface does not change [32].
The effect of interfering species for the determination of arsenic by
electrochemical hydride generation was first studied by Sand and
Hackford [39], they observed that the presence of Cu (II), Fe (II), Sn (IV),
Hg (II) and Ni (II) decreased the electrode efficiency and there were no
interferences from organic substances. Using a batch electrolytic hydride
generator Rigin et al. [25, 40, 41] observed that the presence of Cu (II)
and Au (III) had a negligible effect on arsine signal using NaOH as the
electrolyte and related this observation with the immediate precipitation of
the metal ions as insoluble hydroxides in the cell. Employing platinum
cathode in flow injection mode, Lin et al. [28] investigated the effects of
several interferent species for the determination of hydrogen selenide
and concluded that interferences were significant for Cu (II), Ag (I), Sb
(III) and Bi (III). Brockmann [27] investigated the influence of Ni (II) and

17
Co (II) on hydrogen selenide and arsine generation with a platinum
cathode in flow injection mode and observed no interferent effect. Hueber
and Winefordner [49] observed a large interference effect of Cu (II), Pt (II)
and Au (III) on arsine and hydrogen selenide generation. They also
investigated the effect of Sb (III) and observed that Sb (III) showed an
interfering effect on the generation of both hydrides. Schaumlöffel and
Neidhart [42] observed that Cr (III), Co (II), Ni (II) and Cu (II) led to a
depression of the absorbance signal in arsine generation in flow injection
mode with a fibrous carbon cathode. The interference of copper and
nickel on electrochemical generation of arsine, stibine and hydrogen
selenide using lead, pyrolytic graphite, vitreous carbon and platinum as
cathode materials was studied by Ding and Sturgeon [43]. With the
stibine generation they observed 50% and 80% signal suppressions in
the presence of 7.5 mg l-1 copper and 10 mg l-1 nickel respectively. Bolea
et al. [32] studied the interferences of Cu (II), Zn (II), Pt (IV) and nitrate on
electrochemical hydride generation of hydrogen selenide with lead and
reticulated vitreous carbon electrodes. They observed signal
suppression up to 60 and 75% for lead and reticulated vitreous carbon
electrodes respectively, at Se/NO3- ratios 1:1000. No interference of Zn
(II) up to Se/Zn ratios 1:1000 was observed. Copper and platinum
showed suppression levels up to 50% for Se/interferent 1:100. Using
reticulated vitreous carbon electrodes total signal suppression was
observed in the presence of Se/Cu ratios 1:100.
1.5 Determination of Antimony
Antimony is a silvery-white metal that makes up about 2/107 of the earth’s
crust. It is sometimes found free in nature but mainly occurs as Sb2S3
(stibnite, antimonite) and Sb2O3 (valentinite). These two compounds are
found in ores of silver, copper and lead.

18
Antimony has been known since ancient times. Its property of dissolving
metals such as gold was used for purifying gold from copper and silver
until the 18th century. The presence of antimony increases the hardness
and mechanical strength of lead. Batteries, antifriction alloys, type metal,
cable sheathing and minor products use about half the metal produced.
The other half are found as the oxides, sulfides, and sodium antimonite
and antimony trichloride. Antimony trioxide, Sb2O3, is used in
manufacturing flame-proofing compounds, paints, ceramic enamels,
glass and pottery. Antimony tetroxide, Sb4O8, is mainly used as an
oxidation catalyst [44].
Antimony is an accumulative toxic element that is released to the
environment from natural sources and from industry. It has been detected
in natural waters at ultratrace levels. U.S. Environmental Protection
Agency (EPA) considers it a priority pollutant and allows 0.006 parts of
antimony per millions of drinking water (0.006 ppm). In polluted waters
concentrations are in the ng l-1 range. Two inorganic forms, Sb (III) and
Sb (V), and two organic species, methylstibonic acid [(CH3)SbO(OH)2]
and dimethylstibinic acid [(CH3)2SbO(OH)] , have been detected in
natural water sources. The toxicity and biological behavior of the element
depends on its oxidation state; Sb (III) is 10 times more toxic than Sb (V),
which is why the determination of antimony species is essential for
environmental studies [45].
Hydride generation-atomic absorption spectrometry has been the most
widely used technique to determine antimony species, especially
inorganic ones. The first work on the determination of antimony in
aqueous solution by stibine generation using NaBH4 as a reducing agent
was presented by Braman et al. [18]. Fernandez [46] coupled hydride
generation technique with atomic absorption spectrometry and this
method has been applied for the determination of total antimony and also

19
to differentiate between Sb(III) and Sb (V). Nakashima et al. [47]
presented selective determination of Sb (III) and Sb (V) by pH-control at
the ng/L level in water samples. Andreae et al. [48] observed that in the
pH range 1 to 7, Sb (III) is reduced at constant yield and no Sb (V)
reduction took place at pH 6-7. Using this fact, he made the selective
determination of Sb (III) at near-neutral pH.
Electrochemical hydride generation is another technique which is also
commonly used for the determination of inorganic antimony species.
Hueber and Winefordner [49] constructed a flowing electrolytic hydride
generator for sample introduction in atomic spectrometry and investigated
the effect of cathode material form on electrochemical hydride generation
for As, Se and Sb. Their electrochemical cell consisted of a cathode flow
cell immersed in an electrolytic solution. A cylindrical container which also
contains the anode, held the cathode flow cell and the electrolytic
solution. A platinum mesh with a surface area of 18 cm2 was used as the
anode material and coils of silver, platinum, lead and palladium wires
were investigated as cathode materials. For the generation of SbH3, lead
cathode gave the largest signal. They have obtained a sensitivity
increase of 11-18 times over pneumatic nebulization. Ding and Sturgeon
[50] developed a continuous flow electrochemical hydride generation
system for the determination of total antimony in river water and sea
water by electrothermal atomic absorption spectrometry. Their cell had a
plexiglas body which consisted of cathode and anode blocks. Silicone
gaskets were placed between the two blocks to prevent leakage and an
ion exchange membrane was used to isolate the cells physically. Lead
and platinum were used as cathode and anode materials respectively.
The generated hydride was trapped in a Pd-coated graphite furnace and
by using 2 ml sample volumes an absolute limit of detection of 45 pg and
a concentration limit of detection of 0.02 �g l-1 was obtained. In another
study by Laborda [51] a tubular electrolytic-flow through cell where the

20
cathode and anode spaces have a concentric configuration was
employed. It consisted of a central cathode made of reticulated vitreous
carbon inside a porous ceramic tube and an anode made of a coil of
platinum wire. The limit of detection for antimony in aqueous solution was
1.4 ng ml-1 using a flame heated quartz tube. Electrochemical hydride
generation of stibine by using flow injection method was employed by
Bings [52] by coupling the system with an inductively coupled plasma
time of flight mass spectrometer. A low volume electrolysis cell designed
for flow injection analysis was used. The cathode and anode employed
were fibrous carbon and platinum respectively.
1.6 Aim of the Study
Generation of SbH3 using electrochemical hydride generation technique
and preconcentration of the generated hydrides in the inlet arm of the
quartz tube atomizer is the main purpose of the study. To achieve this
purpose, a thin-layer electrochemical flow through cell was constructed.
The experimental operation conditions for hydride generation and
collection and revolatilization conditions for the generated hydrides in the
inlet arm of the quartz tube atomizer will be optimized. Interferences of
copper, nickel, iron, cobalt, arsenic, selenium, lead and tin on
electrochemical hydride generation of antimony using lead cathode are to
be examined. Finally in order to check the accuracy of the system,
analysis of standard reference materials will be performed.

21
CHAPTER II
EXPERIMENTAL
2.1 Chemicals and Reagents
All reagents used were of analytical grade. Standard solutions which
were used as the catholyte solutions were prepared by appropriate
dilution of the 1000 mg l-1 Sb stock solution (Ultra Scientific) with 1.0 mol
l-1 HCl (Merck). The anolyte solution was 2.0 mol l-1 H2SO4 (Carlo Erba)
and as blank 1.0 mol l-1 HCl was used. For the interference studies,
standard solutions of Ni, Co, Cu, Fe, As, Se, Sn and Pb were prepared in
1 mol l-1 HCl from the 1000 mg l-1 stock solutions (Aldrich) of the
corresponding element. Deionized water from Milli-Q Water Purification
System and Elga Deionized Water System was used throughout the
experiments.
2.2 Apparatus and Materials
The electrodes used were lead (99.9995%, Aldrich) and platinum
(99.9995%, Altın Yıldız �thalat-�malat, Kapalıçar�ı, �stanbul) as cathode
and anode materials respectively. As an ion exchange membrane Nafion
117 (Aldrich) was employed.

22
100 mL, 50 mL and 25 mL Dupont polyethylene containers were used to
store and prepare the solutions. Adjustable micropipettes
(Transferpipette, 5-50 �L, 50-250 �L and 100-1000 �L) with polyethylene
tips were used to distribute the reagents. Gilson Minipuls 3 peristaltic
pumps with Tygon® tubing were used to transfer the catholyte and
anolyte solutions into the electrochemical cell and to remove the waste
from the gas-liquid separator.
Quartz tubes with various diameters were supplied from Quartz Scientific
Inc., Fairport Hairbour Ohio. The quartz T-tubes used throughout this
study were made in the glass shop of our Chemistry department. Two
different types of quartz T-tubes were used; one for the electrochemical
hydride generation procedure and the other for the trapping procedure.
Both of these T-tubes had an optical arm length of 117 mm and an inlet
arm length of 95 mm and the inner and outer diameters of the optical arm
were 8 mm and 10 mm, respectively. The inlet arm of the quartz T-tube
used for electrochemical hydride generation had an inner diameter of 4
mm and an outer diameter of 6 mm. The inner and outer diameters of the
inlet arm of the t-tube used for trapping were 3 mm and 4 mm,
respectively.
2.3 Atomic Absorption Spectrometer
A Pye Unicam PU 9200 atomic absorption spectrometer with
electrochemical hydride generation system was used throughout the
study. The results were printed with an Epson FX-850 printer connected
to the spectrometer. Photron Sb hollow cathode lamp with an operating
current of 9 mA was used as the radiation source. The analyses were
done at a wavelength of 217.6 nm and 0.2 nm slit width. Background

23
correction was not employed. Air-acetylene flame with a 50 mm burner
slot was used for atomization and argon was used as the carrier gas.
2.4 Electrochemical Cell
A thin-layer electrochemical flow through cell similar to the one described
in ref. [53] was used throughout the study (Figure 2.1). The cell had a
Plexiglas body. It was made up of two blocks which have cathode and
anode chambers on them. Both of the chambers had dimensions of 100
mm x 3 mm x 3 mm and inner volume of 900 �L. Nafion 117® was
placed between the two blocks as the ion exchange membrane. A lead
foil, 1 mm thick, 100 mm long, 3 mm wide and a platinum foil, 0.2 mm
thick, 100 mm long, 3 mm wide were placed inside the cathode and
anode chambers respectively. Eight screws were used to screw down the
two blocks.
Figure 2.1 Scheme of the electrochemical flow through cell

24
PTFE (polytetrafluoroethylene) tubings with 0.8 mm inner diameter were
connected to the inlets and outlets of cathode and anode chambers with
1/16” tubing fittings. The same kinds of tubings and fittings were
employed in the whole experimental set-up.
An in house made power supply with Imax= 2.5A and Umax= 100V was
used to provide constant current to the electrochemical cell. The electric
contact was provided by lead and platinum wires which were pressed into
the two electrodes respectively.
When the sensitivity of the experiments decreased by 20%, the cell was
disassembled and the cathode surface was cleaned initially by wiping
with a filter paper, by fine sand paper then by rinsing the surface using
deionized water. If this cleaning process did not result in a visually clean
surface, the electrode was treated by 2 ml of 1 mol l-1 HNO3 and
subsequent rinsing with deionized water.
2.5 Electrochemical Hydride Generation System
The main part of the electrochemical hydride generation system (Figure
2.2) is the electrochemical cell. The catholyte and anolyte solutions were
pumped through the cathode and anode chambers respectively with the
peristaltic pump. The catholyte was either blank or the analyte in a dilute
acid solution and the anolyte was diluted acid. The electrochemical cell
was connected to the power supply and by applying current to the
electrodes hydrides were generated. The outlet of the cathode chamber
was connected to a T-piece (PEEK- polyether ether ketone) by which
argon was introduced to the system as the carrier gas. The outlet of the
T-piece was connected to the gas-liquid separator with 100 mm PTFE
tubing. The gas-liquid separator was made up of a standard 10/19 joint.

25
Two tubings were inserted into a rubber septum that was placed at the
bottom of the gas-liquid separator. One of these tubings was for
introducing the generated hydrides and the excess hydrogen to the gas-
liquid separator and the other tubing was for pumping the liquid waste
away. The gas outlet of the gas-liquid separator was connected to the
quartz T-tube atomizer with 100 mm tubing.
The flow rates of catholyte and anolyte solutions were 3.0 ml min-1 and
4.0 ml min-1 respectively. The anolyte solution that has passed from the
anode chamber was sent to waste. The flow rate of argon introduced into
the system was controlled by using a Cole-Parmer gas flow meter.
Figure 2.2 Scheme of the electrochemical hydride generation system

26
2.6 Trap System
The inlet arm of the quartz tube atomizer (i.d. 3 mm, o.d. 4 mm) was used
as the trapping medium during the trap experiments. The hydrides were
generated as explained in section 2.5 and trapped in the inlet arm. The
trap was prepared by coiling 360 mm long Ni-Cr wire with 0.8 mm
diameter and 1� resistance around the inlet arm of the quartz T-tube, 3
cm away from the junction point of inlet and optical arms (Figure 2.3).
The two ends of the wire were attached to an autotransformer which is
connected to the mains electricity.
The generated hydrides and the excess of hydrogen were swept out of
the gas-liquid separator with PTFE tubing that was connected to its
outlet. Hydrogen gas was introduced into the tubing with a T-piece and
the outlet of the T-piece was connected to 100 mm long tubing which was
inserted into the inlet arm of the quartz T-tube atomizer. The tip of tubing
was 0.5 cm near the trapping zone.
Figure 2.3 Scheme of the quartz t-tube used as trap

27
When voltage was applied to Ni-Cr wire, the part of the inlet arm that was
covered by coil heated up. The temperature inside the trap was
measured with a thermocouple. Table 2.1 shows the correlation between
the voltage applied to the wire and the temperature inside the trap.
Table 2.1 The relation between the applied voltage and the trap temperature
Voltage, V Temperature, oC 0 27
1.1 170 2.2 400 3.3 610 4.4 800 5.5 940 6.6 1030
The temperature data given in Table 2.1 was taken by placing the
thermocouple in the middle part of the trap under a total gas flow rate of
145 ml min-1 (45 ml min-1 argon flow and 100 ml min-1 hydrogen flow).
When voltage applied to the wire was increased the temperature of the
trap did not increase immediately, it took some time for its temperature to
become stable. Figure 2.4 illustrates the change of temperature inside
the trap after increasing the voltage from 2.2 V (400 oC) to 6.6 V (1030 oC).

28
0
200
400
600
800
1000
1200
0 5 10 15 20 25 30 35
Time, s
Tem
pera
ture
0 C
Figure 2.4 Temperature inside the trap after increasing the trap voltage
from 2.2 V (400 oC) to 6.6 V (1030 oC)
When the sensitivity of the experiments decreased, the trap was cleaned
by leaching the t-tube in a mixture of 7/3 concentrated HNO3-HF mixture
for 15 minutes and then it was washed with distilled water.
2.7 Experimental Procedure
First, the optimizations of experimental parameters for electrochemical
hydride generation were performed. To generate the hydrides
electrochemically, the catholyte solution was either the sample in 1 mol l-1
HCl or the blank which was 1 mol l-1 HCl; this solution was pumped
through the cathode chamber at a flow rate of 3 ml min-1 and the anolyte
solution that was 2 mol l-1 H2SO4 was pumped through the anode
chamber at a flow rate of 4 ml min-1. After the flows of these solutions
were provided, electric current was applied to the electrodes and the
hydrides were generated on the cathode surface. Argon flow of 45 ml

29
min-1 was introduced into the upstream of cathode products and has led
these products into the gas-liquid separator where the generated
hydrides and the liquid were separated. Finally the hydrides were sent to
the quartz tube atomizer, atomized there and the absorbance signals
were obtained.
After optimizing the electrochemical hydride generation conditions,
calibration plot was obtained and the limit of detection (LOD) was
calculated. To investigate the difference between chemical and
electrochemical hydride generation techniques; calibration plot was
obtained and the limit of detection was calculated for the chemical
hydride generation technique as well.
In the second part of the experiments, trapping of the generated stibine
was performed. The trap experiments were composed of two steps:
collection and volatilization. First, in order to investigate whether the
generated SbH3 can be trapped on quartz surface or not, the trap was
heated to different collection temperatures and the analyte signal was
obtained. Figure 2.5 shows that the absorbance values decrease when
the trap temperature is increased; this indicates that the generated
hydrides can be trapped on the surface of the inlet arm of the quartz tube
atomizer.

30
0
0.01
0.02
0.03
0.04
0.05
0.06
0.07
0 200 400 600 800 1000 1200
Temperature, 0C
Ab
sorb
ance
Figure 2.5 Collecting SbH3 in silica trap
In the collection step the voltage applied to the wire was adjusted to the
collection level which was 2.2 V corresponding to 400 oC.
Electrochemical hydride generation was started by providing the flows of
anolyte and catholyte solutions through the anode and cathode
compartments respectively by switching on the peristaltic pump and also
by applying current to the cell by switching on the power supply. During
the collection step the argon flow rate into the system was 45 ml min-1
and the flow rates of the catholyte which was the sample solution and the
anolyte were 3 ml min-1 and 4 ml min-1 respectively. The collection time
was 30 seconds during optimization of the parameters and 120 seconds
for obtaining the calibration plot and the analysis of standard reference
materials.
At the end of the collection period, the collection was stopped by
switching off the peristaltic pump and the power supply and
simultaneously the trap temperature was increased to the volatilization
temperature which was 1030 0C that corresponded to 6.6 V (Table 2.1).

31
The trap was allowed to heat up for 10 seconds and hydrogen gas at a
flow of 100 ml min-1 was introduced into the trap. The volatilization of the
collected analytes took place and the absorbance signal was obtained.
After obtaining the signal, the hydrogen gas flow into the trap was
switched off, the voltage applied to the trap was decreased to 2.2 V and
trap was allowed to cool down to the collection temperature for 45
seconds and the experiments were carried on with the next collection
step. Flow chart for the trapping process is given in figure 2.6.
Figure 2.6 Flow chart for the trapping process
Heating the trap to collection temperature
Electrochemical hydride generation of 1 ng ml-1 Sb in 1 mol l-1 HCl
Collection of hydrides for 30 seconds
Heating the trap to revolatilization temperature
10 seconds Introduction of H2 flow into the system
Trap Signal

32
The interference effects of cobalt, copper, nickel and iron among the
transition metals and arsenic, selenium, tin and lead among the hydride
forming elements on electrochemical stibine generation were
investigated. The interference studies were performed with and without
trapping of the generated hydrides. The effect of every interferent ion was
investigated by preparing standards with Sb / interference ratios of 1:10,
1:100 and 1:1000. The Sb concentration was 50 ng ml-1 for the
experiments performed without the trap and 1 ng ml-1 for the experiments
performed with the trap. The hydrides were generated and the influences
of every interferent on the absorbance signal at the three concentrations
were investigated.
2.8 Accuracy Check
Two standard reference materials (SRM); Trace Metals in Drinking
Water, Cat # CRM-TMDW (High Purity Standards) and Metals on Soil /
Sediment #4, IRM-008 (Ultra Scientific) were used for the validation of
the proposed method.
The Trace Metals in Drinking Water SRM was diluted 10 times with 1 mol
l-1 HCl and analyzed. 0.100 g of Metals on Soil / Sediment SRM in 5 ml of
HNO3 was decomposed with a Milestone Ethos Plus microwave oven
and diluted to 100 ml. This solution was further diluted 25 times with 1
mol l-1 HCl and analyzed.

33
CHAPTER III
RESULTS AND DISCUSSION
Two sets of experimental operation conditions were optimized:
electrochemical hydride generation and atom trapping conditions. In the
first part catholyte composition, anolyte composition, catholyte flow rate,
anolyte flow rate, carrier gas flow rate and electric current applied to the
electrochemical cell were optimized. The calibration plot for the
generation was obtained and the limit of detection was calculated.
Electrochemical and chemical hydride generation techniques were
compared in terms of their linear range and limits of detection. In the
second part, optimizations of collection temperature, revolatilization
temperature, the time passed after increasing the temperature to
revolatilization temperature and the hydrogen gas flow rate were
performed. The effect of collection time on the sample and blank signals
were investigated. The calibration plot for the technique with the trap was
obtained and the limit of detection was calculated. The effects of the
concomitant ions were also investigated without and with trap. Finally,
analyses of standard reference materials were performed for accuracy
check.

34
3.1 Optimization of Experimental Operation Conditions in ECHG
Sb at a concentration of 50 ng ml-1 in 1 mol l-1 HCl was used and the
signals were obtained at continuous flow mode.
3.1.1 Optimization of Anolyte Acidity
The electrochemical generation of antimony hydride is highly dependent
on the anolyte composition. As anolyte solution, seven different H2SO4
and HCl concentrations in the range 0.25 – 3.0 mol l-1 were tested. Using
H2SO4 higher absorbance signals were obtained than those obtained for
HCl. 2 mol l-1 H2SO4 was chosen as the optimum anolyte concentration (
Figure 3.1 ).
0.00
0.05
0.10
0.15
0.20
0.25
0.30
0.35
0.40
0.00 0.50 1.00 1.50 2.00 2.50 3.00 3.50
H2SO4 concentration, mol l-1
Ab
sorb
ance
Figure 3.1 Optimization of anolyte acidity
Catholyte: 50 ng ml-1 Sb in 1 mol l-1 HCl, Ar flow: 45 ml min-1, Current: 1200mA,
Catholyte and Anolyte Flow: 4ml min-1

35
3.1.2 Optimization of Catholyte Acidity
Ten different HCl concentrations in 0.5 – 5 mol l-1 range containing 50 ng
ml-1 Sb were tested as catholyte solution. The use of catholyte solutions
at concentrations lower than 0.5 mol l-1 was not suitable as the
conductance of the solutions decreased. The highest absorbance values
were obtained with 1 mol l-1 HCl and the reproducibility of the signals
were better than 4% at this acid concentration, so the optimum acid
concentration was selected as 1 mol l-1 ( Figure 3.2 ).
0.00
0.05
0.10
0.15
0.20
0.25
0.30
0.35
0.40
0.00 0.50 1.00 1.50 2.00 2.50 3.00 3.50 4.00 4.50 5.00
HCl concentration, mol l-1
Ab
sorb
ance
Figure 3.2 Optimization of catholyte acidity
Anolyte: 2 mol l-1 H2SO4, Ar flow: 45 ml min-1, Current: 1200mA, Catholyte and
Anolyte Flow: 4ml min-1
3.1.3 Optimization of Anolyte Flow Rate
The effect of the flow rate of the anolyte solution was investigated in the
interval of 1 – 9 ml min-1. It was observed that there was no significant
difference in the absorbance values obtained with the change in the

36
anolyte flow rate ( Figure 3.3 ). The reproducibility of the signals was
influenced from the change of the anolyte flow rate by 9-11 %, so as the
optimum flow rate value; 4 ml min-1 was selected where the relative
standard deviation of the signals were lower than those of the other flow
rate values.
0.00
0.05
0.10
0.15
0.20
0.25
0.30
0.35
0.40
0.00 1.00 2.00 3.00 4.00 5.00 6.00 7.00 8.00 9.00
H2SO4 flow, ml min-1
Ab
sorb
ance
Figure 3.3 Optimization of anolyte flow rate
Anolyte: 2 mol l-1 H2SO4, Catholyte: 50 ng ml-1 Sb in 1 mol l-1 HCl, Ar flow: 45 ml
min-1, Current: 1200mA, Catholyte Flow: 4ml min-1
3.1.4 Optimization of Catholyte Flow Rate
The flow rate of catholyte is an important parameter for electrochemical
hydride generation as the hydrides are produced on the cathode surface.
Figure 3.4 shows that the absorbance signals increase with increasing
catholyte flow rate. This observation can be explained by the fact that, at
higher flow rates, the amount of antimony that reaches the electrode
surface is increased and more antimony hydride is produced. Although
the absorbance values increase with the flow rate, the reproducibility of

37
the signals decreases; so catholyte flow at 3 ml min-1 was chosen as the
optimum flow rate.
0.00
0.05
0.10
0.15
0.20
0.25
0.30
0.35
0.40
0.00 2.00 4.00 6.00 8.00 10.00
HCl flow, ml min-1
Ab
sorb
ance
Figure 3.4 Optimization of catholyte flow rate
Anolyte: 2 mol l-1 H2SO4, Catholyte: 50 ng ml-1 Sb in 1 mol l-1 HCl, Ar flow: 45ml
min-1, Current: 1200mA, Anolyte Flow: 4ml min-1
3.1.5 Optimization of Carrier Gas Flow Rate
The carrier gas flow through the system is one of the basic parameters
influencing the sensitivity of antimony determination. Argon is used as the
carrier gas. Argon, introduced into the catholyte stream, carries the
cathode products into the gas-liquid separator. Argon, together with the
excess of hydrogen produced during the electrochemical reduction aids
in separation of the volatile compounds from the liquid phase and
transports the generated antimony hydrides into the quartz tube atomizer.
The influence of argon flow rate on the absorbance signal is shown in
Figure 3.5.

38
The argon flow rate was chosen as 45 ml min-1 during the studies as the
relative standard deviations of the signals were lower at this flow rate.
0.00
0.05
0.10
0.15
0.20
0.25
0.30
0.35
0.40
0 20 40 60 80 100
Ar flow, ml min-1
Ab
sorb
ance
Figure 3.5 Optimization of carrier gas flow rate
Anolyte: 2 mol l-1 H2SO4, Catholyte: 50 ng ml-1 Sb in 1 mol l-1 HCl,
Current: 1200mA, Anolyte Flow: 4 ml min-1, Catholyte flow: 3 ml min-1
3.1.6 Influence of Applied Electric Current
The generation of stibine is highly dependent on the magnitude of the
electric current applied to the electrochemical cell. Figure 3.6 shows the
influence of the generation current applied on the analytical signal. It is
evident from the graph that the analytical signal rapidly increases with
increasing generation current; however currents higher than 1.4 A were
not applied as the electrolyte solutions heat up excessively. In addition to
the heating of the electrolytes, the reproducibility of the signals decreases
at currents higher than 1.2 A, therefore 1.2 A was selected as the
operating current throughout the experiments.

39
0.00
0.05
0.10
0.15
0.20
0.25
0.30
0.35
0.40
0 200 400 600 800 1000 1200 1400
Applied current, mA
Ab
sorb
ance
Figure 3.6 Influence of the applied electric current on the absorbance
signal
Anolyte: 2 mol l-1 M H2SO4, Catholyte: 1 mol l-1 M HCl, Ar flow: 45 ml min-1,
Anolyte Flow: 4 ml min-1, Catholyte flow: 3 ml min-1
3.2 Determination of Sb (V) by ECHG
The absorbance signals of Sb (V) solution were taken by generating the
hydrides of 50 ng ml-1 Sb (V) in 1 mol l-1 HCl electrochemically. 100 ml of
500 mg l-1 Sb (V) stock solution was prepared by dissolving 0.116 g of
potassium antimonate ( KSb(OH)6.1/2 H2O ) with deionized water and the
standard solutions were prepared from this stock solution.
The mixtures of the two forms of the element were prepared with 0, 20,
40, 60, 80 and 100% of the solution being Sb (III) and the rest Sb (V) in 1
mol l-1 HCl. The total concentration of each solution was 50 ng ml-1. It was
observed that the signals were identical for all of the six solutions. This
observation indicates that, using lead cathode, direct determination of

40
total antimony with electrochemical hydride generation can be performed
without the need of a pre-reduction step to reduce Sb (V) to Sb (III).
Table 3.1 Absorbance Signals for Sb (III) and Sb (V) mixtures Sb (III) percentage (%) Sb (V) percentage (%) Absorbance Signal
100 0 0.277 80 20 0.275 60 40 0.278 40 60 0.276 20 80 0.274 0 100 0.276
3.3 Analytical Figures of Merit
Under the obtained optimum conditions, Sb (III) standards in 1 mol l-1 HCl
at a concentration interval of 5 – 200 ng ml-1 were used as the catholyte
solutions. The calibration plot for this interval was taken. The calibration
plot ( Figure 3.7 ) was linear between 5 – 120 ng ml-1 with a best line
equation and correlation coefficient of y = 0.0055x – 0.0063 and 0.9953,
respectively.
The relative standard deviation was better than 5% for electrochemical
hydride generation. The 3� limit of detection was calculated as 1.03 ng
ml-1. The characteristic concentration (C0) for 50 ng ml-1 Sb was found to
be 0.81 ng ml-1.

41
0.00
0.10
0.20
0.30
0.40
0.50
0.60
0.70
0.80
0 20 40 60 80 100 120 140 160
Sb, ng ml-1
Abs
orba
nce
Figure 3.7 Calibration plot for electrochemical hydride generation of Sb
3.4 Comparison of Electrochemical Hydride Generation and
Chemical Hydride Generation
The differences between electrochemical hydride generation and
chemical hydride generation techniques in terms of their linear range, 3�
limit of detection and reciprocal sensitivity were investigated. SbH3 was
generated with 0.5% NaBH4 in 0.4% (m/v) NaOH as described in
reference [8]. The concentration range of Sb (III) was 5 – 200 ng ml-1 as it
was in electrochemical hydride generation. Figure 3.8 is the calibration
plot for chemical hydride generation of Sb in the continuous flow mode.

42
0.00
0.20
0.40
0.60
0.80
1.00
1.20
1.40
0 20 40 60 80 100 120 140 160
Sb, ng ml-1
Abs
orba
nce
Figure 3.8 Calibration plot for chemical hydride generation of Sb
As it is can be seen from figure 3.8, the absorbance signals obtained with
chemical hydride generation are slightly higher than those obtained with
electrochemical hydride generation. The linear range of the calibration
plot is in between 5 – 100 ng ml-1 with a best line equation and correlation
coefficient of y = 0.0113x + 0.0139 and 0.9935, respectively. The 3� limit
of detection was calculated as 0.69 ng ml-1. The characteristic
concentration (C0) of 50 ng ml-1 Sb was found as 0.36 ng ml-1.
Table 3.2 Comparison of Chemical and Electrochemical Hydride Generation techniques
Chemical Hydride Generation (HG)
Electrochemical Hydride Generation (ECHG)
Best line equation y = 0.0113x + 0.0139 y = 0.0055x – 0.0063
LOD (ng ml-1) 0.69 1.03
C0 (ng ml-1) 0.36 0.81

43
3.5 Efficiency of Electrochemical Hydride Generation
A relative efficiency of the electrochemical hydride generation can be
estimated in relation to the chemical hydride generation. In order to
calculate the efficiency, SbH3 was generated both electrochemically and
chemically from 50 ng ml-1 Sb (III) in 1 mol l-1 HCl solution. Chemical
hydride generation was performed under the experimental conditions
given in section 3.4. While generating the hydrides electrochemically, the
waste pumped away from the gas-liquid separator was collected. After
obtaining the absorbance values of the electrochemical generation, the
amount of antimony in the waste solution was determined by chemical
hydride generation. Assuming that the efficiency of chemical hydride
generation is 100%, the signal obtained from the waste solution and the
total signal were compared. It was seen that 40% of antimony remained
in the waste solution. By comparing the signal of chemical hydride
generation with the signal of electrochemical hydride generation, it was
observed that 47% of total signal was obtained with the electrochemical
hydride generation technique. The rest of the total, which was 13%, could
be lost in various parts of the generation system which could be the
transport tubing upstream, the electrochemical cell, the cathode surface,
the tubing transferring the waste solution and the tubing transporting the
cell to the atomizer.
3.6 Optimization of Trap Conditions
Throughout the trap experiments, 1 ng ml-1 Sb (III) in 1 mol l-1 HCl was
used and the trap was placed three centimeters away from the junction
point of the inlet and optical arms of the quartz tube atomizer. The
distance of the trap from the junction point was chosen as 3 centimeters
as at that distance the temperature of the trap was not affected from the
44
flame of the atomic absorption spectrometer. Before starting the
optimization of the trap conditions, the relation between the voltage
applied to the trap and the trap temperature (Table 2.1 ) was
investigated. Also, whether the introduction of hydrogen gas to the
system during the revolatilization step had an effect on the temperature of
the trap was investigated and it was observed that introducing hydrogen
gas had no effect on the temperature of the trap. Introduction of hydrogen
into the system was necessary because merely heating the trap was not
sufficient to revolatilize the trapped species and sent them into the
atomizer.
The optimizations of collection and revolatilization temperatures and H2
flow rate were performed with 30 seconds of collection time. The
absorbance signals are given as peak height.
3.6.1 Optimization of Collection and Revolatilization Temperatures
Figure 3.9 shows the peak height values during the optimization of
collection and revolatilization temperatures.
During the optimization of collection temperature, the revolatilization
temperature was 1030 0C and during the optimization of revolatilization
temperature the collection temperature was 400 0C.
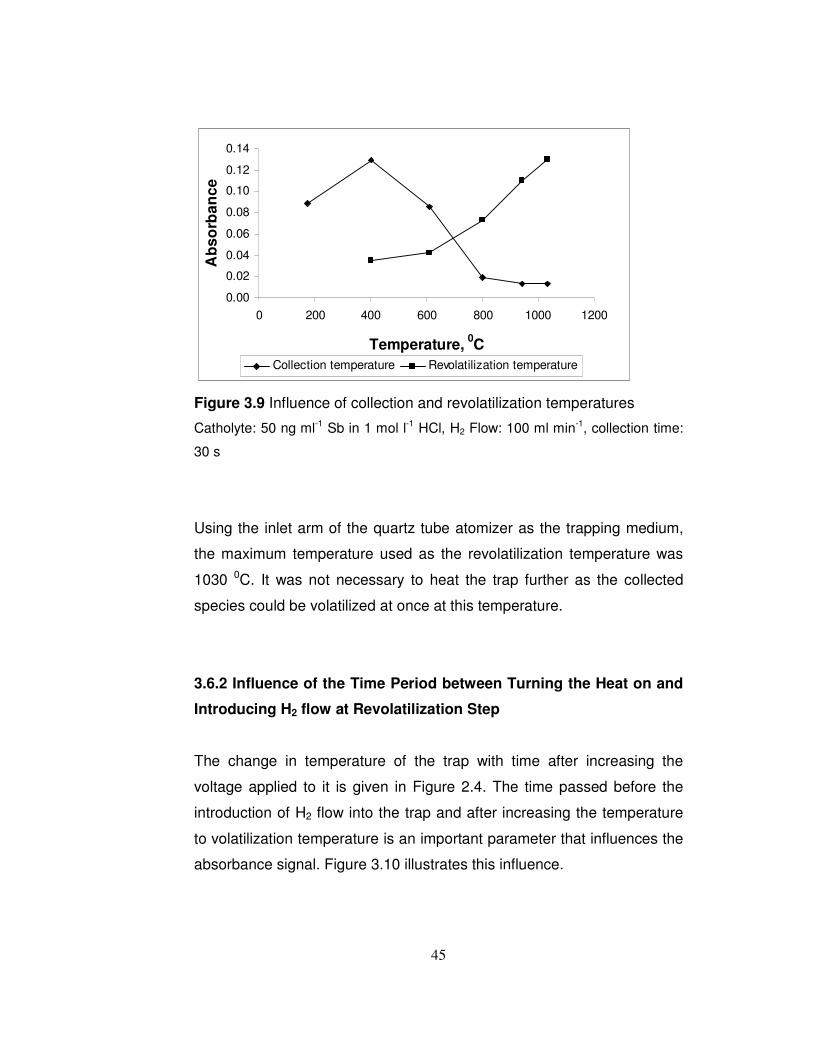
45
0.00
0.02
0.04
0.06
0.08
0.10
0.12
0.14
0 200 400 600 800 1000 1200
Temperature, 0C
Abs
orba
nce
Collection temperature Revolatilization temperature
Figure 3.9 Influence of collection and revolatilization temperatures
Catholyte: 50 ng ml-1 Sb in 1 mol l-1 HCl, H2 Flow: 100 ml min-1, collection time:
30 s
Using the inlet arm of the quartz tube atomizer as the trapping medium,
the maximum temperature used as the revolatilization temperature was
1030 0C. It was not necessary to heat the trap further as the collected
species could be volatilized at once at this temperature.
3.6.2 Influence of the Time Period between Turning the Heat on and
Introducing H2 flow at Revolatilization Step
The change in temperature of the trap with time after increasing the
voltage applied to it is given in Figure 2.4. The time passed before the
introduction of H2 flow into the trap and after increasing the temperature
to volatilization temperature is an important parameter that influences the
absorbance signal. Figure 3.10 illustrates this influence.

46
It is obvious from Figure 3.10 that the absorbance values are the highest
at the tenth second, so H2 flow was introduced into the system at the end
of this time interval and the absorbance signals were obtained. Although
a plateau was reached after 30 seconds, 10 seconds was used at further
experiments as the percent relative standard deviations of the obtained
results did not change. The % RSD of the measurements were 4-6 % for
all the data obtained at different time periods between turning the heat on
and introducing H2 flow at revolatilization step.
0.00
0.02
0.04
0.06
0.08
0.10
0.12
0.14
0 10 20 30 40 50 60
Time, s
Abs
orb
ance
Figure 3.10 Influence of time period between turning the heat on and
introducing H2 flow at revolatilization step
Collection T: 403 0C, Revolatilization T: 1030 0C, H2 flow: 100 ml min-1,
collection time: 30 s
3.6.3 Optimization of Hydrogen Flow Rate
For the revolatilization of the collected analyte species, introduction of
hydrogen flow into the trap is necessary. Figure 3.11 represents the

47
effect of hydrogen flow rate on the signal. The optimum hydrogen flow
rate was found to be 100 ml min-1 and the total gas flow into the quartz
tube has become 145 ml min-1 after the introduction of hydrogen.
0.00
0.02
0.04
0.06
0.08
0.10
0.12
0.14
0 100 200 300 400 500 600 700 800 900
H2 flow rate, ml min-1
Ab
sorb
ance
Figure 3.11 Optimization of H2 flow rate
Collection T: 403 0C, Revolatilization T: 1030 0C, collection time: 30 s
In order to investigate whether hydrogen flow is necessary to revolatilize /
reatomize the collected antimony species or to transport the species into
the atomizer, some experiments were performed. The hydrogen flow rate
was decreased but at the same time the total gas flow into the system
was held constant by increasing the argon flow rate. The same trend that
is seen in Figure 3.11 was observed; the absorbance values were lower
at hydrogen flow rates that were both lower and higher than 100 ml min-1.
As a result of this observation it can be stated that the necessity of
hydrogen flow into the system is not for the transportation of collected
analyte species, but to revolatilize the analyte species from the surface of
the inlet arm of the quartz tube atomizer.

48
Figure 3.12 is the typical signal shape observed for 1 ng ml-1 Sb in 1 mol
l-1 HCl solution after 30 seconds collection.
Figure 3.12 The typical signal shape observed for 1.5 ng Sb.
Collection T: 403 0C, Revolatilization T: 1030 0C, H2 flow: 100 ml min-1
In figure 3.12 the background signal is also seen. As it is obvious from
the figure background signal is not important, so background correction
was not employed for further studies.
3.7 Effect of Collection Time on the Absorbance Signal
The increase in the peak height signals with increasing collection time
can be seen in Figure 3.13. The collection volume ranges from 0.5 ml to
12 ml which corresponds to 0.5 – 12 ng Sb. For collection times longer
that 120 seconds, the blank signals also start to increase, so employing
collection times longer than 120 seconds is not feasible.

49
0.00
0.10
0.20
0.30
0.40
0.50
0.60
0.70
0 20 40 60 80 100 120 140 160 180 200 220 240
Time,s
Abs
orba
nce
Figure 3.13 Peak height absorbance values for different collection times
Collection T: 403 0C, Revolatilization T: 1030 0C, H2 flow: 100 ml min-1
3.8 Determination of Sb (V) with the Quartz Trap
The signals for the two oxidation states of Sb were taken by
electrochemical hydride generation as it was explained in Section 3.2 and
it was found that the results were identical. The hydrides generated from
Sb (V) solution were collected in the trap and it was investigated whether
the efficiency of the trap was the same for this oxidation state of the
analyte. The signals identical to the ones obtained with collection of Sb
(III) were obtained. This indicates that the efficiency of the trap is same
for both of the oxidation states.

50
3.9 Quartz Trap Leached in HF
The inlet arm of the quartz tube atomizer that is used as the trapping
medium was leached in HF for 20 minutes, rinsed with distilled water and
then left to dry. Employing this quartz tube atomizer, the generated
hydrides were trapped as explained in Section 2.6. It was observed that
the trapping was the same as the trap not leached in HF ( Figure 2.5 ),
but revolatilization signals were 8-10% lower under the same hydrogen
gas flow rate introduced into the system. The results indicate that a
smooth surface should be used for better trapping.
3.10 Analytical Figures of Merit
The calibration plot, for collection of hydrides with standard solution
introduction time of 120 seconds is shown in Figure 3.14. The results
given in this graph are not blank-corrected. The linear portion of the
calibration plot extended up to 1 ng ml-1 Sb, corresponding 6 ng of
sample. The best line equation and the correlation coefficient for the
calibration plot are y = 0.09x + 0.0047 and 0.9949 respectively.
The relative standard deviation was better than 6% for peak height
measurements. The 3� limit of detection was calculated as 0.053 ng ml-1.
The characteristic concentration (C0) found using 0.5 ng ml-1 Sb was
calculated as 0.044 ng ml-1.

51
0.00
0.02
0.04
0.06
0.08
0.10
0.12
0.20 0.30 0.40 0.50 0.60 0.70 0.80 0.90 1.00 1.10
Sb, ng ml-1
Abs
orba
nce
Figure 3.14 Calibration plot for collection of hydrides
Collection T: 403 0C, Revolatilization T: 1030 0C, H2 flow: 100 ml min-1,
Collection time: 120 seconds
Table 3.3 gives the results obtained for Sb (III) with different
electrochemical hydride generation systems employing different cathode
materials and also different techniques. As it can be seen from this table,
the results obtained in this study without employing the trap is better than
those obtained in reference [51] and also the results obtained by
employing the trap are comparable with the results of reference [50]
which were obtained by electrothermal atomic absorption spectrometry
with in-situ concentration in Pd-coated graphite furnace.

52
Table 3.3 Comparison of Results for Sb with Different ECHG Systems Cathode Material Technique LOD (3�) Ref.
lead ETAAS 0.02 ng ml-1 (a) 50
fibrous carbon ICP-TOFMS 0.2 ng ml-1 52
lead AAS 1.03 ng ml-1
0.053 ng ml-1(b)
This
study
vitreous carbon AAS 1.4 ng ml-1 51
(a) in-situ trapping in Pd-coated graphite furnace (b) trapping on quartz surface
3.11 Interference Studies
During the interference studies, standards at concentrations of 50 and 1
ng ml-1 Sb in 1 mol l-1 HCl were used for without trap and with trap
experiments respectively. The interferent concentrations were 10, 100
and 1000 folds of these concentrations.
Figures 3.15 and 3.16 are the graphical representations of the
interference effects of arsenic, selenium, tin and lead on the absorbance
signals without trap and with trap respectively. As it can be seen from
Figure 3.15, the presence of ten fold arsenic, resulted in 40% increase in
the signal, when the arsenic amount was increased to 100 fold of the
antimony amount, no change in the signal was observed and when the
interferent amount was 1000 fold of analyte, the signal decreased by
23%. In the presence of selenium, the signals decreased by 28, 46 and
50% at selenium concentrations that are 10, 100 and 1000 folds of
antimony, respectively. The signals increased by 11, 37 and 40% in the
presence of tin at 10, 100 and 1000 folds of antimony concentration,
respectively. The same increase trend was observed in the presence of
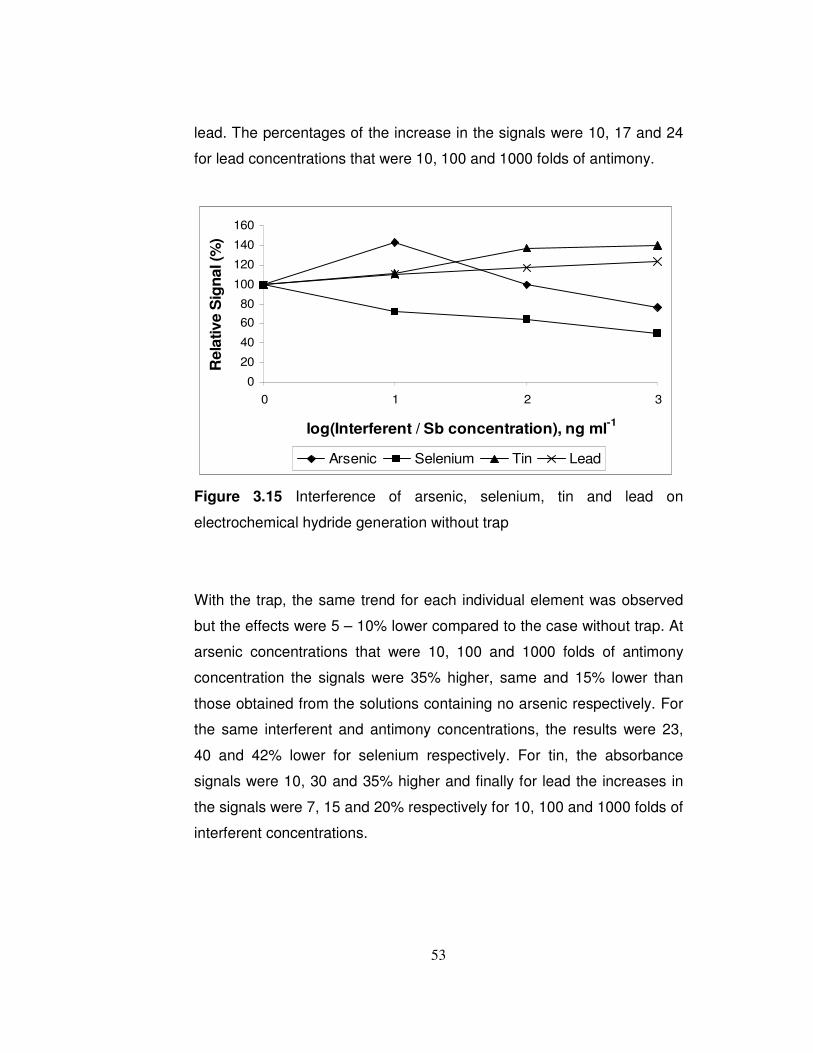
53
lead. The percentages of the increase in the signals were 10, 17 and 24
for lead concentrations that were 10, 100 and 1000 folds of antimony.
0
20
40
6080
100
120
140
160
0 1 2 3
log(Interferent / Sb concentration), ng ml-1
Rel
ativ
e S
igna
l (%
)
Arsenic Selenium Tin Lead
Figure 3.15 Interference of arsenic, selenium, tin and lead on
electrochemical hydride generation without trap
With the trap, the same trend for each individual element was observed
but the effects were 5 – 10% lower compared to the case without trap. At
arsenic concentrations that were 10, 100 and 1000 folds of antimony
concentration the signals were 35% higher, same and 15% lower than
those obtained from the solutions containing no arsenic respectively. For
the same interferent and antimony concentrations, the results were 23,
40 and 42% lower for selenium respectively. For tin, the absorbance
signals were 10, 30 and 35% higher and finally for lead the increases in
the signals were 7, 15 and 20% respectively for 10, 100 and 1000 folds of
interferent concentrations.

54
0
20
40
60
80
100
120
140
160
0 1 2 3
log(Interferent / Sb concentration), ng ml-1
Rel
ativ
e S
ign
al (%
)
Arsenic Selenium Tin Lead
Figure 3.16 Interference of arsenic, selenium, tin and lead on
electrochemical hydride generation with trap
Figures 3.17 and 3.18 are the graphical representations of the
interference effects of nickel, copper, cobalt and iron without and with
trapping respectively. The presences of all of the four interferents
individually cause a signal depression. By employing the trap, the effects
of these metals on the electrochemical hydride generation were reduced.
As it can be seen from figure 3.17, the presence of nickel at 10, 100 and
1000 folds of antimony concentration, decreased the absorbance signals
by 20, 73 and 77% respectively. The presence of copper at the same
concentrations caused 65, 80 and 85 % decreases in the signals. In the
presence of cobalt at 10, 100 and 1000 folds of the analyte, the signals
were decreased by 42, 60 and 70 %, respectively. The presence of iron
at 10, 100 and 1000 folds of the antimony concentration decreased the
signals by 65, 75 and 80 %, respectively.

55
0
20
40
60
80
100
120
0 1 2 3
log(Interferent / Sb concentration), ng ml-1
Rel
ativ
e S
ign
al (%
)
Nickel Copper Cobalt Iron
Figure 3.17 Interference of nickel, copper, cobalt and iron on
electrochemical hydride generation without trap
Employing the trap, the interferences of nickel, copper, cobalt and iron
were reduced. As it can be seen from figure 3.18, the presence of 10 fold
nickel, did not cause any interference; nickel concentrations that are 100
and 1000 folds of antimony decreased the absorbance signals by 5 and
20 % respectively. The presence of copper at 10, 100 and 1000 folds of
antimony decreased the signals by 15, 22 and 30 % respectively. The
presence of cobalt resulted in 10, 12 and 24% signal depressions at the
same interferent/antimony ratios. In the presence of iron, the decreases
in the signals were 20, 32 and 40 % at the same interferent
concentrations.
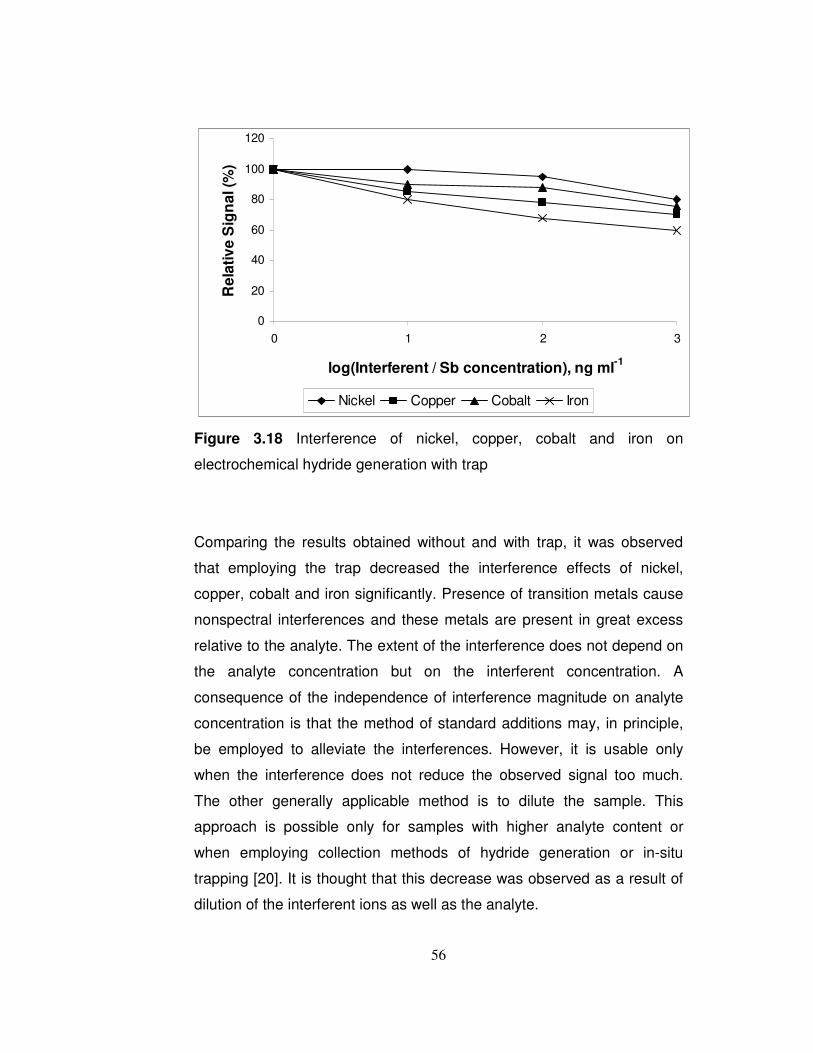
56
0
20
40
60
80
100
120
0 1 2 3
log(Interferent / Sb concentration), ng ml-1
Rel
ativ
e S
ign
al (%
)
Nickel Copper Cobalt Iron
Figure 3.18 Interference of nickel, copper, cobalt and iron on
electrochemical hydride generation with trap
Comparing the results obtained without and with trap, it was observed
that employing the trap decreased the interference effects of nickel,
copper, cobalt and iron significantly. Presence of transition metals cause
nonspectral interferences and these metals are present in great excess
relative to the analyte. The extent of the interference does not depend on
the analyte concentration but on the interferent concentration. A
consequence of the independence of interference magnitude on analyte
concentration is that the method of standard additions may, in principle,
be employed to alleviate the interferences. However, it is usable only
when the interference does not reduce the observed signal too much.
The other generally applicable method is to dilute the sample. This
approach is possible only for samples with higher analyte content or
when employing collection methods of hydride generation or in-situ
trapping [20]. It is thought that this decrease was observed as a result of
dilution of the interferent ions as well as the analyte.

57
3.12 Analysis of Standard Reference Materials
Table 3.4 gives the certified and found values for the standard reference
materials (SRM). The amount of Sb in SRMs was found to be in good
agreement with the certified values.
Table 3.4 Results of the analysis of standard reference materials
SRM Certified Value Found
Soil/Sediment #4, mg kg-1 2.55 2.51 ± 0.3
CRM-TMDW, �g l-1 10 ± 0.5 9.8 ± 0.5

58
CHAPTER IV
CONCLUSIONS
Electrochemical hydride generation of antimony and trapping the
generated hydrides in the inlet arm of the conventional quartz tube
atomizer was studied. The experimental operation parameters in
electrochemical hydride generation were optimized. Employing
electrochemical hydride generation technique, 3� limit of detection was
calculated as 1.03 ng ml-1. Determination of the two oxidation states of
Sb was performed and it was concluded that employing lead as cathode
material, hydrides of both of the oxidation states were generated with the
same efficiency, which is an advantage for total antimony determination
in real samples. Speciation can be performed with the electrochemical
hydride generation technique by selecting the cathode material according
to its influence on the efficiency of hydride generation depending on the
analyte oxidation state.
The inlet arm of the conventional quartz tube atomizer was used as atom
trap by external heating. The trap parameters were optimized and 3� limit
of detection was calculated as 0.053 ng ml-1. These results represent that
trapping the generated hydrides on the quartz surface causes a 20 fold
improvement in limit of detection.
59
The interferences of some hydride forming elements and some transition
metals on electrochemical hydride generation with and without employing
the trap were investigated. It was observed that, hydride forming
elements Sn and Pb have caused an increase in the absorbance signals
with and without trap. On the other hand, the presence of As, have
caused an increase in the signal when its concentration is 10 fold of the
analyte concentration and no difference was observed when the arsenic
concentration was 100 fold of the analyte concentration and a signal
suppression was seen at 1000 fold arsenic concentration. The presence
of Se resulted in signal suppression at all the three interferent
concentrations. With the hydride forming elements, employing the trap
did not have any significant effect.
The presence of Ni, Cu, Co and Fe had the same effect on the
absorbance signals; signal suppressions of 20 – 85% were observed
without employing the trap. The levels of signal suppressions were
decreased by using the trap; that is, the suppressions were in the range
of 10 – 40%. These observations indicate that, by diluting the sample, the
effects of interferences can be reduced. This is a common characteristic
and advantage of sensitive techniques.

60
REFERENCES
[1] S. R. Crouch, J. D. Jr. Ingle, “Spectrochemical Analysis”, Prentice-Hall
Inc., New Jersey, USA, 1988.
[2] A. Walsh, “The Application of Atomic Absorption Spectra to Chemical
Analysis”, Spectrochim. Acta, 1955, 7, 108.
[3] D. A. Skoog, F. J. Holler, T. A. Nieman, “Principles of Instrumental
Analysis”, Saunders College Publishing, USA, 1992.
[4] L. Ebdon, E. H. Evans, A. S. Fisher and S. C. Hill, “An Introduction to
Analytical Spectrometry”, John Wiley and Sons, England, 1998.
[5] T. H. Delves, “A Micro-Sampling Method for the Rapid Determination
of Lead in Blood by Atomic Absorption Spectrometry”, Analyst, 1970, 95,
431.
[6] D. K. Korkmaz, N. Erta�, O. Yavuz Ataman, “A Novel Silica Trap for
Lead Determination by Hydride Generation Atomic Absorption
Spectrometry”, Spectrochim. Acta, Part B, 2002, 57, 571.
[7] N. Erta�, D. K. Korkmaz, S. Kumser and O. Y. Ataman, “Novel Traps
and Atomization Techniques for Flame AAS”, J. Anal. At. Spectrom.,
2002, 17, 1415.

61
[8] D. Korkmaz, J. D�dina, O. Y.Ataman, “Stibine Preconcentration in a
Quartz Trap with Subsequent Atomization in the Quartz Multiatomizer for
Atomic Absorption Spectrometry”, J. Anal. At. Spectrom., 2004, 18, 1.
[9] R. J. Watling, “The Use of a Slotted Quartz Tube for the Determination
of As, Sb, Se and Hg”, Anal. Chim. Acta, 1977, 94, 181.
[10] D. Karadeniz, Atom Trapping Atomic Absorption Spectrometry Using
Slotted Quartz Tube, M. Sc. Thesis, METU, 1998.
[11] C. M. Lau, A. Held and R. Stephens, “Sensitivity Enhancements to
Flame AAS by Use of a Flame Atom Trap”, Can. J. Spectroscopy, 1976,
21, 100.
[12] C. M. Lau, A. M. Ure and T. S. West, “The Determination of Lead
and Cadmium in Soils by Atom Trapping Atomic Absorption
Spectrometry”, Anal. Chim. Acta, 1983, 146, 171.
[13] J. Khalighie, A. M. Ure and T. S. West, “Atom Trapping Atomic
Absorption Spectrometry of Arsenic, Cadmium, Lead, Selenium and Zinc
in Air-Acetylene and Air-Propane Flames”, Anal. Chim. Acta, 1981, 131,
27
[14] N. Erta�, Atom Trapping Atomic Absorption Spectrometry Using
Silica and Metal Tubes, M. Sc. Thesis, METU, 1990.
[15] H. Matusiewicz and M. Kopras, “Methods for Improving the
Sensitivity in Atom Trapping Flame Absorption Spectrometry: Analytical
Scheme for the Direct Determination of Trace Elements in Beer”, J. Anal.
At. Spectrom., 1997, 12, 1287.
62
[16] G. Huang, S. Qian and H. Yang, “Study of Slotted Quartz Tube Atom
Trapping Atomic Absorption Spectrometry”, Ziran Kexueban Hua Xue
Fen Xi, 1995, 41, 707.
[17] W. Holak, “Gas-sampling Technique for Arsenic Determination by
Atomic Absorption Spectrometry”, Anal. Chem., 1969, 41, 1712.
[18] R. S. Braman, L. L. Justen and C. C. Foreback, “Direct volatilization-
spectral emission type Detection System for ng Amounts of As and Sb”,
Anal. Chem., 1972, 44, 2195.
[19] P. Pohl, “Hydride Generation-Recent Advances in Atomic Emission
Spectrometry”, Trends in Analytical Chemistry, 2004, 23, 87.
[20] J. D�dina and D. L. Tsalev, “Hydride Generation Atomic Absorption
Spectrometry”, Wiley and Sons Inc., Chichester, 1995.
[21] F. Laborda, E. Bolea, M. T. Baranguan and J. R. Castillo, “Hydride
Generation in Analytical Chemistry and Nascent Hydrogen: When Is It
Going to Be Over?”, Spectrochim. Acta, Part B, 2002, 57, 797.
[22] X. – M. Guo, X. – W. Guo, “Determination of Ultra-Trace Amounts of
Selenium by Continuous Flow Hydride Generation AFS and AAS with
Collection on Gold Wire”, J. Anal. At. Spectrom., 2001, 16.
[23] O. Cankur, N. Erta�, O. Y. Ataman, “Determination of Bismuth Using
On-Line Preconcentration by Trapping on Resistively Heated W Coil and
Hydride Generation Atomic Absorption Spectrometry”, J. Anal. At.
Spectrom., 2002, 17, 603.

63
[24] E. Denkhaus, A. Golloch, X. M. Guo and B. Huang, “Electrolytic
Hydride Generation (EC-HG)-A Sample Introduction System with Some
Special Features”, J. Anal. At. Spectrom., 2001, 16, 870.
[25] V. L. Rigin, “Dispersionless AF Determination of As in Biological
Materials”, Zh. Anal. Khim., 1978, 33, 1966.
[26] A. Brockmann, H. M. Kuß and A. Golloch, 6. Colloquium
Atomspektrometrische Spurenanalytik, ed. B. Welz, Bodenseewerk
Perkin Elmer, Überlingen, 1991, 439.
[27] A. Brockmann, C. Nonn and A. Golloch, “New Concept for Hydride
Generation Technique: Electrochemical Hydride Generation”, J. Anal. At.
Spectrom., 1993, 8, 397.
[28] Y. Lin, X. Wang, D. Yuan, P. Yang, B. Huang and Z. Zhuang, “Flow
Injection-Electrochemical Hydride Generation Technique for Atomic
Absorption Spectrometry”, J. Anal. At. Spectrom., 1992, 7, 287.
[29] Y. Lin, Z. Zhuang, X. Wang and B. Huang, Proceedings of 3rd Beijing
Conference and Exhibition on Instrumental Analysis, Peking University,
1989, C119.
[30] Y. Lin, Z. Zhuang, X. Wang, W. Ding and B. Huang, Proceedings of
1990 Changchun International Symposium on Analytical Chemistry, Jilin
University press, Changchun, 1990, 221.

64
[31] F. Laborda, E. Bolea and J. R. Castillo, “Comment on ‘Electrolytic
Hydride Generation (EC-HG)-A Sample Introduction System with Some
Special Features’ by E. Denkhaus, A. Golloch, X.-M. Guo and B. Huang,
J. Anal. At. Spectrom., 2001, 16, 870”, J. Anal. At. Spectrom., 2002, 17,
727.
[32] E. Bolea, F. Laborda, M. A. Belarra, J. R. Castillo, “Interferences in
Electrochemical Hydride Generation of Hydrogen Selenide”,
Spectrochim. Acta, Part B, 2001, 56, 2347.
[33] F. D. Pierce, H. R. Brown. “Inorganic Interference Study of
Automated As and Se Determination with AAS”, Anal. Chem., 1976, 48,
693.
[34] A. Meyer, Ch. Hofer, G. Toelg, S. Raptis, G. Knapp, “Cross-
interferences by Elements in the Determination of Traces of Se by the
Hydride AAS procedure”, Fresenius Z. Anal. Chem., 1979, 296, 337.
[35] B. Welz, M. Melcher, Mutual Interactions of Elements in the Hydride
Technique in AAS. Part 1. Influence of Se on As Determination”, Anal.
Chim. Acta, 1981, 131, 17.
[36] B. Welz, M. Melcher, “Mechanisms of Transition Metals Interferences
in HGAAS. I. Influence of Co, Cu, Fe and Ni on Se Determination”,
Analyst, 1984, 109, 569.
[37] A. E. Smith, “Interferences in the Determination of Elements That
Form Volatile Hydrides with Na Borohydride Using AA spectrophotometry
and the Ar-H Flame”, Analyst, 1975, 100, 300.

65
[38] G. F. Kirkbright, M. Taddia, “Application of Masking Agents in
Minimizing Interferences From Some Metals Ions in the Determination of
As by AAS with HG Technique”, Anal. Chim. Acta, 1978, 100, 145.
[39] H. J. E. Sand, J. E. Hackford, “The Electrolytic Estimation of Minute
Quantities of Arsenic”, J. Chem. Soc., 1904, 85, 1018.
[40] V. I. Rigin, G. N. Verkhoturov, “Atomic Absorption Determination of
Arsenic Using Prior Electrochemical Reduction”, Zh. Anal. Khim., 1977,
32, 1965.
[41] V. I. Rigin, “AA Determination of Sn in Water and Biological Materials
Using Electrolytic Separation and Atomization in the Gas Phase”, Zh.
Anal. Khim., 1978, 33, 1966.
[42] D. Schaumlöffel, B. Neidhart, “A FIA-system for As (III)/As (V)-
Determination with Electrochemical Hydride Generation and AAS-
Detection”, Fresenius’ J. Anal. Chem., 1996, 354, 866.
[43] W. W. Ding, R. E. Sturgeon, “Interference of Copper and Nickel on
Electrochemical Hydride Generation”, J. Anal. At. Spectrom., 1996, 11,
421.
[44] M. Fiella, N. Belzile, Y. W. Chen, “Antimony in the Environment: A
Review Focused on Natural Waters I. Occurrence”, Earth-Science
Reviews, 2002, 57, 15.
[45] P. Smichowski, Y. Madrid, C. Cámara, “Analytical Methods for
Antimony Speciation in Waters at Trace and Ultratrace Levels. A
Review”, Fresenius J. Anal. Chem., 1998, 360, 623.

66
[46] F. J. Fernández, “AA Determination of Gaseous Hydrides Utilizing
Na borohydride reduction”, At. Absorpt Newsl., 1973, 12, 93.
[47] S. Nakashima, “Selective Determination of Antimony(III) and
Antimony(V) by Atomic Absorption Spectrophotometry Following Stibine
Generation”, Analyst, 1980, 105, 732.
[48] M. O. Andreae, J. F. Asmodé, P. Foster, L. Van’tdack,
“Determination of Sb(III), Sb(V), and methylantimony species in natural
waters by AAS with HG”, Anal. Chem., 1982, 53, 1766.
[49] D. M. Hueber, J. D. Winefordner, “A Flowing Electrolytic Hydride
Generator for Continuous Sample Introduction In Atomic Spectrometry”,
Anal. Chim. Acta, 1995, 316, 129.
[50] W. W. Ding, R. E. Sturgeon, “Evaluation of Electrochemical Hydride
Generation for the Determination of Total Antimony in Natural Waters by
Electrothermal Atomic Absorption Spectrometry with In Situ
Concnetration”, J. Anal. At. Spectrom., 1996, 11, 225.
[51] F. Laborda, E. Bolea and J. R. Castillo, “Tubular Electrolytic Hydride
Generator for Continuous and Flow Injection Sample Introduction System
in Atomic Absorption Spectrometry”, J. Anal. At. Spectrom., 2000, 15,
103.
[52] N. H. Bings, Z. Stefánka and S. R. Mallada, “Flow Injection
Electrochemical Hydride Generation Inductively Coupled Plasma Time-
of-Flight Mass Spectrometry for the Simultaneous Determination of
Hydride Forming Elements and Its Application to the Analysis of Fresh
Water Samples”, Anal. Chim. Acta, 2003, 479, 203.

67
[53] J. Šima, P. Rychlovský. “Electrochemical Selenium Hydride
Generation with In Situ Trapping in Graphite Tube Atomizers”,
Spectrochim. Acta, Part B, 2003, 58, 919.


![CHAPTER 2 REVIEW OF LITERATUREshodhganga.inflibnet.ac.in/bitstream/10603/4451/10/10_chapter 2.pdfhydride generation atomic fluorescence spectrometry (HG-AFS) [31], hydride generation](https://img.pdfslide.us/doc/110x75/5e9b921d0c32f926eb3f7a2b/chapter-2-review-of-2pdf-hydride-generation-atomic-fluorescence-spectrometry-hg-afs.jpg)