Embed Size (px)
Citation preview

IAEA-TECDOC-1649
Delayed Hydride Cracking ofZirconium Alloy Fuel Cladding
Delayed Hydride Cracking of Zirconium Alloy Fuel Cladding

IAEA-TECDOC-1649
DELAYED HYDRIDE CRACKING OF ZIRCONIUM ALLOY
FUEL CLADDING
INTERNATIONAL ATOMIC ENERGY AGENCY VIENNA, 2010

COPYRIGHT NOTICE
All IAEA scientific and technical publications are protected by the terms of the Universal Copyright Convention as adopted in 1952 (Berne) and as revised in 1972 (Paris). The copyright has since been extended by the World Intellectual Property Organization (Geneva) to include electronic and virtual intellectual property. Permission to use whole or parts of texts contained in IAEA publications in printed or electronic form must be obtained and is usually subject to royalty agreements. Proposals for non-commercial reproductions and translations are welcomed and considered on a case-by-case basis. Enquiries should be addressed to the IAEA Publishing Section at: Sales and Promotion, Publishing Section International Atomic Energy Agency Vienna International Centre PO Box 100 1400 Vienna, Austria fax: +43 1 2600 29302 tel.: +43 1 2600 22417 email: [email protected] http://www.iaea.org/books
For further information on this publication, please contact:
Nuclear Power Engineering Section International Atomic Energy Agency
Vienna International Centre PO Box 100
1400 Vienna, Austria email: [email protected]
© IAEA, 2010
Printed by the IAEA in Austria October 2010
IAEA-TECDOC-1649
IAEA Library Cataloguing in Publication Data Delayed hydride cracking of zirconium alloy fuel cladding. – Vienna : International Atomic Energy Agency, 2010. p. ; 30 cm. – (IAEA-TECDOC series, ISSN 1011-4289 ; no. 1649) ISBN 978-92-0-108610-5 Includes bibliographical references. 1. Nuclear reactors – Materials. 2. Nuclear fuel claddings – Zirconium alloys – Hydrogen content. 3. Fuel cladding interactions. 4. Zirconium alloys – Cracking. I. International Atomic Energy Agency. II. Series. IAEAL 10-00648

FOREWORD
This report describes the work performed in a coordinated research project on Hydrogen and Hydride Degradation of the Mechanical and Physical Properties of Zirconium Alloys. It is the second in the series. In 2005–2009 that work was extended within a new CRP called Delayed Hydride Cracking in Zirconium Alloy Fuel Cladding. The project consisted of adding hydrogen to samples of Zircaloy–4 claddings representing light water reactors (LWRs), CANDU and Atucha, and measuring the rates of delayed hydride cracking (DHC) under specified conditions. The project was overseen by a supervisory group of experts in the field who provided advice and assistance to participants as required.
All of the research work undertaken as part of the CRP is described in this report, which includes details of the experimental procedures that led to a consistent set of data for LWR cladding. The participants and many of their co-workers in the laboratories involved in the CRP contributed results and material used in this report, which compiles the results, their analysis, discussions of their interpretation and conclusions and recommendations for future work.
The research was coordinated by an advisor and by representatives in three laboratories in industrialized Member States. Besides the basic goal to transfer the technology of the testing technique from an experienced laboratory to those unfamiliar with the methods, the CRP was set up to harmonize the experimental procedures to produce consistent sets of data, both within a single laboratory and between different laboratories. From the first part of this project it was demonstrated that by following a standard set of experimental protocols, consistent results could be obtained. Thus, experimental vagaries were minimized by careful attention to detail of microstructure, temperature history and stress state in the samples.
The underlying idea for the test programme was set out at the end of the first part of the project on pressure tubes. The basic scope of the programme was formulated by the IAEA with help from the supervisory group in 2005. It was based on the materials and experimental procedures developed at the host laboratory of the CRP, Studsvik Nuclear in Sweden. The first research coordination meeting (RCM) was held in June 2005 in Nyköping, Sweden. At this RCM the test method was demonstrated and the scope of the project was confirmed. The initial specimens and test grips were ordered. Once the participants received these items, testing was started and progress was reported at the second RCM held in Pitesti, Romania, in March 2007. Other test materials donated by Canada and Argentina were delivered to the project. The third and final RCM was held in October 2008 in Daejeon, Republic of Korea, where the status of the testing was reported and final testing was decided to fill in gaps in the data. The early data were also presented at the Water Reactor Fuel Performance Meeting (WRFPM), Seoul, Republic of Korea, in October 2008, and published in a special issue of Nuclear Engineering and Technology (2009).
The IAEA wishes to thank all the participants in the CRP for their contribution to this publication. In particular, the IAEA is grateful to C.E. Coleman (Canada) who provided technical advice and programme coordination throughout the project, and to Studsvik Nuclear, Sweden, for hosting and sharing their technical expertise, arranging for the starting test materials, and organizing the first RCM. Special thanks go to the Institute for Nuclear Research in Pitesti, Romania, and to the Korea Atomic Energy Research Institute in Daejeon, Republic of Korea for organizing the second and third RCMs at their institutes. The IAEA officers responsible for this publication were P. Adelfang and V. Inozemtsev of the Division of Nuclear Fuel Cycle and Waste Technology.

CONTENTS SUMMARY ............................................................................................................................... 1 CHAPTER 1. INTRODUCTION .............................................................................................. 3 References to Chapter 1 ............................................................................................................. 6 CHAPTER 2. EXPERIMENTAL PROGRAMME ................................................................... 9
2.1. Philosophy of testing programme .............................................................................. 9 2.2. Materials..................................................................................................................... 9 2.3. Specimen and fixture preparation ............................................................................ 18 2.4. DHC testing.............................................................................................................. 20
References to Chapter 2 ........................................................................................................... 22 CHAPTER 3. RESULTS ......................................................................................................... 23
3.1. Initial test data .......................................................................................................... 23 3.2. Phase 1: Tests at 250ºC on PWR Zircaloy-4 cladding (CWSR Lot 86080) ............ 23 3.3. Phase 1: Tests at temperatures other than 250ºC on PWR Zircaloy-4 cladding (CWSR Lot 86080) ................................................................................................... 29 3.4. Phase 2: Tests at various temperatures on LWR Zircaloy-4 cladding (Lot 83786). 31
3.4.1. Testing of material in the cold worked condition ........................................... 31 3.4.2. Testing of material in the cold worked and stress relieved condition
(480ºC for 3.5 h)............................................................................................... 34 3.4.3. Testing of material in the recrystallized condition (565ºC for 1.5 h).............. 36
3.5. Phase 3: Tests at various temperatures on Atucha and CANDU cladding .............. 37 3.5.1. Atucha ............................................................................................................. 38 3.5.2. CANDU Zircatec............................................................................................. 39 3.5.3. CANDU Sandvik............................................................................................. 40
3.6. Fractography............................................................................................................. 40 Reference to Chapter 3............................................................................................................. 44 CHAPTER 4. DISCUSSION ................................................................................................... 45 References to Chapter 4 ........................................................................................................... 53 CHAPTER 5. CONCLUSIONS AND RECOMMENDATIONS ........................................... 55
5.1. Conclusions .............................................................................................................. 55 5.2. Recommendation...................................................................................................... 55
APPENDIX: CRP DHC-2 CRACK TESTING DATA ........................................................... 57 CONTRIBUTORS TO DRAFTING AND REVIEW ............................................................. 65


SUMMARY Like other hydride-forming metals, zirconium is susceptible to embrittlement by hydrogen when hydrides are formed. The embrittlement takes two forms: short term loss of toughness and a stable, time-dependent crack growth mechanism called delayed hydride cracking (DHC). During DHC, hydrides nucleate and grow slowly in the high stress region of a stress-raiser such as a crack tip. When they reach a critical condition, probably related to size, they fracture, the crack extends and the process is repeated. DHC has been responsible for several failures in components. Time dependent cracking was discovered during the storage at room temperature of Zr-2.5Nb fuel cladding before irradiation. High residual stresses from welding were an important factor in these fractures. Similar stresses were also responsible for cracking in Zr-2.5Nb pressure tubes. The source of these stresses was either the process used to join the pressure tube to the ends of its fuel channel or from tube straightening. Several examples show that fuel cladding made from Zircaloy is also not immune from DHC. In some Zircaloy nuclear fuel cladding used in boiling water reactors (BWR), hydride cracking was strongly implicated in long splits that allowed substantial leakage of fission products. A DHC-type of mechanism has been identified as being responsible for radial cracking starting at the outside surface of BWR fuel cladding when power ramped after a high burnup. Cracks in the axial direction, about 20 mm long and close to the end-plugs of CANDU fuel have been detected. Several partial radial cracks had also started from the inside surface. Thus DHC is of technological importance to the nuclear industry. The two technologically relevant quantities for DHC are the critical stress intensity factor, KI, for crack initiation, called KIH, and the rate of crack propagation, called V. The latter was the subject of the first part of this IAEA Coordinated research programme (CRP) on Zr-2.5Nb Pressure Tube Material, IAEA-TECDOC-1410. As an extension of this CRP, the rate of DHC has been measured in Zircaloy–4 fuel cladding. Several methods are available to test fuel cladding for DHC. The first such successful testing was obtained using a centre-cracked half-tube loaded in tension. To gain insight on the long splits, tubing containing a central axial crack was loaded by a wedge and mandrel - the SPLIT test. The radial crack propagation from the outside surface has been studied by internally pressurizing tubes containing small axial cracks. Axial crack propagation has been measured using the pin-loading tension (PLT) technique. This last method was chosen for the CRP programme because: ⎯ its loading is similar to that in a compact toughness specimen used for Zr-2.5Nb in
CRP-I; ⎯ in a comparison of test methods for fracture toughness of Zircaloy–4 fuel cladding, the
PLT technique provided the lowest values of crack growth resistance indicating that this technique imposes good constraint and limits plasticity at the crack tip;
⎯ the technique was thought to be amenable to technology transfer. The IAEA set up this extension to the CRP with the objective of transferring know-how on laboratory practices to the member states who were unfamiliar with DHC testing of fuel cladding using the PLT method. The first objective of the programme was to establish a uniform and consistent laboratory practice to determine the DHC velocity in the axial direction of fuel cladding so that a meaningful inter-laboratory comparison of the results could be made. A detailed evaluation showed that the technology transfer was successful.
1

Testing on a single batch of fuel cladding containing 200 ppm hydrogen showed that all laboratories obtained values of crack growth rate at 250ºC in a tight distribution with a mean value of 3.47 × 10⁻⁸ ± 0.7 × 10⁻⁸ m/s. The temperature dependence followed Arrhenius behaviour in the temperature range 150 to 275ºC with an activation energy for V of about 53 kJ/mol. Above 275ºC, the cracking rate declined and eventually stopped when the temperature reached 290ºC. The second objective of the programme was to examine the effects of microstructure on V. Six versions of Zircaloy–4 fuel cladding were tested, ranging from as cold worked to fully annealed materials. The materials represented materials used in PWR, BWR, CANDU and Atucha. The results showed that: ⎯ The cracking rate was independent of crack length and therefore stress intensity factor. ⎯ The temperature dependencies of cracking were similar in cold worked and stress
relieved materials. ⎯ The cracking in annealed material was very variable and it may have been tested close
to its threshold stress intensity factor, KIH. ⎯ Material strength was a controlling factor for V, with cracking being fastest in the
strongest material. ⎯ Crystallographic texture was not as important as had been previously thought; fuel
cladding has a strong radial texture, which was thought to suppress DHC, but the materials cracked readily.
⎯ The fractographic feature called striations, which are so dominant in the DHC of Zr-2.5Nb, were absent indicating that they are not a fundamental characteristic of DHC in Zircaloy.
⎯ The decline in V at high temperatures is attributed to KIH rapidly increasing with temperature around 280ºC and eventually being higher than the applied stress intensity factor.
During the project advanced techniques for measurements of the rate of DHC propagation in cladding zirconium alloys were successfully transferred from the host laboratory (Studsvik Nuclear) to all participating organizations, and a statistically valuable set of experimental results was obtained by following the pre-agreed testing procedures. The results contributed to better understanding of the DHC phenomenon and were reported at a number of international conferences including WRFPM-2008 and ASTM Zr Symposium 2010. They have stimulated some national programmes that are useful as a base for interpreting the behaviour of irradiated materials and for the application of post-service fuel storage. Another technologically important DHC parameter, the critical stress intensity factor for crack initiation KIH, is recommended for further studies in both Zr-2.5Nb pressure tube materials and Zircaloy fuel cladding. Such new project would exploit the experience built-up over the past eight years of IAEA-coordinated research activities targeting the mechanisms of hydrogen induced degradation of operational properties of zirconium materials.
2

CHAPTER 1
INTRODUCTION
Zirconium is the main base metal for alloys used as fuel cladding and structural components in water cooled nuclear reactors. These alloys have low capture cross-sections for thermal neutrons, maintain good mechanical properties both during and after irradiation with fast neutrons, and resist corrosion. Zirconium alloys have provided excellent service but, like other hydride-forming metals, zirconium is susceptible to embrittlement by hydrogen when hydrides are formed [1.1]. The embrittlement takes two forms: short term loss of toughness and a stable, time-dependent crack growth mechanism called delayed hydride cracking (DHC). During DHC, hydrides nucleate and grow slowly in the high stress region of a crack tip. When they reach a critical condition, probably related to size, they fracture, the crack extends and the process is repeated. The characteristics of the mechanism are: ⎯ Often time is required between the imposition of stress and the start of cracking. This
period is called the incubation time. ⎯ Loading must exceed a threshold condition for cracking, often characterized as KIH. The
rate of any subsequent cracking, V, is almost independent of KI. ⎯ The temperature dependence of cracking is complicated and is described in the
schematic diagram depicted in Fig. 1.1 (Ref [1.2]). The maximum value of V has an apparent Arrhenius behaviour and follows
V = A·exp(-Q/RT) (1.1)
where Q is the activation energy for DHC in kJ/mol, R is the gas constant (8.314 kJ/mol·K), and T is the temperature in K and A is a constant.
If the temperature is attained by heating from T1, initially V follows Equation (1.1) but as the temperature is increased, V starts to decline at T2 and cracking eventually stops at T3. On cooling from a high temperature, T4, a temperature is reached where cracking will reinitiate, T5, and reach a maximum value at T6; at lower temperatures V follows Equation (1.1).
⎯ The amount of hydrogen present in the material should be sufficient for hydrides to be precipitated at the crack tip.
⎯ The material microstructure may affect V through its effect on the diffusivity of hydrogen, material strength and mode of hydride precipitation, for example, through crystallographic texture.
⎯ A sharp decline in DHC is observed at high test temperatures, despite the temperature being attained by cooling and sufficient hydrogen being present to form hydrides. In Zr-2.5Nb the decline starts at about 310ºC [1.3].
In the early development of the alloys of titanium, an element in the same group as zirconium in the Periodic Table, a form of DHC was a scourge to their application but zirconium alloys were thought to be immune. Attempts to induce DHC in Zircaloy-2,
3

FIG. 1.1. Schematic diagram of temperature dependence of DHC in zirconium alloys [1.2]. The conditions for testing are aimed at being below T6.
Zr-2.5Nb and Zr-1.25Al-1Sn-1Mo seemed to indicate that such cracking was difficult [1.4, 1.5]. Time dependent cracking was discovered during the storage at room temperature of Zr-2.5Nb fuel cladding before irradiation [1.6]. High residual stresses from welding were an important factor in these fractures. High residual stresses were also responsible for cracking in Zr-2.5Nb pressure tubes. The source of these stresses was either the process used to join the pressure tube to the ends of its fuel channel [1.7] or from tube straightening [1.8]. DHC was the mechanism for propagation of cracks formed at hydride blisters in Zircaloy-2 pressure tubes [1.9]; here a large temperature gradient contributed to the accumulation of hydrides at the crack tip. In some Zircaloy nuclear fuel cladding used in boiling water reactors (BWR), hydride cracking was strongly implicated in long splits that allowed substantial leakage of fission products [1.10, 1.11, 1.12]. Cladding in BWRs is usually a tube with diameter of about 10 mm, wall thickness of about 0.6 mm and length of about 4 m. The Zircaloy is usually recrystallized and in some designs of fuel rod the inside surface is lined with another zirconium alloy or pure zirconium, to prevent stress corrosion cracking by fission products, such as iodine [1.13]. If the cladding wall is penetrated during operation, for example by fretting, water from the heat-transport system can enter the fuel cavity where, because of the low pressure, steam is produced. Much hydrogen is generated because the steam oxidizes the fuel and the inside surface of the cladding, reducing the partial pressure of oxygen and leaving a gas rich in hydrogen. This process is called ‘oxygen starvation’. At some distance from the
4

primary defect the gas stream becomes almost pure hydrogen, and with break down of the protective oxide layer, copious quantities of hydrogen may be absorbed by the cladding [1.14]. Sometimes, ‘sunbursts’ of hydride formed on the inside surface. Although the pure Zr liner was often found to be completely corroded and therefore contributed hydrogen to the inventory and stress through expansion via the oxide, it was not a necessary requirement for the secondary damage because unlined fuel cladding behaved in a similar manner. With fuel expansion during fuel rearrangement, the hydrided cladding was stressed, which led to crack initiation. The cracks grew through-wall, propagated axially, and could be over 1 m long. Brittle regions in “chevrons” characterized the fractures, with the crack being longer on the outside surface than the inside surface of the cladding [1.15]. The lower bounds of the crack velocities were in the range 4 × 10⁻⁸ to 6.6 × 10⁻⁷ m/s based on assuming constant growth rates in the time between first detection of the defect and removal of the fuel. The mechanism of cracking appeared to be a form of DHC [1.11, 1.16], perhaps exacerbated by a continuous additional supply of hydrogen from the steam inside the fuel element [1.17, 1.18]. A DHC-type of mechanism has been identified as being responsible for radial cracking starting at the outside surface of BWR fuel cladding when power ramped after a high burnup [1.19]. Tests on unirradiated cladding demonstrated that the velocity of DHC in the radial direction of the tube obeyed equation (1.1) and V was about 10-7 m/s at 275ºC [1.20, 1.21]. The two technologically important quantities for DHC are the conditions for crack initiation and the rate of crack propagation. The latter was the subject of the first part of this IAEA CRP. The details of the results of testing on Zr-2.5Nb pressure tube material and a state of the art review were issued in an IAEA-TECDOC-1410[1.22] and summarised in Ref [1.23]. As an extension of this CRP, the rate of DHC has been measured in Zircaloy fuel cladding. Several methods are available to test fuel cladding for DHC. The first such successful testing was obtained using a centre-cracked half-tube loaded in tension [1.24]. To gain insight on the long splits, tubing containing a central axial crack was loaded by a wedge and mandrel — the SPLIT test [1.17]. The radial crack propagation from the outside surface has been studied by internally pressurizing tubes containing small axial cracks [1.20, 1.21]. Axial crack propagation has been measured using the pin-loading tension (PLT) technique [1.25]. This last method was originally developed at Studsvik for fracture toughness evaluation of thin walled tubing [1.26, 1.27] and was chosen for the CRP programme because: ⎯ Its loading is similar to that in a compact toughness specimen used in CRP I; ⎯ In a comparison of test methods for fracture toughness of Zircaloy–4 fuel cladding, the
PLT technique provided the lowest values of J0.2 and dJ/da indicating that this technique provides good constraint and limits plasticity at the crack tip [1.28];
⎯ The technique was thought to be amenable to technology transfer, especially since an established member of the CRP developed the method.
The IAEA set up this extension to the CRP on Hydrogen and Hydride-Induced Degradation of the Mechanical and Physical Properties of Zirconium-based Alloys, with the objective of transferring know-how on laboratory practices to the member states who participated in the first stage of the CRP but were unfamiliar with DHC testing of fuel cladding using the PLT method. The participants in this stage of the CRP are listed in Table 1.1; Brazil replaced China as a participant. The major goal of the programme was to establish a uniform and consistent laboratory practice to determine the DHC velocity in the axial direction of fuel cladding to be followed internationally so that a meaningful inter-laboratory comparison of the results could be made. The test materials were all versions of Zircaloy–4.
5

In this report, Chapter 2 describes the materials, specimen preparation and test methods, the test results are displayed in Chapter 3 and discussed in Chapter 4, while in Chapter 5 conclusions and recommendations are made.
TABLE 1.1. PARTICIPATING COUNTRIES AND THEIR REACTOR TYPES OF INTEREST
INSTITUTE1 COUNTRY REACTOR TYPE
CNEA Argentina CANDU, PWR (D2O moderated) IPEN Brazil PWR AECL Canada CANDU BARC India CANDU KAERI Korea, Rep. of CANDU, PWR
LEI Lithuania RBMK PINSTECH Pakistan CANDU
INR Romania CANDU VNINM Russian Federation RBMK, WWER
STUDSVIK Sweden BWR, PWR, surveillance on RBMK
REFERENCES TO CHAPTER 1 [1.1] COLEMAN, C.E., Cracking of hydride-forming metals and alloys, Comprehensive
Structural Integrity, Elsevier, Chapter 6.03, (2003), 103–161. [1.2] CHEADLE, B.A., COLEMAN, C.E., AMBLER, J.F.R., Prevention of delayed
hydride cracking in zirconium alloys, Zirconium in the Nuclear Industry – Seventh International Symposium, ASTM STP 939, Philadelphia, PA., (1987), 224–240.
[1.3] SMITH, R.R., EADIE, R.L., High temperature limit for delayed hydride cracking, Scripa Met., 22, (1988), 833–836.
[1.4] ÖSTBERG, G., Some observations on the ductility of zirconium alloys, with special reference to the effect of hydrogen, J. Inst. Metals, 93, (1964-65), 223–228
[1.5] WEINSTEIN, D., HOLTZ, F.C., Susceptibility of zirconium and zirconium alloys to delayed failure hydrogen embrittlement, Trans. ASM. 57, (1964), 284–293.
[1.6] SIMPSON, C.J., ELLS, C.E., Delayed hydrogen embrittlement of Zr-2.5wt%Nb J. Nucl. Mater. 52, (1974), 289–295.
[1.7] PERRYMAN, E.C.W., Pickering pressure tube cracking experience, Nucl. Energy 17, (1978), 95–105.
[1.8] PLATONOV, P.A., et al, The study of cause of cracking in zirconium alloy channel tubes, Poster Paper at ASTM Zirconium in the Nuclear Industry – Eighth International Symposium, AECL Report RC 87, (1988).
[1.9] FIELD, G.J., DUNN, J.T., CHEADLE, B.A., Analysis of the pressure tube failure at pickering NGS “A” unit 2, Can. Met. Quart. 24, (1985), 181–188.
1 The names of the contributing persons are given at end of this publication.
6
[1.10] JONSSON, A., HALLSTADIUS, L., GRAPENGIESSER, B., LYSELL, G., Failure of
a barrier rod in Oskarshamn, in Fuel in the ‘90’s, International Topical Meeting on LWR Fuel Performance, Avignon, France, ANS and ENS, (1991), 371–377.
[1.11] SCHRIRE, D., et al, Secondary defect behaviour in ABB BWR fuel, International Topical Meeting on LWR Fuel Performance, West Palm Beach, ANS, (1994) 398–409.
[1.12] ARMIJO, J.S., Performance of failed BWR fuel, International Topical Meeting on LWR Fuel Performance, West Palm Beach, ANS, (1994), 410–422.
[1.13] ARMIJO, J.S., COFFIN, L.F., ROSENBAUM, H.S., Development of zirconium-barrier fuel cladding, Zirconium in the Nuclear Industry – 10th International Symposium, ASTM STP 1245, ASTM, West Conshohocken, PA, (1994), 3–18.
[1.14] CLAYTON, J.C., Internal hydriding in irradiated defected zircaloy fuel rods, Zirconium in the Nuclear Industry – 8th International Symposium, ASTM 1023, West Conshohocken, PA, (1989), 266–288.
[1.15] LYSELL, G., GRIGORIEV, V., Characteristics of axial splits in failed BWR fuel rods, Ninth International Symposium on Environment Degradation of Materials in Nuclear Power Systems – Water Reactors, AIME-TMS, (1999), 1.169–1.175.
[1.16] EFSING, P., PETTERSSON, K., Delayed hydride cracking in irradiated Zircaloy cladding, Zirconium in the Nuclear Industry – 12th International Symposium, ASTM STP 1354, West Conshohocken, PA., (2000), 340–355.
[1.17] EDSINGER, K., DAVIES, J.H., ADAMSON, R.B., Degraded fuel cladding fractography and fracture behavior, Zirconium in the Nuclear Industry – 12th International Symposium, ASTM STP 1354, G.P. Sabol and G.D. Moan, Eds., ASTM, West Conshohocken, PA., (2000), 316-339.
[1.18] EDSINGER, K., A review of fuel degradation in BWRs, Int. Topical Meeting on Light Water Reactor Fuel Performance, Park City, ANS, (2000), 162–179.
[1.19] SHIMADA, S., ETOH, E., HAYASHI, H., TUKUTA, Y., A metallographic and fractographic study of outside-in cracking caused by power ramp tests, J. Nucl. Mater. 327, (2004), 97–113.
[1.20] SAKAMOTO, K., NAKATSUKA, M., HIGUCHI, T., Simulation of cracking during outside-in type failure of high burn-up fuel cladding tubes, Water Reactor Fuel Performance Meeting, Seoul, (2008), Paper 8009.
[1.21] OGATA, K., BABA, T., KAMIMURA, K., ETOH, Y., ITO, K., Separate effects of factors affecting outside-in cracking of high burnup fuel cladding, Water reactor fuel performance meeting, Seoul, (2008), Paper 8130.
[1.22] INTERNATIONAL ATOMIC ENERGY AGENCY, Delayed hydride cracking in zirconium alloys in pressure tube nuclear reactors, IAEA-TECDOC-1410, IAEA, Vienna (2004).
[1.23] COLEMAN, C.E., INOZEMTSEV, V.V., Measurement of rates of delayed hydride cracking (DHC) in Zr-2.5 Nb alloys – an IAEA Coordinated Research Project, J. ASTM International 5, (2008), Paper JAI101091.
[1.24] EFSING, P., PETTERSSON, K., The influence of temperature and yield strength on delayed hydride cracking in hydrided Zircaloy-2, Zirconium in the Nuclear Industry – Eleventh International Symposium, ASTM STP 1295, Philadelphia, PA., (1996), 394–404.
[1.25] GRIGORIEV, V., JAKOBSSON, R., Delayed hydride cracking velocity and J-integral measurements on irradiated BWR cladding, J.ASTM International 2, (2005), Paper JAI 12434 (Also see ASTM STP 1467, (2006), 711–728).
7

[1.26] GRIGORIEV, V., JOSEFSSON, B., LIND, A., ROSBORG, B., A Pin-Loading
Tension test for evaluation of thin-walled tubular materials, Scripta Metallurgica et Materialia, Vol. 33, No. 1, (1995), 109–114.
[1.27] GRIGORIEV, V., JOSEFSSON, B,. ROSBORG, B., Fracture toughness of Zircaloy cladding tubes, Zirconium in the Nuclear Industry – Eleventh International Symposium, ASTM STP 1295, Philadelphia, PA., (1996), 431–447.
[1.28] YAGNIK, S.K., ET AL., Round-robin testing of fracture toughness characteristics of thin-walled tubing, J. ASTM International 5, (2008), Paper JAI101140.
8

CHAPTER 2
EXPERIMENTAL PROGRAMME
2.1. PHILOSOPHY OF TESTING PROGRAMME The programme was set up using the previous CRP on Zr-2.5Nb as a guide. For the first phase the host laboratory, Studsvik (Sweden), supplied test fixtures, two fully prepared samples and a section of the same fuel cladding for each country to prepare specimens in their own each laboratory. Everyone tested several of these specimens at a single temperature, 250ºC, to establish the technique and solve any experimental problems. The remaining material was tested at other temperatures prescribed by a test matrix. For the second phase, similar cladding, but from a different batch, was taken after final cold pilgering. This cladding was heat-treated in the laboratory at the temperatures and times typical for PWR and BWR cladding. These three materials — as-cold worked, stress relieved, and fully recrystallized — were then hydrided and tested at the same temperatures as in the first phase. Subsequently, in a third phase, a small number of tests were done on two representative samples of CANDU and one sample of Atucha fuel cladding. All the specimens contained about 200 ppm to represent a concentration well towards the end of life of BWR fuel rods and to guarantee that hydrides are present throughout testing. 2.2.MATERIALS The material used for Phase 1 was standard Zircaloy–4 from Sandvik lot 86080. The main elements in the chemical composition are given in Table 2.1. During fabrication the final pilgering imposed 80% cold-work, based on area reduction on a cylindrical mandrel, and the final heat-treatment was 480ºC for 3.5 h. The tube dimensions are listed in Table 2.2. The microstructure consisted of elongated grains, with between 5 and 10% recrystallised grains and Zr-(FeCr)2 second phase particles, Fig. 2.1. The (0002) pole figure is shown in Fig. 2.2. The basal plane normals were concentrated about 30º from the radial direction; the texture factors, F, in the three principal directions, radial, R, transverse, T, and axial, A, are summarised in Table 2.3. The tensile properties of the tubes are provided in Table 2.4. For Phase 2 the material was similar, being Zircaloy–4 fuel cladding from Sandvik lot 83786. The small difference in chemical composition was a slightly higher concentration of oxygen than in lot 86080, Table 2.1. The material was tested in the cold worked condition. Sections of tubing were also heat-treated to simulate that used for PWRs — 480ºC for 3.5 h — and for BWRs —565ºC for 1.5 h. Since the material for Phase 2 was taken from the manufacturing route direct after final pilgering, its wall thickness was slightly larger than that of lot 86080, Table 2.2. The initial cold worked microstructure consisted of elongated grains, Fig. 2.3, that were little changed by the stress-relieving treatment, Fig. 2.4, but completely recrystallized by the higher temperature anneal, Fig. 2.5, with grains that are almost equiaxed having a mean diameter of about 3 μm.
9
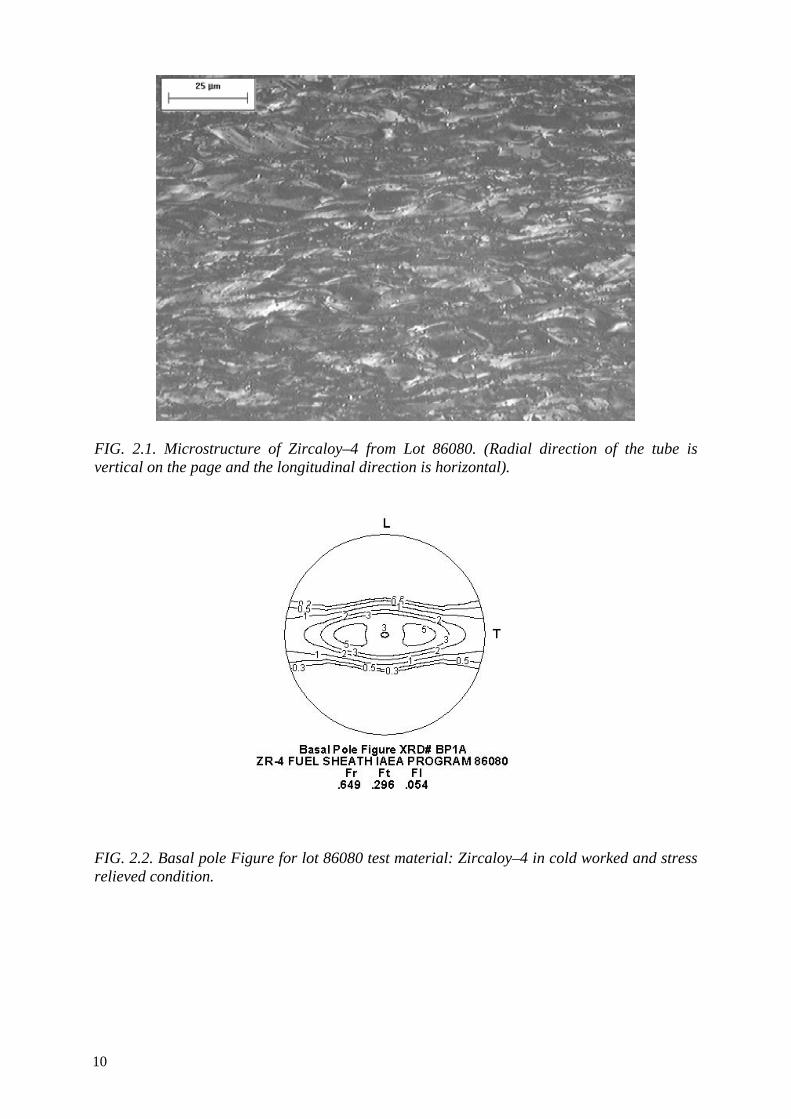
FIG. 2.1. Microstructure of Zircaloy–4 from Lot 86080. (Radial direction of the tube is vertical on the page and the longitudinal direction is horizontal).
FIG. 2.2. Basal pole Figure for lot 86080 test material: Zircaloy–4 in cold worked and stress relieved condition.
10

FIG. 2.3. Microstructure of Zircaloy–4 from Lot 83786 in the cold worked condition (Radial direction of the tube is vertical on the page and the longitudinal direction is horizontal).
FIG. 2.4. Microstructure of Zircaloy–4 from Lot 83786 in the cold worked and stress relieved condition (Radial direction of the tube is vertical on the page and the longitudinal direction is horizontal).
11

FIG. 2.5. Microstructure of Zircaloy–4 from Lot 83786 in the recrystallized condition (Radial direction of the tube is vertical on the page and the longitudinal direction is horizontal). The (0002) pole figures for each treatment are similar, Figs. 2.6 to 2.8, with a small rotation from the radial direction towards the transverse direction with heat-treatment, as indicated by the texture factors, Table 2.3. The strength is reduced by heat-treatment, Table 2.4. Note that these strengths do not include the effect of the treatment to add hydrogen.
TABLE 2.1. CHEMICAL COMPOSITION OF TEST MATERIALS
Materials Element PWR PWR CANDU CANDU Atucha
Sandvik Sandvik Zircatec Sandvik FAE Lot 86080 Lot 83786 Lot 226289 Lot 81101 Lot MA-61
Sn (wt.%) 1.25 1.26 1.3 1.35 1.29 Fe (wt.%) 0.22 0.23 0.22 0.22 0.23 Cr (wt.%) 0.1 0.12 0.12 0.10 0.12 O (ppm) 1180 1272 1180 1260 1200 Si (ppm) 100 100 100 60 98 C (ppm) 120 120 140 120 132 N (ppm) 49 41 24 <30 28 H (ppm) 7 7 8 13 4
12

FIG. 2.6. Basal pole Figure for Lot 83786 test material in the cold worked condition.
FIG. 2.7. Basal pole Figure for Lot 83786 test material in the cold worked and stress relieved condition.
13

FIG. 2.8. Basal pole Figure for Lot 83786 test material in the recrystallized condition. Three other batches of cladding were used in Phase 3. For the CANDU cladding supplied by Zircatec, the last stage of cold working was about 90% and the final stress relieving was 500ºC for 8 h. The composition of the Zircaloy–4, Table 2.1, and the (0002) distribution, Fig. 2.9 and Table 2.3, were similar to those of the LWR cladding. The dimensions of the CANDU cladding differ from the LWR cladding having a larger diameter and thinner wall, Table 2.2. It also has lower strength, Table 2.4. The clearly defined grains were elongated in the axial direction, Fig. 2.10, but almost equiaxed on the transverse-radial section, Fig. 2.11, with a mean grain diameter of about 4 μm. For the CANDU cladding supplied by Sandvik, the composition of the Zircaloy–4 is given in Table 2.1. This CANDU cladding also differs from the LWR cladding having a larger diameter and thinner wall, Table 2.2, and lower strength, Table 2.4. The grain size was about 5.8 μm on the transverse-radial section but elongated in the longitudinal direction. For the Atucha cladding, the last stage of cold-working was 57% and the final stress relieving was 510ºC for 8.5 h. The composition of the Zircaloy–4, Table 2.1, and the (0002) distribution, Table 2.3, again were similar to those of the LWR cladding. The Atucha cladding has a larger diameter but similar wall thickness as the LWR cladding, Table 2.2, and lower strength, Table 2.4. The clearly defined grains were elongated in the axial direction, but almost equiaxed on the transverse-radial section, with a mean grain diameter of about 2 μm in the radial direction and 3 μm in the transverse direction.
14

TABLE 2.2. DIMENSION OF TEST MATERIALS
Materials Dimensions PWR PWR CANDU CANDU Atucha
Sandvik Sandvik Zircatec Sandvik FAE Lot 86080 Lot 83786 Lot 226289 Lot 81101 Lot MA-61
Outside diameter 9.5 9.5 13.1 13.1 11.9 (mm)
Wall thickness 0.57 0.60 0.39 0.39 0.55
(mm)
TABLE 2.3. TEXTURE FACTORS FOR BASAL PLANES IN TEST MATERIALS
Materials Texture PWR PWR PWR PWR CANDU Atucha factors Sandvik Sandvik Sandvik Sandvik Zircatec FAE Lot 86080 Lot 83786 Lot 83786 Lot 83786Lot 226289 Lot MA-61 CWSR CW CWSR RXA
FR 0.65 0.65 0.64 0.60 0.65 0.56
FT 0.30 0.29 0.30 0.34 0.30 0.29
FL 0.05 0.06 0.05 0.06 0.05 0.15
TABLE 2.4. TENSILE PROPERTIES OF TEST MATERIALS
Material Test Direction Test 0.2% UTS Total L: longitudinal Temperature Stress Elongation T: transverse (ºC) (MPa) (MPa) (%)
PWR L 20 553 758 19
Sandvik L 385 355 448 20 Lot 86080 T 200 541
CWSR T 200 544 480 C for 3.5 h + T 250 502
410 C for 24 h T 290 480 T 290 474 T 320 459
PWR T 200 588 Sandvik T 250 535
Lot 83786 T 250 529 CW T 290 498
T 320 478 T 320 473
15

TABLE 2.4. (cont.)
PWR L 20 589 779 16 Sandvik L 385 370 466 17
Lot 83786 T 200 570 CWSR T 250 508
480 C for 3.5 h T 250 511 T 290 489 T 320 469 T 320 462
PWR T 25 526 Sandvik T 25 507
Lot 83786 T 250 270 RXA T 350 228
565 C for 1.5 h
CANDU L 20 487 615 30 Zircatec T (burst test) 20 … 868 24
Lot 226289 T 22 512 609 35.6 500 C for 8 h T 22 492 602 42.4
T 100 448 507 45.7 T 100 441 510 43.3 T 200 391 416 48.7 T 200 375 414 42.9 T 300 345 373 49.7 T 300 303 368 52.1 T 350 301 346 43.5 T 350 299 345 34.4
Material Test Direction Test 0.2% UTS Total L: longitudinal Temperature Stress Elongation T: transverse (ºC) (MPa) (MPa) (%)
CANDU L (Tube tensile) 20 470 580 32 Sandvik T (burst test) 20 … 760 31
Lot 81101 T 20 498 589 18 T 250 300 424 20
Atucha L 20 460 584 27 FAE T 20 557
Lot MA-61 T 20 594 T 200 412 T 200 399 T 250 362 T 250 372 T 300 348 T 300 344
16

FIG. 2.9. Basal pole Figure for CANDU Lot 226289 test material in the cold worked and stress relieved condition.
FIG. 2.10. Microstructure of Zircaloy–4 from CANDU Lot 226289 in the cold worked and stress relieved condition; longitudinal section.
17
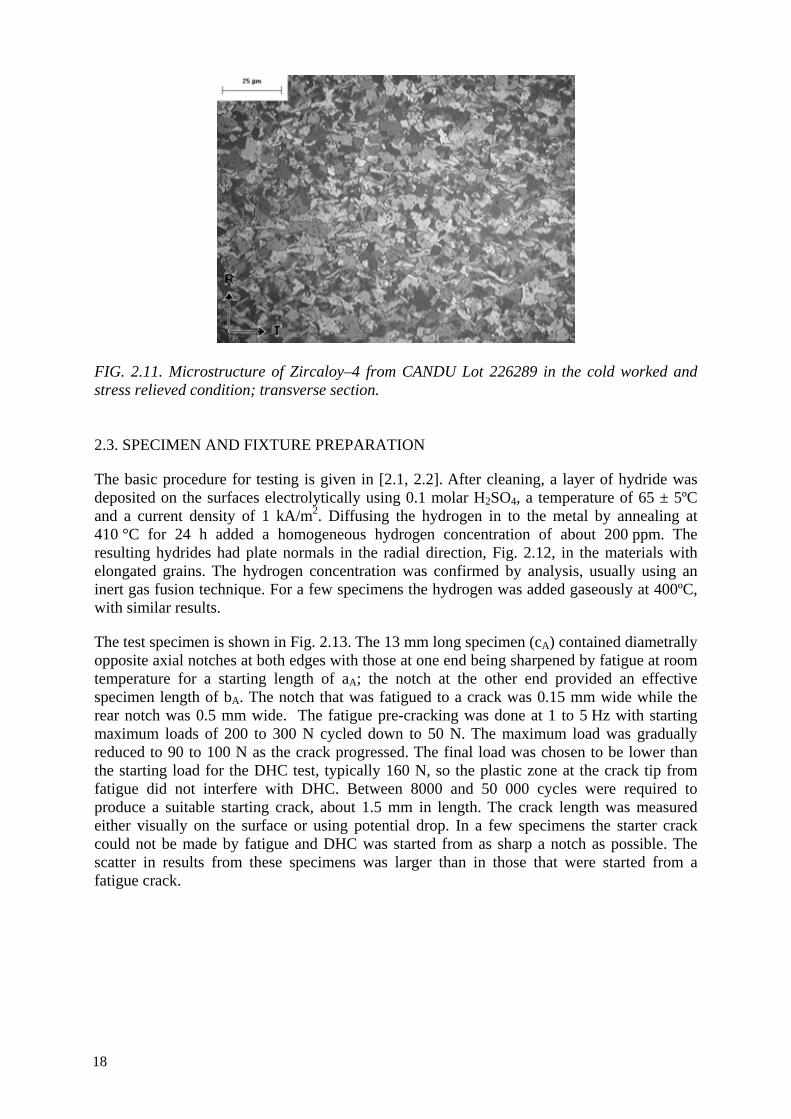
FIG. 2.11. Microstructure of Zircaloy–4 from CANDU Lot 226289 in the cold worked and stress relieved condition; transverse section. 2.3. SPECIMEN AND FIXTURE PREPARATION
The basic procedure for testing is given in [2.1, 2.2]. After cleaning, a layer of hydride was deposited on the surfaces electrolytically using 0.1 molar H2SO4, a temperature of 65 ± 5ºC and a current density of 1 kA/m2. Diffusing the hydrogen in to the metal by annealing at 410 °C for 24 h added a homogeneous hydrogen concentration of about 200 ppm. The resulting hydrides had plate normals in the radial direction, Fig. 2.12, in the materials with elongated grains. The hydrogen concentration was confirmed by analysis, usually using an inert gas fusion technique. For a few specimens the hydrogen was added gaseously at 400ºC, with similar results.
The test specimen is shown in Fig. 2.13. The 13 mm long specimen (cA) contained diametrally opposite axial notches at both edges with those at one end being sharpened by fatigue at room temperature for a starting length of aA; the notch at the other end provided an effective specimen length of bA. The notch that was fatigued to a crack was 0.15 mm wide while the rear notch was 0.5 mm wide. The fatigue pre-cracking was done at 1 to 5 Hz with starting maximum loads of 200 to 300 N cycled down to 50 N. The maximum load was gradually reduced to 90 to 100 N as the crack progressed. The final load was chosen to be lower than the starting load for the DHC test, typically 160 N, so the plastic zone at the crack tip from fatigue did not interfere with DHC. Between 8000 and 50 000 cycles were required to produce a suitable starting crack, about 1.5 mm in length. The crack length was measured either visually on the surface or using potential drop. In a few specimens the starter crack could not be made by fatigue and DHC was started from as sharp a notch as possible. The scatter in results from these specimens was larger than in those that were started from a fatigue crack.
18

a
b
FIG. 2.12. Distribution of hydrides on (a) transverse-radial plane, and (b) longitudinal-radial plane. Lot 86080 in CWSR condition.
FIG. 2.13. Schematic diagram of test specimen and pin-loading tension fixture.
R
L
R
T 100µm
100µm
19

FIG. 2.14. The PLT fixture; a specimen is in place on the left side.
The pin-loading tension fixture is shown schematically in Fig. 2.13 and in a photograph in Fig. 2.14. Most of the fixtures were made from Nimonic 90 but successful testing has been achieved using fixtures made from carbon steel. The fixture consisted of two halves, which, when placed together, form a cylindrical holder, A. The diameter of the holder allowed it to be inserted into the specimen while maintaining a small gap. The fixture halves were loaded in tension through pins at B and rotated about a pin C at the ends of the cylindrical holder providing similarity to the loading of a compact toughness specimen, but on two cracks. Care was taken to line up the pre-cracked notches with the join of the two halves of the fixture.
2.4. DHC TESTING To start a DHC test, the specimen was heated to and held at a temperature 50 to 75°C above the test temperature then cooled with no undercooling to the test temperature. This temperature history encourages cracking and minimises variation; this sequence represents T4 to below T6 in Fig. 1.1, rather than T1 to T3 in Fig. 1.1, where cracking can be difficult. After a short period at constant temperature, at least 30 minutes, the specimen was loaded to a KI of about 15 MPa√m. The test history is depicted in Fig. 2.15. The value of KI was calculated from Equation (2.1):
KI = [P/(2t√W)]f(a/W) (2.1) where P = load (N); t = wall thickness of the cladding (m); W = effective width of specimen (m), being distance from the load line to
the axis of rotation; see Fig. 2.13; a = effective crack length (m), being distance from load line to the crack tip; see Fig. 2.13.
20

f (a/W) = geometry correction factor.
The value of f(a/W) was determined experimentally from compliance measurements, resulting in:
f(a/W) = 92.203 - 468.73(a/W) + 787.15(a/W)2 - 360.99(a/W)3 (2.2)
for LWR cladding [2.2] and f(a/W) = -0.4759 + 13.185(a/W) + 39.533(a/W)2 –23.65(a/w)3 +12.135(a/W)4 –2.9162(a/W)5 (2.3)
for CANDU cladding.
Cracking was detected either by potential drop (PD) or by displacement, equivalent to crack opening. Once the cracks had extended 2 to 3 mm, the load was removed and the specimen cooled to room temperature. The crack surfaces are lightly heat-tinted from oxidation and the ends of the crack can usually be discerned on the fracture surface. An alternative was to briefly fatigue the specimen to mark the end of the DHC. Subsequently, the specimen was broken open and the fracture surface examined. A typical pair of fracture surfaces is shown in Fig. 2.16. In this example the delayed hydride crack is about 3 mm long. Crack growth by DHC, aF-a0 (Fig. 2.16), was estimated on each crack from the average of nine equally spaced measurements; the value for the specimen, aS, was the average of the values of the two cracks. Often an incubation period, ti, was required before DHC started; cracking time, tT, was taken as (time under load - ti). Crack velocity, V, in the axial direction of the cladding was aS/tT. A scanning electron microscope (SEM) was used to examine the fracture surfaces of some specimens to provide details of the fracture mechanism.
Tem
pera
ture
Time
5 oC/min
1,5 oC/min
Peak temperature , 60 min
Test temperature 35 min
loading
FIG. 2.15. Schematic diagram of the temperature cycle used for DHC tests.
30 min
21

FIG. 2.16. View of the fracture surfaces of CWSR Zircaloy–4 specimen (200 ppm of hydrogen). The top and bottom edges are the outside surfaces of the cladding. The initial (a0) and the final (aF) length of the DHC crack are indicated as well as the areas of notch, fatigue pre-cracking, DHC crack propagation and room temperature fracture after the DHC test (RT). A test matrix was established for phases 1 and 2 on the LWR material in which, in principle, each test temperature was sampled by at least two tests by three countries. Since it was quickly discovered that cracking was suppressed at high temperatures, the temperature intervals above 275ºC were much smaller than at lower temperatures. The nominal test matrix is given in Table 2.5. In practice, some temperatures were lightly sampled because of experimental difficulties. TABLE 2.5. TEST MATRIX FOR DHC TESTING
Test temperature Brazil, India, Lithuania Argentina, Korea, Russia Pakistan, Romania, SwedenºC
144 + 186 + 203 + 227 + 250 + + + 283 + 290 + 295 + 300 + 310 +
REFERENCES TO CHAPTER 2
[2.1] GRIGORIEV, V., JAKOBSSON, R., Application of the pin-loading tension test to
measurements of delayed hydride cracking velocity in Zircaloy cladding, SKI Report 0057, Studsvik Nuclear AB, (November 2000).
[2.2] GRIGORIEV, V., JAKOBSSON, R., DHC axial crack velocity measurements in Zirconium alloy fuel cladding, STUDSVIK/N-05/281, Studsvik Nuclear AB, ISBN 91-7010-377-1, (December 2005).
22
CHAPTER 3
RESULTS
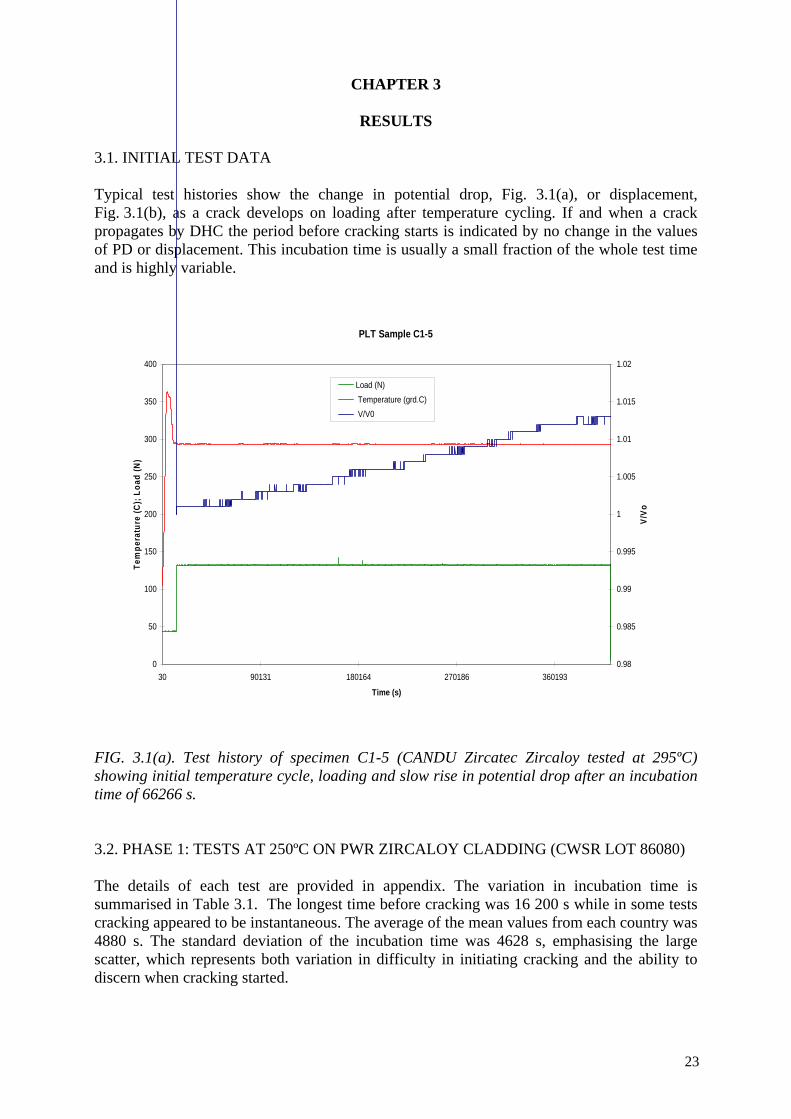
3.1. INITIAL TEST DATA Typical test histories show the change in potential drop, Fig. 3.1(a), or displacement, Fig. 3.1(b), as a crack develops on loading after temperature cycling. If and when a crack propagates by DHC the period before cracking starts is indicated by no change in the values of PD or displacement. This incubation time is usually a small fraction of the whole test time and is highly variable.
PLT Sample C1-5
0
50
100
150
200
250
300
350
400
30 90131 180164 270186 360193
Time (s)
Tem
per
atu
re (
C);
Lo
ad (
N)
0.98
0.985
0.99
0.995
1
1.005
1.01
1.015
1.02
V/V
o
Load (N) Temperature (grd.C) V/V0
FIG. 3.1(a). Test history of specimen C1-5 (CANDU Zircatec Zircaloy tested at 295ºC) showing initial temperature cycle, loading and slow rise in potential drop after an incubation time of 66266 s. 3.2. PHASE 1: TESTS AT 250ºC ON PWR ZIRCALOY CLADDING (CWSR LOT 86080) The details of each test are provided in appendix. The variation in incubation time is summarised in Table 3.1. The longest time before cracking was 16 200 s while in some tests cracking appeared to be instantaneous. The average of the mean values from each country was 4880 s. The standard deviation of the incubation time was 4628 s, emphasising the large scatter, which represents both variation in difficulty in initiating cracking and the ability to discern when cracking started.
23

TABLE 3.1. INCUBATION TIMES [s] OF ZIRCALOY–4 CLADDING (LOT 86080) AT 250ºC.
Brazil India ROK Lithuania Pakistan Romania Russia Sweden 16200 600 3780 5340 303.6 0 8100 3720 14400 2400 4260 10200 4140 0 1800 2580 18000 3600 960 4200 3399 0 300 0 10800 0 2700 8100 5022 0 4350 2760 600 6120 2520 6175.2 0 210 720 0 1500 4500 2276 1800 1800 1800 2940 3780 0 1200 7320 9231 3420 2280 372 30 1200 4440
Average 14850 1275 3220 5640 4291 1935* 2952 1930 Stdev 3074 1260 1905 2677 2660 1593* 3329 1380
* Values excluding zeros.
FIG. 3.1(b). Test history of specimen S6-I10 (Zircaloy from batch 86080 tested at 200ºC) showing initial temperature cycle, loading and gradual rise in crack-opening displacement after an incubation time of about 3600 s. Crack velocity, V, was much more tractable, Table 3.2. The range of the mean value of each data set was from 2.42 to 3.97 × 10⁻⁸ m/s while the standard deviation ranged from 0.16 to 0.70 × 10⁻⁸ m/s; most values were about 0.3 × 10⁻⁸ m/s, representing about 11% variation. The maximum and minimum values in the whole data set were 4.72 × 10⁻⁸ m/s to 1.72 × 10⁻⁸ m/s, respectively. The mean value from all 64 specimens was 3.47 × 10⁻⁸ m/s with a standard deviation of 0.70 × 10⁻⁸ m/s. The peaked distribution of the values of V is shown in Fig. 3.2.
24

TABLE 3.2. DHC VELOCITIES [m/s×10-8] OF ZIRCALOY–4 CLADDING (LOT 86080) AT 250ºC
Argentina Brazil India Korea Lithuania Pakistan Romania Russia Sweden 2.38 2.58 3.6 3.84 3.57 2.5 4.19 1.72 3.8 2.52 2.15 2.76 3.61 3.28 3.4 3.6 2.55 3.9 2.87 2.62 3.43 3.64 4.15 4.15 3.85 2.28 4.1 2.25 2.2 3.7 3.92 3.31 4.72 3.89 3.03 3.7 2.13 3.78 2.93 3.55 4.32 4.04 3.11 4 2.34 3.91 3.56 3.78 3.32 4.36 4.1 3.78 4.07 3.94 4.31 3.52 3.65 4.13 4.5 3.29 4.15 3.7 3.81 3.93 Number of specimens 6 4 8 6 8 8 13 5 6
Mean V 2.42 2.39 3.56 3.58 3.67 3.81 3.97 2.54 3.93 Stdev V 0.26 0.25 0.36 0.35 0.32 0.70 0.34 0.57 0.16 Stdev/mean 0.11 0.10 0.10 0.10 0.09 0.18 0.08 0.23 0.04
250 ºC
0.000
0.100
0.200
0.300
0.400
1.5 2 2.5 3 3.5 4 4.5V x 10-8 m/s
Fre
qu
en
cy
FIG. 3.2. Distribution of values of V in Zircaloy–4 from CWSR cladding from Lot 86080. The possible causes of the scatter are metallurgical variations and experimental differences. ⎯ The specimens and samples of fuel cladding came from the same lot and were
randomized when sent to the various laboratories. Any metallurgical difference large enough to affect DHC through a difference in microstructure would be expected to be picked up during the fabrication and inspection of the tubing. No such difference was reported so microstructural variation is not contributing to the scatter. Later results will support this conclusion.
25

⎯ Small variations in temperature history may affect the values of V. Great care was taken to avoid under-cooling when attaining the test temperature and the cooling rate in all the laboratories was similar being 1 to 3ºC/min. In some laboratories the test temperatures had a small deviation from the target temperature and this factor may have contributed a small deviation, Fig. 3.3, although other factors are clearly contributing to the scatter. The line marked ‘whole population’ represents the temperature dependence based on Equation 1.1, to be described in Section 3.3.
⎯ A small variation in the peak temperature could contribute to the scatter. The total
hydrogen concentration was 200 ppm so not all the hydrogen was taken into solution during heating to the peak temperature — the temperature would have to be taken to about 400ºC to dissolve all the hydrogen [3.xxix]. With small variations in the peak temperature, differences in the amount of hydrogen in solution at the test temperature would exist. In the small range of differences in peak temperature it is difficult to discern more than a suggestion of an effect, Fig. 3.4.
⎯ Some laboratories had difficulties with preparing the initial crack by fatigue. If the final
value of maximum KI during fatigue is smaller than the KI applied during the DHC test, the latter cracking should be well behaved. Any upper deviation from this target during fatigue would mostly affect the initiation times rather than V. A typical successful fatigue sequence is described in Chapter 2.
⎯ The wide variation in incubation time could contribute to the scatter to V if ti is in error.
The total time of a test is very accurately known because it corresponds to the time of unloading the specimen. The average cracking time was 6.87 × 10⁴ s ± 2.55 × 10⁴ s and the average incubation time and the incubation time in individual tests was about 6% of the cracking time. The contribution of the scatter in incubation time to the variation of V was therefore small.
⎯ The initial value of KI depends on the load and the crack length after fatigue. The load
is well known but the initial crack length has some variation because it is difficult to measure accurately. For these tests the target for the initial value of KI was 15 MPa√m. In practice it varied between 11 and 22.8 MPa√m, but the mean value was 15.1 MPa√m, close to the target, with a moderate dispersion of 2.0 MPa√m. Most laboratories obtained seemingly valid results with amounts of crack growth varying from 1.5 mm to 4.2 mm; the mean value for all the tests at 250ºC was 2.4 ± 0.6 mm. Consequently the final value of KI had a wide range, from 21.1 MPa√m to 38.9 MPa√m, with a mean value of 26.8 ± 3.5 MPa√m. One expects that V should be independent of either initial or final KI (so long as KIH is exceeded) and therefore crack length, and the results confirm this expectation, with some slight negative dependence with very low correlations, Fig. 3.5 and Fig. 3.6.
26

-18
-17.5
-17
-16.5
0.00188 0.0019 0.00192 0.00194 0.00196
1/T
ln V
Whole populationSwedenKoreaPakistanRussia
FIG. 3.3. Scatter in V partly as a consequence of deviation from 250ºC.
y = 5E-10x - 1E-07R2 = 0.1422
0.00E+00
1.00E-08
2.00E-08
3.00E-08
4.00E-08
5.00E-08
6.00E-08
310 315 320 325
Peak Temperature, ºC
Cra
ck V
elo
city
, m
/s
FIG. 3.4. Effect of peak temperature on V at 250ºC in CWSR Zircaloy–4 fuel cladding.
27

y = -6E-10x + 5E-08R2 = 0.0798
y = -7E-10x + 4E-08R2 = 0.0304
0.E+00
1.E-08
2.E-08
3.E-08
4.E-08
5.E-08
0 10 20 30 40 50
KI MPa√m
V m
/s Final KIInitial KI
FIG. 3.5. Independence on either initial or final KI of V at 250ºC for CWSR Zircaloy–4 fuel cladding.
y = -2E-09x + 4E-08R2 = 0.0407
0.E+00
1.E-08
2.E-08
3.E-08
4.E-08
5.E-08
0 1 2 3 4 5
Crack growth mm
V m
/s
FIG. 3.6. Lack of dependence or correlation between amount of crack growth and V at 250ºC for CWSR Zircaloy–4 fuel cladding.
Temperature control appears to be the most important factor contributing to the scatter in the data; the remaining factors were under control and the data are considered satisfactory and represent the DHC behaviour of CWSR fuel cladding at 250ºC. The same testing technique was then applied at several temperatures above and below 250ºC.
28

3.3. PHASE 1: TESTS AT TEMPERATURES OTHER THAN 250ºC ON PWR ZIRCALOY CLADDING (CWSR LOT 86080)
The details of each test are provided in the Appendix. At temperatures above about 275ºC cracking was found to be very difficult and often there was no cracking. The results will be presented with this phenomenon as background. Up to 275ºC the variation in incubation time is summarised in Table 3.3 and plotted in Fig. 3.7. The data are very scattered and, although the expected decline in ti with increase in test temperature is indicated, the correlation is very poor. Results from higher test temperatures were very variable and depended on how long the experimenter was prepared to wait without any sign of cracking; some specimens were loaded for times over 100 000 s (greater than one day) at temperatures where one would expect times to be ten times smaller. The crack velocities between 150 and 300ºC (excluding those at 250ºC) are summarised in Table 3.4. Although the number of specimens tested was small, the standard deviations of the mean values were less than 15% while the range of values at any one temperature was less than a factor of 1.5. Below 275ºC the values of crack velocity have a clear and highly correlated temperature dependence following Equation 1.1. Fig. 3.8 represents the mean values including the data from tests at 250ºC. Q has a value of 53.1 kJ/mol. Above 275ºC the cracking was very variable with a tendency to decline from the values expected by an extrapolation of Equation 1, as indicated in Fig. 3.9. TABLE 3.3. INCUBATION TIMES BEFORE DHC STARTED IN ZIRCALOY–4 CLADDING (LOT 86080) AT TEST TEMPERATURES UP TO 275ºC
Temperature,ºC. 150 185 200 227 250 275 Mean value, s 44 660 88 500 5730 11 580 4880 28 366 Standard deviation, s 39 100 69 298 10 072 6206 4630 34 622
Maximum value, s 72720 15 3180 20 820 17 388 16 200 61 680 Minimum value, s 0 15360 0 5040 0 6300
TABLE 3.4. SUMMARY OF CRACK VELOCITIES IN ZIRCALOY–4 CWSR LOT 86080
Test temperatureºC 150 185 200 227 232 275 280 283 290 300
Crack velocity 0.21 0.53 0.85 2.56 2.7 6.11 8.4 0* 0 0.55 10-8 m/s 0.20 0.63 0.79 2.3 5.75 3.65 4.66 0 0.23 0.64 0.89 1.93 4.82 0 0 0.97 6.58 6.64 6.89 Mean value 0.21 0.60 0.87 2.26 2.70 6.13 Standard deviation 0.012 0.064 0.077 0.317 … 0.762 Stdev/mean 0.058 0.106 0.088 0.140 … 0.124 Highest V/lowest V 1.12 1.22 1.23 1.33 … 1.43
* Values plotted as (0.001 mm/test time)
29

y = 2735.9x + 4.1554R2 = 0.2112
7
8
9
10
11
12
0.0018 0.002 0.0022 0.0024
1/T
ln t
i
FIG. 3.7. Temperature dependence of mean incubation time for DHC in CWSR Zircaloy–4 cladding from Lot 86080.
y = 0.0073e-6388.1x
R2 = 0.9931
1.E-09
1.E-08
1.E-07
0.0017 0.0019 0.0021 0.0023 0.0025
1/T (1/K)
V (
m/s
)
CWSRZircaloy-4Expon. (CWSRZircaloy-4)
FIG. 3.8. Temperature dependence of crack velocity between 150 and 273ºC in CWSR Zircaloy–4 cladding from Lot 86080: mean values.
30

1.E-13
1.E-12
1.E-11
1.E-10
1.E-09
1.E-08
1.E-07
1.E-06
0.0017 0.0019 0.00211/T (1/K)
V (
m/s
) 86080 CWSR
FIG. 3.9. Temperature dependence of crack velocity between 150 and 300ºC in CWSR Zircaloy–4 cladding from Lot 86080 showing sudden decline in cracking above 275ºC — all data. 3.4. PHASE 2: TESTS AT VARIOUS TEMPERATURES ON LWR ZIRCALOY
CLADDING (LOT 83786). Three sets of experiments were done on this fuel cladding: DHC was measured in the same temperature range as in Phase 2 on the material in the cold worked condition and after two heat-treatments that represented the metallurgical condition for the fuel cladding for PWR (480ºC for 3.5 h) and BWR (565ºC for 1.5 h). 3.4.1 Testing of material in the cold worked condition The details of each test are provided in the Appendix. As with the tests on Lot 86080, the incubation time was very scattered and showed very little temperature dependence, Fig. 3.10. The mean initial value of KI was 16.5±2.9 MPa√m and the average crack growth in all the tests was 1.73±0.91 mm providing a final value of KI of 25.2±6.1 MPa√m. The values of V showed strong and clear temperature dependence. As in Phase 1, the data followed Equation 1.1 up to about 275ºC then exhibited a sudden decline. The data are summarised in Table 3.5 and plotted in Fig. 3.11 up to 275ºC then up to 300ºC in Fig. 3.12. From Fig. 3.11, Q is estimated to be 54.8 kJ/mol.
31

TABLE 3.5. SUMMARY OF CRACK VELOCITIES IN ZIRCALOY–4 LOT 83786 IN THE COLD WORKED CONDITION
Test temperature 144 150 185 200 225 231 250 275 285 290 295 300 ºC Crack velocity 0.2 0.26 0.9 2 3.54 4.3 6.26 7.2 8.64 8.17 0.2 0.24 10-8 m/s 0.2 0.9 1.24 3.43 6.07 0.94 3.08
0.21 1.29 5.72 0.024 4.69 1.2 6.9 3.96 4.1 0.0058* 4.6 0.0058* 3.6 4.6
Mean value 0.203 0.26 0.89 1.43 3.49 4.3 5.23 7.2 8.64 8.17 0.39 Standard deviation 0.006 … … 0.38 … … 1.17 … … … …
* Values taken as (0.001/test time)
Incubation time Lot 83786 CW
0
2
4
6
8
10
12
14
0.0015 0.0017 0.0019 0.0021 0.0023 0.0025
1/T
ln t
i
FIG. 3.10. Effect of temperature on time to initiate cracks in Zircaloy–4 cladding from Lot 83786 in the cold worked condition.
32

y = 0.016e-6591.8x
R2 = 0.9854
1.E-09
1.E-08
1.E-07
0.0017 0.0019 0.0021 0.0023 0.0025
1/T (1/K)
V (m
/s)
83786 CW
Expon. (83786 CW)
FIG. 3.11. Temperature dependence of crack velocity between 150 and 273ºC in CW Zircaloy–4 cladding from Lot 83786: mean values.
1.E-11
1.E-10
1.E-09
1.E-08
1.E-07
0.0016 0.002 0.0024
1/T (1/K)
V (
m/s
)
83786 CWall data
FIG. 3.12. Temperature dependence of crack velocity between 150 and 300ºC in CW Zircaloy–4 cladding from Lot 83786 showing sudden decline in cracking above 275ºC – all data.
33

3.4.2. Testing of material in the cold worked and stress relieved condition (480ºC for 3.5 h) The details of each test are provided in the Appendix. As with the tests on Lot 86080 and the cold worked material, the incubation time was very scattered and showed very little temperature dependence, Fig. 3.13. The mean initial value of KI was 17.3±4.1 MPa√m and the average crack growth in all the tests was 1.42±0.94 mm providing a final value of KI of 24.8±7.3 MPa√m. Similarly the values of V showed a strong and clear temperature dependence with the data followed Equation 1.1 up to about 275ºC then exhibited a sudden decline. The data are summarised in Table 3.6 and plotted in Fig. 3.14 up to 275ºC then up to 300ºC in Fig. 3.15. From Fig. 3.14, Q is estimated to be 54.9 kJ/mol. TABLE 3.6. SUMMARY OF CRACK VELOCITIES IN ZIRCALOY–4 LOT 83786 IN THE COLD WORKED AND STRESS RELIEVED-CONDITION Temperature 144 185 200 215 225 250 275 279 282 283 290 295
C Crack velocity 0.12 1.11 0.96 1.37 2.27 4.24 5.31 2.29 12.3 0.11 6.17 0.41 10-8 m/s 0.124 1.15 1.07 2.79 3.8 3.45 8.78 0.12 0.17 0.010 0.375 0.87 3.12 4.35 0.81 0.01 0.127 0.459 1.07 2.44 0.50 0.1 Mean value 0.118* 0.77 0.99 1.37 2.53 3.4 5.31 3.36 5.6 0.12 6.17 0.198Standard deviation 0.012 0.41 0.10 … … 0.79 … 1.03 2.49 0.004 … 0.202*Lowest value excluded.
Incubation time Lot 83786 CWSR
4
6
8
10
12
14
0.0017 0.0019 0.0021 0.0023 0.0025
1/T
ln t
i
FIG. 3.13. Effect of temperature on time to initiate cracks in Zircaloy–4 cladding from Lot 83786 in the cold worked stress relieved condition. All data.
34

y = 0.011e-6601x
R2 = 0.9755
1.E-09
1.E-08
1.E-07
0.0016 0.002 0.0024
1/T (1/K)
V (
m/s
)
83786 CWSR
Expon. (83786CWSR)
FIG. 3.14. Temperature dependence of crack velocity between 150 and 273ºC in CWSR Zircaloy–4 cladding from Lot 83786 – mean or single values.
1.E-10
1.E-09
1.E-08
1.E-07
1.E-06
0.0017 0.0021 0.0025
1/T (1/K)
V (
m/s
)
83786 CWSR all data
FIG. 3.15. Temperature dependence of crack velocity between 150 and 300ºC in CWSR Zircaloy–4 cladding from Lot 83786 showing sudden decline in cracking above 275ºC – all data.
35

3.4.3. Testing of material in the recrystallized condition (565ºC for 1.5 h). The details of each test are provided in the Appendix. The DHC behaviour of this material was extremely variable. The incubation time was very scattered and showed very little temperature dependence, Fig. 3.16. The mean initial value of KI was 17.6±3.2 MPa√m. The values of V were also very variable and exhibited little temperature dependence. The data are summarised in Table 3.7 and plotted in Fig. 3.17.
TABLE 3.7. SUMMARY OF CRACK VELOCITIES IN ZIRCALOY–4 LOT 83786 IN THE RECRYSTALLISED CONDITION Test temperature 144 182 200 225 250 282 295 ºC Crack velocity 3.1E-13 2E-12 7.89E-11 2.79E-09 1.83E-12 6.8E-09 1.16E-13m/s 3.5E-11 6.97E-14 7.6E-10 3.36E-09 1.94E-12 2.87E-11
7.4E-09 7.8E-10 3.14E-14 5.2E-10 5.91E-13 8.1E-09 3.60E-08 1.50E-08 1.1E-09
0
2
4
6
8
10
12
14
16
0.0017 0.0019 0.0021 0.0023 0.0025
1/T
ln t
i
Lot 83786 RXA
FIG. 3.16. Effect of temperature on time to initiate cracks in Zircaloy–4 cladding from Lot 83786 in the recrystallized condition — all data.
36

1.E-14
1.E-12
1.E-10
1.E-08
0.0017 0.0021 0.0025
1/T (1/K)
V (
m/s
)
83786 RXA
FIG. 3.17. Temperature dependence of crack velocity in recrystallized Zircaloy–4 cladding from Lot 83786 — all data.
3.5. PHASE 3: TESTS AT VARIOUS TEMPERATURES ON ATUCHA AND CANDU
CLADDING. The details of each test are provided in the Appendix. Since only a few tests have been completed on these materials, it is difficult to make more than general observations. The velocity data are summarised in Table 3.8 for each material. TABLE 3.8. SUMMARY OF CRACK VELOCITIES IN ZIRCALOY–4 TYPICAL OF ATUCHA AND CANDU MATERIAL FROM ZIRCATEC AND SANDVIK
Atucha Test Temperature 200 225 250 295 ºC Crack velocity 1.78E-09 2.84E-09 4.76E-09 3.96E-10 m/s 2.18E-09 2.50E-09 4.28E-09 3.14E-10 5.30E-09 4.46E-09 3.10E-09 2.08E-09 mean 1.98E-09 2.67E-09 4.00E-09 3.55E-10
CANDU 2.77E-09 5.98E-09 4.32E-10 Zircatec 2.41E-09 5.82E-09 9.95E-10
mean 2.59E-09 5.90E-09 7.14E-10
CANDU 2.45E-08 Sandvik 2.67E-08
3.25E-08 3.92E-08 2.53E-08 mean 2.96E-08
37

3.5.1. Atucha
The incubation times were very scattered and showed no temperature dependence, Fig. 3.18. The mean initial value of KI was 15.5±1.5 MPa√m. Between 200 and 250ºC, V increased in the expected manner, although was somewhat scattered, but the values at 295ºC were low, in line with the earlier data. The estimate of Q is unreliable because of the paucity of data. Four methods were used: pooling the data between 200 and 250ºC, with and without the lowest value at 250ºC, and using the mean value at each temperature, again with and without the lowest value at 250ºC. The values are:
Q [kJ/mol]
All data 27.7
All data (without lowest value at 250ºC) 33.1
Mean values 28.9
Mean values (without lowest value at 250ºC) 32.5
This exercise demonstrated the sensitivity of Q to individual points when the temperature range is small.
8
9
10
11
12
0.0016 0.0018 0.002 0.0022
1/T
ln t
i
Atucha
FIG. 3.18. Effect of temperature on time to initiate cracks in Atucha Zircaloy–4 cladding.
38

1.E-10
1.E-09
1.E-08
0.0017 0.0019 0.0021
1/T (1/K)
V (
m/s
)
Atucha
FIG. 3.19. Temperature dependence of crack velocity in Atucha Zircaloy–4 cladding — all data. 3.5.2. CANDU Zircatec The incubation times were scattered and showed no temperature dependence, Fig. 3.20. The mean initial value of KI was 16.3±0.5 MPa√m. Between 225 and 250ºC, V increased in the expected manner but the values at 295ºC were low, in line with the earlier data, Fig. 3.21. Again the estimate of Q is unreliable because tests were done at only two temperatures; a value of 71.4 kJ/mol was obtained but should be used with caution.
6
7
8
9
10
11
12
0.0017 0.0018 0.0019 0.002 0.0021
1/T
ln ti
CANDU Zircatec
FIG. 3.20. Effect of temperature on time to initiate cracks in CANDU Zircaloy–4 cladding from Zircatec.
39
1.E-10
1.E-09
1.E-08
0.0017 0.0018 0.0019 0.002 0.0021
1/T (1/K)
V (
m/s
)
CANDU Zircatec
FIG. 3.21. Temperature dependence of crack velocity in CANDU Zircaloy–4 cladding from Zircatec — all data.
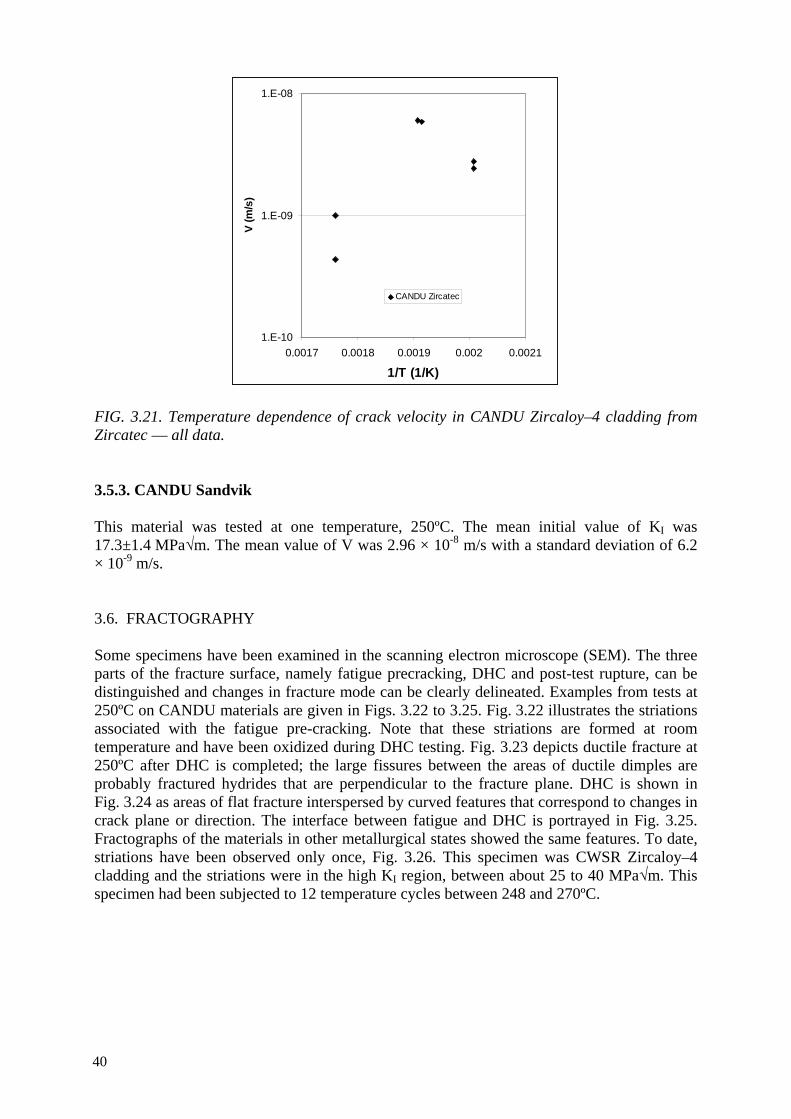
3.5.3. CANDU Sandvik This material was tested at one temperature, 250ºC. The mean initial value of KI was 17.3±1.4 MPa√m. The mean value of V was 2.96 × 10⁻⁸ m/s with a standard deviation of 6.2 × 10⁻⁹ m/s. 3.6. FRACTOGRAPHY Some specimens have been examined in the scanning electron microscope (SEM). The three parts of the fracture surface, namely fatigue precracking, DHC and post-test rupture, can be distinguished and changes in fracture mode can be clearly delineated. Examples from tests at 250ºC on CANDU materials are given in Figs. 3.22 to 3.25. Fig. 3.22 illustrates the striations associated with the fatigue pre-cracking. Note that these striations are formed at room temperature and have been oxidized during DHC testing. Fig. 3.23 depicts ductile fracture at 250ºC after DHC is completed; the large fissures between the areas of ductile dimples are probably fractured hydrides that are perpendicular to the fracture plane. DHC is shown in Fig. 3.24 as areas of flat fracture interspersed by curved features that correspond to changes in crack plane or direction. The interface between fatigue and DHC is portrayed in Fig. 3.25. Fractographs of the materials in other metallurgical states showed the same features. To date, striations have been observed only once, Fig. 3.26. This specimen was CWSR Zircaloy–4 cladding and the striations were in the high KI region, between about 25 to 40 MPa√m. This specimen had been subjected to 12 temperature cycles between 248 and 270ºC.
40

FIG. 3.22. Fatigue striations formed at room temperature on Specimen C1-1; CANDU Zircaloy tested at 250ºC.
41

FIG. 3.23. Ductile dimples on specimen C1-1 formed at 25ºC after DHC test; CANDU Zircaloy–4 tested at 250ºC. Cracking from right to left.
42

FIG. 3.24. Delayed hydride cracking on specimen A3-5; CANDU Zircaloy tested at 250ºC. Cracking from right to left.
43

FIG. 3.25. Interface between fatigue pre-crack and DHC on specimen A3-5 CANDU Zircaloy, tested at 250ºC. Cracking from right to left.
FIG. 3.26. Striations observed on one specimen of CWSR Zircaloy–4 during DHC.
REFERENCE TO CHAPTER 3
[3.1] KEARNS, J.J., Terminal solubility and partitioning of hydrogen in alpha zirconium, Zircaloy-2 and Zircaloy-4, J. Nucl. Mater., 20, (1967), 292–303.
44

CHAPTER 4
DISCUSSION
The results presented in Chapter 3 show that this coordinated research programme met its objective. A method of testing fuel cladding for the rate of crack extension, developed in Sweden, has been successfully transferred to several national laboratories. The good agreement on the values between different laboratories on the four main test materials demonstrates the success of this transfer. The observations from the tests confirmed that Zircaloy–4 fuel cladding could crack by DHC: ⎯ in many tests an incubation time was detected before indications of cracking were
observed, ⎯ the crack extended in a stable fashion in the absence of any external chemical
assistance, for example, iodine, ⎯ the fracture surface corresponding to DHC was quite distinct from both fatigue and
ductile fracture, and was not creep rupture, ⎯ the rates of cracking were in the range expected for DHC, ⎯ the temperature dependence of the crack velocity was also in the range expected, and, ⎯ the crack velocity varied with metallurgical condition. An expansion of these points follows. Two batches of cladding were heat-treated to represent PWR cladding. The values of crack velocity, its temperature dependence and the high temperature at which the velocity declined rapidly were all in very good agreement showing that the testing technique is reproducible in the various national laboratories and the materials have similar properties, Fig. 4.1. Specimens from Batch 83786 were tested in three metallurgical conditions: CW, CWSR and RXA. Compared with CWSR material the CW material had similar temperature dependence, but higher values of crack velocity (below 275ºC the average value was about a factor of 1.5 higher) and maybe a slightly higher temperature of decline, 285ºC vs. 275ºC, Fig. 4.2. The behaviour of the RXA material was quite different with a huge scatter providing little chance of discerning any temperature dependence. The values of crack velocity that could be measured were usually much lower than with the CW and CWSR treatments, Fig. 4.3. The Atucha and CANDU claddings provided similar results, Fig. 4.4, with values much lower than for CWSR material, Fig.4.5.
45

1.E-13
1.E-12
1.E-11
1.E-10
1.E-09
1.E-08
1.E-07
1.E-06
0.0017 0.0021 0.0025
1/T (1/K)
V (
m/s
)
83786 CWSR86080 CWSR
FIG. 4.1. Comparison of DHC behaviour of Zircaloy–4 fuel cladding from Batches 86080 and 83786 in the CWSR condition.
1.E-11
1.E-10
1.E-09
1.E-08
1.E-07
1.E-06
0.0016 0.002 0.0024
1/T (1/K)
V (
m/s
)
83786 CWSR
83786 CW
FIG. 4.2. Comparison of DHC behaviour of Zircaloy–4 fuel cladding from Batch 83786 in the CW and CWSR conditions.
46

1.E-14
1.E-13
1.E-12
1.E-11
1.E-10
1.E-09
1.E-08
1.E-07
1.E-06
0.0016 0.002 0.0024
1/T (1/K)
V (
m/s
)
83786 CWSR83786 CW83786 RXA
FIG. 4.3. Comparison of DHC behaviour of Zircaloy–4 fuel cladding from Batch 83786 in the CW, CWSR and RXA conditions.
1.E-10
1.E-09
1.E-08
0.0017 0.0019 0.0021
1/T (1/K)
V (
m/s
)
AtuchaCANDU (Zircatec)
FIG. 4.4. Comparison of DHC behaviour of Zircaloy–4 fuel cladding from Atucha and CANDU (Zircatec).
47

1.E-10
1.E-09
1.E-08
1.E-07
1.E-06
0.0017 0.0019 0.0021
1/T (1/K)
V (
m/s
)
AtuchaCANDU (Zircatec)83786 CWSR
FIG. 4.5. Comparison of DHC behaviour of Zircaloy–4 fuel cladding from Batch 83786 (CWSR), Atucha and CANDU (Zircatec).
The values of V from this study are in agreement with those from measurements on pressure tubes [4.1, 4.2] and on fuel cladding [4.3, 4.4], Fig. 4.6, suggesting similar temperature dependence. The deviations in values can be attributed to: ⎯ differences in the histories of temperature and loading, which can contribute large
variations in crack velocity, ⎯ the small number of samples tested; the process of DHC is highly variable and even in
well-controlled testing the crack velocity can vary by a factor of three, see Fig. 3.2. Small numbers of specimens may lead to large variations in apparent temperature dependence; for example, the values of Q for the Atucha (Section 3.5.1) and CANDU (Section 3.5.2) materials differ by over a factor of two based on very few points and a narrow temperature range.
⎯ differences in microstructure, including texture, and strength. A modest correlation is found between UTS and the mean value of V at 250ºC for the current batches of fuel cladding, Fig. 4.7. The temperature dependence of DHC is dominated by the diffusivity, D, and the solubility limit, C, of hydrogen in the zirconium alloy, and to a lesser extent by the strength. Zircaloy–4 is essentially a single-phase alloy, with a distribution of intermetallic particles, and the same values of D and C can be used for all the materials with little error. Comparison with two-phase alloys, like Zr-2.5Nb, has to take into account the distribution of the second phase. Different materials may be compared using the correlation with strength of Oh et al. [4.5] in which V is normalised by the appropriate values of D and C. Fig. 4.8 illustrates the correlation for Batch 86080 with several examples of Zircaloy, both irradiated [4.1, 4.6] and unirradiated, and the samples of Zr-2.5Nb used in the previous IAEA CRP on pressure tube materials [4.7]. UTS was used to characterise strength because that is
48

the only strength quantity measured in this study. The values of D used for Fig. 4.8 were derived from Sawatzky [4.8] for Zircaloy and [4.9] for Zr-2.5Nb and for C were from Kearns [4.10]. The results for CWSR fuel cladding fit into the broad band of data indicating that the behaviour of fuel cladding is in accord with data from other materials and confirms that material strength contributes to the crack velocity.
-8
-6
-4
-2
0
2
4
0.0015 0.002 0.0025 0.003
1/T (1/K)
ln V
(10
-8 m
/s)
EfsingHuangPulsGrigorievThis report
FIG. 4.6. Comparison of temperature dependence the mean values of DHC rate of Batch 86080 Zircaloy–4 cladding with other values on Zircaloy.
y = 3E-10e0.009x
R2 = 0.6731
1.E-09
1.E-08
1.E-07
0 100 200 300 400 500 600
UTS (MPa)
V (
m/s
)
FIG. 4.7. Dependence of V on strength of fuel cladding at 250ºC.
49

0
1
2
3
4
5
6
0 500 1000UTS MPa
ln(V
/DC)
Mills Unirradiated
Mills Irradiated
Puls
Mahmood Irradiated
Grigoriev Unirradiated
Grigoriev Irradiated
Batch 86080
Zr2.5Nb CANDU
Zr-2.5Nb RBMK
FIG. 4.8. Normalization of DHC velocity, V, with diffusivity, D, and solubility limit for dissolution, C, for zirconium alloys in several conditions. In Zr-2.5Nb the crack velocity and KIH are very sensitive to crystallographic texture [4.11]. In pressure tubes in the cold worked condition the basal plane normals are strongly oriented in the transverse direction. Cracking in the axial direction driven by a hoop stress is much faster and requires a much lower KIH than cracking in the circumferential direction driven by an axial stress. The explanation is that hydrides reorient readily from the circumferential orientation to the radial direction with a hoop stress but not with an axial stress because the normal to the basal planes of the zirconium crystals, which are close to the habit planes of hydride, are parallel with the hoop direction and not the axial direction. A radial texture has been proposed to protect Zr-2.5Nb from DHC [4.12–4.14]. In all the fuel cladding tested in this study the texture was highly radial (Section 2.2) yet DHC was observed at velocities in line with materials with transverse textures. The α-grains in Zr-2.5Nb are often surrounded by a semi-continuous β-phase and the α-grains tend to be much smaller than those of Zircaloy — 0.2 to 0.5 μm vs. 2 to 3 μm. One possible explanation for the difference in behaviour between the two materials is that the hydrides precipitate in the grain boundaries of Zircaloy and therefore are not affected by the orientation of the α-grains. Metallographic examination of hydrides at the tips of active cracks is required to examine this explanation. In the usual picture of DHC, after KIH is exceeded, the crack velocity is almost independent of KI. This conclusion was confirmed for CWSR material — see Figs. 3.5 and 3.6 — the crack velocity of CWSR material was insensitive to KI and crack length over a wide range of values and indicates that KIH for this material was lower than about 10 MPa√m. The results on RXA material at 250ºC (see the Appendix) indicate that the crack velocity may be highly KI-dependent, Fig. 4.9, suggesting that KIH is large for this material, perhaps as high as 25 MPa√m. This high sensitivity to KI may also explain the large variation in values of V obtained in this material and frequent difficulty with initiating cracking.
50

In this study, the fracture surfaces attributed to DHC were clearly distinct from those made by fatigue or ductile rupture. As previously observed with Zircaloy [4.1, 4.3, 4.4], the fractographic features called striations were absent, except for one observation. These observations are in marked contrast to the fractography of Zr-2.5Nb where striations are easily and often observed. Striations are bands across most of the width of a specimen, perpendicular to the crack growth direction, consisting of regions of ductile fracture bounding cleavage of hydride. They tend to remain a constant width and coplanar as the crack extends. In Zircaloy, the hydrides fracture on different planes along the crack front with ductile fracture between the brittle plates. The size of the brittle areas is variable so bands of consistent width are not formed. This observation supports the idea that the microstructural features contributing to the difference in behaviour of the two materials are probably the finer scale of the grains and the presence of a β-phase in Zr-2.5Nb and the large difference in crystallographic texture — large FT in pressure tubes and large FR in fuel cladding. The general lack of striations with DHC in Zircaloy suggests that they are not a fundamental characteristic of DHC. The decline of DHC at high temperatures has been observed in both Zr-2.5Nb [4.15–4.17] and Zircaloy [4.6]. This feature is apparent in each of the materials tested, except for the RXA material where the scatter obscures any temperature dependence. As an example, Fig. 4.10 is a direct comparison of the behaviour of cold worked Zr-2.5Nb pressure tube material [4.16] and Zircaloy–4 fuel cladding, Batch 83786 in the CW and CWSR conditions. In Zr-2.5Nb the crack velocity starts to deviate from the Arrhenius correlation at about 310°C with no cracking detected at 350°C while in the current Zircaloy–4 the initial deviation is at about 275°C with little or no cracking at 300°C.
The rate of DHC can be suppressed when: ⎯ the hydrogen concentration is insufficient for hydrides to form at the crack tip. The
current specimens contained 200 ppm hydrogen, which is sufficient for hydrides to be present at temperatures up to 360 °C, even on cooling to the test temperature. Thus the observed reduced rate of cracking is not caused by lack of hydride.
⎯ the temperature history prevents hydrides from forming at the crack tip. Heating to the test temperatures may cause this situation, even if hydrides are present in the metal matrix [4.18]. In the current tests the test temperature was always attained by cooling from at least 50°C above the test temperature, with no undercooling, so this effect is not the cause of the reduced velocity.
⎯ KIH is greater than the applied KI.
In Zr-2.5Nb, KIH has little temperature dependence at temperatures below 300°C but at higher temperatures it increases rapidly [4.17]. Zircaloy–4 likely behaves in a similar manner implying that KIH increases to values greater than about 15 MPa√m above 280°C. A corollary to this behaviour is that V and the crack suppression temperature will appear to depend on KI. Close to the critical temperature, a small amount of evidence supports this conclusion. In Zr-2.5Nb the range of the suppression temperature increased from 280–313°C to 328–359°C when KI was increase from 13 MPa√m to 17 MPa√m [4.15]. In the current study at 283°C in one specimen no cracking was detected after 9000s at a KI of 15 MPa√m but once KI was increased by about 7% the crack progressed, but at a much reduced rate based on expectations from an extrapolation of Equation (1.1). The maximum value of V in this study was 8.7 × 10⁻⁸ m/s at 285°C for CW material, which is four to ten times lower than the rates estimated from splits in LWR cladding [4.19]. The current results are not suitable for direct application to the behaviour of fuel cladding because
51

the material is unirradiated. The added strength generated by irradiation has two consequences: the crack velocity is increased by a factor between ten to fifty [4.1, 4.4, 4.20] easily agreeing with the rates observed in-reactor, and the high temperature decline in velocity is postponed to higher temperatures [4.17]. Other differences between cladding on an operating fuel element and these laboratory experiments include temperature gradients, which can affect crack velocity and response to temperature history [4.21]. During dry storage of spent fuel, the cladding may reach temperatures of around 400ºC. The high temperature limit suggests that failure by DHC should not be possible for several years as the fuel cools towards the temperatures at which cracking is observed.
1.E-12
1.E-11
1.E-10
1.E-09
1.E-08
1.E-07
1.E-06
0 5 10 15 20 25
KI MPa√m
V (
m/s
)
FIG. 4.9. KI dependence of crack velocity of RXA material at 250ºC.
52

1.E-11
1.E-10
1.E-09
1.E-08
1.E-07
1.E-06
0.0015 0.0017 0.0019 0.0021 0.0023 0.0025
1/T (1/K)
V (
m/s
)
CWSR CWZr-2.5Nb
FIG. 4.10. The suppression of DHC in Zr-2.5Nb pressure tube material and Zircaloy–4 fuel cladding (Batch 83786) in the CW and CWSR conditions.
REFERENCES TO CHAPTER 4
[4.1] HUANG, F.H., MILLS, W.J., Delayed hydride cracking behaviour for Zircaloy-2 tubing, Metallurgical Transactions, 22A, (1991), 2049-2060.
[4.2] PULS, M.P., SIMPSON, L.A., DUTTON, R., Hydride-induced crack growth in Zirconium alloys, AECL Report, AECL-7392, (1982).
[4.3] EFSING, P., PETTERSSON, K., The influence of temperature and yield strength on delayed hydride cracking in hydrided Zircaloy-2, Zirconium in the Nuclear Industry: Eleventh International Symposium, ASTM STP 1295, (1996), 394-404.
[4.4] GRIGORIEV, V., JAKOBSSON, R., Delayed hydrogen cracking velocity and J-Integral measurements on irradiated BWR cladding, Zirconium in the Nuclear Industry: Fourteenth International Symposium, ASTM STP 1467, (2006), 711-728.
[4.5] OH, J.Y., KIM, I.S., KIM, Y.S., A normalization method for relationship between yield stress and delayed hydride cracking velocity in Zr-2.5Nb alloy, J. Nuclear Science and Technology, 37, (2000), 595-600.
[4.6] MAHMOOD, S.T., FARKAS, D.M., ADAMSON, R.B., ETOH, Y., Post-irradiation characterization of ultra-high-fluence Zircaloy–2 plate, Zirconium in the Nuclear Industry: Twelfth International Symposium, ASTM STP 1354, (2000), 139-169.
[4.7] COLEMAN, C.E., INOZEMSTEV, V.V., Measurement of rates of delayed hydride cracking (DHC) in Zr-2.5Nb – An IAEA Coordinated Research Project, J. ASTM International, 5, Paper ID: 101091, (2008).
[4.8] SAWATZKY, A., The diffusivity and solubility of hydrogen in the alpha-phase of Zircaloy, J. Nuclear Materials, 2, (1960), 62-68.
[4.9] SAWATZKY, A., LEDOUX, G.A., TOUGH, R.L., CANN, C.D., Hydrogen diffusion in Zirconium-Niobium alloys, Proc. International Symposium on Metal-Hydrogen Systems, Pergamon Press, 109-120, (1981).
53

[4.10] KEARNS, J.J., Terminal solubility and partitioning of hydrogen in alpha zirconium, Zircaloy-2 and Zircaloy–4, J. Nuclear Materials, 20, (1967), 292-303.
[4.11] COLEMAN, C.E., Effect of texture on hydride reorientation and delayed hydrogen cracking in cold worked Zr-2.5 Nb, Zirconium in the Nuclear Industry – Fifth International Symposium, ASTM STP 754, (1982), 393-411.
[4.12] COLEMAN, C.E., CHEADLE, B.A., CANN, C.D., THEAKER, J.R., Development of pressure tubes with service life greater than 30 years, Zirconium in the Nuclear Industry – Eleventh International Symposium, ASTM STP 1295, (1996), 884-898.
[4.13] KIM, S.S., KIM, Y.S., KIH in radial textured Zr-2.5%Nb pressure tube, J. Nuclear Materials, 279, (2000), 286-292.
[4.14] KIM, Y.S., ET AL., Anisotropic threshold stress intensity factor, KIH, and crack growth rate in delayed hydride cracking of Zr-2.5Nb pressure tubes, Met. Mater. Trans., 33, (2002), 919-925.
[4.15] SMITH, R.R., EADIE, R.L., High temperature limit for delayed hydride cracking, Scripta Metallurgica, 22, (1988), 833-836.
[4.16] SAGAT, S., PULS, M.P., Temperature limit for delayed hydride cracking in Zr-2.Nb alloys, 17th Inter. Conf. Structural Mechanics in Reactor Technology, Paper G06-4, (2003).
[4.17] RESTA LEVI, M., PULS, M.P., DHC behaviour of irradiated Zr-2.5Nb pressure tubes up to 365 °C, 18th Inter. Conf. Structural Mechanics in Reactor Technology, Paper G10-3, (2005).
[4.18] AMBLER, J.F.R., Effect of direction of approach to temperature on the delayed hydride cracking behaviour of cold worked Zr-2.5Nb, Zirconium in the Nuclear Industry: Sixth International Symposium, ASTM STP 824, (1984), 653-674.
[4.19] EDSINGER, K., A review of fuel degradation in BWRs, Proc. International Topical Meeting on Light Water Reactor Fuel Performance, ANS, Park City, USA, (2000), 162-179.
[4.20] SAGAT, S., COLEMAN, C.E., GRIFFITHS, M., WILKINS, B.J.S., Effect of fluence and irradiation temperature on delayed hydride cracking in Zr-2.5Nb, Zirconium in the Nuclear Industry: Tenth International Symposium, ASTM STP 1245, (1994), 35-61.
[4.21] SAGAT, S., CHOW, C.K., M. P. PULS, M.P., COLEMAN, C.E., Delayed hydride cracking in a temperature gradient, J. Nuclear Materials, 279, (2000), 107-117.
54

CHAPTER 5
CONCLUSIONS AND RECOMMENDATIONS
5.1. CONCLUSIONS (1) The techniques for performing the pin loading tension test for delayed hydride cracking
of Zirconium alloy fuel cladding has been transferred from the host laboratory to other countries.
(2) A consistent set of values of crack velocity was obtained by both individual laboratories and between the different laboratories by following a strict testing procedure and paying special attention to test temperatures.
(3) The results fitted into the expected experimental and theoretical framework for delayed hydride cracking of Zircaloy fuel cladding, including the dependence on temperature and strength.
(4) The success of the two CRPs on delayed hydride cracking has stimulated some national programmes.
5.2. RECOMMENDATION (1) Having established good practice for measuring rates of delayed hydride cracking, the
other major parameter for this kind of cracking, the threshold stress intensity factor, KIH, should be evaluated. Both physical importance and experimental complexity of such evaluation are comparable with the work presented above. So the KIH issue might be similarly tackled by a coordinated team of interested labs.
55


APP
EN
DIX
C
RP-
II C
RA
CK
TE
STIN
G D
AT
A
L
OT
860
80
Lo
t 86
080
Spe
cim
en
ID
Hyd
roge
n P
eak
Te
st
Initi
atio
n C
rack
C
rack
ing
C
rack
In
itial
Fi
nal
CW
SR
conc
entra
tion
tem
pera
ture
tem
pera
ture
time
leng
th
time
velo
city
K
I K
I
pp
m
ºC
ºC
s m
m
s m
/s
MP
a√m
MP
a√m
Rom
ania
S
2-2
200
321
251
0 1.
717
4096
9 4.
19E
-08
14.0
1 22
.21
S
2-3
200
322
251
0 1.
952
5424
4 3.
60E
-08
15.1
0 24
.87
S
2-5
200
323
251
0 1.
589
4124
8 3.
85E
-08
16.6
7 24
.80
S
2-6
200
323
251
0 1.
386
3561
5 3.
89E
-08
15.6
5 22
.49
S
2-7
200
322
251
0 1.
767
4372
8 4.
04E
-08
17.1
1 26
.30
S
2-8
200
324
251
1800
1.
73
3967
4 4.
36E
-08
17.2
0 26
.20
S
2-9
200
322
251
0 1.
86
4315
5 4.
31E
-08
14.7
5 23
.93
S
2-10
20
0 32
4 25
1 34
20
1.63
1 36
224
4.50
E-0
8 16
.03
24.2
7
S2-
11
200
323
251
2280
1.
527
4643
4 3.
29E
-08
16.5
7 24
.35
S
2-12
20
0 32
2 25
1 37
2 1.
75
4214
7 4.
15E
-08
15.6
6 24
.46
S
2-13
20
0 32
3 25
1 30
1.
693
4571
3 3.
70E
-08
17.2
3 26
.03
S
2-14
20
0 32
0 25
1 12
00
1.95
7 51
382
3.81
E-0
8 16
.81
26.9
9
S2-
15
200
322
251
4440
1.
706
4337
4 3.
93E
-08
16.3
8 25
.09
Lith
uani
a LT
_S7-
1 20
0 31
5 25
0 53
40
2.83
79
380
3.57
E-0
8 14
.69
28.5
4
LT_S
7-2
200
315
250
1020
0 1.
71
5208
0 3.
28E
-08
13.9
1 21
.82
LT
_S7-
3 20
0 31
5 25
0 42
00
3.29
79
320
4.15
E-0
8 14
.04
30.0
5
LT_S
7-4
200
315
250
8100
2.
09
6318
0 3.
31E
-08
14.5
7 24
.52
LT
_S7-
5 20
0 31
5 25
0 25
20
2.47
69
480
3.55
E-0
8 15
.28
27.3
9
LT_S
7-6
200
315
250
4500
2.
57
6798
0 3.
78E
-08
14.5
2 26
.97
LT
_S7-
7 20
0 31
5 25
0 29
40
2.52
61
920
4.07
E-0
8 15
.28
27.6
5
LT_S
7-8
200
315
250
7320
2.
41
6600
0 3.
65E
-08
14.8
2 26
.55
LT
_S7-
9 20
0 28
5 20
0 20
820
2.12
24
9120
8.
51E
-09
14.3
2 24
.37
P
LT_S
7-3
200
285
200
0 1.
84
2345
40
7.85
E-0
9 14
.16
22.7
3
LT_S
7-10
20
0 33
3 27
5 61
680
1.59
26
040
6.11
E-0
8 15
.6
23.5
LT
_S7-
11
200
333
283
9510
0 0.
001
9510
0 no
cr
acki
ng
17.7
-
57
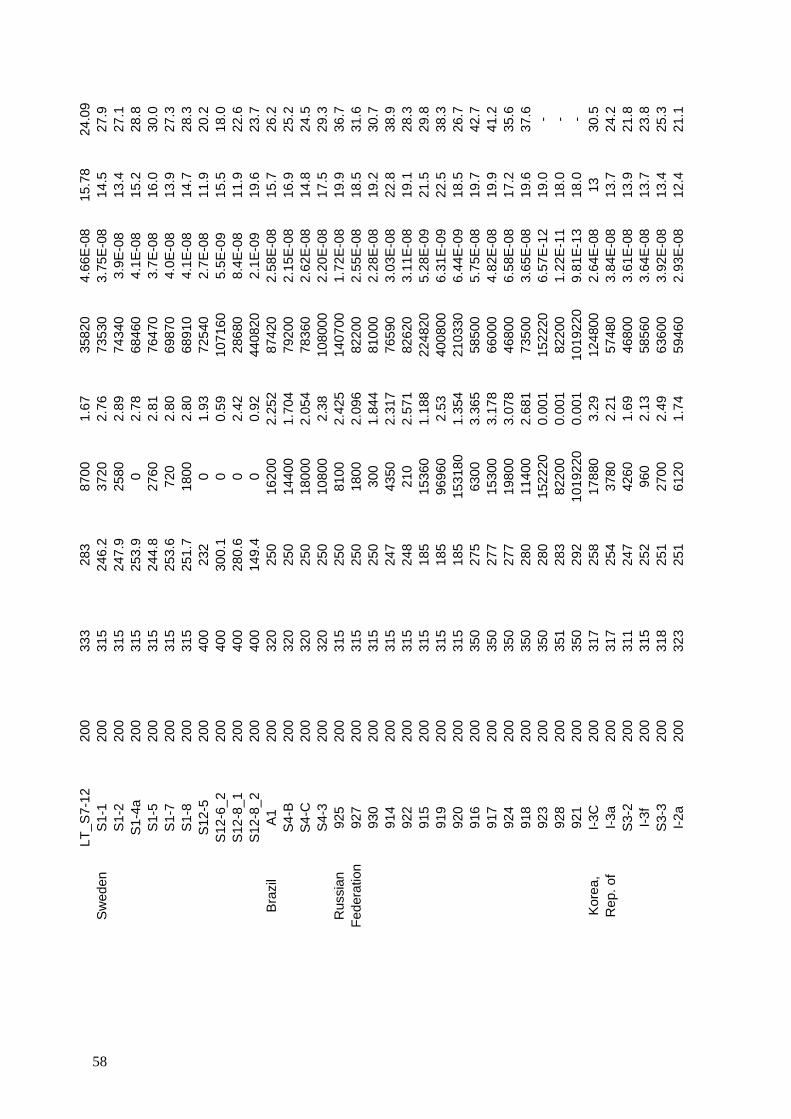
LT
_S7-
12
200
333
283
8700
1.
67
3582
0 4.
66E
-08
15.7
8 24
.09
Sw
eden
S
1-1
200
315
246.
2 37
20
2.76
73
530
3.75
E-0
8 14
.5
27.9
S1-
2 20
0 31
5 24
7.9
2580
2.
89
7434
0 3.
9E-0
8 13
.4
27.1
S1-
4a
200
315
253.
9 0
2.78
68
460
4.1E
-08
15.2
28
.8
S
1-5
200
315
244.
8 27
60
2.81
76
470
3.7E
-08
16.0
30
.0
S
1-7
200
315
253.
6 72
0 2.
80
6987
0 4.
0E-0
8 13
.9
27.3
S1-
8 20
0 31
5 25
1.7
1800
2.
80
6891
0 4.
1E-0
8 14
.7
28.3
S12
-5
200
400
232
0 1.
93
7254
0 2.
7E-0
8 11
.9
20.2
S12
-6_2
20
0 40
0 30
0.1
0 0.
59
1071
60
5.5E
-09
15.5
18
.0
S
12-8
_1
200
400
280.
6 0
2.42
28
680
8.4E
-08
11.9
22
.6
S
12-8
_2
200
400
149.
4 0
0.92
44
0820
2.
1E-0
9 19
.6
23.7
B
razi
l A
1 20
0 32
0 25
0 16
200
2.25
2 87
420
2.58
E-0
8 15
.7
26.2
S4-
B
200
320
250
1440
0 1.
704
7920
0 2.
15E
-08
16.9
25
.2
S
4-C
20
0 32
0 25
0 18
000
2.05
4 78
360
2.62
E-0
8 14
.8
24.5
S4-
3 20
0 32
0 25
0 10
800
2.38
10
8000
2.
20E
-08
17.5
29
.3
Rus
sian
92
5 20
0 31
5 25
0 81
00
2.42
5 14
0700
1.
72E
-08
19.9
36
.7
Fede
ratio
n 92
7 20
0 31
5 25
0 18
00
2.09
6 82
200
2.55
E-0
8 18
.5
31.6
930
200
315
250
300
1.84
4 81
000
2.28
E-0
8 19
.2
30.7
914
200
315
247
4350
2.
317
7659
0 3.
03E
-08
22.8
38
.9
92
2 20
0 31
5 24
8 21
0 2.
571
8262
0 3.
11E
-08
19.1
28
.3
91
5 20
0 31
5 18
5 15
360
1.18
8 22
4820
5.
28E
-09
21.5
29
.8
91
9 20
0 31
5 18
5 96
960
2.53
40
0800
6.
31E
-09
22.5
38
.3
92
0 20
0 31
5 18
5 15
3180
1.
354
2103
30
6.44
E-0
9 18
.5
26.7
916
200
350
275
6300
3.
365
5850
0 5.
75E
-08
19.7
42
.7
91
7 20
0 35
0 27
7 15
300
3.17
8 66
000
4.82
E-0
8 19
.9
41.2
924
200
350
277
1980
0 3.
078
4680
0 6.
58E
-08
17.2
35
.6
91
8 20
0 35
0 28
0 11
400
2.68
1 73
500
3.65
E-0
8 19
.6
37.6
923
200
350
280
1522
20
0.00
1 15
2220
6.
57E
-12
19.0
-
92
8 20
0 35
1 28
3 82
200
0.00
1 82
200
1.22
E-1
1 18
.0
-
921
200
350
292
1019
220
0.00
1 10
1922
0 9.
81E
-13
18.0
-
Kor
ea,
I-3C
20
0 31
7 25
8 17
880
3.29
12
4800
2.
64E
-08
13
30.5
R
ep. o
f I-3
a 20
0 31
7 25
4 37
80
2.21
57
480
3.84
E-0
8 13
.7
24.2
S3-
2 20
0 31
1 24
7 42
60
1.69
46
800
3.61
E-0
8 13
.9
21.8
I-3f
200
315
252
960
2.13
58
560
3.64
E-0
8 13
.7
23.8
S3-
3 20
0 31
8 25
1 27
00
2.49
63
600
3.92
E-0
8 13
.4
25.3
I-2a
200
323
251
6120
1.
74
5946
0 2.
93E
-08
12.4
21
.1
58
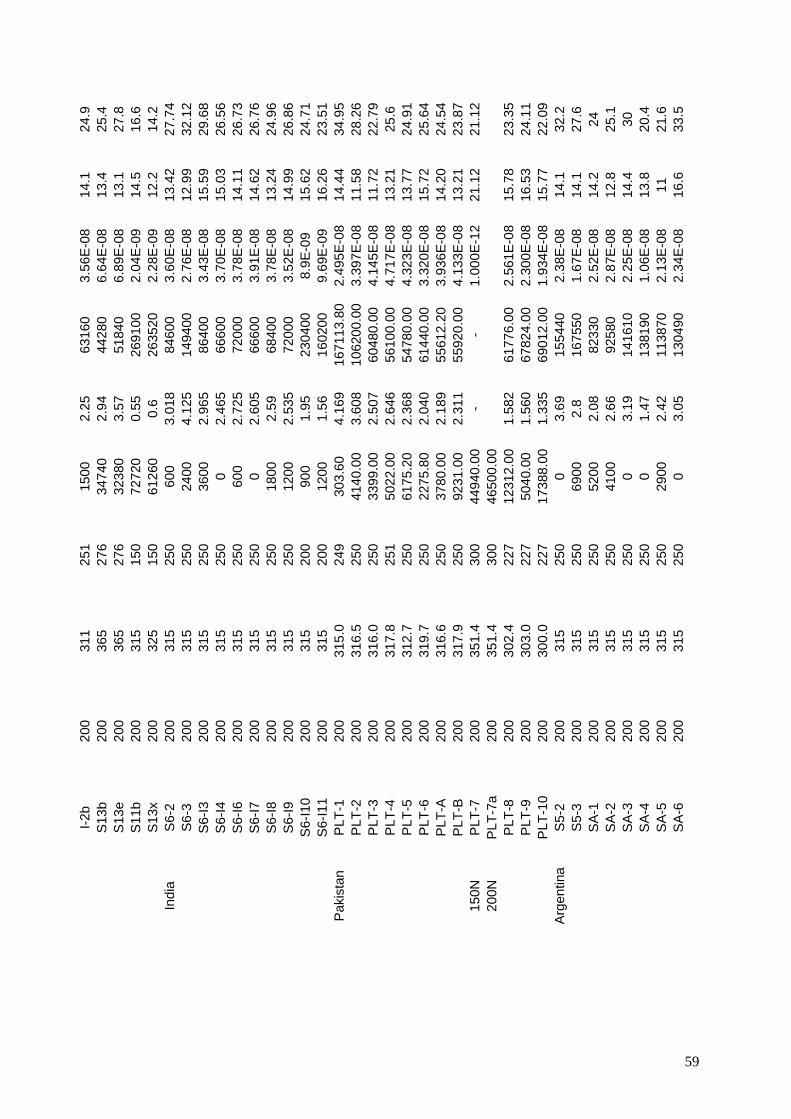
I-2
b
200
311
251
1500
2.
25
6316
0 3.
56E
-08
14.1
24
.9
S
13b
200
365
276
3474
0 2.
94
4428
0 6.
64E
-08
13.4
25
.4
S
13e
200
365
276
3238
0 3.
57
5184
0 6.
89E
-08
13.1
27
.8
S
11b
200
315
150
7272
0 0.
55
2691
00
2.04
E-0
9 14
.5
16.6
S13
x 20
0 32
5 15
0 61
260
0.6
2635
20
2.28
E-0
9 12
.2
14.2
In
dia
S6-
2 20
0 31
5 25
0 60
0 3.
018
8460
0 3.
60E
-08
13.4
2 27
.74
S
6-3
200
315
250
2400
4.
125
1494
00
2.76
E-0
8 12
.99
32.1
2
S6-
I3
200
315
250
3600
2.
965
8640
0 3.
43E
-08
15.5
9 29
.68
S
6-I4
20
0 31
5 25
0 0
2.46
5 66
600
3.70
E-0
8 15
.03
26.5
6
S6-
I6
200
315
250
600
2.72
5 72
000
3.78
E-0
8 14
.11
26.7
3
S6-
I7
200
315
250
0 2.
605
6660
0 3.
91E
-08
14.6
2 26
.76
S
6-I8
20
0 31
5 25
0 18
00
2.59
68
400
3.78
E-0
8 13
.24
24.9
6
S6-
I9
200
315
250
1200
2.
535
7200
0 3.
52E
-08
14.9
9 26
.86
S
6-I1
0 20
0 31
5 20
0 90
0 1.
95
2304
00
8.9E
-09
15.6
2 24
.71
S
6-I1
1 20
0 31
5 20
0 12
00
1.56
16
0200
9.
69E
-09
16.2
6 23
.51
Pak
ista
n P
LT-1
20
0 31
5.0
249
303.
60
4.16
9 16
7113
.80
2.49
5E-0
814
.44
34.9
5
PLT
-2
200
316.
5 25
0 41
40.0
0 3.
608
1062
00.0
0 3.
397E
-08
11.5
8 28
.26
P
LT-3
20
0 31
6.0
250
3399
.00
2.50
7 60
480.
00
4.14
5E-0
811
.72
22.7
9
PLT
-4
200
317.
8 25
1 50
22.0
0 2.
646
5610
0.00
4.
717E
-08
13.2
1 25
.6
P
LT-5
20
0 31
2.7
250
6175
.20
2.36
8 54
780.
00
4.32
3E-0
813
.77
24.9
1
PLT
-6
200
319.
7 25
0 22
75.8
0 2.
040
6144
0.00
3.
320E
-08
15.7
2 25
.64
P
LT-A
20
0 31
6.6
250
3780
.00
2.18
9 55
612.
20
3.93
6E-0
814
.20
24.5
4
PLT
-B
200
317.
9 25
0 92
31.0
0 2.
311
5592
0.00
4.
133E
-08
13.2
1 23
.87
150N
P
LT-7
20
0 35
1.4
300
4494
0.00
-
- 1.
000E
-12
21.1
2 21
.12
200N
P
LT-7
a 20
0 35
1.4
300
4650
0.00
P
LT-8
20
0 30
2.4
227
1231
2.00
1.
582
6177
6.00
2.
561E
-08
15.7
8 23
.35
P
LT-9
20
0 30
3.0
227
5040
.00
1.56
0 67
824.
00
2.30
0E-0
816
.53
24.1
1
PLT
-10
200
300.
0 22
7 17
388.
00
1.33
5 69
012.
00
1.93
4E-0
815
.77
22.0
9 A
rgen
tina
S5-
2 20
0 31
5 25
0 0
3.69
15
5440
2.
38E
-08
14.1
32
.2
S
5-3
200
315
250
6900
2.
8 16
7550
1.
67E
-08
14.1
27
.6
S
A-1
20
0 31
5 25
0 52
00
2.08
82
330
2.52
E-0
8 14
.2
24
S
A-2
20
0 31
5 25
0 41
00
2.66
92
580
2.87
E-0
8 12
.8
25.1
SA
-3
200
315
250
0 3.
19
1416
10
2.25
E-0
8 14
.4
30
S
A-4
20
0 31
5 25
0 0
1.47
13
8190
1.
06E
-08
13.8
20
.4
S
A-5
20
0 31
5 25
0 29
00
2.42
11
3870
2.
13E
-08
11
21.6
SA
-6
200
315
250
0 3.
05
1304
90
2.34
E-0
8 16
.6
33.5
59

LO
T 8
3786
Lo
t 83
786
Spe
cim
en
ID
Hyd
roge
n P
eak
Te
st
Initi
atio
n C
rack
C
rack
ing
Cra
ck
Initi
al
Fina
l C
old
w
ork
ed
co
ncen
tratio
nte
mpe
ratu
rete
mpe
ratu
re
time
leng
th
time
velo
city
K
I K
I
pp
m
ºC
ºC
s m
m
s m
/s
MP
a√m
MP
a√m
Rom
ania
S
71-1
20
6 33
4 22
5 36
00
1.2
3390
0 3.
54E
-08
14.6
2 19
.69
S
71-2
20
6 33
4 22
5 21
9000
1.
04
3034
1 3.
43E
-08
16.8
6 21
.44
S
71-3
20
6 34
4 29
5 10
260
0.17
85
383
1.99
E-0
9 12
.65
13.2
7
S71
-4
206
344
295
2958
00
2.03
21
7096
9.
35E
-09
13.1
6 21
.71
Lith
uani
a 51
_2
200
315
250
0 1.
45
2316
0 6.
26E
-08
13.9
5 20
.32
51
_3
200
315
250
0 1.
5 24
720
6.07
E-0
8 13
.76
20.3
7
51_4
20
0 31
5 25
0 0
1.69
29
520
5.72
E-0
8 14
.28
22.1
2 S
wed
en
CW
2 20
0 40
0 25
1.8
0 4.
13
5964
0 6.
9E-0
8 17
.1
36.6
CW
3 20
0 40
0 23
1.1
0 2.
28
5310
0 4.
3E-0
8 13
.8
24.1
CW
4 20
0 40
0 30
0.7
0 0.
6 25
4520
2.
4E-0
9 12
.4
14.7
CW
4a (1
) 20
0 40
0 19
9.8
0 1.
5 76
680
2.0E
-08
15.7
21
.9
C
W4a
(2)
200
400
150.
4 0
0.63
23
9760
2.
6E-0
9 21
.9
24.6
R
ussi
an
814
200
315
250
300
2.47
4 60
300
4.10
E-0
8 22
.6
36.7
Fe
dera
tion
8110
20
0 31
5 25
0 69
00
2.55
2 55
500
4.60
E-0
8 16
.4
30.9
816
200
315
185
2790
0 1.
443
1614
00
8.94
E-0
9 16
.4
23.6
817
200
315
185
1200
1.
696
1908
00
8.89
E-0
9 17
.6
27.1
812
200
350
275
2100
2.
656
3690
0 7.
20E
-08
16.5
31
.1
81
9 20
0 35
0 28
5 30
0 1.
686
1950
0 8.
65E
-08
18.5
27
.6
81
1 20
0 35
0 29
0 30
0 1.
619
1980
0 8.
18E
-08
16.5
25
.4
81
12
200
350
295
4147
20
0.1
4147
20
2.41
E-1
0 18
.0
…
Kor
ea,
#41-
1 20
0 37
7 30
2 24
420
2.12
45
180
4.69
E-0
8 13
.2
21.6
R
ep. o
f #4
1-2
200
365
300
2376
0 2.
26
3582
0 3.
96E
-08
14.2
23
.4
#4
1-3
200
362
299
2256
0 1.
76
1652
40
3.08
E-0
8 14
.7
26.2
#41-
4 20
0 36
5 30
0 17
2800
0.
01
1728
00
5.79
E-1
1 14
.7
…
#4
1-5
200
400
300
1728
00
0.01
17
2800
5.
79E
-11
14.7
…
In
dia
31A
2 19
0 31
5 25
0 42
00
2.16
1 60
480
3.60
E-0
8 14
.88
25.6
8
31B
2 24
0 31
5 14
4 81
00
0.86
8 42
4800
2.
00E
-09
18.9
1 22
.76
60

31
B4
240
315
200
4200
2.
046
1656
00
1.24
E-0
8 21
.83
33
31
B5
240
315
200
3300
2.
184
1692
00
1.29
E-0
8 21
.39
33.3
1
31C
1 18
8 31
5 25
0 16
20
4.02
3 87
300
4.60
E-0
8 15
.59
36.7
5
31C
2 18
8 31
5 20
0 37
80
1.68
4 14
0400
1.
20E
-08
20.3
29
.39
31
C3
188
315
144
8400
1.
225
6048
00
2.00
E-0
9 20
.15
20.8
8
31C
4 18
8 31
5 14
4 72
00
0.72
5 34
5600
2.
1E-0
9 18
19
.94
Lo
t 83
786
Spe
cim
en
ID
Hyd
roge
n P
eak
Te
st
Initi
atio
n C
rack
C
rack
ing
Cra
ck
Initi
al
Fina
l
CW
SR
conc
entra
tion
tem
pera
ture
tem
pera
ture
tim
e le
ngth
tim
e ve
loci
ty
KI
KI
ppm
ºC
ºC
s
mm
s
m/s
M
Pa√
mM
Pa√
m
R
oman
ia
S72
-1
219
334
225
0 1.
3 57
314
2.27
E-0
8 14
.11
19.5
5
S72
-2
219
335
225
0 1.
36
4873
1 2.
79E
-08
13.6
5 19
.29
S
72-3
21
9 33
6 29
5 0
0.34
82
673
4.11
E-0
9 13
.20
14.5
0
S72
-4
219
336
295
0 0.
16
9177
9 1.
74E
-09
12.4
7 13
.05
Lith
uani
a 52
_1
200
285
200
5880
1.
58
1652
40
9.56
E-0
9 13
.52
20.4
7
52_2
20
0 28
5 20
0 90
0 1.
67
1564
80
1.07
E-0
8 13
.76
21.1
9
52_3
20
0 33
3 28
3 11
760
0.42
37
1280
1.
13E
-09
14.4
4 16
.3
52
_4
200
333
275
0 1.
6 30
120
5.31
E-0
8 13
.29
20.2
3
52_5
20
0 33
3 27
9 0
1.34
58
440
2.29
E-0
8 13
.72
19.5
6
52_6
20
0 33
3 27
9 0
1.56
45
240
3.45
E-0
8 13
.8
20.7
1
52_7
20
0 33
3 27
9 90
0 1.
67
3840
0 4.
35E
-08
14.4
3 22
.02
52
_8
200
285
200
0 1.
6 18
3900
8.
70E
-09
13.7
2 20
.8
52
_9
200
275
144
1044
0 1.
52
1268
040
1.20
E-0
9 13
.41
20.0
4
52_1
0 20
0 27
5 14
4 11
400
1.79
14
4366
0 1.
24E
-09
13.7
2 21
.72
52
_11
200
333
283
0 0.
4 33
8400
1.
18E
-09
15.3
7 17
.16
Indi
a 32
A4
245
315
144
7200
0.
231
2340
00
9.87
E-1
0 20
.9
22.1
32B
4 20
9 31
5 14
4 75
00
0.63
49
6800
1.
27E
-09
24.1
4 27
.6
32
B5
209
315
144
7800
0.
54
5400
00
1.00
E-0
9 24
.39
27.3
3
32C
1 21
2 31
5 28
2 16
680
0.36
44
700
8.05
E-0
9 19
.67
21.5
2
32C
2 21
2 31
5 25
0 27
00
2.98
70
320
4.24
E-0
8 15
.9
31.5
32C
3 21
2 31
5 28
2 78
00
0.66
13
3200
4.
95E
-09
15.1
9 18
.2
32
C4
212
315
250
2400
2.
86
7536
0 3.
80E
-08
17.1
4 32
.3
32
C5
212
315
200
2400
1.
81
1692
00
1.07
E-0
8 19
.5
29.1
61

Paki
stan
25
0N
PW
R-1
B
215
370.
4 29
5 29
040
0.01
0 -
3.44
E-1
0 22
.88
22.8
8 30
0N
PW
R-1
Ba
215
370.
4 29
5 28
800
3.47
E-1
0
35
0N
PW
R-1
Bb
215
370.
4 29
5 62
100
1.61
E-1
0
PW
R-2
B
220
259.
7 18
6 20
376
2.11
8 19
0512
1.
11E
-08
22.4
0 40
.93
P
WR
-3B
21
0 25
9.0
186
360
2.10
5 18
3600
1.
15E
-08
22.4
8 40
.95
Rus
sian
Fe
dera
tion
82-0
3/S
RA
20
0 35
0.0
282
300
1.14
4 93
00
1.23
E-0
7 25
.00
32
82
-06/
SR
A
200
315.
0 25
0 72
00
1.72
3 55
200
3.12
E-0
8 16
.00
25.4
82-1
1/S
RA
20
0 31
5.0
250
4800
4.
725
1935
00
2.44
E-0
8 16
.50
44.6
82-0
7/S
RA
20
0 31
5.0
182
4800
0 1.
997
5328
00
3.75
E-0
9 17
.50
29.1
82-1
0/S
RA
20
0 31
5.0
182
1326
00
1.27
6 27
7800
4.
59E
-09
15.0
0 22
.8
82
-10
_2/S
RA
20
0 35
0.0
282
300
0.60
5 69
00
8.77
E-0
8 24
.70
28.5
82-2
/SR
A
200
300.
0 14
4 19
6500
1.
310
1337
700
9.79
E-1
0 17
.90
25.4
82-2
_2/S
RA
20
0 35
0.0
290
300
1.01
8 16
500
6.17
E-0
8 24
.00
30
82
-4/S
RA
20
0 35
0.0
215
2784
0 1.
929
1404
00
1.37
E-0
8 17
.80
29.1
Lo
t 83
786
Spe
cim
en
ID
Hyd
roge
n P
eak
Te
st
Initi
atio
n C
rack
C
rack
ing
Cra
ck
Initi
al
Fina
l
RX
A
co
ncen
tratio
nte
mpe
ratu
rete
mpe
ratu
re
time
leng
th
time
velo
city
K
I K
I
pp
m
ºC
ºC
s m
m
s m
/s
MP
a√m
MP
a√m
Rom
ania
S
73-1
19
3 33
3 22
5 0
0.66
23
6342
2.
79E
-09
14.4
2 17
.12
S
73-2
19
3 33
3 22
5 41
73
1.15
34
1770
3.
36E
-09
14.0
3 18
.80
Lith
uani
a 53
_1
200
315
250
5466
00
0.00
1 54
6600
1.
83E
-12
14.7
-
53
_2
200
315
250
5142
60
0.00
1 51
4260
1.
94E
-12
15.4
-
53
_3
200
285
200
0 0.
28
3546
720
7.89
E-1
1 14
.19
21.1
5 S
wed
en
53-1
s 20
0 32
0 25
2.3
0 0.
15
1912
80
7.84
E-1
0 14
.4
15.1
R
ussi
an
Fede
ratio
n 83
1 20
0 31
5 18
2 49
9440
0.
001
4994
40
2.00
E-1
2 16
83
2 20
0 31
5 18
2 14
3454
00.
0001
14
3454
0 6.
97E
-14
18
8322
20
0 35
0 29
5 85
8480
0.
0001
85
8480
1.
16E
-13
18
833
200
350
295
300
0.06
7 23
3292
0 2.
87E
-11
18.4
83
8 20
0 35
0 29
5 31
8570
00.
0001
31
8570
0 3.
14E
-14
14
In
dia
33A
3 20
6 31
5 14
4 32
4000
0.
001
3240
00
3.09
E-1
3 16
.1
62

33
A4
206
315
250
1692
00
0.00
1 16
9200
5.
91E
-13
16.7
33
A5
206
315
200
1800
0.
075
9774
0 7.
6E-1
0 16
.95
17.3
33B
1 28
0 31
5 28
2 69
00
0.58
5 86
400
6.8E
-09
23.5
6 26
.75
33
B2
280
315
200
1980
1.
34
1872
00
7.4E
-09
20.2
27
.6
33
B3
280
315
250
2400
2.
314
6480
0 3.
60E
-08
23.6
8 36
.33
33
B4
280
315
250
3000
1.
543
1044
00
1.50
E-0
8 23
.8
32.3
33B
5 28
0 31
5 20
0 24
00
0.07
5 14
4000
5.
2E-1
0 18
.15
19.4
1
33B
5r
280
315
200
1800
2.
046
2520
00
8.1E
-09
20.1
2 31
.2
33
C3
238
315
250
3000
0.
143
1260
00
1.1E
-09
20.1
5 20
.88
33
C4
238
315
144
1800
0.
018
5076
00
3.5E
-11
16.6
19
.69
AT
UC
HA
Lot
MA
-61
A
TU
CH
A
Spe
cim
en ID
H
ydro
gen
Pea
k
Test
In
itiat
ion
Cra
ck
Cra
ckin
g C
rack
In
itial
Fi
nal
Lo
t M
A-
61
co
ncen
tratio
nte
mpe
ratu
re
tem
pera
ture
time
leng
th
time
velo
city
K
I K
I
pp
m
ºC
ºC
s m
m
s m
/s
MP
a√m
M
Pa√
m
R
oman
ia
A1-
3 21
2 32
1 22
5 70
32
0.85
29
9215
2.
84E
-09
13.8
0 17
.40
A
1-4
212
318
225
3285
6 0.
94
3765
00
2.50
E-0
9 13
.68
17.6
8
A1-
1 21
2 32
1 25
0 63
802
1.09
22
8842
4.
76E
-09
13.4
5 18
.09
A
1-2
212
320
250
8703
1.
08
2522
25
4.28
E-0
9 14
.81
19.6
3
A2-
1 21
2 35
2 29
5 52
53
0.1
2522
67
3.96
E-1
0 15
.69
16.1
2
A2-
2 21
2 35
5 29
5 10
776
0.1
3180
87
3.14
E-1
0 16
.60
17.0
5 In
dia
Arg
B1
210
315
250
9780
0.
415
7836
0 5.
3E-0
9 18
.3
20.4
Arg
B2
210
315
250
1800
0 0.
583
1308
00
4.46
E-0
9 15
.53
18.2
3
Arg
C1
258
315
250
9300
0.
501
1620
00
3.1E
-09
15.9
18
.2
A
rgC
2 25
8 31
5 20
0 99
60
0.22
5 12
6000
1.
78E
-09
15.5
4 16
.56
A
rgC
3 25
8 31
5 20
0 10
200
0.44
19
0800
2.
18E
-09
15.2
5 17
.24
A
rgC
4 25
8 31
5 25
0 72
00
0.46
9 22
5600
2.
08E
-09
17.8
20
.16
63

CA
ND
U L
ot 2
2628
9
CA
ND
U
Spe
cim
en ID
H
ydro
gen
Pea
k
Test
In
itiat
ion
Cra
ck
Cra
ckin
g C
rack
In
itial
Fi
nal
Zir
cate
c
conc
entra
tion
tem
pera
ture
te
mpe
ratu
retim
e le
ngth
tim
e ve
loci
ty
KI
KI
Lo
t 22
6289
ppm
ºC
ºC
s
mm
s
m/s
M
Pa√
m
MP
a√m
Rom
ania
C
1-3
208
321
225
7742
0.
94
3390
61
2.77
E-0
9 15
.84
20.5
7
C1-
4 20
8 31
8 22
5 23
391
0.78
32
3303
2.
41E
-09
16.1
6 20
.09
C
1-1
208
320
250
1549
3 0.
69
1154
63
5.98
E-0
9 15
.79
19.1
9
C1-
2 20
8 32
1 25
0 13
581
0.78
13
3988
5.
82E
-09
16.9
2 20
.96
C
1-5
208
362
295
5122
4 0.
15
3472
46
4.32
E-1
0 16
.83
17.5
6
C1-
6 20
8 36
1 29
5 14
70
0.32
32
1453
9.
95E
-10
16.1
6 17
.71
CA
ND
U L
ot 8
0642
CA
ND
U
Spe
cim
en ID
H
ydro
gen
Pea
k
Test
In
itiat
ion
Cra
ck
Cra
ckin
g C
rack
In
itial
Fi
nal
San
dvi
k
conc
entra
tion
tem
pera
ture
te
mpe
ratu
retim
e le
ngth
tim
e ve
loci
ty
KI
KI
Lo
t 80
642
pp
m
ºC
ºC
s m
m
s m
/s
MP
a√m
M
Pa√
m
R
oman
ia
A3-
1 20
2 31
5 24
9 0
3.97
16
2036
2.
45E
-08
15.4
4 38
.15
A
3-2
202
318
249
0 3.
56
1333
87
2.67
E-0
8 16
.63
37.2
3
A3-
3 20
2 32
1 24
9 0
2.52
77
569
3.25
E-0
8 18
.36
33.0
1
A3-
4 20
2 31
5 24
9 66
266
2.15
54
794
3.92
E-0
8 17
.24
29.3
6
A3-
5 20
2 31
8 24
9 0
2.48
98
187
2.53
E-0
8 18
.84
33.3
5
64

CONTRIBUTORS TO DRAFTING AND REVIEW
Adelfang, P. International Atomic Energy Agency
Ali, L. Pakistan Institute of Nuclear Science and Technology, Pakistan
Azhar, T. Pakistan Institute of Nuclear Science and Technology, Pakistan
Baltusnikas, A. Lithuanian Energy Institute, Lithuania
Batista de Lima, N. Instituto de Pesquisas Energéticas e Nucleares, Brazil
Bipeta, C. Bhabha Atomic Research Centre, India
Buyers, A. Atomic Energy of Canada Limited, Canada
Chakravartty, J. Bhabha Atomic Research Centre, India
Cheong, Y.M. Korea Atomic Energy Research Institute, Republic of Korea
Coleman, C.E. Atomic Energy of Canada Limited, Canada
Correa, O. Instituto de Pesquisas Energéticas e Nucleares, Brazil
Dubey, J. Bhabha Atomic Research Centre, India
Fernàndez, S. Comisión Nacional de Energía Atómica, Argentina
Grigoriev, V. Studsvik Nuclear, Sweden
Grybenas, A. Lithuanian Energy Institute, Lithuania
Haddad, R. Comisión Nacional de Energía Atómica, Argentina
He, Z. Atomic Energy of Canada Limited, Canada
Homobono Paes de Andrade, A.
Instituto de Pesquisas Energéticas e Nucleares, Brazil
Kim, K.S. Korea Atomic Energy Research Institute, Republic of Korea
Inozemtsev, V. International Atomic Energy Agency
Ionescu, V. Institute for Nuclear Research, Romania
Jakobsson, R. Studsvik Nuclear, Sweden
Khan, A. Pakistan Institute of Nuclear Science and Technology, Pakistan
Kim, Y.S. Korea Atomic Energy Research Institute, Republic of Korea
Kotov, P. A.A. Bachavar, All-Russian Scientific Research Institute of Inorganic Materials, Russian Federation
Kriukiene, R. Lithuanian Energy Institute, Lithuania
Kulavil, M. Bhabha Atomic Research Centre, India
Lafont, C. Comisión Nacional de Energía Atómica, Argentina
65

Lidström, O. Studsvik Nuclear, Sweden
Lockley, A. Atomic Energy of Canada Limited, Canada
Makarevicius, V. Lithuanian Energy Institute, Lithuania
Manzoor, T. Pakistan Institute of Nuclear Science and Technology, Pakistan
Markelov, V. A.A. Bachavar, All-Russian Scientific Research Institute of Inorganic Materials, Russian Federation
Mihalache, M. Institute for Nuclear Research, Romania
Mizrahi, R. Comisión Nacional de Energía Atómica, Argentina
Pitigoi, V. Institute for Nuclear Research, Romania
Pizarro, L.M. Comisión Nacional de Energía Atómica, Argentina
Ramanathan, L. Instituto de Pesquisas Energéticas e Nucleares, Brazil
Roth, M. Institute for Nuclear Research, Romania
Tsvelev, V. A.A. Bachavar, All-Russian Scientific Research Institute of Inorganic Materials, Russian Federation
Zheltkovskaya, T. A.A. Bachavar, All-Russian Scientific Research Institute of Inorganic Materials, Russian Federation
66

In the following countries IAEA publications may be purchased from the sources listed below, or frommajor local booksellers. Payment may be made in local currency or with UNESCO coupons.
AustraliaDA Information Services, 648 Whitehorse Road, Mitcham Victoria 3132Telephone: +61 3 9210 7777 • Fax: +61 3 9210 7788Email: [email protected] • Web site: http://www.dadirect.com.au
BelgiumJean de Lannoy, avenue du Roi 202, B-1190 BrusselsTelephone: +32 2 538 43 08 • Fax: +32 2 538 08 41Email: [email protected] • Web site: http://www.jean-de-lannoy.be
CanadaBernan Associates, 4611-F Assembly Drive, Lanham, MD 20706-4391, USATelephone: 1-800-865-3457 • Fax: 1-800-865-3450Email: [email protected] • Web site: http://www.bernan.com
Renouf Publishing Company Ltd., 1-5369 Canotek Rd., Ottawa, Ontario, K1J 9J3Telephone: +613 745 2665 • Fax: +613 745 7660Email: [email protected] • Web site: http://www.renoufbooks.com
ChinaIAEA Publications in Chinese: China Nuclear Energy Industry Corporation, Translation Section, P.O. Box 2103, Beijing
Czech RepublicSuweco CZ, S.R.O. Klecakova 347, 180 21 Praha 9Telephone: +420 26603 5364 • Fax: +420 28482 1646Email: [email protected] • Web site: http://www.suweco.cz
FinlandAkateeminen Kirjakauppa, PL 128 (Keskuskatu 1), FIN-00101 HelsinkiTelephone: +358 9 121 41 • Fax: +358 9 121 4450Email: [email protected] • Web site: http://www.akateeminen.com
FranceForm-Edit, 5, rue Janssen, P.O. Box 25, F-75921 Paris Cedex 19Telephone: +33 1 42 01 49 49 • Fax: +33 1 42 01 90 90 • Email: [email protected]
Lavoisier SAS, 14 rue de Provigny, 94236 Cachan Cedex Telephone: + 33 1 47 40 67 00 • Fax +33 1 47 40 67 02 Email: [email protected] • Web site: http://www.lavoisier.fr
GermanyUNO-Verlag, Vertriebs- und Verlags GmbH, August-Bebel-Allee 6, D-53175 BonnTelephone: +49 02 28 949 02-0 • Fax: +49 02 28 949 02-22Email: [email protected] • Web site: http://www.uno-verlag.de
HungaryLibrotrade Ltd., Book Import, P.O. Box 126, H-1656 BudapestTelephone: +36 1 257 7777 • Fax: +36 1 257 7472 • Email: [email protected]
IndiaAllied Publishers Group, 1st Floor, Dubash House, 15, J. N. Heredia Marg, Ballard Estate, Mumbai 400 001,Telephone: +91 22 22617926/27 • Fax: +91 22 22617928Email: [email protected] • Web site: http://www.alliedpublishers.com
Bookwell, 24/4800, Ansari Road, Darya Ganj, New Delhi 110002Telephone: +91 11 23268786, +91 11 23257264 • Fax: +91 11 23281315Email: [email protected] • Web site: http://www.bookwellindia.com
ItalyLibreria Scientifica Dott. Lucio di Biasio “AEIOU”, Via Coronelli 6, I-20146 MilanTelephone: +39 02 48 95 45 52 or 48 95 45 62 • Fax: +39 02 48 95 45 48
JapanMaruzen Company, Ltd., 13-6 Nihonbashi, 3 chome, Chuo-ku, Tokyo 103-0027Telephone: +81 3 3275 8582 • Fax: +81 3 3275 9072Email: [email protected] • Web site: http://www.maruzen.co.jp
Where to order IAEA publications
No. 21, July 2006

Korea, Republic ofKINS Inc., Information Business Dept. Samho Bldg. 2nd Floor, 275-1 Yang Jae-dong SeoCho-G, Seoul 137-130Telephone: +02 589 1740 • Fax: +02 589 1746Email: [email protected] • Web site: http://www.kins.co.kr
NetherlandsMartinus Nijhoff International, Koraalrood 50, P.O. Box 1853, 2700 CZ ZoetermeerTelephone: +31 793 684 400 • Fax: +31 793 615 698 • Email: [email protected] • Web site: http://www.nijhoff.nl
Swets and Zeitlinger b.v., P.O. Box 830, 2160 SZ LisseTelephone: +31 252 435 111 • Fax: +31 252 415 888 • Email: [email protected] • Web site: http://www.swets.nl
New ZealandDA Information Services, 648 Whitehorse Road, MITCHAM 3132, AustraliaTelephone: +61 3 9210 7777 • Fax: +61 3 9210 7788Email: [email protected] • Web site: http://www.dadirect.com.au
SloveniaCankarjeva Zalozba d.d., Kopitarjeva 2, SI-1512 LjubljanaTelephone: +386 1 432 31 44 • Fax: +386 1 230 14 35Email: [email protected] • Web site: http://www.cankarjeva-z.si/uvoz
SpainDíaz de Santos, S.A., c/ Juan Bravo, 3A, E-28006 MadridTelephone: +34 91 781 94 80 • Fax: +34 91 575 55 63 • Email: [email protected]@diazdesantos.es • [email protected] • [email protected] Web site: http://www.diazdesantos.es
United KingdomThe Stationery Office Ltd, International Sales Agency, PO Box 29, Norwich, NR3 1 GNTelephone (orders): +44 870 600 5552 • (enquiries): +44 207 873 8372 • Fax: +44 207 873 8203Email (orders): [email protected] • (enquiries): [email protected] • Web site: http://www.tso.co.uk
On-line orders:DELTA Int. Book Wholesalers Ltd., 39 Alexandra Road, Addlestone, Surrey, KT15 2PQEmail: [email protected] • Web site: http://www.profbooks.com
Books on the Environment:Earthprint Ltd., P.O. Box 119, Stevenage SG1 4TPTelephone: +44 1438748111 • Fax: +44 1438748844Email: [email protected] • Web site: http://www.earthprint.com
United Nations (UN)Dept. I004, Room DC2-0853, First Avenue at 46th Street, New York, N.Y. 10017, USATelephone: +800 253-9646 or +212 963-8302 • Fax: +212 963-3489Email: [email protected] • Web site: http://www.un.org
United States of AmericaBernan Associates, 4611-F Assembly Drive, Lanham, MD 20706-4391Telephone: 1-800-865-3457 • Fax: 1-800-865-3450Email: [email protected] • Web site: http://www.bernan.com
Renouf Publishing Company Ltd., 812 Proctor Ave., Ogdensburg, NY, 13669Telephone: +888 551 7470 (toll-free) • Fax: +888 568 8546 (toll-free)Email: [email protected] • Web site: http://www.renoufbooks.com
Orders and requests for information may also be addressed directly to:
Sales and Promotion Unit, International Atomic Energy AgencyVienna International Centre, PO Box 100, 1400 Vienna, AustriaTelephone: +43 1 2600 22529 (or 22530) • Fax: +43 1 2600 29302Email: [email protected] • Web site: http://www.iaea.org/books


10-3
6761


![MULTISCALE MODELLING OF DELAYED HYDRIDE … · [V] RESULTS • Both expressions for the elastic interaction energy, (i) and (ii) are shown and compared. The defect forces used are](https://img.pdfslide.us/doc/110x75/5b35291c7f8b9a8b4b8cc231/multiscale-modelling-of-delayed-hydride-v-results-both-expressions-for.jpg)