Embed Size (px)
Citation preview
08/02/2013
1
Dean P. Jones, Ph.D.Department of Medicine/Division of Pulmonary,
Allergy and Critical Care MedicineEmory University, Atlanta
EMORYSCHOOL OF
MEDICINE
Metabolomics Pathway Analysis
Funding Acknowledgements: NIEHS, NIA, NCI, NHLBI, NIDDK, NIAAA, NIAID, Woodruff Foundation, Emory Dept of Medicine,
Georgia Research Alliance
No financial COI to disclose
July 25, 2013
Clinical Biomarkers Laboratory
EMORY UNIVERSITY DEPARTMENT OF MEDICINE
UAB Metabolomics Workshop
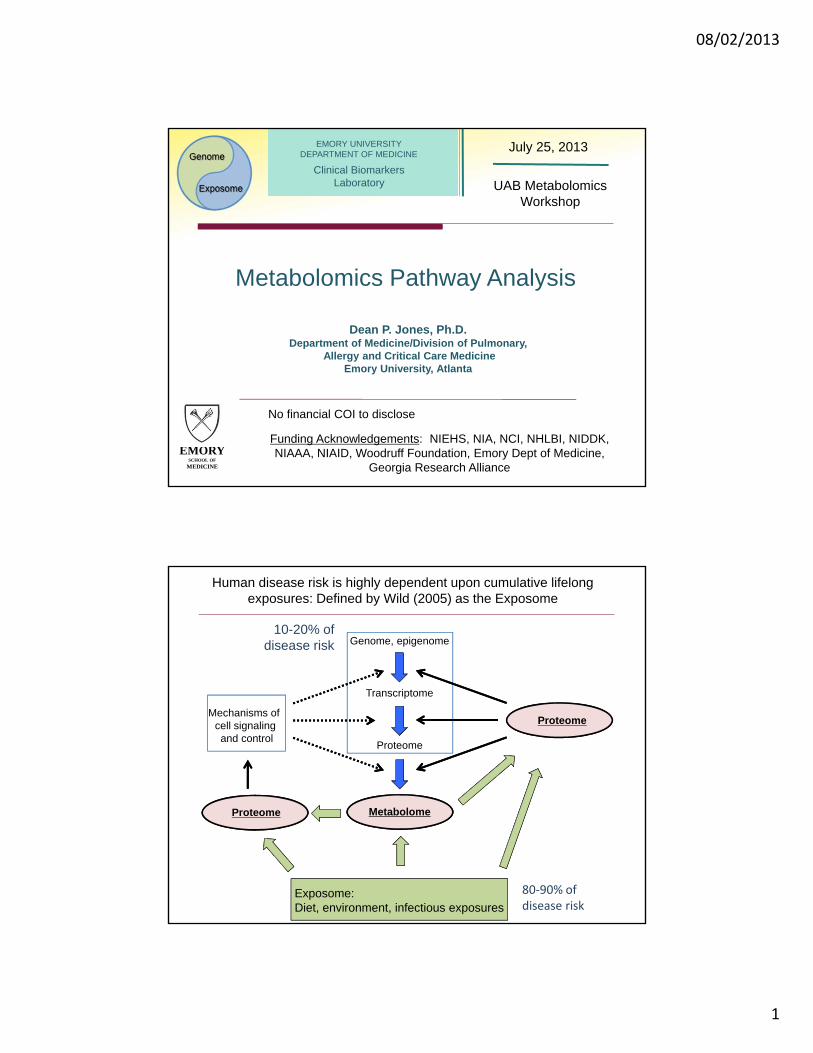
Genome, epigenome
Mechanisms of cell signalingand control
Transcriptome
Proteome
MetabolomeProteome
Exposome:Diet, environment, infectious exposures
Proteome
10-20% of disease risk
80‐90% of disease risk
Human disease risk is highly dependent upon cumulative lifelong exposures: Defined by Wild (2005) as the Exposome
08/02/2013
2
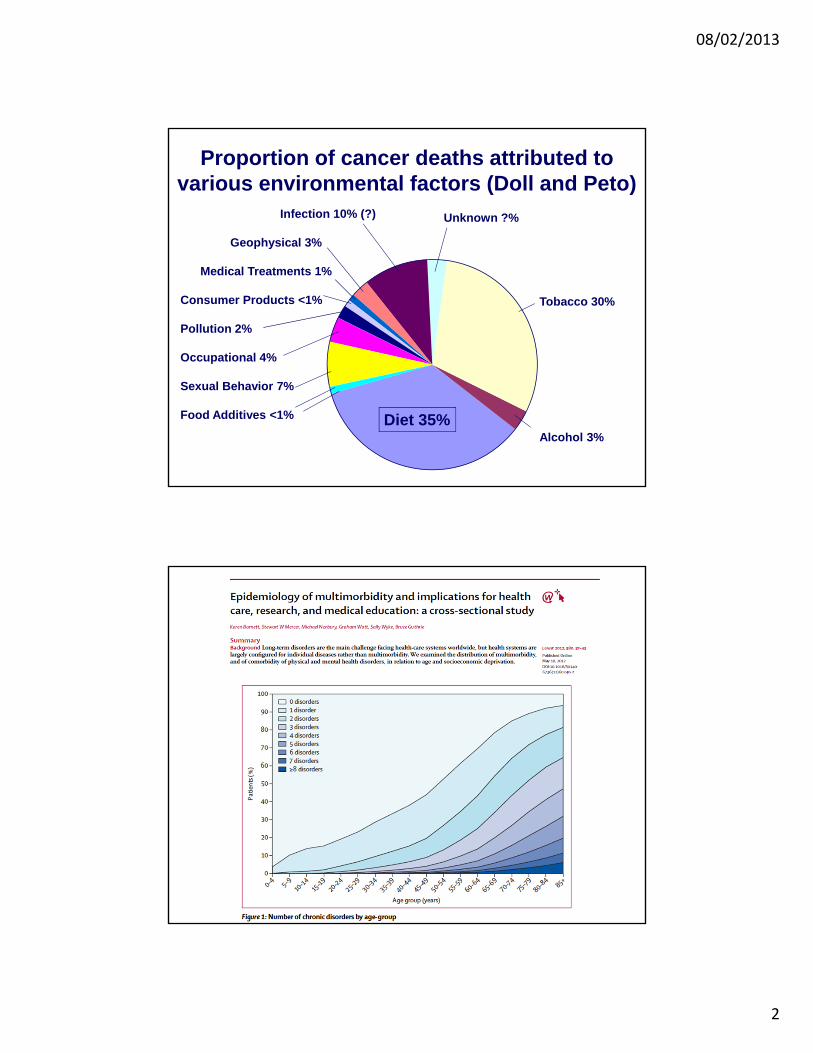
Proportion of cancer deaths attributed to various environmental factors (Doll and Peto)
Infection 10% (?)
Geophysical 3%
Medical Treatments 1%
Consumer Products <1%
Pollution 2%
Occupational 4%
Sexual Behavior 7%
Food Additives <1%
Unknown ?%
Tobacco 30%
Alcohol 3%Diet 35%
08/02/2013
3
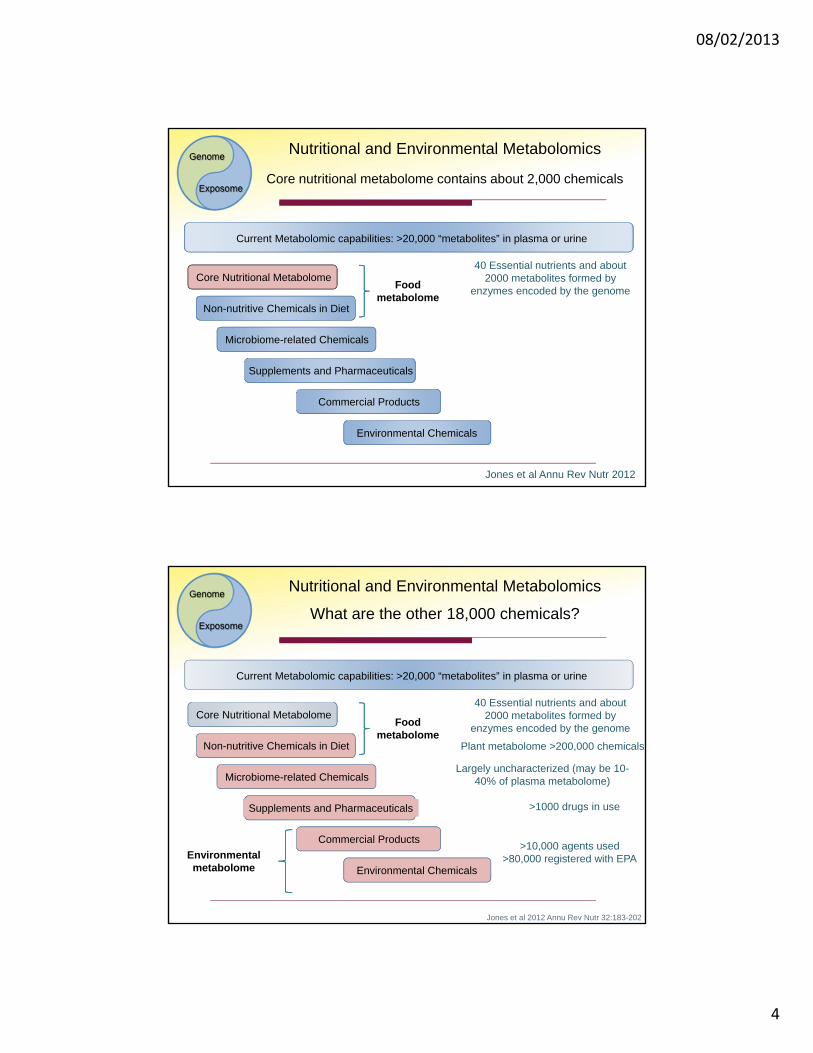
Select relevant samples
Pose scientific question (with or without hypothesis)
Analyze samples by high-resolution MS with advanced data
extraction algorithms
Use bioinformatic methods and database tools to obtain significant
metabolites and pathways
Perform MS/MS and co-elution studies to verify metabolites
Alternate Workflows
Select analytic target to test hypothesis
Select and test analytic method
Perform power calculation; design experiment
Conduct experiment
Analyze samples and perform statistical analysis
High-resolution metabolomicsTargeted Metabolomics
08/02/2013
4
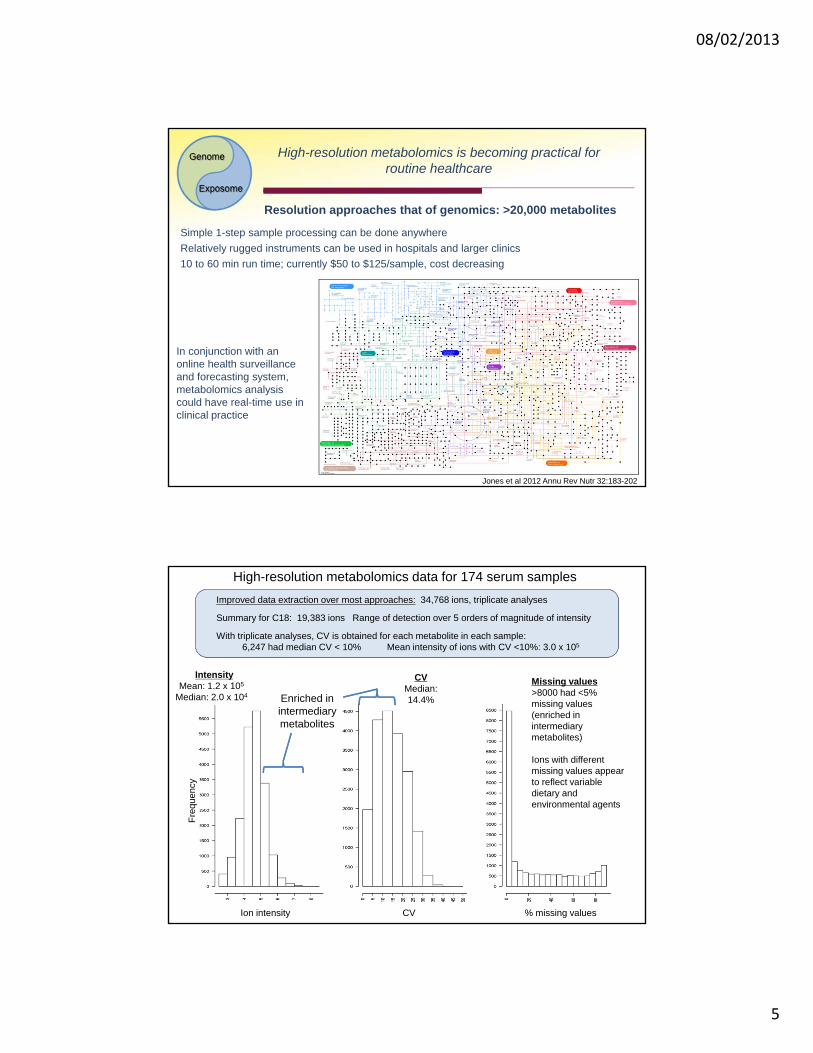
Environmental Chemicals
Core Nutritional Metabolome
Non-nutritive Chemicals in Diet
Microbiome-related Chemicals
Supplements and Pharmaceuticals
Commercial Products
Current Metabolomic capabilities: >20,000 “metabolites” in plasma or urine
Food metabolome
Jones et al Annu Rev Nutr 2012
40 Essential nutrients and about 2000 metabolites formed by
enzymes encoded by the genome
Nutritional and Environmental Metabolomics
Core nutritional metabolome contains about 2,000 chemicals
Nutritional and Environmental Metabolomics
Environmental Chemicals
Core Nutritional Metabolome
Non-nutritive Chemicals in Diet
Microbiome-related Chemicals
Supplements and Pharmaceuticals
Commercial Products
Current Metabolomic capabilities: >20,000 “metabolites” in plasma or urine
Food metabolome
Environmental metabolome
>10,000 agents used>80,000 registered with EPA
Largely uncharacterized (may be 10-40% of plasma metabolome)
>1000 drugs in use
40 Essential nutrients and about 2000 metabolites formed by
enzymes encoded by the genome
Plant metabolome >200,000 chemicals
Jones et al 2012 Annu Rev Nutr 32:183-202
What are the other 18,000 chemicals?
08/02/2013
5
High-resolution metabolomics is becoming practical for routine healthcare
Simple 1-step sample processing can be done anywhere
Relatively rugged instruments can be used in hospitals and larger clinics
Resolution approaches that of genomics: >20,000 metabolites
10 to 60 min run time; currently $50 to $125/sample, cost decreasing
In conjunction with an online health surveillance and forecasting system, metabolomics analysis could have real-time use in clinical practice
Jones et al 2012 Annu Rev Nutr 32:183-202
High-resolution metabolomics data for 174 serum samples
Missing values>8000 had <5% missing values(enriched in intermediary metabolites)
Ions with different missing values appear to reflect variable dietary and environmental agents
With triplicate analyses, CV is obtained for each metabolite in each sample:6,247 had median CV < 10% Mean intensity of ions with CV <10%: 3.0 x 10⁵
Enriched in intermediary metabolites
Ion intensity
Fre
quen
cy
CVMedian: 14.4%
CV % missing values
IntensityMean: 1.2 x 10⁵
Median: 2.0 x 10⁴
Summary for C18: 19,383 ions Range of detection over 5 orders of magnitude of intensity
Improved data extraction over most approaches: 34,768 ions, triplicate analyses
08/02/2013
6
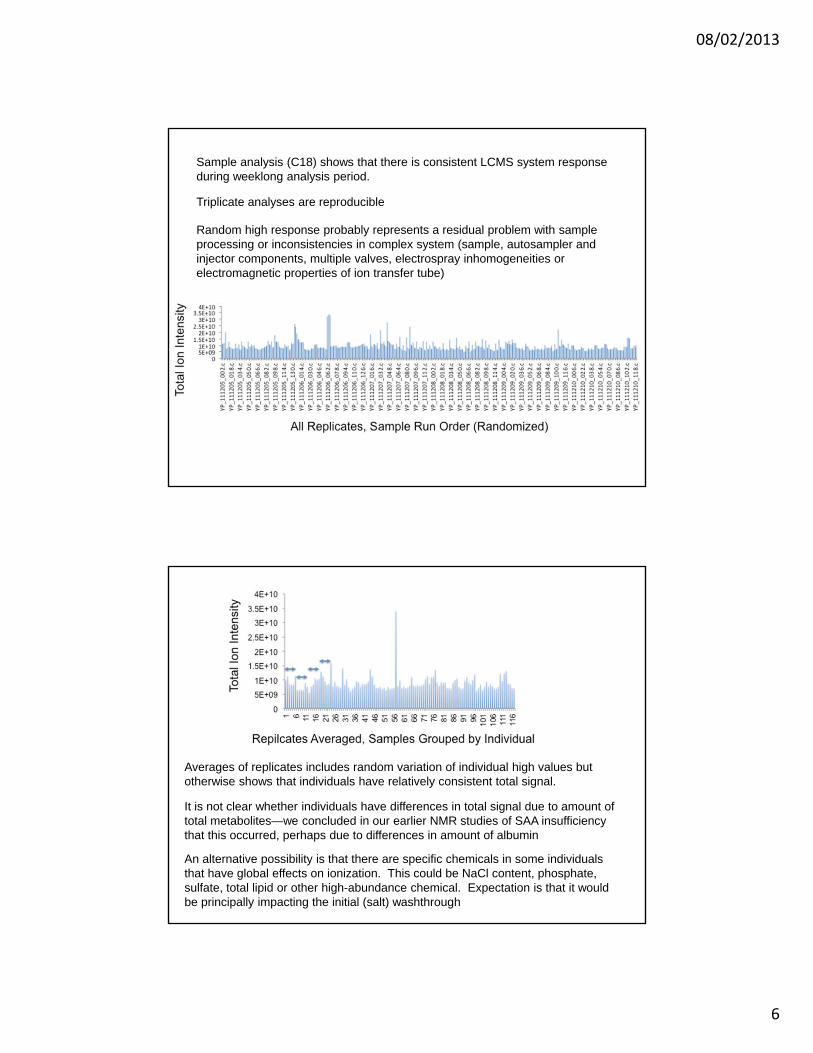
Sample analysis (C18) shows that there is consistent LCMS system response during weeklong analysis period.
Triplicate analyses are reproducible
Random high response probably represents a residual problem with sample processing or inconsistencies in complex system (sample, autosampler and injector components, multiple valves, electrospray inhomogeneities or electromagnetic properties of ion transfer tube)
Averages of replicates includes random variation of individual high values but otherwise shows that individuals have relatively consistent total signal.
It is not clear whether individuals have differences in total signal due to amount of total metabolites—we concluded in our earlier NMR studies of SAA insufficiency that this occurred, perhaps due to differences in amount of albumin
An alternative possibility is that there are specific chemicals in some individuals that have global effects on ionization. This could be NaCl content, phosphate, sulfate, total lipid or other high-abundance chemical. Expectation is that it would be principally impacting the initial (salt) washthrough
08/02/2013
7
EMORYSCHOOL OF
MEDICINE
Key components of pathway analysis
Statistical testing: FDR
Metabolite-metabolite Correlation Analyses
Online Databases/Resources
July 24, 2013
UAB Metabolomics Workshop
Cross-platform Studies
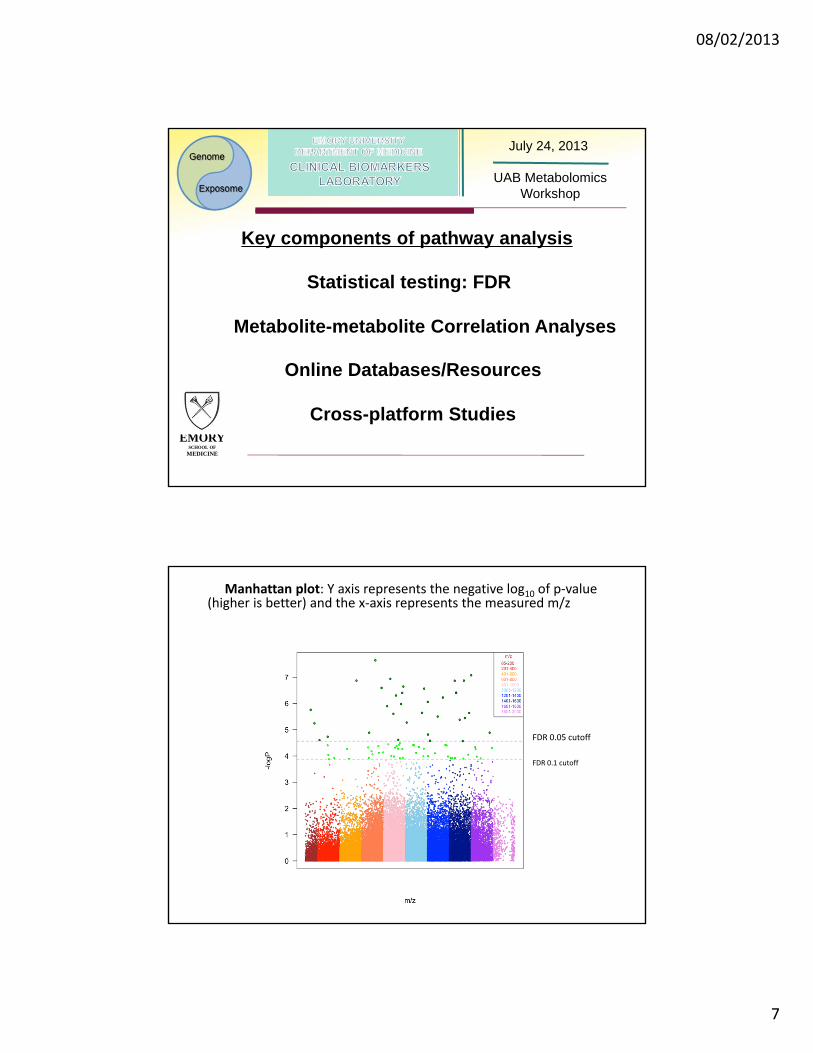
Manhattan plot: Y axis represents the negative log10 of p‐value (higher is better) and the x‐axis represents the measured m/z
FDR 0.05 cutoff
FDR 0.1 cutoff
08/02/2013
8
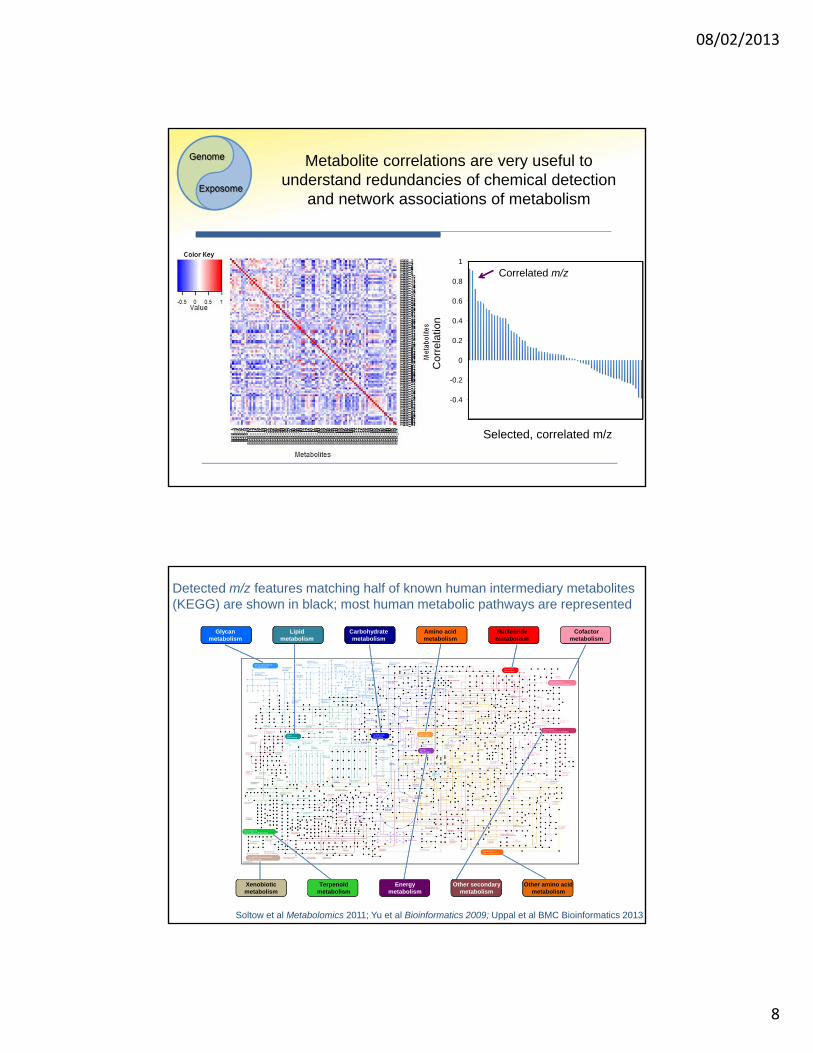
Metabolite correlations are very useful to understand redundancies of chemical detection
and network associations of metabolism
1
0.6
0.8
0.4
0.2
0
-0.2
-0.4
Cor
rela
tion
Selected, correlated m/z
Correlated m/z
Soltow et al Metabolomics 2011; Yu et al Bioinformatics 2009; Uppal et al BMC Bioinformatics 2013
Detected m/z features matching half of known human intermediary metabolites (KEGG) are shown in black; most human metabolic pathways are represented
Glycanmetabolism
Lipidmetabolism
Carbohydratemetabolism
Amino acidmetabolism
Nucleotidemetabolism
Cofactormetabolism
Xenobioticmetabolism
Terpenoidmetabolism
Energymetabolism
Other secondarymetabolism
Other amino acidmetabolism
08/02/2013
9
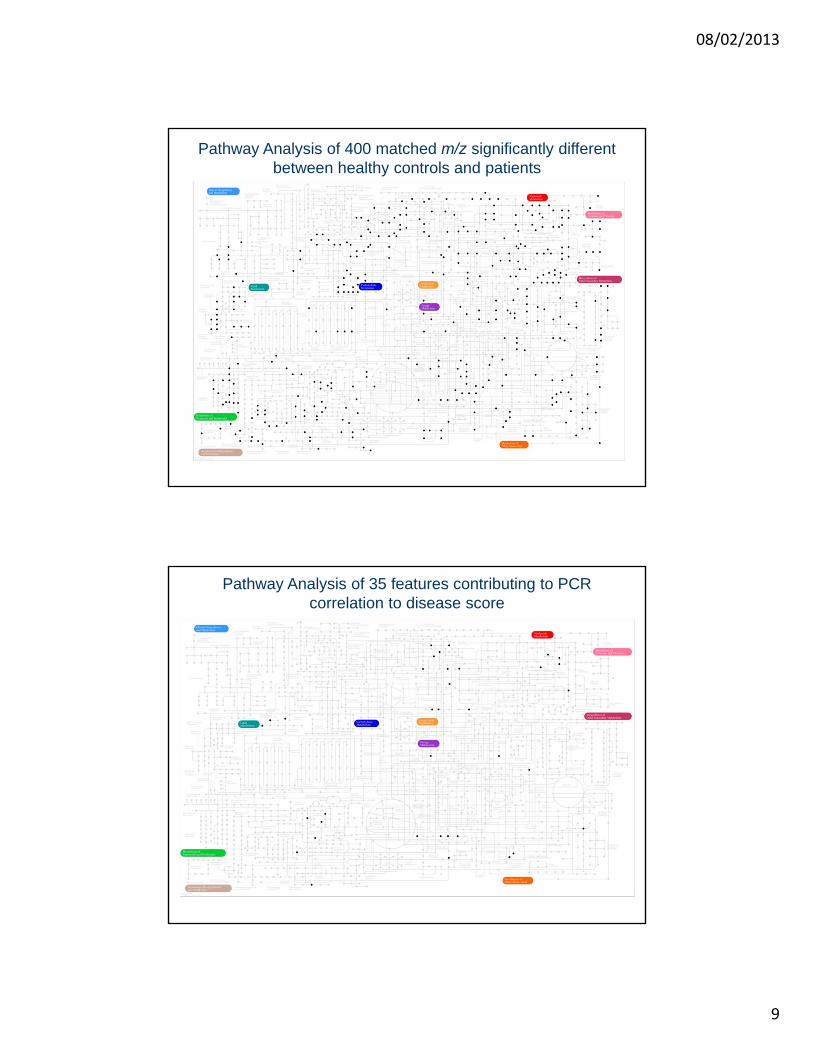
Pathway Analysis of 400 matched m/z significantly different between healthy controls and patients
Pathway Analysis of 35 features contributing to PCR correlation to disease score
08/02/2013
10
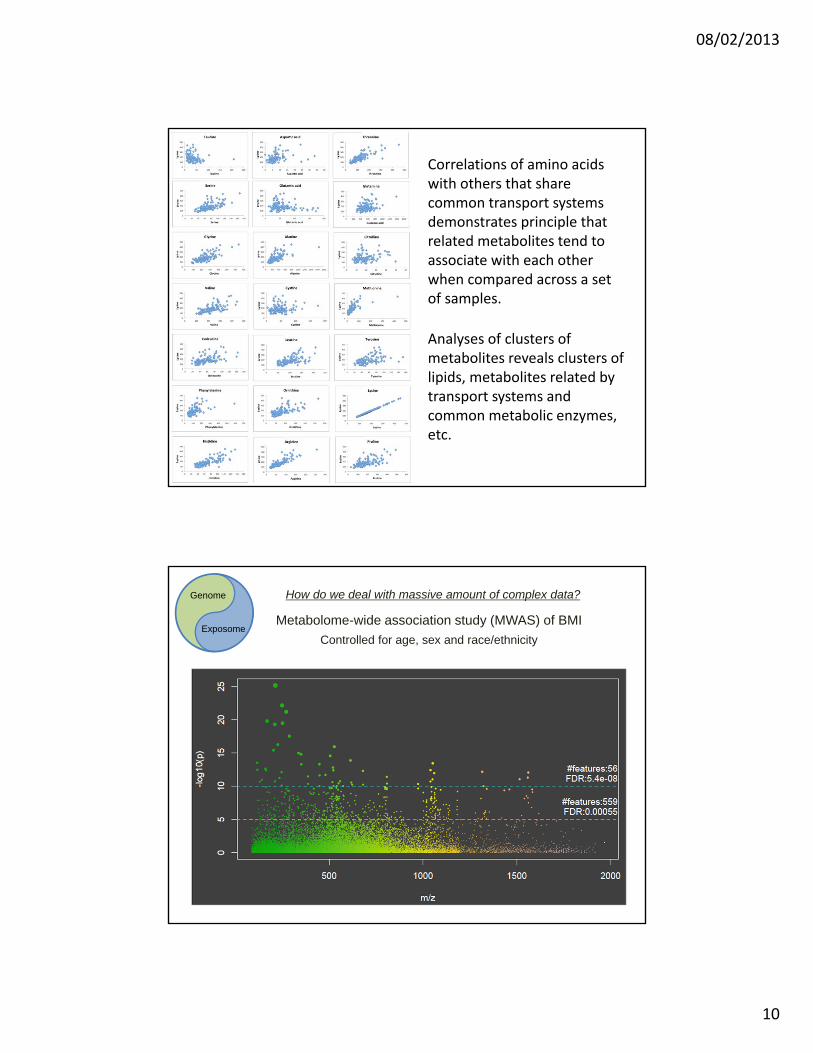
Correlations of amino acids with others that share common transport systems demonstrates principle that related metabolites tend to associate with each other when compared across a set of samples.
Analyses of clusters of metabolites reveals clusters of lipids, metabolites related by transport systems and common metabolic enzymes, etc.
Metabolome-wide association study (MWAS) of BMI
Genome
ExposomeControlled for age, sex and race/ethnicity
How do we deal with massive amount of complex data?
08/02/2013
11
EMORYSCHOOL OF
MEDICINE
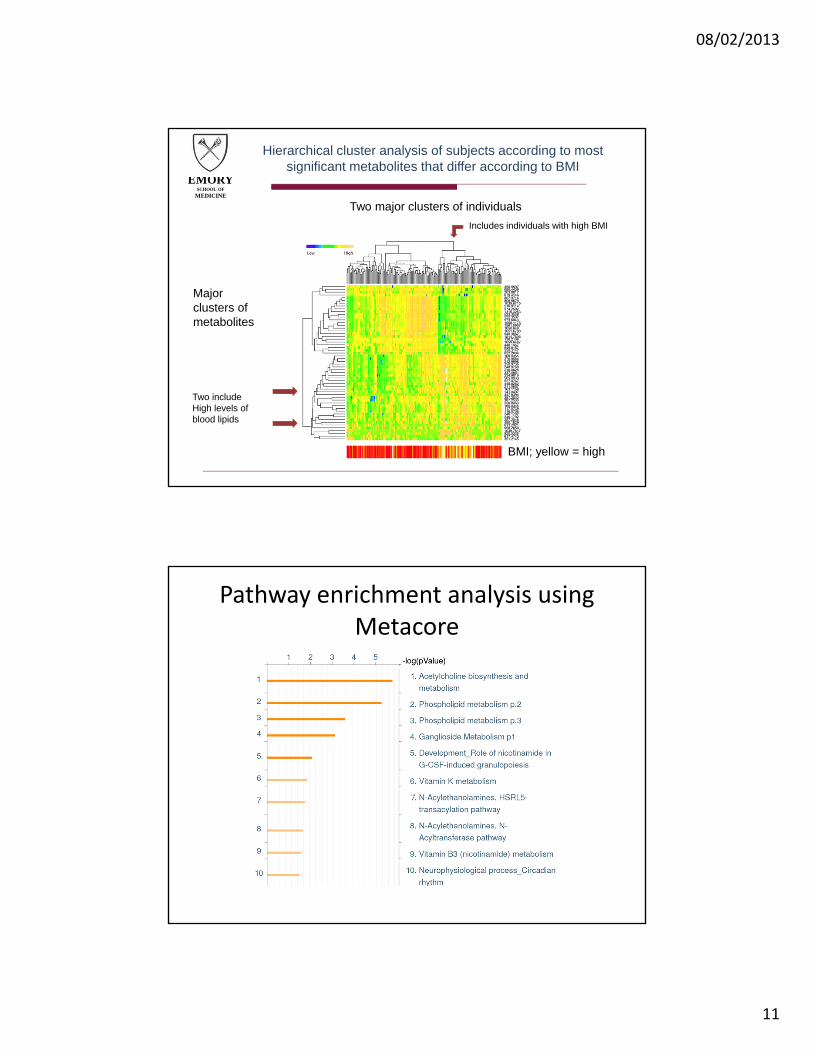
Hierarchical cluster analysis of subjects according to most significant metabolites that differ according to BMI
Two major clusters of individuals
BMI; yellow = high
Includes individuals with high BMI
Two includeHigh levels of blood lipids
Major clusters of metabolites
Pathway enrichment analysis using Metacore
08/02/2013
12
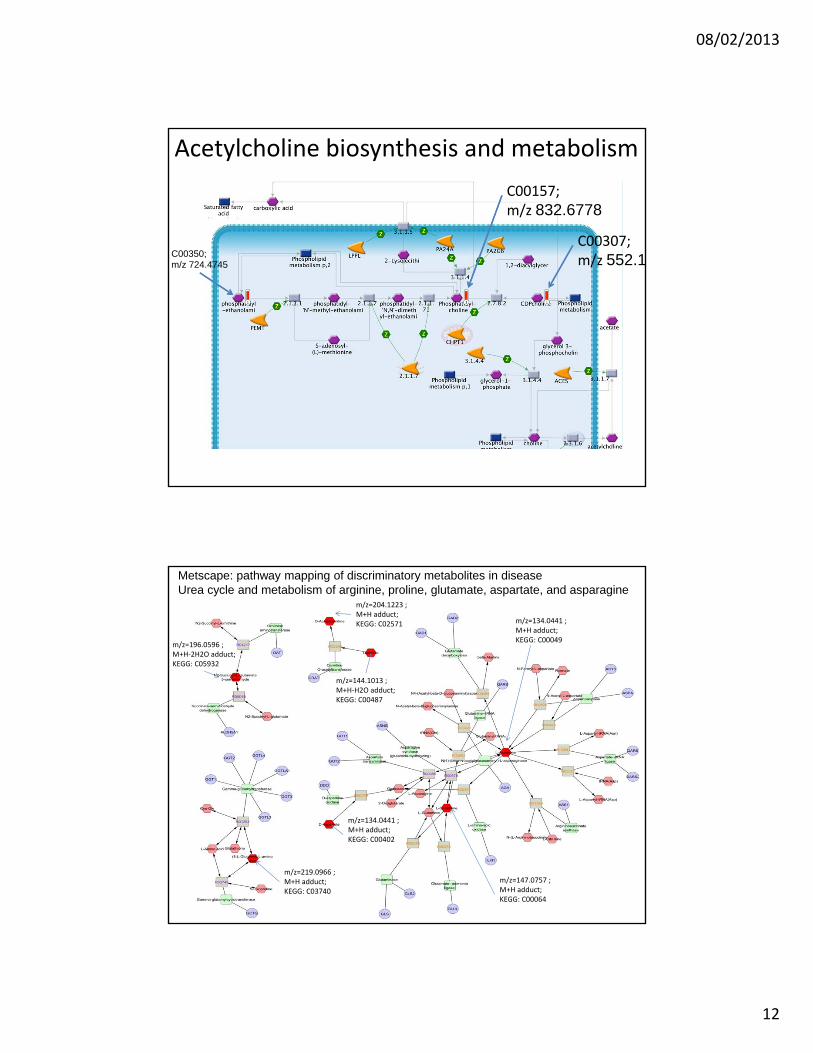
Acetylcholine biosynthesis and metabolism
C00350;m/z 724.4745
C00157;m/z 832.6778
C00307;m/z 552.1
Metscape: pathway mapping of discriminatory metabolites in disease Urea cycle and metabolism of arginine, proline, glutamate, aspartate, and asparagine
m/z=196.0596 ; M+H‐2H2O adduct;KEGG: C05932
m/z=219.0966 ; M+H adduct;KEGG: C03740
m/z=134.0441 ; M+H adduct;KEGG: C00402
m/z=144.1013 ; M+H‐H2O adduct;KEGG: C00487
m/z=204.1223 ; M+H adduct;KEGG: C02571 m/z=134.0441 ;
M+H adduct;KEGG: C00049
m/z=147.0757 ; M+H adduct;KEGG: C00064
08/02/2013
13
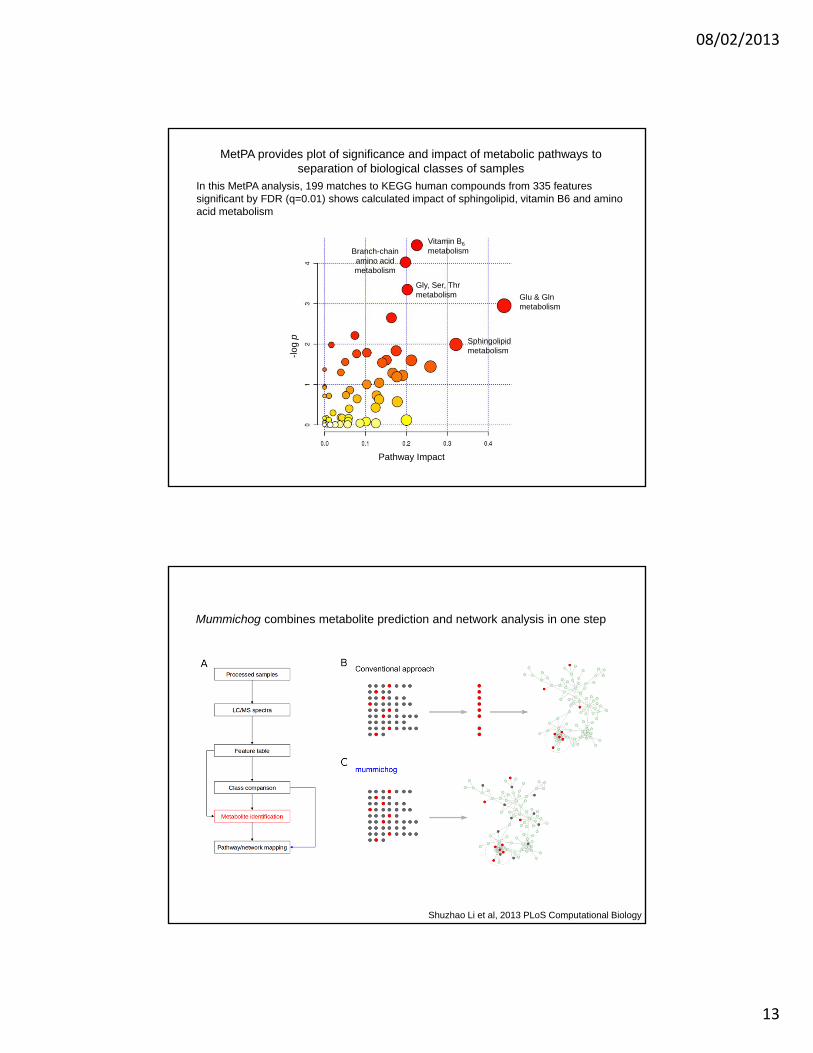
Glu & Glnmetabolism
Sphingolipidmetabolism
Vitamin B6
metabolismBranch-chain amino acidmetabolism
Gly, Ser, Thrmetabolism
Pathway Impact
-log
p
MetPA provides plot of significance and impact of metabolic pathways to separation of biological classes of samples
In this MetPA analysis, 199 matches to KEGG human compounds from 335 features significant by FDR (q=0.01) shows calculated impact of sphingolipid, vitamin B6 and amino acid metabolism
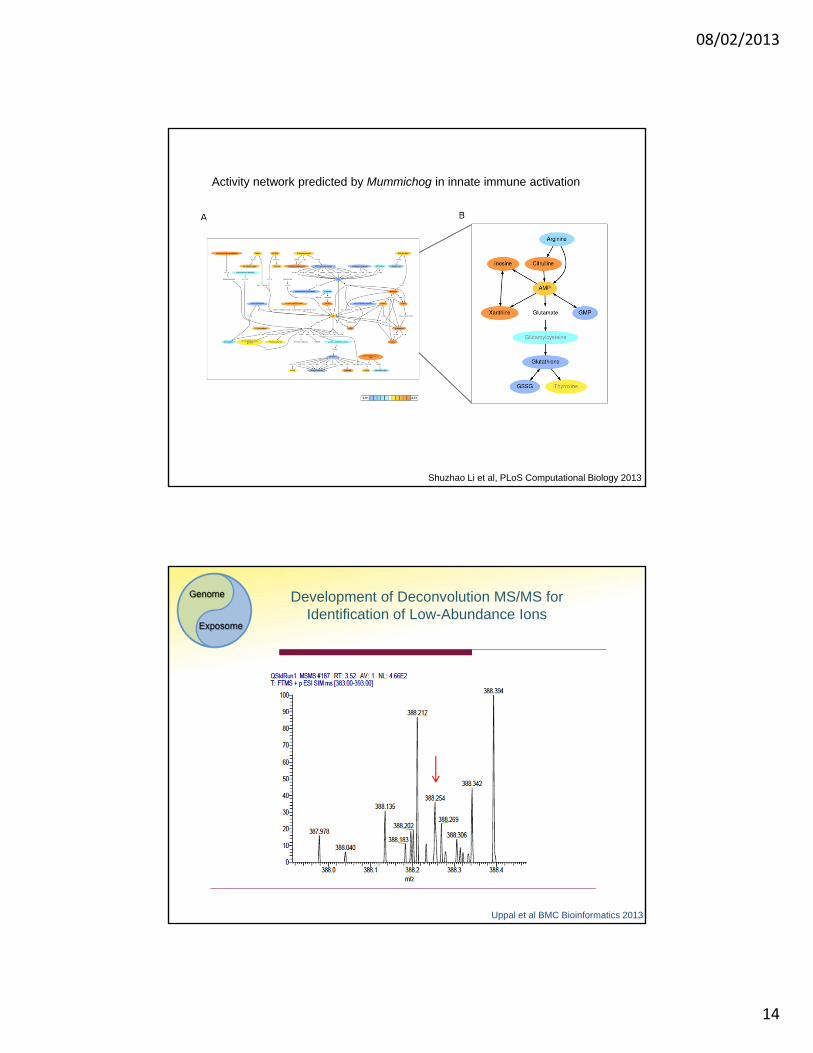
Mummichog combines metabolite prediction and network analysis in one step
Shuzhao Li et al, 2013 PLoS Computational Biology
08/02/2013
14
Activity network predicted by Mummichog in innate immune activation
Shuzhao Li et al, PLoS Computational Biology 2013
Development of Deconvolution MS/MS for Identification of Low-Abundance Ions
Uppal et al BMC Bioinformatics 2013
08/02/2013
15
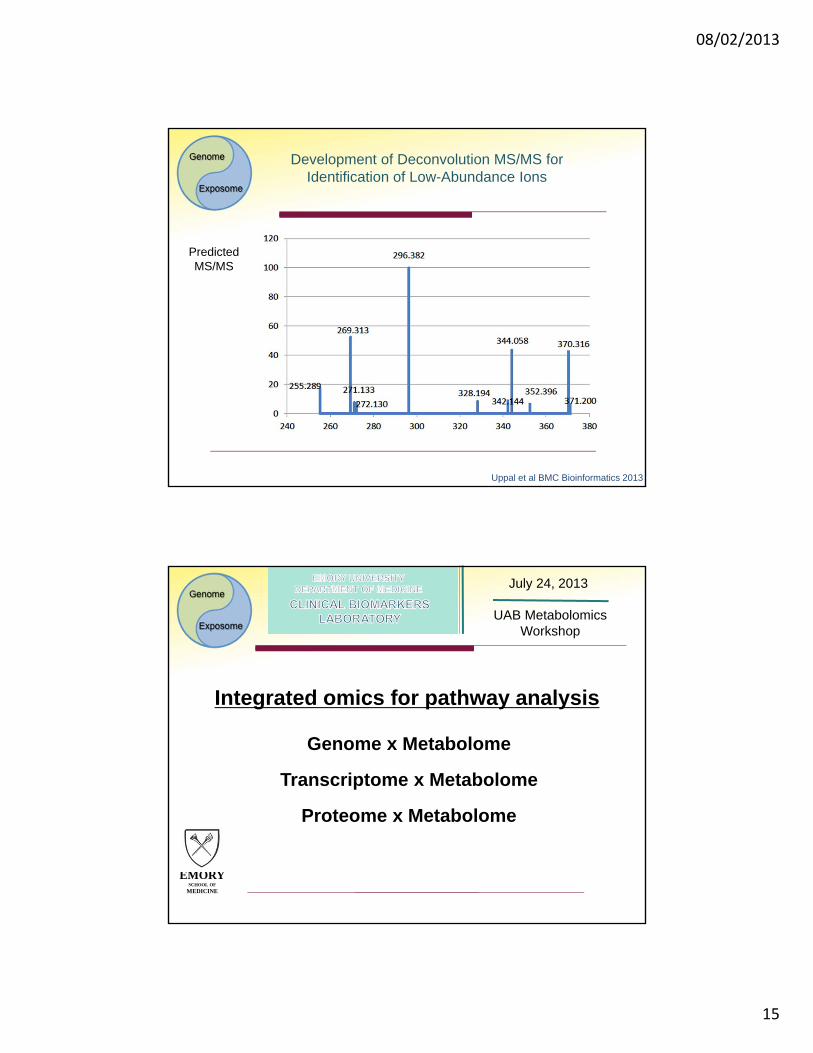
Development of Deconvolution MS/MS for Identification of Low-Abundance Ions
PredictedMS/MS
Uppal et al BMC Bioinformatics 2013
EMORYSCHOOL OF
MEDICINE
Integrated omics for pathway analysis
Genome x Metabolome
Transcriptome x Metabolome
Proteome x Metabolome
July 24, 2013
UAB Metabolomics Workshop
08/02/2013
16
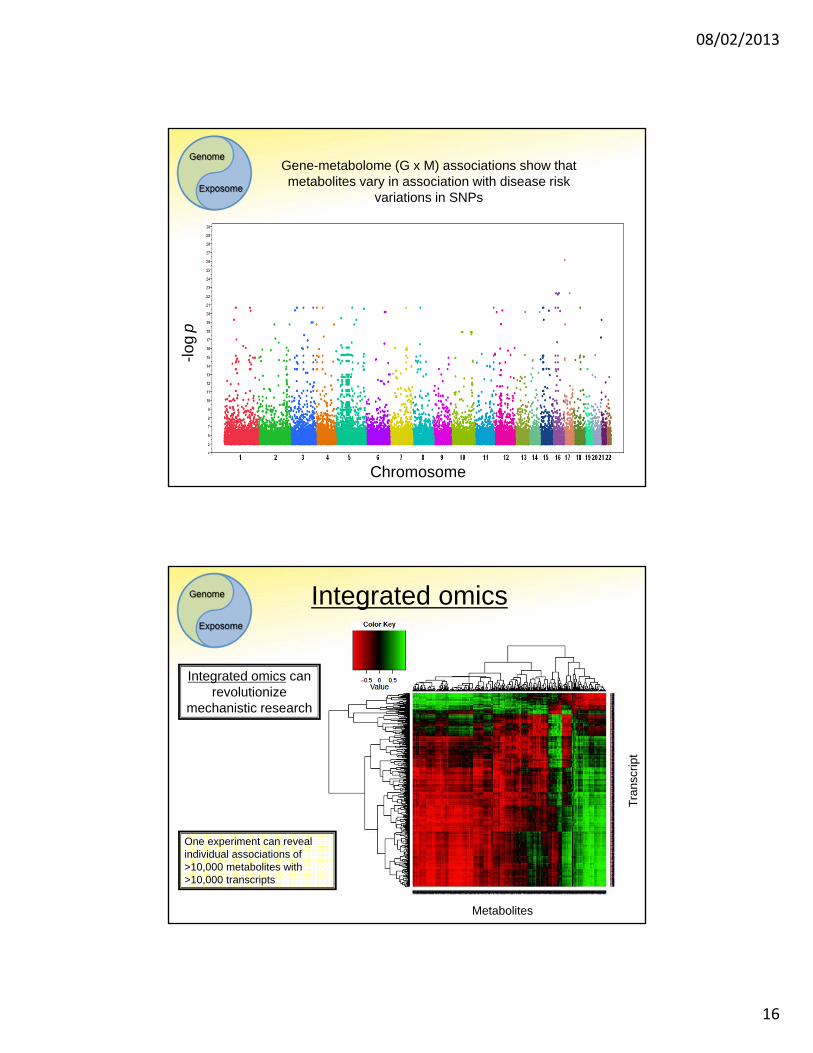
-log
p
Chromosome
Gene-metabolome (G x M) associations show that metabolites vary in association with disease risk
variations in SNPs
Integrated omics
Metabolites
Tra
nscr
ipt
One experiment can reveal individual associations of >10,000 metabolites with >10,000 transcripts
Integrated omics can revolutionize
mechanistic research
08/02/2013
17
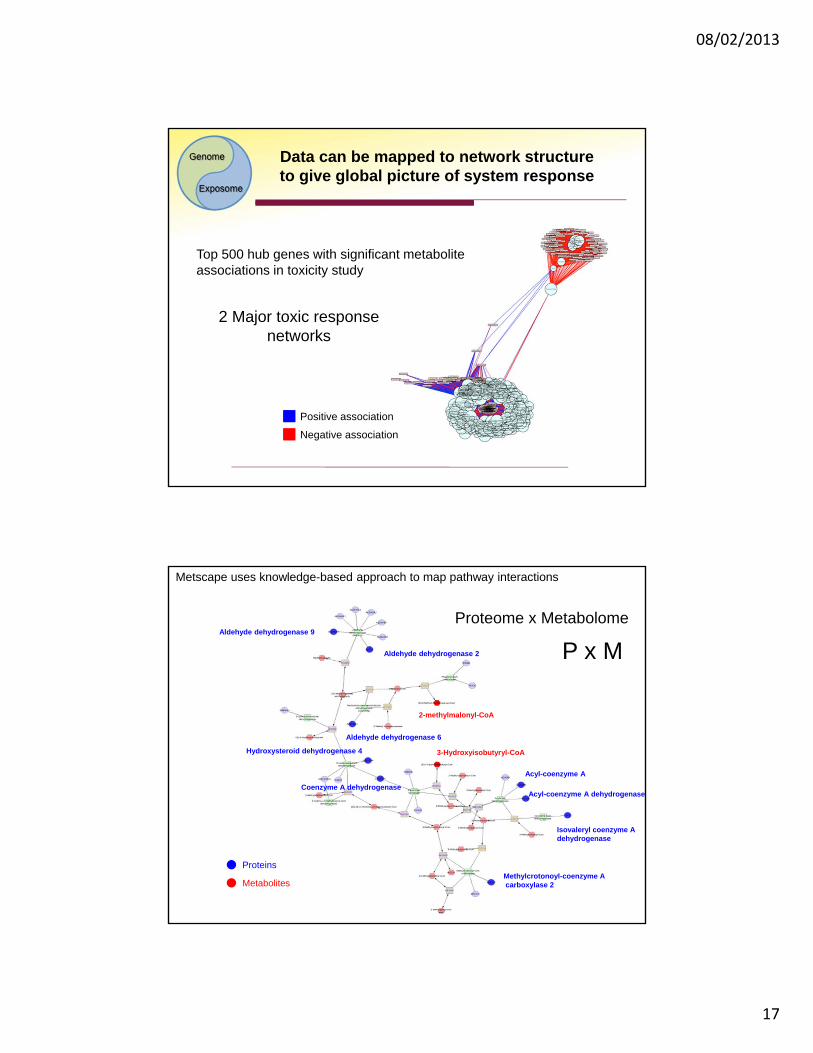
Data can be mapped to network structure to give global picture of system response
Positive association
Negative association
Top 500 hub genes with significant metabolite associations in toxicity study
2 Major toxic response networks
Metscape uses knowledge-based approach to map pathway interactions
Aldehyde dehydrogenase 9
Aldehyde dehydrogenase 2
2-methylmalonyl-CoA
Aldehyde dehydrogenase 6
3-Hydroxyisobutyryl-CoAHydroxysteroid dehydrogenase 4
Coenzyme A dehydrogenase
Acyl-coenzyme A
Acyl-coenzyme A dehydrogenase
Isovaleryl coenzyme Adehydrogenase
Methylcrotonoyl-coenzyme Acarboxylase 2
Proteins
Metabolites
Proteome x Metabolome
P x M
08/02/2013
18
EMORYSCHOOL OF
MEDICINE
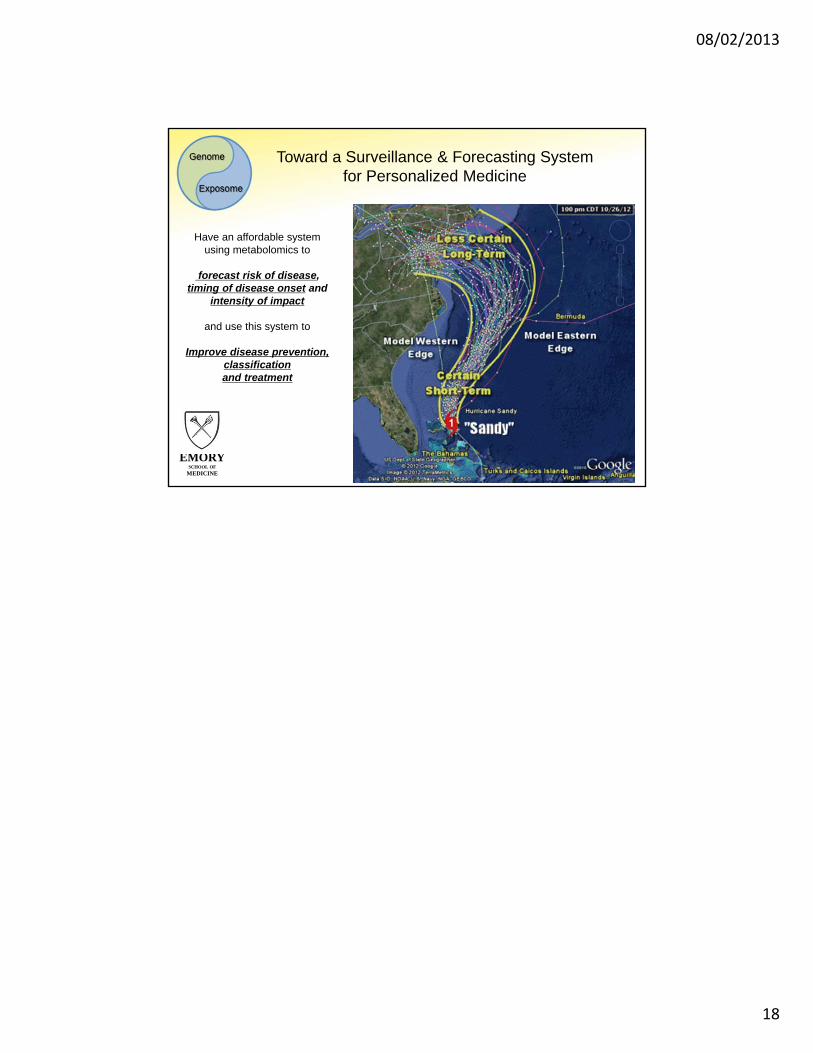
Toward a Surveillance & Forecasting System for Personalized Medicine
Have an affordable system using metabolomics to
forecast risk of disease, timing of disease onset and
intensity of impact
and use this system to
Improve disease prevention, classificationand treatment