Embed Size (px)
Citation preview
American Journal of Analytical Chemistry, 2011, 2, 142-151 doi:10.4236/ajac.2011.22016 Published Online May 2011 (http://www.SciRP.org/journal/ajac)
Copyright © 2011 SciRes. AJAC
Metabolomics Analysis of the Responses to Partial Hepatectomy in Hepatocellular Carcinoma Patients
Wan Chan1,4, Shuhai Lin1,4, Stella Sun2, Hongde Liu3, John M. Luk2,*, Zongwei Cai1,* 1Department of Chemistry, Hong Kong Baptist University, Hong Kong SAR, China
2Department of Surgery, LKS Faculty of Medicine, Jockey Club Clinical Research Center, The University of Hong Kong, Hong Kong SAR, China
3State Key Laboratory of Bioelectronics, Southeast University, Nanjing, China 4These authors contributed equally to this work
E-mail:*[email protected], [email protected] Received September 16, 2010; revised December 7, 2010; accepted March 3, 2011
Abstract In this study, liquid chromatography/quadrupole time of flight mass spectrometry (LC/QTOFMS) was em-ployed for investigating the metabolome of the sera collected from hepatocellular carcinoma (HCC) patients before and 3 to 5 months after partial hepatectomy. To investigate the changes in metabolic phenotypes after the hepatic resection, principal components analysis (PCA) and support vector machine (SVM) were per-formed for the data grouping and classification. Based on the obtained SVM model, mass spectrometry spec-tra, database searching as well as the confirmation from authentic standards, several differentiating metabo-lites were tentatively identified. To improve visualization, z-score plot and heat map display were performed, which exhibited the changes in concentration of the metabolites. As a result, depletion of circulating car-nitine, reduced amino acid biosynthesis and increased rate of lipid peroxidation were observed. Meanwhile, up-regulation of hypoxanthine indicated that purine metabolism might serve as the salvage pathway. Collec-tively, the results reflected metabolic responses to surgical operation in HCC patients, suggesting perturba-tion of energy metabolism may occur in 3 to 5 months after the partial hepatectomy. Keywords: Metabolomics Analysis, Partial Hepatectomy, Hepatocellular Carcinoma, LC-MS
1. Introduction Metabolite profiling was regarded to reveal metabolic changes in living systems, tissues or cell lines. The ap- plications of the relatively new technique have been ex- ponentially increased in numerous fields, including toxi- cology, pharmacology, and clinical diagnostics [1]. Stu-dies of the identities, concentrations and fluxes on these small molecules in cells, tissues and biological fluids can enhance understanding of the mechanisms involved in pharmacology and disease pathophysiology [1-3]. Me-tabolomics not only involves the “quantitative determi-nation of targeted metabolite profiling of a complex metabolic response”, but also the “qualitative determina-tion of comprehensive or untargeted metabolite profil-ing” of the pathophysiological process or genetic deter-minants in living systems [4]. Therefore, metabolic pro-filing has been extended to the investigation and dis- cover of new biomarkers for clinical diagnosis and the
evaluation of therapeutic efficacy [5-7]. Metabolomics utilizes techniques that can simultane-
ously quantify thousands of small molecules in a bio- logical sample. This analytical capability must then be joined to sophisticated mathematical tools that can iden- tify a molecular signal among millions of pieces of data [8]. A large number of metabolites occurring with very diverse physico-chemical properties and different abun- dance levels require the powerful analytical capacity [9]. Chromatography coupled with mass spectrometry has been demonstrated for its vast potential as a tool for this type of investigation. As a typical LC/MS analysis may involve hundreds to thousands of peaks, data extraction and analysis are important for obtaining the relevant biomarker information. The candidate peaks are then further analyzed with sophisticated mathematical tools and structurally characterized for the identification of biomarkers [10]. Treatment of the acquired mass spec- trometry data from different tested groups could be con-
W. CHAN ET AL. 143 ducted by using multivariate data analysis. Principal components analysis (PCA), an unsupervised projection method for visualization of the dataset and display the similarity and difference, is widely applied in me-tabolomic analysis. Partial least squares (PLS), the re-gression extention of PCA such as PLS-DA, has been used as a means of data filtering and feature selection [11]. Support vector machine (SVM) as the supervised powerful machine learning can be extended to nonlinear cases with the help of kernels. SVM has been shown as a better machine learning to PLS-DA in both cases in terms of predictive accuracy with the least number of features [12-14].
More and more evidences have demonstrated that me- tabolomics study is a promising approach for liver dis- eases diagnosis. Most of the reported metabolomic stud- ies focused on comparing liver disease with non-malig- nant or healthy subjects. For instance, liver cancer has been discriminated with HPLC analysis avoiding false- positive result from hepatitis and hepatocirrhosis dis- eases [15]. Biochemical perturbation of liver function caused by hepatitis B virus was characterized by LC/MS and GC/MS [16,17]. Low-grade human hepatocellular carcinoma tumors have been differentiated from high- grade ones based on high-resolution magic-angle spin- ning (MAS) 1H nuclear magnetic resonance spectroscopy [18]. To the best of our knowledge, however, little is known about the application of metabolomics for the evaluation of prognostic metabolite profiling in HCC patients after hepatic resection. In the present study, LC/QTOFMS was conducted for non-targeted metabolo- mics to screen metabolic changes in the sera of HCC patients collected before and 3 to 5 months after hepa- tectomy. In addition to PCA and SVM introduced for pattern recognition and data mining, two other appoaches were also implemented, namely hierarchical clustering heat map and z-score plot for improving visualization. The multivariate data analysis provided a powerful tool for understanding the underlying metabolic responses in HCC patients through surgical operation. 2. Materials and Methods 2.1. Sample Preparation The sera were harvested from ten HCC patients pre- and post-hepatectomy in fasting conditions at Queen Mary Hospital, The University of Hong Kong. The study was approved by the Ethics Committee in Hong Kong. All patients are male with the age of 37 - 59 years old. Sam- ples were stored at 80˚C and then thawed before analy- sis. 400 μL acetonitrile was added to 200 μL of each se- rum sample and vertex vigorously. The sample mixture
was allowed to stand for 5 min and centrifuged at 13,000 rpm for 5 min at 4˚C. The supernatant was lyophilized with the addition of 400 μL Milli-Q water. 50 μL of ace- tonitrile/water mixture (1:1) was added to the sera sam- ples, vortex mixed and centrifuged prior to the LC/MS analysis. L-carnitine, acetylcarnitine, hypoxanthine and amino acids (proline, valine, leucine and isoleucine) were obtained from Sigma (St. Louis, MO, USA). 2.2. LC/MS and LC/MS/MS Analyses Chromatographic separation was performed on an HP 1100 HPLC system (Agilent Technologies, Palo Alto, CA, USA) equipped with a 150 mm × 2.1 mm Symmetry C18 reversed-phase column with particle size 3.5 μm (Milford, MA, USA). Aliquots of 3 μL each sample were injected onto the HPLC column for analysis. A linear gradient at a flow rate of 300 μLmin−1 was used con- taining solvents A (0.1% formic acid in water) and B (acetonitrile). Initial conditions were 5% B, held for 5 min, increased to 95% B from 5 to 20 min, and held for 4 min, then decreased to 5% B in 1 min and re-condition- ing for 10 min to the initial conditions. The serum sam- ple pairs were run in random order and in duplicate. To minimize the cross contamination, a blank run was in- serted between the consecutive samples.
A QTOFMS (API Q-STAR Pulsar i, MDS Sciex, To- ronto, Canada) was employed for the analysis of metabo- lite ions in positive mode. TurboIonspray parameters for ESI-MS were optimized as follows: ionspray voltage (IS) 4500 V, declustering potential Ⅰ (DPⅠ) 30 V, declus- tering potential Ⅱ (DPⅡ) 15 V, focusing potential (FP) 80 V. The mass range was from 100 to 1,000 m/z. The ion source gas Ⅰ (GSⅠ), gas Ⅱ (GSⅡ), curtain gas (CUR) and collision gas (CAD) were set at 30, 15, 30 and 3, respectively. The temperature of GSⅡ was set at 350˚C. Renin substrate tetradecapeptide at 10 pmolμL−1 was used for the calibration of the mass spectrometer. Data acquisition and processing was performed based on Analyst QS software (service pack 7).
To obtain structural information of the metabolites, information-dependent acquisition (IDA) mode was used to acquire the MS/MS spectra of the metabolites in se-rum samples. Using the IDA in Analyst QS (Applied Biosystems/MDS Sciex), MS/MS analysis at different collision energies (CEs) were performed. For the product ion scans, the resolution of the mass resolving quadru-pole (Q1) was set low (4 amu window). The ion peaks with peak intensity exceeding 50 counts in the survey scan triggered MS/MS analyses. Former target ions that had been selected for MS/MS analyses were excluded from MS/MS analyses for 30 s.
Copyright © 2011 SciRes. AJAC
W. CHAN ET AL.
Copyright © 2011 SciRes. AJAC
144
2.3. Multivariate and Univariate Statistical Analysis
The LC/MS chromatograms were imported into “Me- tabolomics ExportScript” (Applied Biosystems/MDS Sciex) for peak finding, alignment and filtering. LC/MS data were processed by using the criteria as described previously [19]. In the current work, nonlinear PCA as well as SVM with radial-basis-function (RBF) kernel were presented to map the classification. Here, T-test score and separation score were used in SVM model to rank each feature (metabolite ions). Moreover, the peak areas of the metabolite ions were integrated from ex- trated ion chromatograms prior to heat map display and z-score plot. All the scripts were performed in MATLAB R2008a software (The MathWorks, Inc., Natick, MA, USA).
The one-way analysis of variance (One-Way ANOVA) was utilized to compare the serum samples of post- hepatectomy to pre-hepatectomy for up- or down-regu- lated metabolites. The P values with Bonferroni correc- tion were obtained by OriginPro 8 software (OriginLab, Co., MA). Human metabolome database (http://www. hmdb.ca/) (briefly HMDB) [20] the metlin metabolite database (http://metlin.scripps.edu/) [21] and KEGG da- tabase (http://www.genome.jp/kegg/atlas/) [22] were
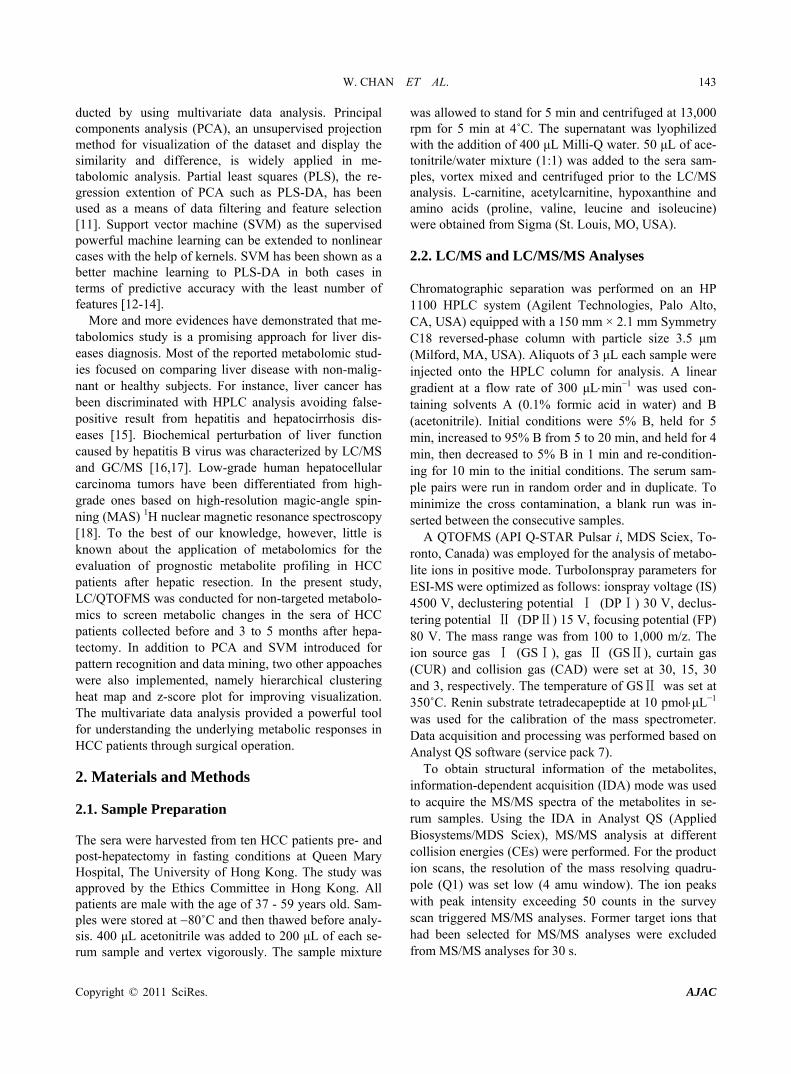
used for metabolite identification and mapping. 3. Results The schematic flowchart of the metabolomic approach performed in this study was illustrated in the Figure 1. Briefly, the metabolites from sera were extracted and applied to HPLC coupled with electrospray ion source in positive mode, with the QTOFMS data acquired from 100 to 1,000 m/z. One typical total ion chromatogram (TIC) is also inserted. The feature tables from the TICs were yielded consisting of m/z value, retention time, and integrated intensity using “Metabolomics ExportSript” software. Feature selection was generated from SVM model during data training for metabolite discovery. The metabolite ions were imported into PCA and SVM using MATLAB programme. For the identification of metabo- lites of interest, accurate mass data were searched against databases of known metabolites, such as Metlin, HMDB. A match was tested by fragmentation data from QTOFMS in comparison to authentic standards. Finally, the interpretation of metabolic signature and visualize- tion in z-score plot and cluster heat map were performed. As a result, the metabolite ions which were statistically significant were selected as differentiating metabolites listed in Table 1.
Figure 1. Schematic flowchart of the reported metabolomic study.
W. CHAN ET AL. 145
Table 1. Statistical differentiating metabolites.
No. m/za (RT, min) productions, m/z metabolites Fold-change P value
1 203.0503 (1.25) Un-known 2.82↓b 7.19E-5
2 162.1146 (1.32) 103, 85, 60 carnitine 3.03↓ 1.76E-5
3 204.1170 (1.35) 85, 60 acetylcarnitine 4.06↓ 0.0071
4 116.0680 (1.28) 70 proline 1.78↓ 0.033
5 118.0821 (1.28) 72 valine 1.83↓ 0.0089
6 132.0738 (1.28) 86 leucine/isoleucine 2.37↓ 0.0012
7 137.0409 (1.35) 119, 110 hypoxanthine 2.35↑ 0.015
8 494.3157 (19.83) 104,184 LysoPCc (16:1) 2.11↑ 0.011
9 496.3260 (21.45) 104,184 LysoPC (16:0) 1.26↑ 0.031
10 468.3114 (19.4) 104, 184, 450 LysoPC (14:0) 2.23↑ 0.0062
11 520.3364 (20.5) 104, 184, 502 LysoPC (18:2) 2.25↑ 3.97E-4
12 522.3429 (21.88) 104, 184 LysoPC (18:1) 1.55↑ 0.0072
13 546.3537 (22.20) 104, 184 LysoPC (20:3) 2.26↑ 0.0026
14 782.5476 (25.05) 184 PEd(22:2/18:1)/ isomers 1.49↓ 0.0139
15 806.5580 (25.40) 184 PCe(18:2/20:4)/ isomers 1.29↓ 0.014 aPositive ion mode; bpost-hepatectomy versus pre-hepatectomy up-regulation (↑) down-regulation (↓); cLysoPC: lysophosphatidylcholine; dPE: phophati-dylethanolamine; ePC: phosphatidylcholine.
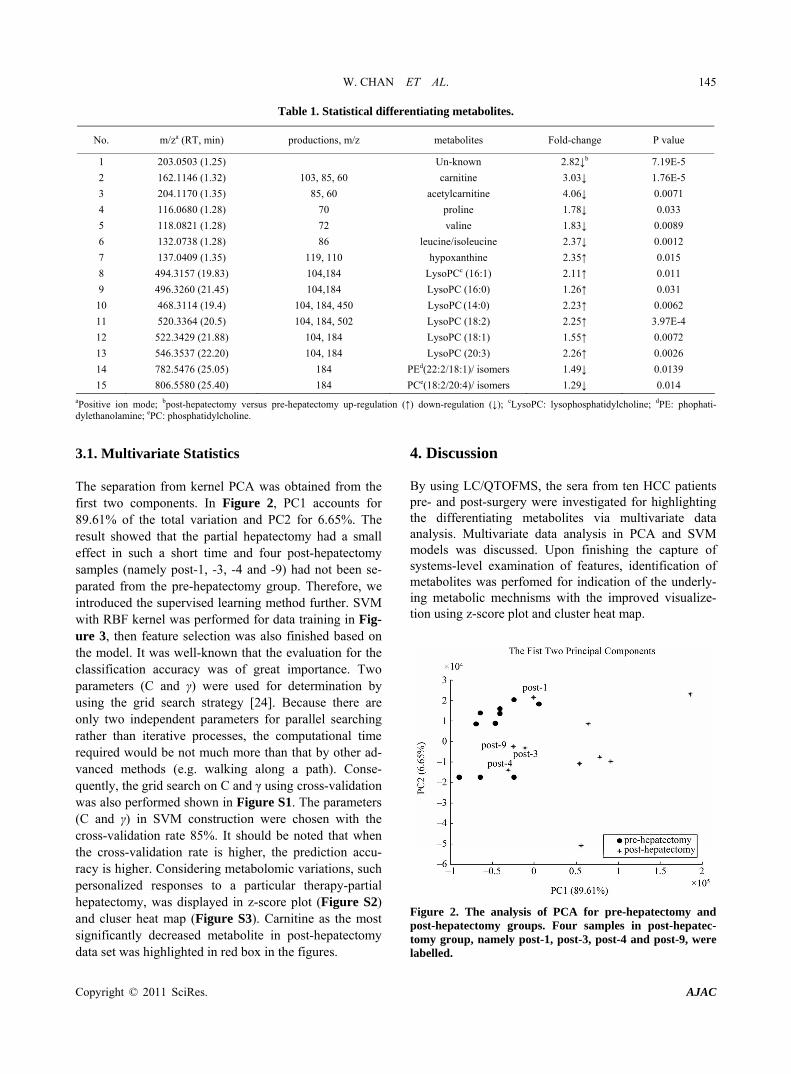
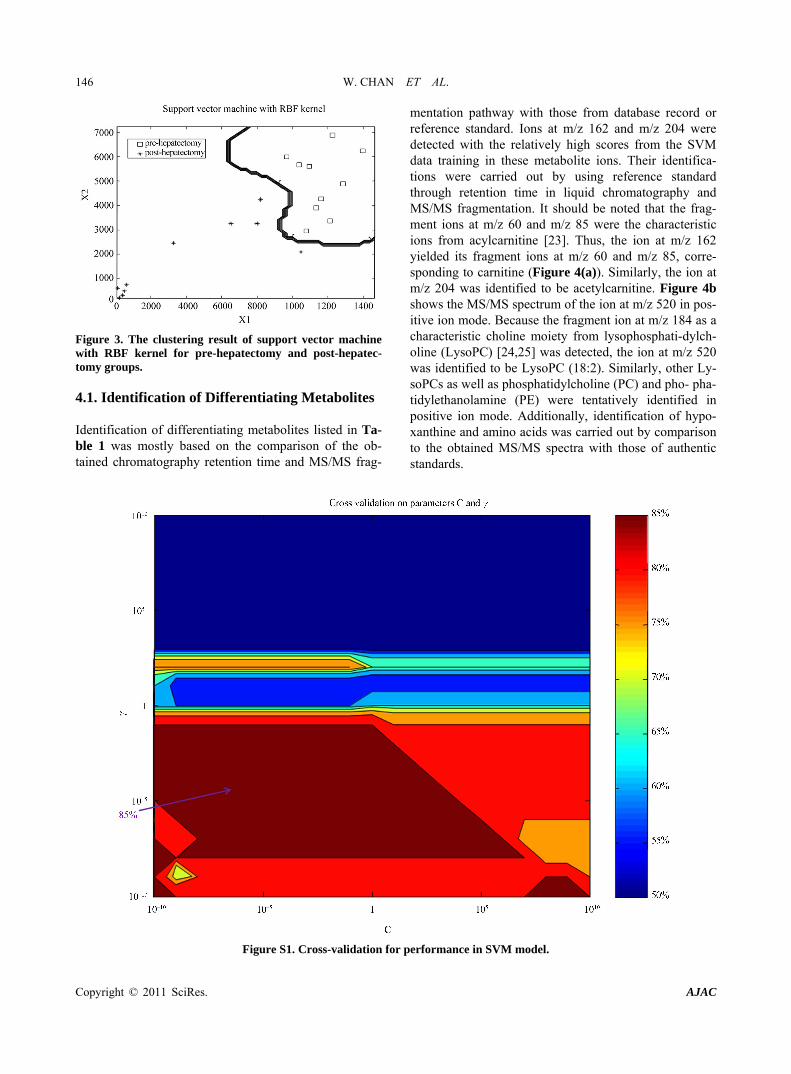
3.1. Multivariate Statistics The separation from kernel PCA was obtained from the first two components. In Figure 2, PC1 accounts for 89.61% of the total variation and PC2 for 6.65%. The result showed that the partial hepatectomy had a small effect in such a short time and four post-hepatectomy samples (namely post-1, -3, -4 and -9) had not been se-parated from the pre-hepatectomy group. Therefore, we introduced the supervised learning method further. SVM with RBF kernel was performed for data training in Fig-ure 3, then feature selection was also finished based on the model. It was well-known that the evaluation for the classification accuracy was of great importance. Two parameters (C and γ) were used for determination by using the grid search strategy [24]. Because there are only two independent parameters for parallel searching rather than iterative processes, the computational time required would be not much more than that by other ad- vanced methods (e.g. walking along a path). Conse- quently, the grid search on C and γ using cross-validation was also performed shown in Figure S1. The parameters (C and γ) in SVM construction were chosen with the cross-validation rate 85%. It should be noted that when the cross-validation rate is higher, the prediction accu- racy is higher. Considering metabolomic variations, such personalized responses to a particular therapy-partial hepatectomy, was displayed in z-score plot (Figure S2) and cluser heat map (Figure S3). Carnitine as the most significantly decreased metabolite in post-hepatectomy data set was highlighted in red box in the figures.
4. Discussion By using LC/QTOFMS, the sera from ten HCC patients pre- and post-surgery were investigated for highlighting the differentiating metabolites via multivariate data analysis. Multivariate data analysis in PCA and SVM models was discussed. Upon finishing the capture of systems-level examination of features, identification of metabolites was perfomed for indication of the underly- ing metabolic mechnisms with the improved visualize- tion using z-score plot and cluster heat map.
Figure 2. The analysis of PCA for pre-hepatectomy and post-hepatectomy groups. Four samples in post-hepatec- tomy group, namely post-1, post-3, post-4 and post-9, were labelled.
Copyright © 2011 SciRes. AJAC
W. CHAN ET AL. 146
Figure 3. The clustering result of support vector machine with RBF kernel for pre-hepatectomy and post-hepatec- tomy groups. 4.1. Identification of Differentiating Metabolites Identification of differentiating metabolites listed in Ta- ble 1 was mostly based on the comparison of the ob- tained chromatography retention time and MS/MS frag-
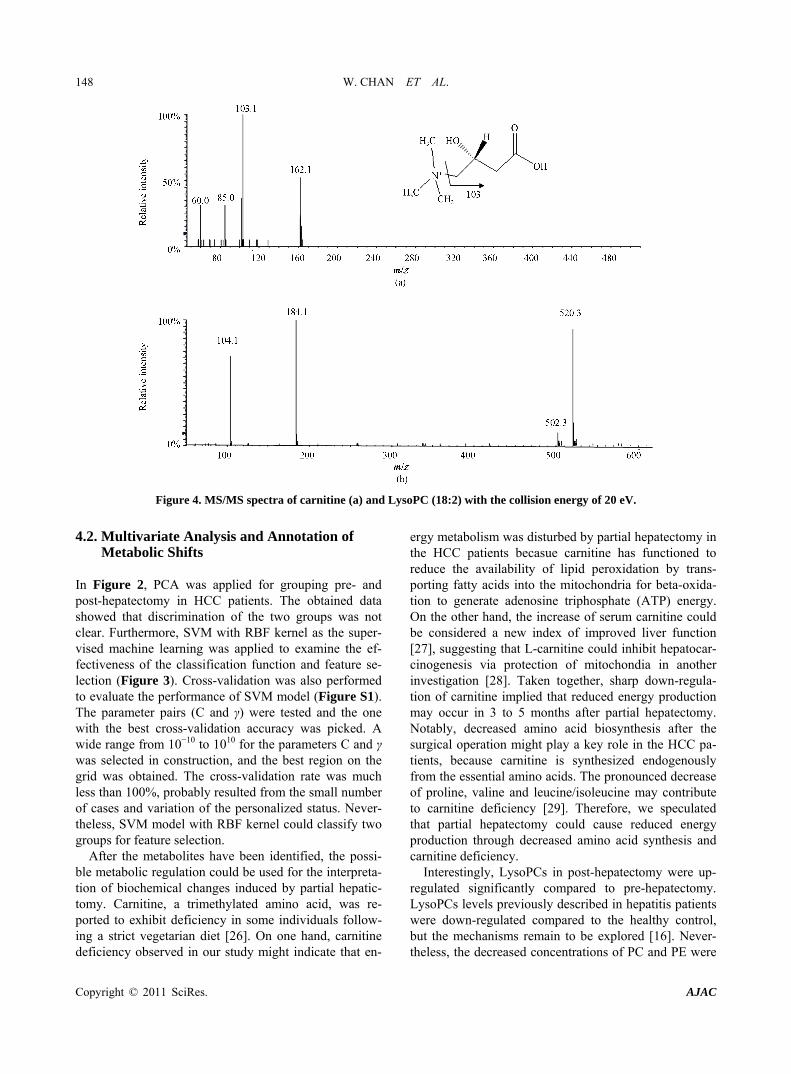
mentation pathway with those from database record or reference standard. Ions at m/z 162 and m/z 204 were detected with the relatively high scores from the SVM data training in these metabolite ions. Their identifica- tions were carried out by using reference standard through retention time in liquid chromatography and MS/MS fragmentation. It should be noted that the frag- ment ions at m/z 60 and m/z 85 were the characteristic ions from acylcarnitine [23]. Thus, the ion at m/z 162 yielded its fragment ions at m/z 60 and m/z 85, corre- sponding to carnitine (Figure 4(a)). Similarly, the ion at m/z 204 was identified to be acetylcarnitine. Figure 4b shows the MS/MS spectrum of the ion at m/z 520 in pos-itive ion mode. Because the fragment ion at m/z 184 as a characteristic choline moiety from lysophosphati-dylch- oline (LysoPC) [24,25] was detected, the ion at m/z 520 was identified to be LysoPC (18:2). Similarly, other Ly-soPCs as well as phosphatidylcholine (PC) and pho- pha-tidylethanolamine (PE) were tentatively identified in positive ion mode. Additionally, identification of hypo- xanthine and amino acids was carried out by comparison to the obtained MS/MS spectra with those of authentic standards.
Figure S1. Cross-validation for performance in SVM model.
Copyright © 2011 SciRes. AJAC
W. CHAN ET AL. 147
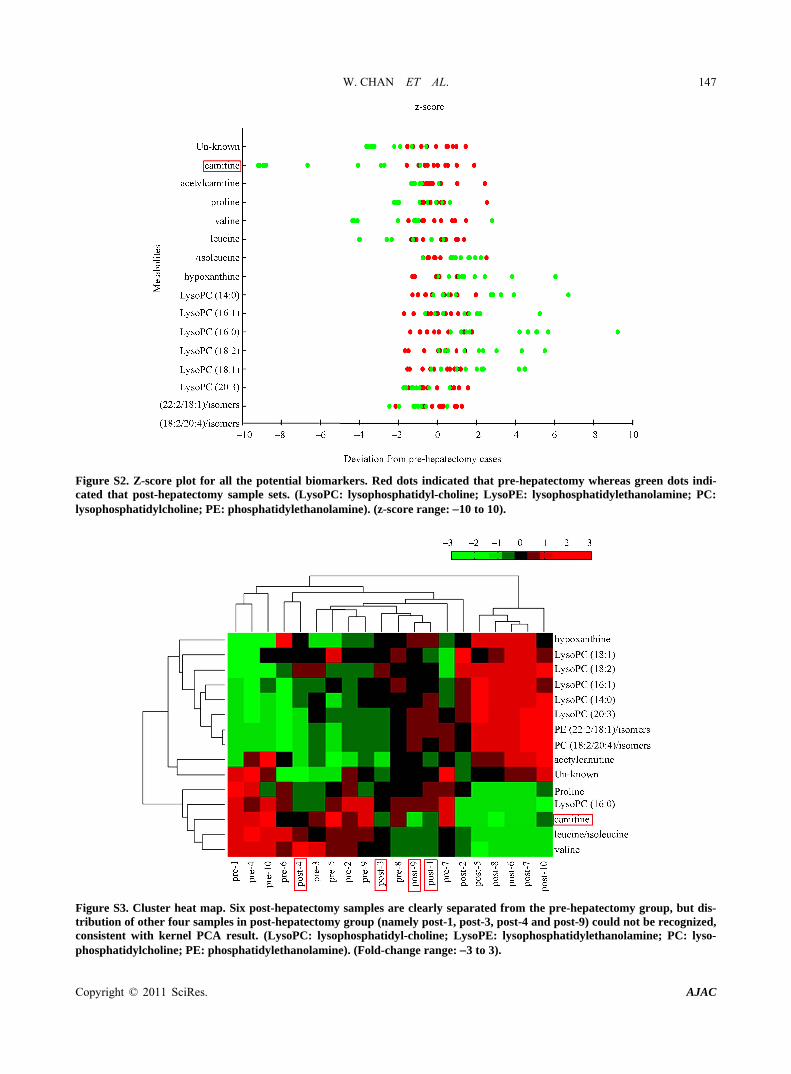
Figure S2. Z-score plot for all the potential biomarkers. Red dots indicated that pre-hepatectomy whereas green dots indi-cated that post-hepatectomy sample sets. (LysoPC: lysophosphatidyl-choline; LysoPE: lysophosphatidylethanolamine; PC: lysophosphatidylcholine; PE: phosphatidylethanolamine). (z-score range: 10 to 10).
Figure S3. Cluster heat map. Six post-hepatectomy samples are clearly separated from the pre-hepatectomy group, but dis-tribution of other four samples in post-hepatectomy group (namely post-1, post-3, post-4 and post-9) could not be recognized, consistent with kernel PCA result. (LysoPC: lysophosphatidyl-choline; LysoPE: lysophosphatidylethanolamine; PC: lyso-phosphatidylcholine; PE: phosphatidylethanolamine). (Fold-change range: 3 to 3).
Copyright © 2011 SciRes. AJAC
W. CHAN ET AL.
Copyright © 2011 SciRes. AJAC
148
Figure 4. MS/MS spectra of carnitine (a) and LysoPC (18:2) with the collision energy of 20 eV.
4.2. Multivariate Analysis and Annotation of
Metabolic Shifts In Figure 2, PCA was applied for grouping pre- and post-hepatectomy in HCC patients. The obtained data showed that discrimination of the two groups was not clear. Furthermore, SVM with RBF kernel as the super- vised machine learning was applied to examine the ef- fectiveness of the classification function and feature se- lection (Figure 3). Cross-validation was also performed to evaluate the performance of SVM model (Figure S1). The parameter pairs (C and γ) were tested and the one with the best cross-validation accuracy was picked. A wide range from 10−10 to 1010 for the parameters C and γ was selected in construction, and the best region on the grid was obtained. The cross-validation rate was much less than 100%, probably resulted from the small number of cases and variation of the personalized status. Never- theless, SVM model with RBF kernel could classify two groups for feature selection.
After the metabolites have been identified, the possi- ble metabolic regulation could be used for the interpreta- tion of biochemical changes induced by partial hepatic- tomy. Carnitine, a trimethylated amino acid, was re- ported to exhibit deficiency in some individuals follow- ing a strict vegetarian diet [26]. On one hand, carnitine deficiency observed in our study might indicate that en-
ergy metabolism was disturbed by partial hepatectomy in the HCC patients becasue carnitine has functioned to reduce the availability of lipid peroxidation by trans- porting fatty acids into the mitochondria for beta-oxida- tion to generate adenosine triphosphate (ATP) energy. On the other hand, the increase of serum carnitine could be considered a new index of improved liver function [27], suggesting that L-carnitine could inhibit hepatocar- cinogenesis via protection of mitochondia in another investigation [28]. Taken together, sharp down-regula- tion of carnitine implied that reduced energy production may occur in 3 to 5 months after partial hepatectomy. Notably, decreased amino acid biosynthesis after the surgical operation might play a key role in the HCC pa- tients, because carnitine is synthesized endogenously from the essential amino acids. The pronounced decrease of proline, valine and leucine/isoleucine may contribute to carnitine deficiency [29]. Therefore, we speculated that partial hepatectomy could cause reduced energy production through decreased amino acid synthesis and carnitine deficiency.
Interestingly, LysoPCs in post-hepatectomy were up- regulated significantly compared to pre-hepatectomy. LysoPCs levels previously described in hepatitis patients were down-regulated compared to the healthy control, but the mechanisms remain to be explored [16]. Never- theless, the decreased concentrations of PC and PE were
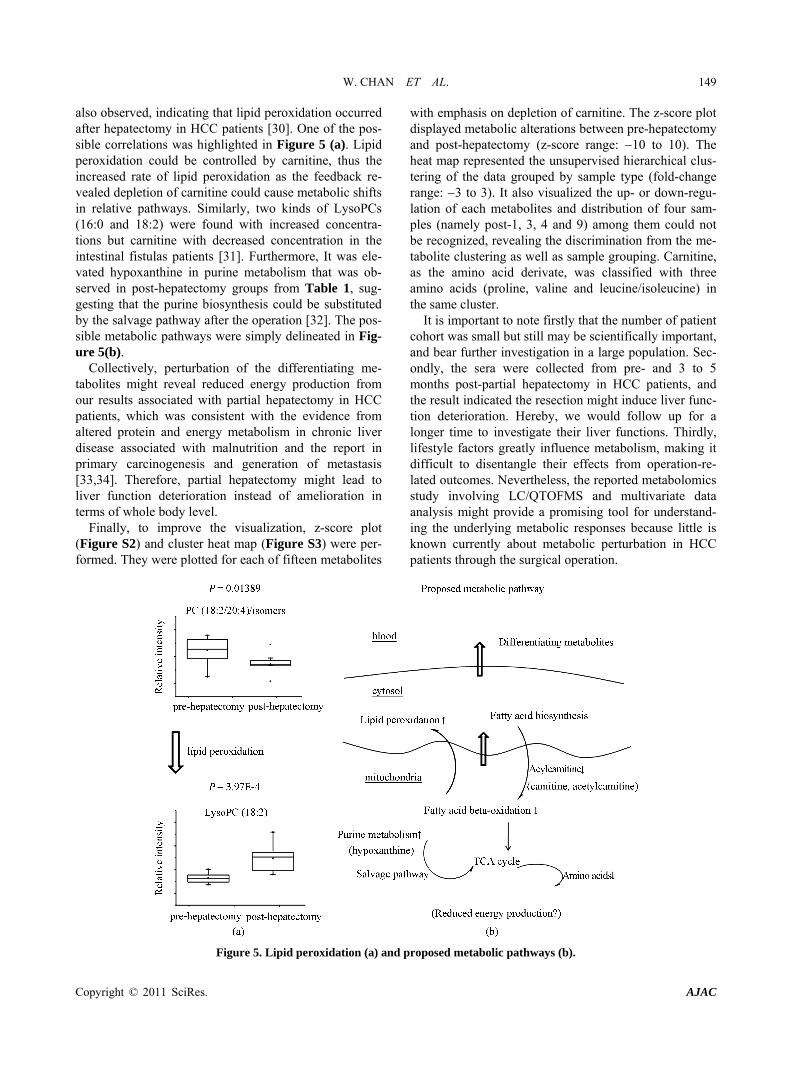
W. CHAN ET AL. 149 also observed, indicating that lipid peroxidation occurred after hepatectomy in HCC patients [30]. One of the pos- sible correlations was highlighted in Figure 5 (a). Lipid peroxidation could be controlled by carnitine, thus the increased rate of lipid peroxidation as the feedback re- vealed depletion of carnitine could cause metabolic shifts in relative pathways. Similarly, two kinds of LysoPCs (16:0 and 18:2) were found with increased concentra- tions but carnitine with decreased concentration in the intestinal fistulas patients [31]. Furthermore, It was ele- vated hypoxanthine in purine metabolism that was ob- served in post-hepatectomy groups from Table 1, sug- gesting that the purine biosynthesis could be substituted by the salvage pathway after the operation [32]. The pos- sible metabolic pathways were simply delineated in Fig- ure 5(b).
Collectively, perturbation of the differentiating me- tabolites might reveal reduced energy production from our results associated with partial hepatectomy in HCC patients, which was consistent with the evidence from altered protein and energy metabolism in chronic liver disease associated with malnutrition and the report in primary carcinogenesis and generation of metastasis [33,34]. Therefore, partial hepatectomy might lead to liver function deterioration instead of amelioration in terms of whole body level.
Finally, to improve the visualization, z-score plot (Figure S2) and cluster heat map (Figure S3) were per- formed. They were plotted for each of fifteen metabolites
with emphasis on depletion of carnitine. The z-score plot displayed metabolic alterations between pre-hepatectomy and post-hepatectomy (z-score range: 10 to 10). The heat map represented the unsupervised hierarchical clus- tering of the data grouped by sample type (fold-change range: 3 to 3). It also visualized the up- or down-regu- lation of each metabolites and distribution of four sam-ples (namely post-1, 3, 4 and 9) among them could not be recognized, revealing the discrimination from the me- tabolite clustering as well as sample grouping. Carnitine, as the amino acid derivate, was classified with three amino acids (proline, valine and leucine/isoleucine) in the same cluster.
It is important to note firstly that the number of patient cohort was small but still may be scientifically important, and bear further investigation in a large population. Sec- ondly, the sera were collected from pre- and 3 to 5 months post-partial hepatectomy in HCC patients, and the result indicated the resection might induce liver func-tion deterioration. Hereby, we would follow up for a longer time to investigate their liver functions. Thirdly, lifestyle factors greatly influence metabolism, making it difficult to disentangle their effects from operation-re- lated outcomes. Nevertheless, the reported metabolomics study involving LC/QTOFMS and multivariate data analysis might provide a promising tool for understand- ing the underlying metabolic responses because little is known currently about metabolic perturbation in HCC patients through the surgical operation.
Figure 5. Lipid peroxidation (a) and proposed metabolic pathways (b).
Copyright © 2011 SciRes. AJAC
W. CHAN ET AL.
Copyright © 2011 SciRes. AJAC
150
5. Conclusions Among fifteen statistically significant metabolites, amino acids and acetylcarnitine decreased significantly and down-regulation of PC and PE was accompanied with pronounced increase of LysoPCs. Carnitine, a necessary factor in the utilization of long chain fatty acids to pro- duce energy, was down regulated sharply by partial he-patectomy. The elevated hypoxanthine might play a vital role in salvage pathway for reduced energy production. Metabolomic approach with highly efficient classifica-tion was perfomed to distinguish the two groups of data sets and delineate the effects of partial hepatectomy in metabolic shifts, reflecting that hepatic resection might induce liver function deterioration in 3 to 5 months. 6. Acknowledgements The authors would like to thank Mr. David T. W. Chik and Ms. Silvia T. Mo for their technical assistance in LC/QTOFMS analysis, and Dr. Zhu Yang for his help in performing SVM model and z-score plot. 7. References [1] R. Kaddurah-Daouk, B. S. Kristal and R. M. Weinshil-
boum, “Metabolomics: A Global Biochemical Approach to Drug Response and Disease,” Annual Review of Ph- armacology and Toxicology, Vol. 48, 2008, pp. 653-683. doi:10.1146/annurev.pharmtox.48.113006.094715
[2] L. M. Raamsdonk, B. Teusink, D. Broadhurst, N. Zhang, A. Hayes, M. C. Walsh, J. A. Berden, K. M. Brindle, D. B. Kell, J. J. Rowland, H. V. Westerhoff, K. Van Dam and S. G. Oliver, “A Functional Genomics Strategy That Uses Metabolome Data to Reveal the Phenotype of Silent mutations,” Nature Biotechnology, Vol. 19, No. 1, 2001, pp. 45-50.
[3] J. R. Idle and F. J. Gonzalez, “Metabolomics,” Cell Me-tabolism, Vol. 6, No. 5, 2007, pp. 348-351. doi:10.1016/j.cmet.2007.10.005
[4] J. K. Nicholson, J. C. Lindon and E. Holmes, “‘Me-tabonomics’: Understanding The Metabolic Responses of Living Systems to Pathophysiological Stimuli via Multi-variate Statistical Analysis of Biological NMR Spectro-scopic Data,” Xenobiotica, Vol. 29, No. 11, 1999, pp. 1181-1189. doi:10.1080/004982599238047
[5] J. C. Lindon, E. Holmes, M. E. Bollard, E. G. Stanley and J. K. Nicholson, “Metabonomics Technologies and Their Applications in Physiological Monitoring, Drug Safety Assessment and Disease Diagnosis,” Biomarkers, Vol. 9, No. 1, 2004, pp. 1-31. doi:10.1080/13547500410001668379
[6] J. L. Griffin and M. E. Bollard, “Metabonomics: Its Po-tential as a Tool in Toxicology for Safety Assessment and Data Integration,” Current Drug Metabolism, Vol. 5, No. 5, 2004, pp. 389-398.doi:10.2174/1389200043335432
[7] D. G. Robertson, “Metabonomics in Toxicology: A Re-view,” Toxicological Sciences, Vol. 85, No. 2, 2005, pp. 809-822. doi:10.1093/toxsci/kfi102
[8] D. B. Kell, “Metabolomics and Systems Biology: Making Sense of the Soup,” Current Opinion in Microbiology, Vol. 7, No. 3, 2004, pp. 296-307. doi:10.1016/j.mib.2004.04.012
[9] K. Dettmer, P. A. Aronov and B. D. Hammock, “Mass Spectrometry-Based Metabolomics,” Mass Spectrometry Reviews, Vol. 26, No. 1, 2007, pp. 51-78. doi:10.1002/mas.20108
[10] D. J. Crockford, J. C. Lindon, O. Cloarec, R. S. Plumb, S. J. Bruce, S. Zirah, P. Rainville, C. L. Stumpf, K. Johnson, E. Holmes and J. K. Nicholson, “Statistical Search Space Reduction and Two-Dimensional Data Display Ap-proaches for UPLC-MS in Biomarker Discovery and Pathway Analysis,” Analytial Chemistry, Vol. 78, No. 13, 2006, pp. 4398-4408. doi:10.1021/ac060168o
[11] A. Frickenschmidt, H. Frohlich, D. Bullinger, A. Zell, S. Laufer, C. H. Gleiter, H. Liebich and B. Kammerer, “Metabonomics in Cancer Diagnosis: Mass Spectrome-try-Based Profiling Of Urinary Nucleosides From Breast Cancer Patients,” Biomarkers, Vol. 13, No. 4, 2008, pp. 435-449. doi:10.1080/13547500802012858
[12] R. Xue, Z. Lin, C. Deng, L. Dong, T. Liu, J. Wang and X. Shen, “A Serum Metabolomic Investigation on Hepato-cellular Carcinoma Patients by Chemical Derivatization Followed by Gas Chromatography/Mass Spectrometry,” Rapid Communications in Mass Spectrometry, Vol. 22, No. 19, 2008, pp. 3061-3068. doi:10.1002/rcm.3708
[13] S. Mahadevan, S. L. Shah, T. J. Marrie and C. M. Slup-sky, “Analysis of Metabolomic Data Using Support Vec-tor Machines,” Analytical Chemistry, Vol. 80, No. 19, 2008, pp. 7562-7570. doi:10.1021/ac800954c
[14] J. Yang, G. Xu, Y. Zheng, H. Kong, T. Pang, S. Lv and Q. Yang, “Diagnosis of Liver Cancer Using HPLC-Based Metabonomics Avoiding False-Positive Result from He-patitis and Hepatocirrhosis Diseases,” Journal of Chro-matography B: Analytical Technologies in Biomedical and Life Sciences, Vol. 813, No. 1-2, 2004, pp. 59-65. doi:10.1016/j.jchromb.2004.09.032
[15] J. Yang, X. Zhao, X. Liu, C. Wang, P. Gao, J. Wang, L. Li, J. Gu, S. Yang and G. Xu, “High Performance Liquid Chromatography-Mass Spectrometry for Metabonomics: Potential Biomarkers for Acute Deterioration of Liver Function in Chronic Hepatitis B,” Journal of Proteome Research, Vol. 5, No. 3, 2006, pp. 554-561. doi:10.1021/pr050364w
[16] K. Yu, G. Sheng, J. Sheng, Y. Chen, W. Xu, X. Liu, H. Cao, H. Qu, Y. Cheng and L. Li, “A Metabonomic Inves-tigation on the Biochemical Perturbation in Liver Failure Patients Caused by Hepatitis B Virus,” Journal of Pro-teome Research, Vol. 6, No. 7, 2007, pp. 2413-2419. doi:10.1021/pr060591d
[17] Y. Yang, C. Li, X. Nie, X. Feng, W. Chen, Y. Yue, H. Tang and F. Deng, “Metabonomic Studies of Human Hepatocellular Carcinoma Using High-Resolution Magic- Angle Spinning 1 h Nmr Spectroscopy in Conjunction
W. CHAN ET AL. 151
with Multivariate Data Analysis,” Journal of Proteome Research, Vol. 6, No. 7, 2007, pp. 2605-2614. doi:10.1021/pr070063h
[18] W. Chan, K. C. Lee, N. Liu, R. N. Wong, H. Liu and Z. Cai, “Liquid Chromatography/Mass Spectrometry for Metabonomics Investigation of the Biochemical Effects Induced by Aristolochic Acid in Rats: The Use of Infor-mation-Dependent Acquisition for Biomarker Identifica-tion,” Rapid Communications in Mass Spectrometry, Vol. 22, No. 6, 2008, pp. 873-880. doi:10.1002/rcm.3438
[19] D. S. Wishart, D. Tzur, C. Knox, R. Eisner, A. C. Guo, N. Young, D. Cheng, K. Jewell, D. Arndt, S. Sawhney, C. Fung, L. Nikolai, M. Lewis, M. A. Coutouly, I. Forsythe, P. Tang, S. Shrivastava, K. Jeroncic, P. Stothard, G. Amegbey, D. Block, D. D. Hau, J. Wagner, J. Miniaci, M. Clements, M. Gebremedhin, N. Guo, Y. Zhang, G. E. Duggan, G. D. Macinnis, A. M. Weljie, R. Dowlatabadi, F. Bamforth, D. Clive, R. Greiner, L. Li, T. Marrie, B. D. Sykes, H. J. Vogel and L. Querengesser, “Hmdb: The Human Metabolome Database,” Nucleic Acids Research, Vol. 35, No. S1, 2007, pp. D521-D526. doi:10.1093/nar/gkl923
[20] C. A. Smith, G. O’Maille, E. J. Want, C. Qin, S. A. Trauger, T. R. Brandon, D. E. Custodio, R. Abagyan and G. Siuzdak, “Metlin: A Metabolite Mass Spectral Data-base,” Therapeutic Drug Monitoring, Vol. 27, No. 6, 2005, pp. 747-751. doi:10.1097/01.ftd.0000179845.53213.39
[21] S. Okuda, T. Yamada, M. Hamajima, M. Itoh, T. Kata-yama, P. Bork, S. Goto and M. Kanehisa, “Kegg Atlas Mapping for Global Analysis of Metabolic Pathways,” Nucleic Acids Research, Vol. 36, No. S2, 2008, pp. W423-W426.
[22] W. R. Wikoff, G. Pendyala, G. Siuzdak and H. S. Fox, “Metabolomic Analysis of the Cerebrospinal Fluid Re-veals Changes in Phospholipase Expression in the CNS of SIV-Infected Macaques,” Journal of Clinical Investi-gation, Vol. 118, No. 7, 2008, pp. 2661-2669. doi:10.1172/JCI34138
[23] X. Han and R. W. Gross, “Shotgun Lipidomics: Electros-pray Ionization Mass Spectrometric Analysis And Quan-titation Of Cellular Lipidomes Directly From Crude Ex-tracts Of Biological Samples,” Mass Spectrometry Re-views, Vol. 24, No. 3, 2005, pp. 367-412. doi:10.1002/mas.20023
[24] C. Stella, B. Beckwith-Hall, O. Cloarec, E. Holmes, J. C. Lindon, J. Powell, F. Van Der Ouderaa, S. Bingham, A. J. Cross and J. K. Nicholson, “Susceptibility of Human
Metabolic Phenotypes to Dietary Modulation,” Journal of Proteome Research, Vol. 5, No. 10, 2006, pp. 2780-2788. doi:10.1021/pr060265y
[25] M. Malaguarnera, S. Restuccia, I. D. Fazio, A. M. Zoc-colo, L. Ferlito and P. Bentivegna, “Serum Carnitine Le-vels in Chronic Hepatitis C Patients before and after Lymphoblastoid Interferon-Alpha Treatment,” BioDrugs, Vol. 12, No.1, 1999, pp. 65-69. doi:10.2165/00063030-199912010-00007
[26] B. Chang, M. Nishikawa, S. Nishiguchi and M. Inoue, “L-Carnitine Inhibits Hepatocarcinogenesis via Protec-tion of Mitochondria,” International Journal of Cancer, Vol. 113, No. 5, 2005, pp. 719-729. doi:10.1002/ijc.20636
[27] P. E. Lheureux and P. Hantson, “Carnitine in the Treat-ment of Valproic Acid-Induced Toxicity,” Clinical Toxi-cology (Phila), Vol. 47, No. 2, 2009, pp. 101-111.
[28] A. Bauer, A. Schumann, M. Gilbert, C. Wilhelm, J. G. Hengstler, J. Schiller and B. Fuchs, “Evaluation of Car-bon Tetrachloride-Induced Stress on Rat Hepatocytes by 31 p Nmr And Maldi-T of Mass Spectrometry: Lyso-phosphatidylcholine Generation From Unsaturated Phos-phatidylcholines,” Chemistry And Physics of Lipids, Vol. 159, No. 1, 2009, pp. 21-29.
[29] P. Yin, X. Zhao, Q. Li, J. Wang, J. Li and G. Xu, “Me-tabonomics Study of Intestinal Fistulas Based on Ul-traperformance Liquid Chromatography Coupled with Q-Tof Mass Spectrometry (UPLC/Q-TOF MS),” Journal of Proteome Research, Vol. 5, No. 9, 2006, pp. 2135-2143. doi:10.1021/pr060256p
[30] E. S. Ong, L. Zou, S. Li, P. Y. Cheah, K. W. Eu and C. N. Ong, “Metabolic Profiling in Colorectal Cancer Reveals Signature Metabolic Shifts During Tumorigenesis,” Mo-lecular and Cellular Proteomics, Article in press, 2010, Article ID 20147338.
[31] V. W. Lam and R. T. Poon, “Role of Branched-Chain Amino Acids in Management of Cirrhosis and Hepato-cellular Carcinoma,” Hepatology Research, Vol. 38, No. S1, 2008, pp. S107-S115. doi:10.1111/j.1872-034X.2008.00435.x
[32] L. Vali, O. Hahn, P. Kupcsulik, A. Drahos, E. Sarvary, K. Szentmihalyi, Z. Pallai, T. Kurucz, P. Sipos and A. Bla-zovics, “Oxidative Stress with Altered Element Content and Decreased ATP Level of Erythrocytes in Hepatocel-lular Carcinoma and Colorectal Liver Metastases,” Eu-ropean Journal of Gastroenterology and Hepatology, Vol. 20, No. 5, 2008, pp. 393-398. doi:10.1097/MEG.0b013e3282f495c7
Copyright © 2011 SciRes. AJAC


![Metabolomics investigation of molecular responses of ...€¦ · small molecules or metabolites) ... immunology and disease [16-18], environmental stress [18-20], eco-toxicology [21,](https://img.pdfslide.us/doc/110x75/60f999bcce908624e703d724/metabolomics-investigation-of-molecular-responses-of-small-molecules-or-metabolites.jpg)


![Metabolomics Basics[1]](https://img.pdfslide.us/doc/110x75/553de2815503466f378b4864/metabolomics-basics1.jpg)