Embed Size (px)
Citation preview

.
To perform basic metabolomics data analysis using the Thermo SIEVE™ application, follow this tutorial. It provides specific steps and values so that you can create and process an experiment.
• About the Experiment
• Creating the Experiment
• Processing Data
• Viewing Data Results
• Exporting Experiment Results
• Trademarks
The experiment compares samples between groups of fed rats and fasting rats.
Objectives• Find the exact monoisotopic molecular weight of components
that are significantly different between the fed and fasting groups.
• Determine putative IDs by searching the KEGG™ database for an exact mass/formula using the ChemSpider™ application.
Metabolomics Sample FilesThe data was collected as an ESI Positive Ion full scan on an LC-MS Q Exactive™ mass spectrometer at 70 K resolution.
Metabolomics example files:• Fed control rat serum extracts (three files)• Fasted 16 hr rat serum extracts (three files)• Water blanks (two files)
To download the experiment files 1. After installing the SIEVE application, go to the Thermo
Scientific Omics Software Portal.2. Create an account or log in to an existing account.3. Click Example Data Files.4. Copy the raw data files to a convenient location.
Use these procedures to create a new experiment.
• Defining the Experiment
• Adding and Defining Files
• Setting Frame Parameter Values
• Choosing a Scan Filter
• Setting Component Extraction Parameters
• Defining a Search Type
Defining the Experiment
To create the experiment1. To open the SIEVE application, double-click the SIEVE v2.2
x64 icon ( ) or choose All Programs > Thermo SIEVE > Thermoversion where version is the current version of the application.
2. From the menu bar, choose File > Create New Experiment to open the SIEVE Experiment Definition Wizard.
3. Click Next.
4. To set up the experiment, do the following:a. Select the Small Molecule option.b. Because your experiment has high resolution data, select the
Component Extraction algorithm. c. Name your experiment file.d. (Optional) Add an experiment description.
5. Click Next.
SIEVE Tutorial Guide: Metabolomics
About the Experiment
Creating the Experiment
© 2014 Thermo Fisher Scientific Inc.All rights reserved.
Revision A XCALI-97694

Adding and Defining Files
To add and define experiment files1. Keep the wizard open and open the folder where you saved your
experiment files.2. Drag the raw data files to the Raw File Selection page of the
wizard.
3. To group similarly-named files together, click the File Name column header to sort them.
4. (Optional) To scan the raw data files for details, click Scan Raw Files.
The application checks the files and provides a message. 5. Click Next.6. In the Groups box, type a name for the first group.
If you have multiple groups, separate group names with a space. Type a group name that is in the file name so that the application can automatically identify the group and set a group color.
In this experiment, type fast fed blank to define the groups.
Type the word blank to identify a blank group and perform background subtraction. You must have identified blank files to do background subtraction. If your file name does not contain the word blank, you can right-click the groups field for the blank file and choose blank from the list.
7. In the Ratio Group list, select Fast as the control.
8. To select Fed_Plasma_Pos_03.raw as the alignment reference file, select the Ref check box in the Fed_Plasma_Pos_03 row.
Do not choose a blank file for reference or control. For best results, the reference file should be the most complex file, as close as possible to 100 percent of all components in all samples. By creating a pooled sample, your results are more satisfactory.
9. Click Next.
Setting Frame Parameter Values
To define frame parameter values
Set parameter values on the Frame Parameter Adjustment page.
For this example, use the default retention time (RT), m/z width, and mass range. Click Next.
2

3
Choosing a Scan Filter
To select a scan filter1. For the scan filter, select the FTMS + p ESI Full MS check box.
All small molecule experiment samples must have at least one scan filter in common. The application selects the common filter and highlights it in bold. If you try to process multiple files that do not have a common scan filter, the application displays a warning with a list of all files that do not have the common filter.
Select only positive or negative files for processing. If you try to process files that contain both positive and negative polarity, the application displays a warning not to continue. If you continue after the warning, the application stops your experiment without preserving your setup.
2. Click Next.
Setting Component Extraction Parameters
To define component extraction parameters1. For this experiment, use the default settings.
Because each data set is different, for future experiments, review your data in the Qual Browser application before assigning the settings. You can also start with the defaults and then optimize them. The table below provides a recommended range for the Intensity Threshold (BPMinimumCount) parameter by instrument. If you set the instrument to a higher intensity, acquisition is faster, but you might miss some peaks with low intensity. If you set it lower, processing takes more time, but the results are more accurate.
2. Click Next.
Defining a Search Type
To define your search type1. Select the type of search to perform. For this experiment, select
the ChemSpider check box.
The application displays KEGG as a database choice. For this experiment, leave the database choice as it is.
2. Click Next. 3. Click Finish.
The application opens a browse box, so you can save the experiment. Type alphanumeric characters without spaces to name the file.
4. Click Save.
The SIEVE application performs an optional quality control step during preprocessing. It assigns a new retention time for each scan to make the chromatograms from different files appear to overlap. For UPLC data, this step does not make much of a change. However, if your scan has a high chemical background, this step can complicate the results. If the uncorrected data scan looks better than the corrected one, do not attempt to align the data.
Instrument typeRecommended range for the intensity threshold
Q Exactive, Q Exactive Plus, Q Exactive HF, Orbitrap Fusion
1000000–5000000
Exactive, Exactive Plus, Orbitrap Elite, Orbitrap Velos Pro
100000–500000
Orbitrap XL, Orbitrap Velos 25000–100000
Processing Data
Correcting Retention Time
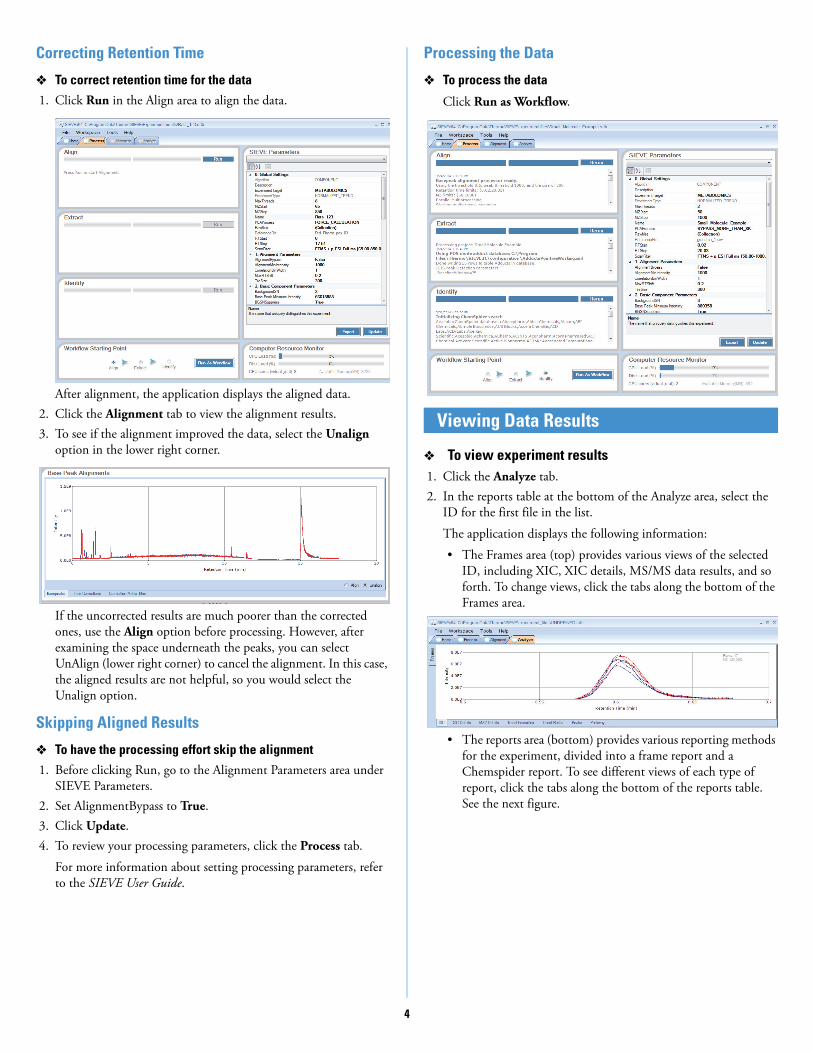
To correct retention time for the data1. Click Run in the Align area to align the data.
After alignment, the application displays the aligned data. 2. Click the Alignment tab to view the alignment results.3. To see if the alignment improved the data, select the Unalign
option in the lower right corner.
If the uncorrected results are much poorer than the corrected ones, use the Align option before processing. However, after examining the space underneath the peaks, you can select UnAlign (lower right corner) to cancel the alignment. In this case, the aligned results are not helpful, so you would select the Unalign option.
Skipping Aligned Results
To have the processing effort skip the alignment1. Before clicking Run, go to the Alignment Parameters area under
SIEVE Parameters.2. Set AlignmentBypass to True.3. Click Update.4. To review your processing parameters, click the Process tab.
For more information about setting processing parameters, refer to the SIEVE User Guide.
Processing the Data
To process the data
Click Run as Workflow.
To view experiment results1. Click the Analyze tab.2. In the reports table at the bottom of the Analyze area, select the
ID for the first file in the list.
The application displays the following information:
• The Frames area (top) provides various views of the selected ID, including XIC, XIC details, MS/MS data results, and so forth. To change views, click the tabs along the bottom of the Frames area.
• The reports area (bottom) provides various reporting methods for the experiment, divided into a frame report and a Chemspider report. To see different views of each type of report, click the tabs along the bottom of the reports table. See the next figure.
Viewing Data Results
4

You can also right-click the reports table to choose columns to add to the table, including integrated intensity and average intensity.
To add to or remove columns from the reports table1. Right-click a column header and choose Field Chooser.
The application opens the Field Dialog Box.2. To display a column, select the check box next to the field name.3. To hide a column, clear the box next to the field name.
You can export the results from the SIEVE application in different ways. You can copy results, export results to a Microsoft™ Excel™ spreadsheet, or use the SIEVE export tab.
To export the Frames table results to a file1. Click the Analyze tab to open the Analyze view.2. If it is not visible, click Frame Report to display the frame report.3. Select the report and press CTRL+A to select the data and then
CTRL+C to copy it.4. Open the application that you are copying to and press CTRL+V
to paste the data into a new or existing document.
You can also display and export your data by clicking Frame Report or ChemSpider. Then, click the Export tab, make your selections, and click Export.
SIEVE and Q Exactive are trademarks of Thermo Fisher Scientific Inc. in the United States.
ChemSpider is a registered trademark of ChemZoo Inc. in the United States and possibly other countries. KEGG is a registered trademark of Minoru Kanehisa of Japan (an individual) in the United States. Microsoft and Excel are registered trademarks of Microsoft Corporation in the United States and other countries.
Exporting Experiment Results
Trademarks
5