Embed Size (px)
Citation preview
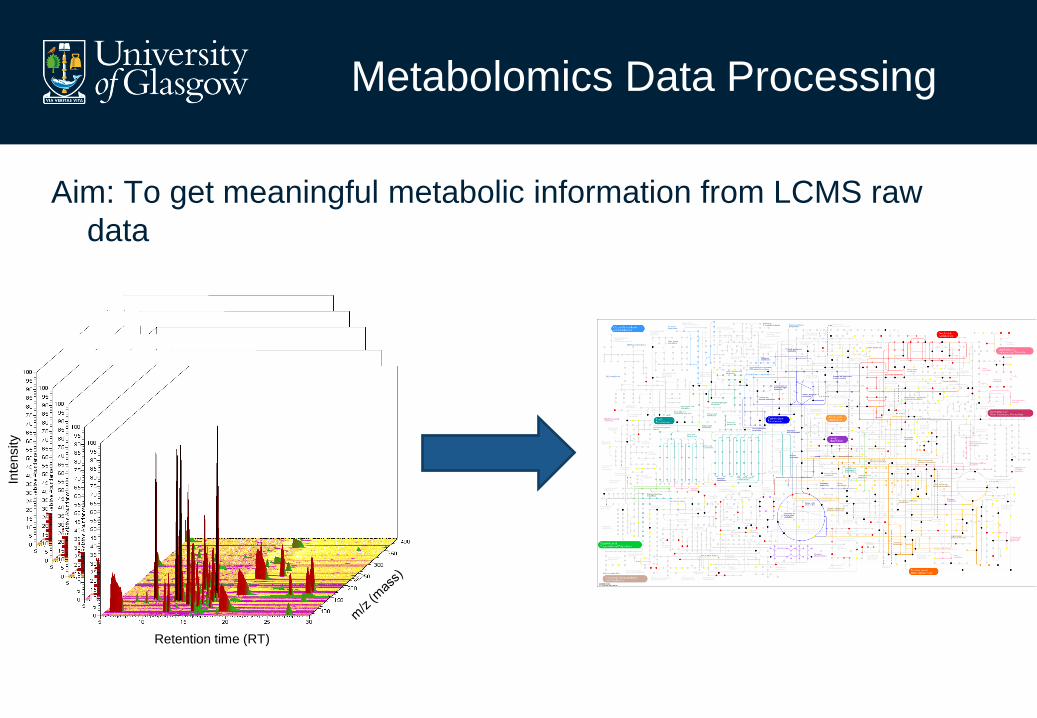
Metabolomics Data Processing
Aim: To get meaningful metabolic information from LCMS raw
data
Retention time (RT)
Inte
nsity
Metabolomics Data Processing
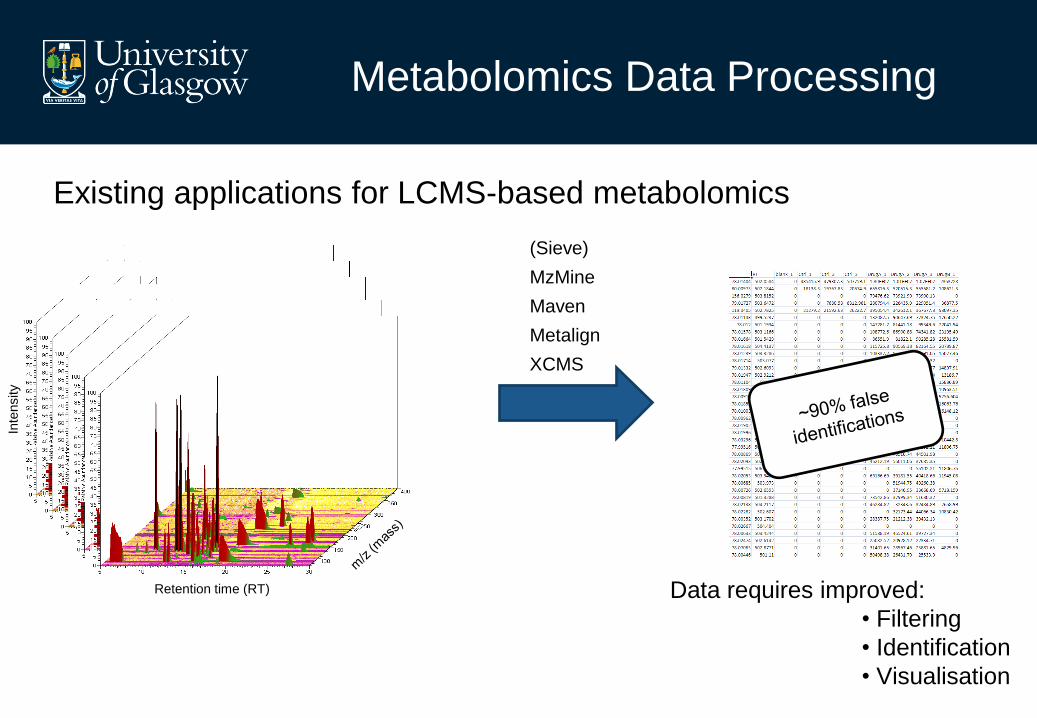
Existing applications for LCMS-based metabolomics
Retention time (RT)
Inte
nsity
Data requires improved:
• Filtering
• Identification
• Visualisation
(Sieve)
MzMine
Maven
Metalign
XCMS
IDEOM Pipeline
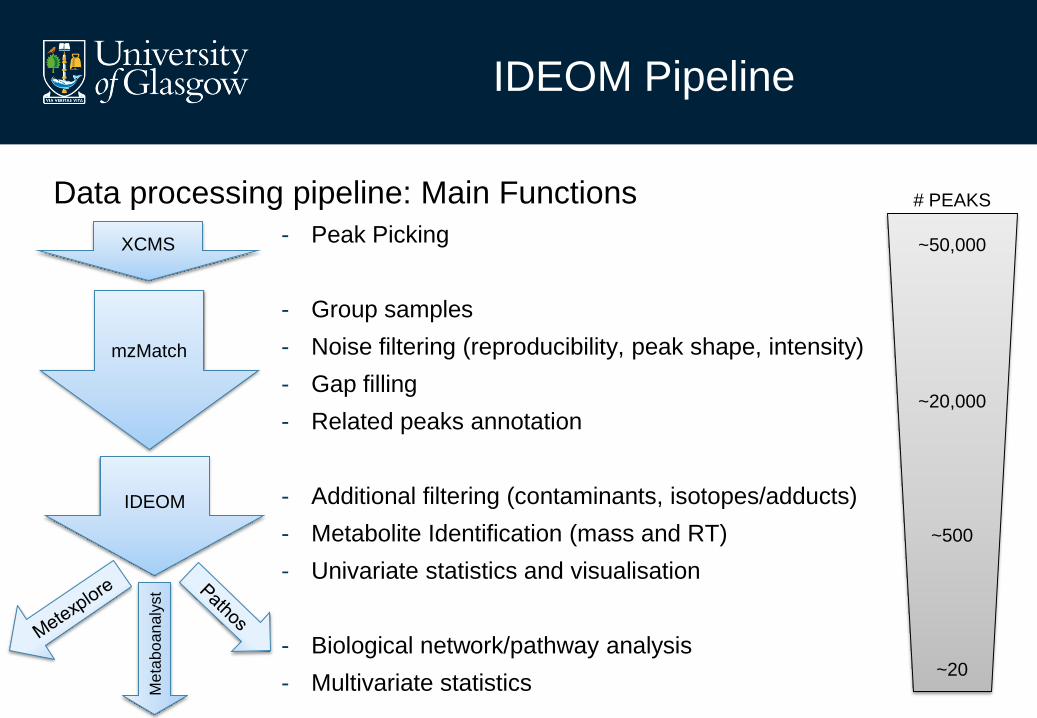
Data processing pipeline: Main Functions
- Peak Picking
- Group samples
- Noise filtering (reproducibility, peak shape, intensity)
- Gap filling
- Related peaks annotation
- Additional filtering (contaminants, isotopes/adducts)
- Metabolite Identification (mass and RT)
- Univariate statistics and visualisation
- Biological network/pathway analysis
- Multivariate statistics
XCMS
mzMatch
IDEOM
Me
tab
oan
aly
st
# PEAKS
~50,000
~20,000
~500
~20
IDEOM Pipeline
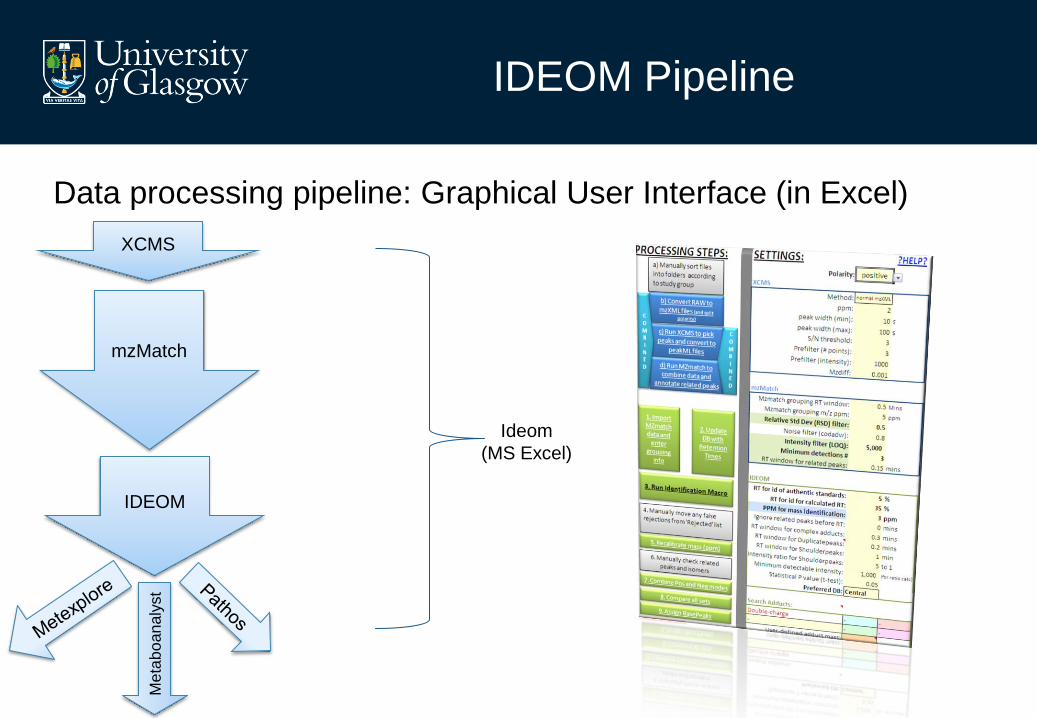
Data processing pipeline: Graphical User Interface (in Excel)
XCMS
mzMatch
IDEOM
Me
tab
oan
aly
st
Ideom
(MS Excel)
Definitions
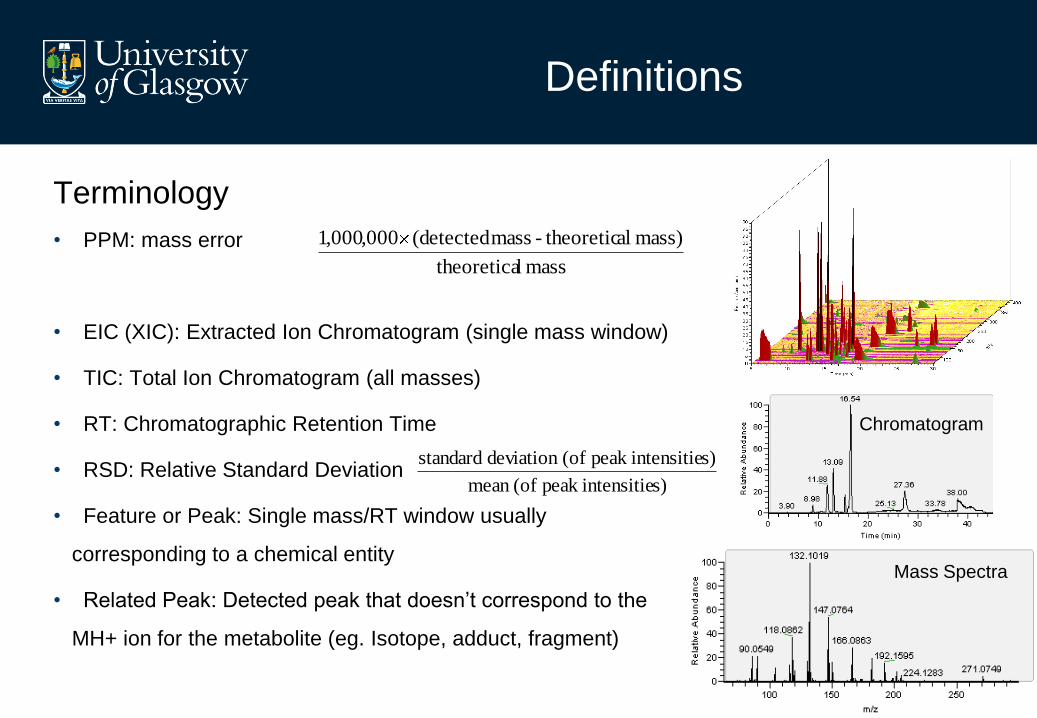
Terminology
• PPM: mass error
• EIC (XIC): Extracted Ion Chromatogram (single mass window)
• TIC: Total Ion Chromatogram (all masses)
• RT: Chromatographic Retention Time
• RSD: Relative Standard Deviation
• Feature or Peak: Single mass/RT window usually
corresponding to a chemical entity
• Related Peak: Detected peak that doesn’t correspond to the
MH+ ion for the metabolite (eg. Isotope, adduct, fragment)
Chromatogram
Mass Spectra
mass ltheoretica
mass) al theoretic- mass detected(000,000,1
s)intensitiepeak (ofmean
s)intensitiepeak (ofdeviation standard
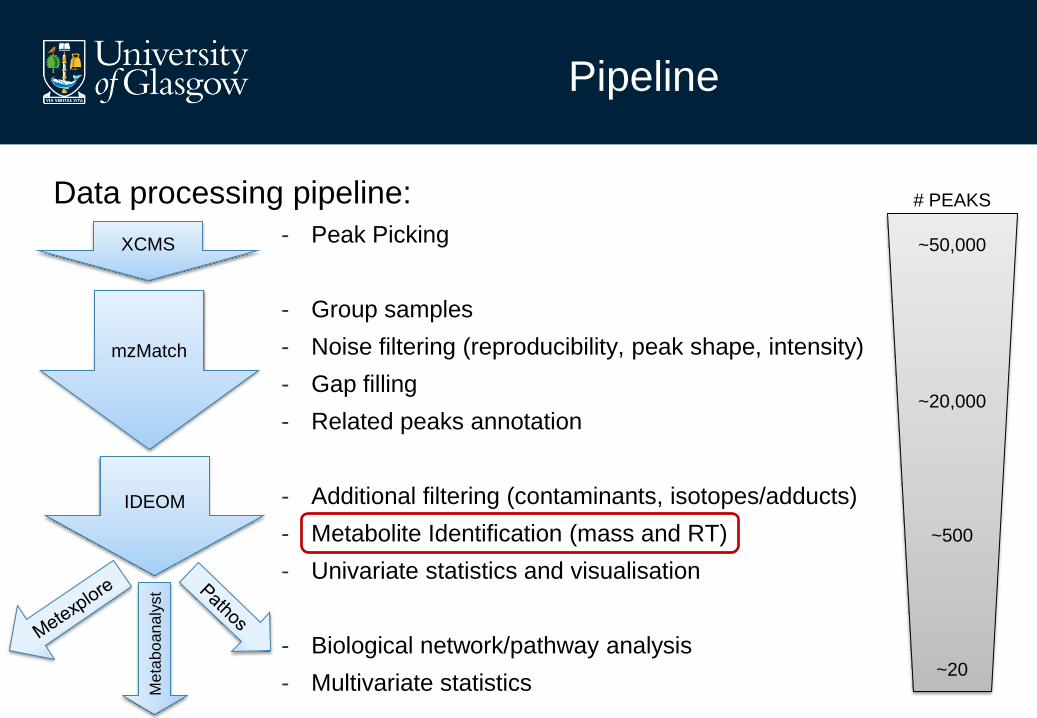
Pipeline
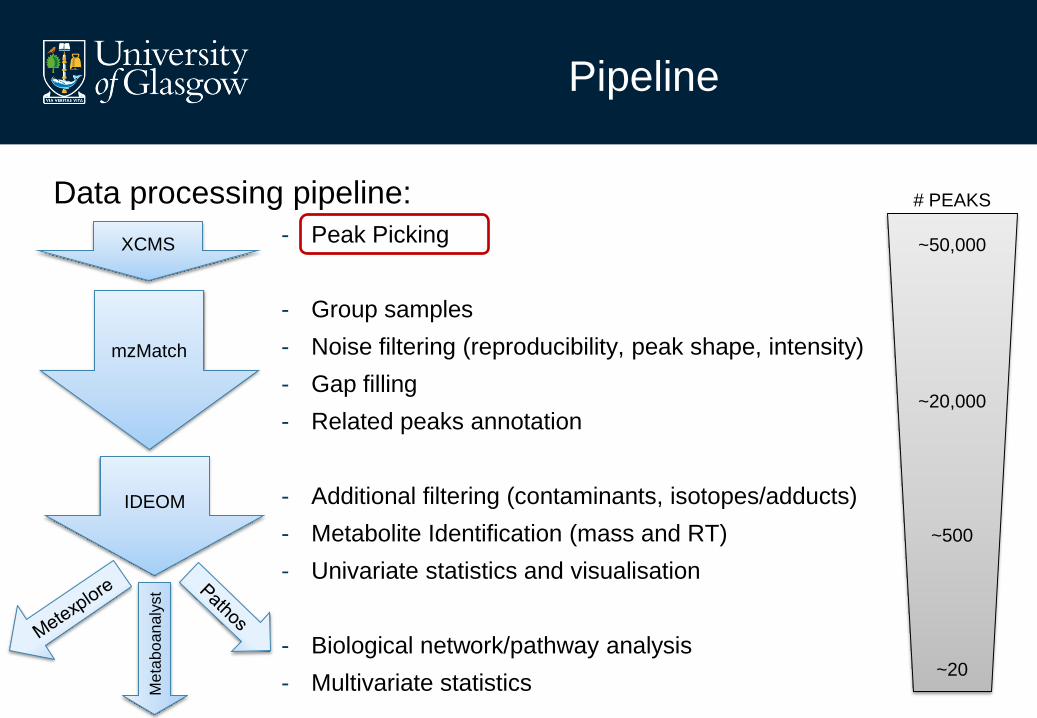
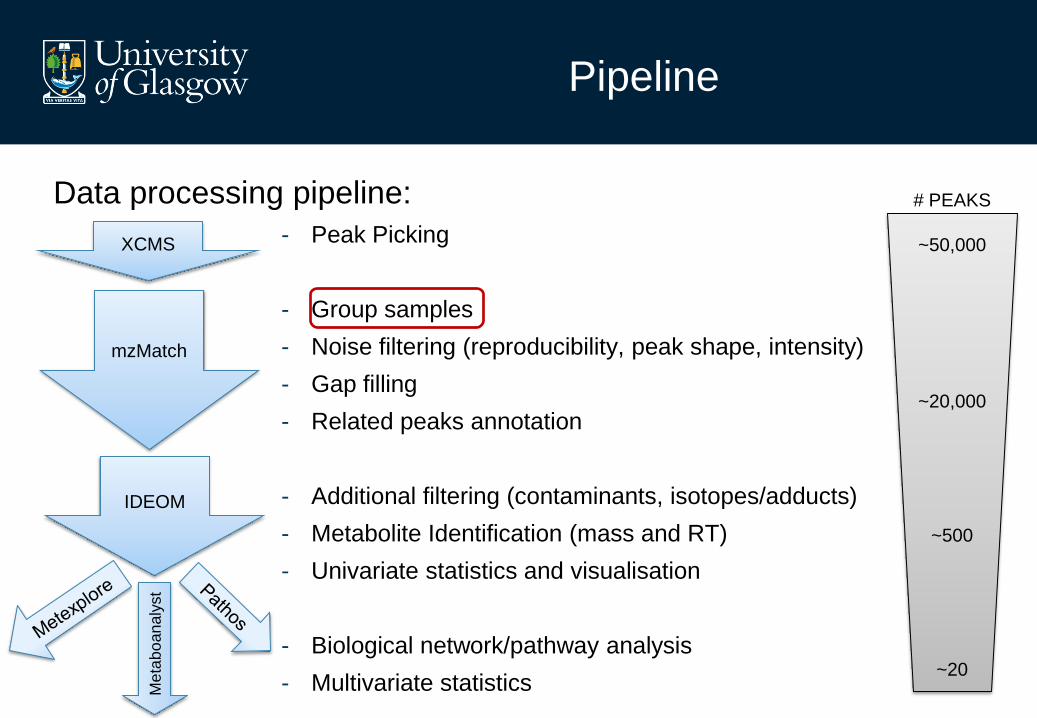
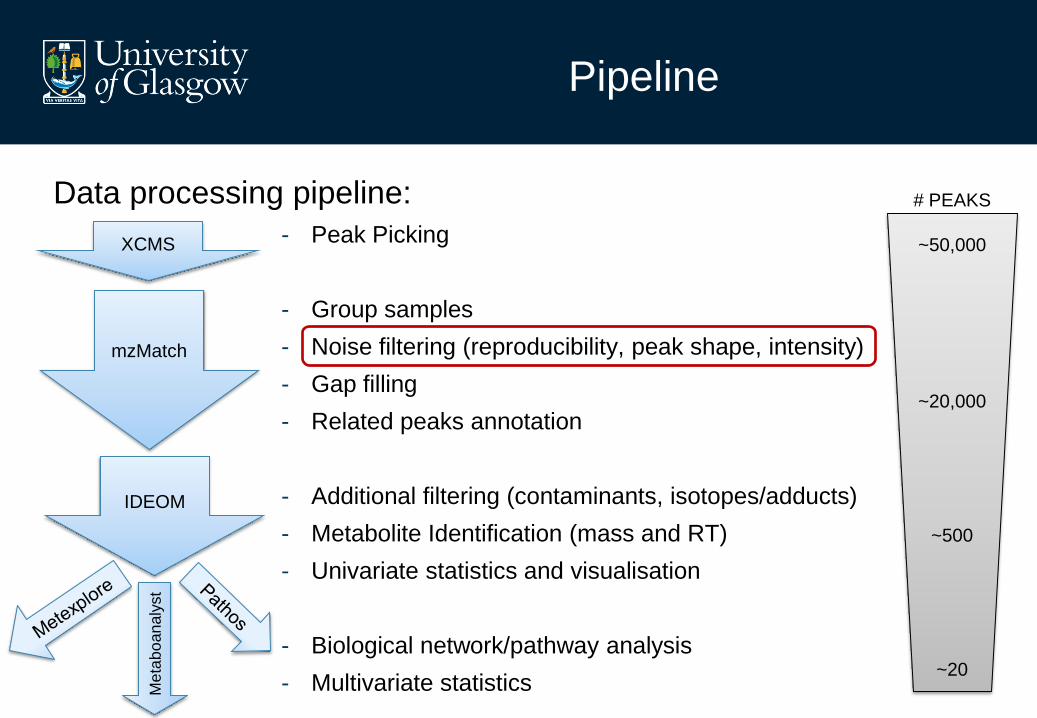
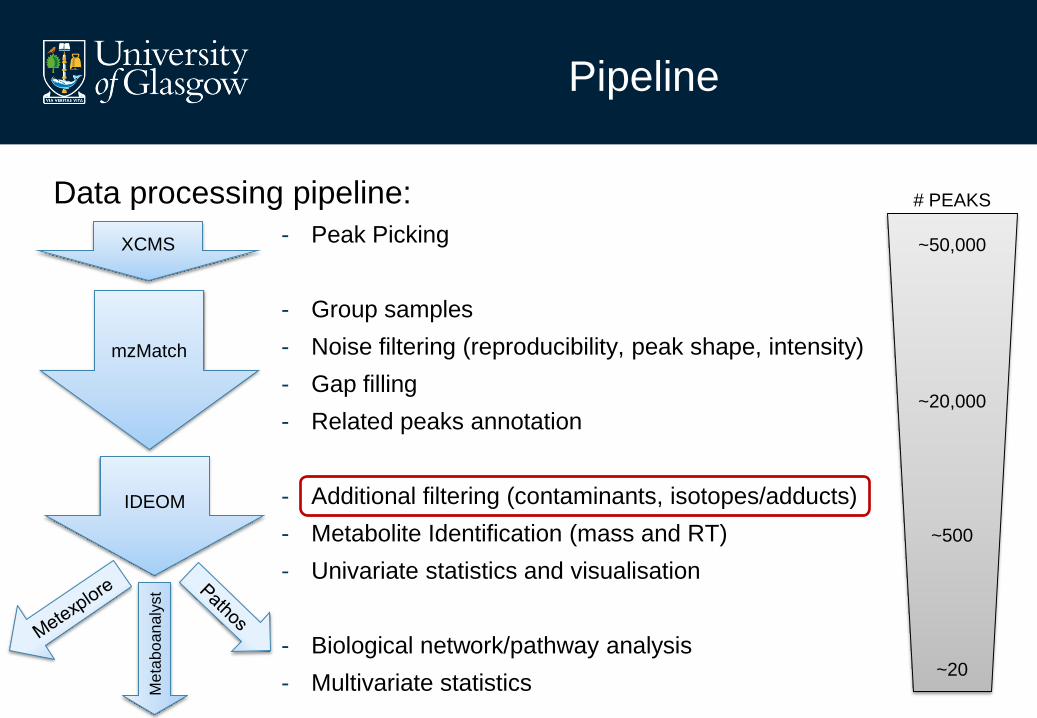
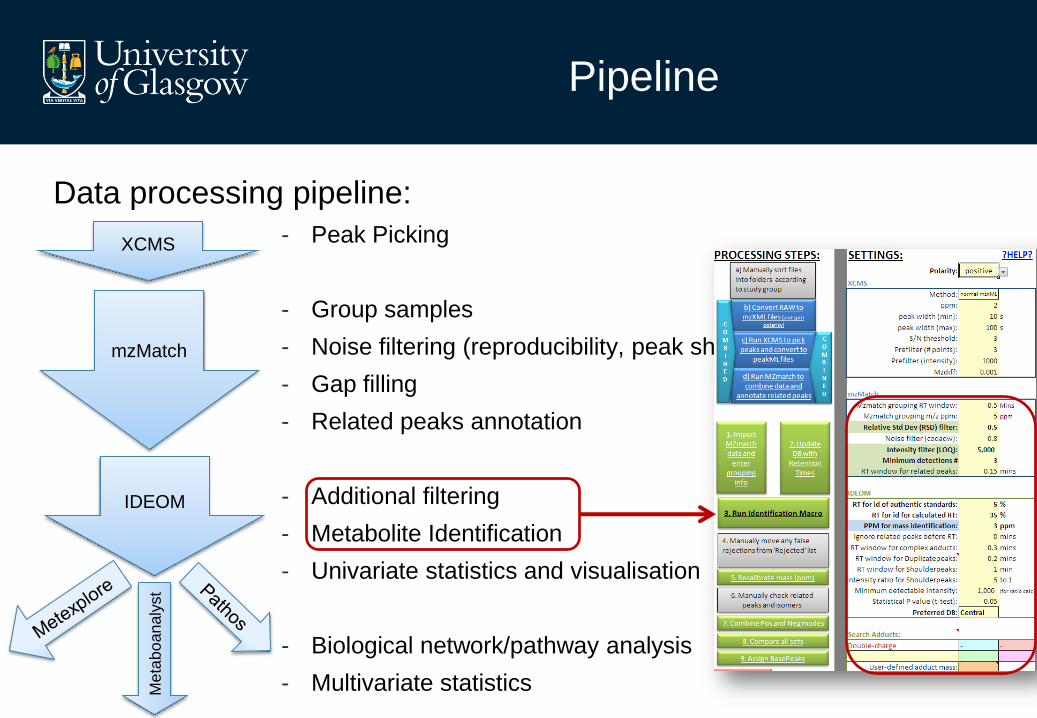
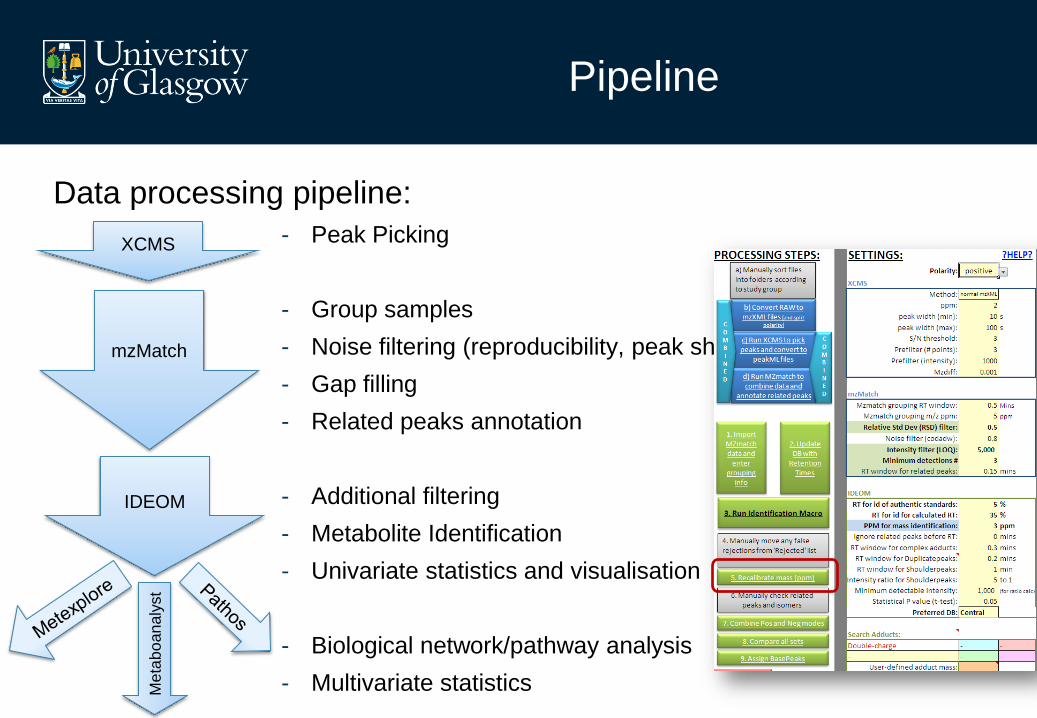
Data processing pipeline:
- Peak Picking
- Group samples
- Noise filtering (reproducibility, peak shape, intensity)
- Gap filling
- Related peaks annotation
- Additional filtering (contaminants, isotopes/adducts)
- Metabolite Identification (mass and RT)
- Univariate statistics and visualisation
- Biological network/pathway analysis
- Multivariate statistics
XCMS
mzMatch
IDEOM
Me
tab
oan
aly
st
# PEAKS
~50,000
~20,000
~500
~20
XCMS
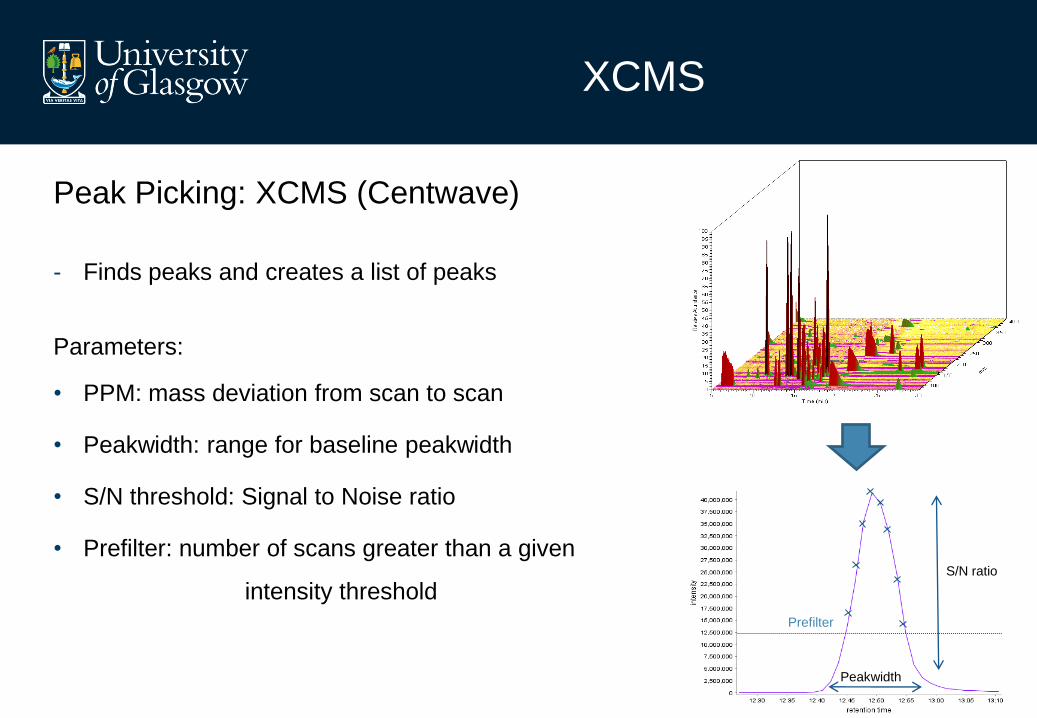
Peak Picking: XCMS (Centwave)
- Finds peaks and creates a list of peaks
Parameters:
• PPM: mass deviation from scan to scan
• Peakwidth: range for baseline peakwidth
• S/N threshold: Signal to Noise ratio
• Prefilter: number of scans greater than a given
intensity threshold
Peakwidth
S/N ratio
Prefilter
Pipeline
Data processing pipeline:
- Peak Picking
- Group samples
- Noise filtering (reproducibility, peak shape, intensity)
- Gap filling
- Related peaks annotation
- Additional filtering (contaminants, isotopes/adducts)
- Metabolite Identification (mass and RT)
- Univariate statistics and visualisation
- Biological network/pathway analysis
- Multivariate statistics
XCMS
mzMatch
IDEOM
Me
tab
oan
aly
st
# PEAKS
~50,000
~20,000
~500
~20
mzMatch
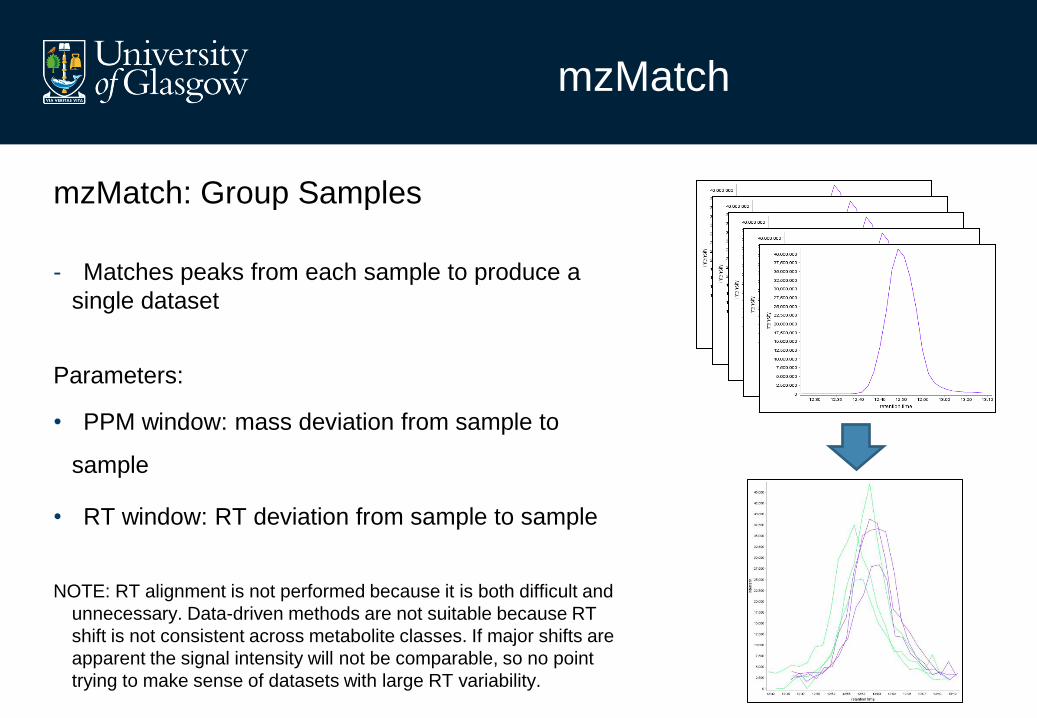
mzMatch: Group Samples
- Matches peaks from each sample to produce a
single dataset
Parameters:
• PPM window: mass deviation from sample to
sample
• RT window: RT deviation from sample to sample
NOTE: RT alignment is not performed because it is both difficult and
unnecessary. Data-driven methods are not suitable because RT
shift is not consistent across metabolite classes. If major shifts are
apparent the signal intensity will not be comparable, so no point
trying to make sense of datasets with large RT variability.
Pipeline
Data processing pipeline:
- Peak Picking
- Group samples
- Noise filtering (reproducibility, peak shape, intensity)
- Gap filling
- Related peaks annotation
- Additional filtering (contaminants, isotopes/adducts)
- Metabolite Identification (mass and RT)
- Univariate statistics and visualisation
- Biological network/pathway analysis
- Multivariate statistics
XCMS
mzMatch
IDEOM
Me
tab
oan
aly
st
# PEAKS
~50,000
~20,000
~500
~20
mzMatch
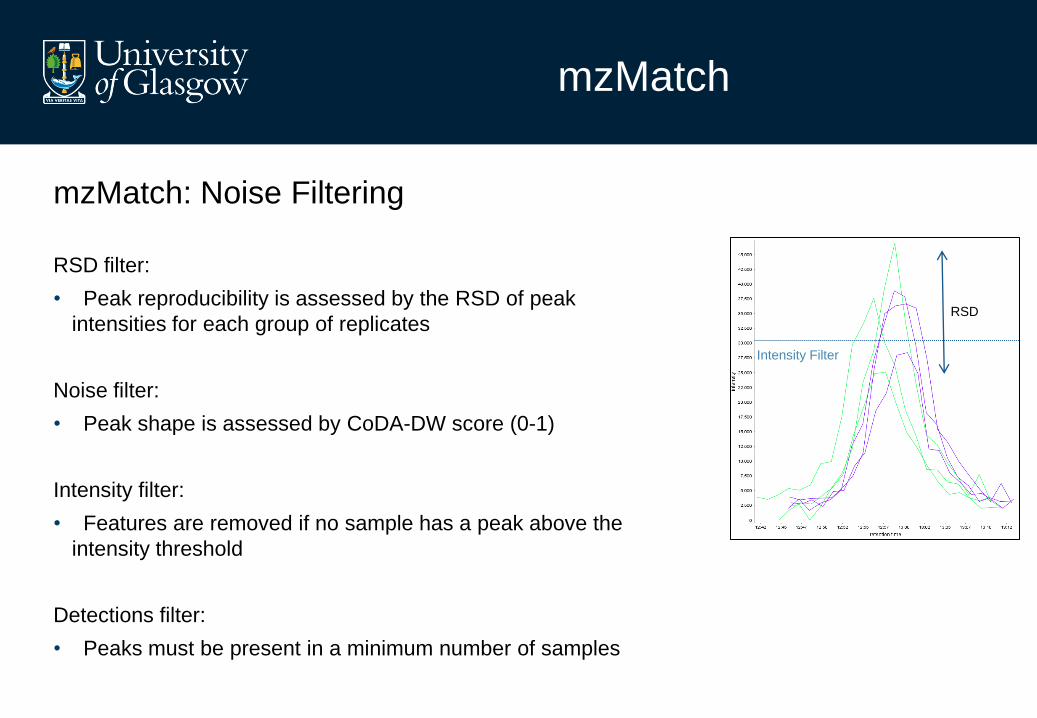
mzMatch: Noise Filtering
RSD filter:
• Peak reproducibility is assessed by the RSD of peak
intensities for each group of replicates
Noise filter:
• Peak shape is assessed by CoDA-DW score (0-1)
Intensity filter:
• Features are removed if no sample has a peak above the
intensity threshold
Detections filter:
• Peaks must be present in a minimum number of samples
RSD
Intensity Filter

Pipeline
Data processing pipeline:
- Peak Picking
- Group samples
- Noise filtering (reproducibility, peak shape, intensity)
- Gap filling
- Related peaks annotation
- Additional filtering (contaminants, isotopes/adducts)
- Metabolite Identification (mass and RT)
- Univariate statistics and visualisation
- Biological network/pathway analysis
- Multivariate statistics
XCMS
mzMatch
IDEOM
Me
tab
oan
aly
st
# PEAKS
~50,000
~20,000
~500
~20
mzMatch
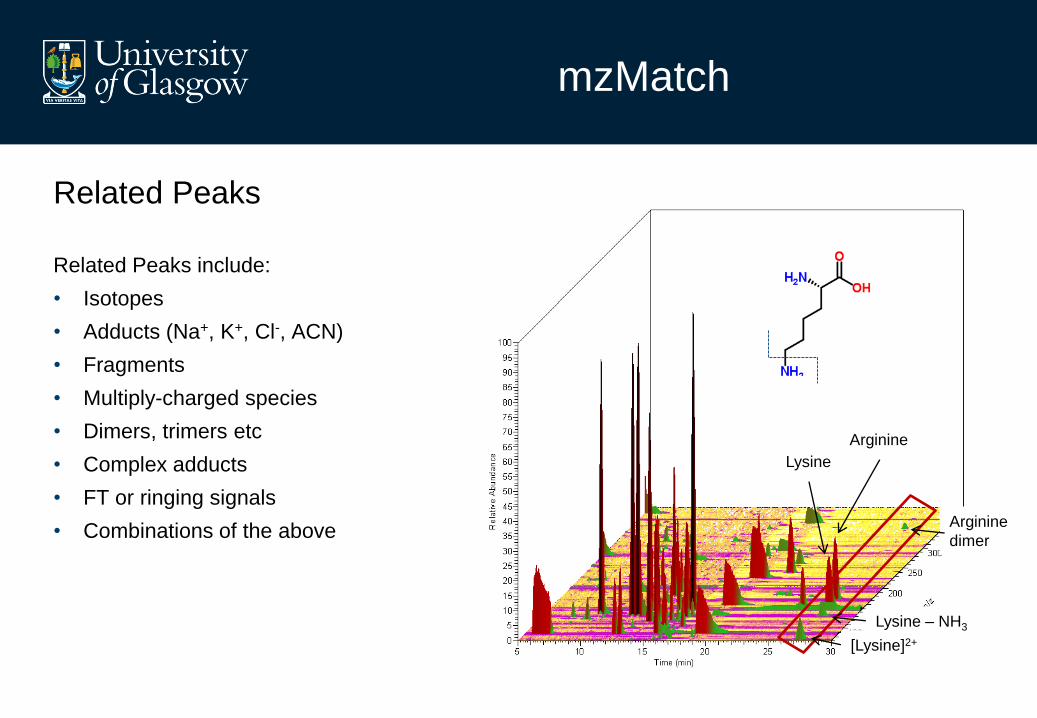
Related Peaks
Related Peaks include:
• Isotopes
• Adducts (Na+, K+, Cl-, ACN)
• Fragments
• Multiply-charged species
• Dimers, trimers etc
• Complex adducts
• FT or ringing signals
• Combinations of the above
Lysine
Arginine
Lysine – NH3
[Lysine]2+
Arginine
dimer
mzMatch
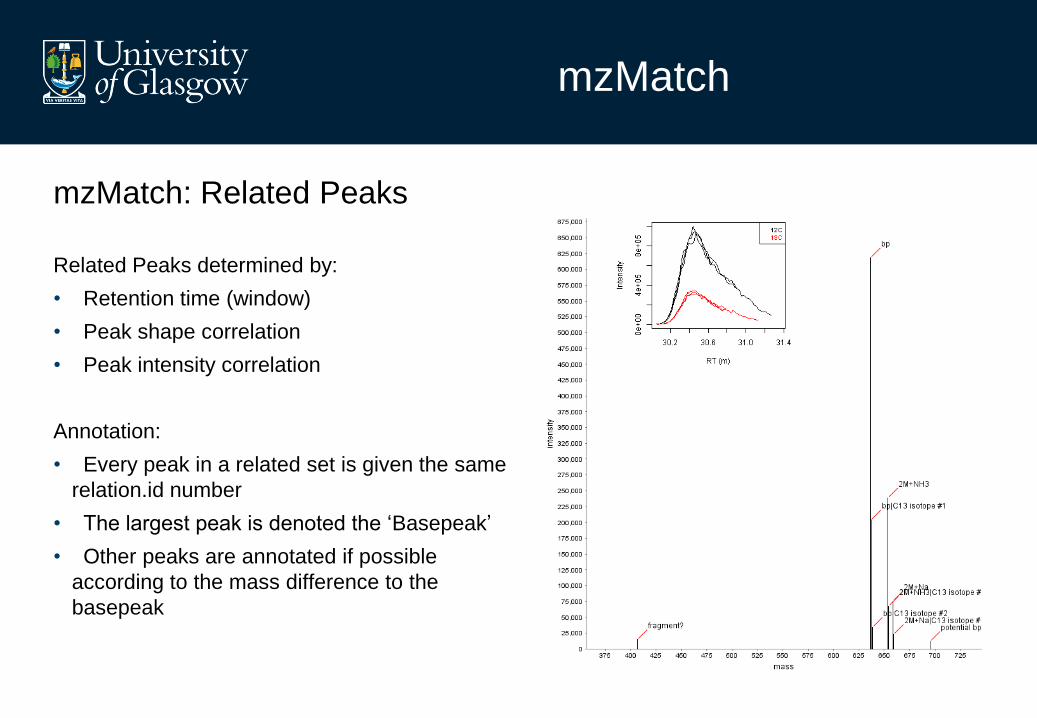
mzMatch: Related Peaks
Related Peaks determined by:
• Retention time (window)
• Peak shape correlation
• Peak intensity correlation
Annotation:
• Every peak in a related set is given the same
relation.id number
• The largest peak is denoted the ‘Basepeak’
• Other peaks are annotated if possible
according to the mass difference to the
basepeak
Pipeline
Data processing pipeline:
- Peak Picking
- Group samples
- Noise filtering (reproducibility, peak shape, intensity)
- Gap filling
- Related peaks annotation
- Additional filtering (contaminants, isotopes/adducts)
- Metabolite Identification (mass and RT)
- Univariate statistics and visualisation
- Biological network/pathway analysis
- Multivariate statistics
XCMS
mzMatch
IDEOM
Me
tab
oan
aly
st
# PEAKS
~50,000
~20,000
~500
~20
Ideom
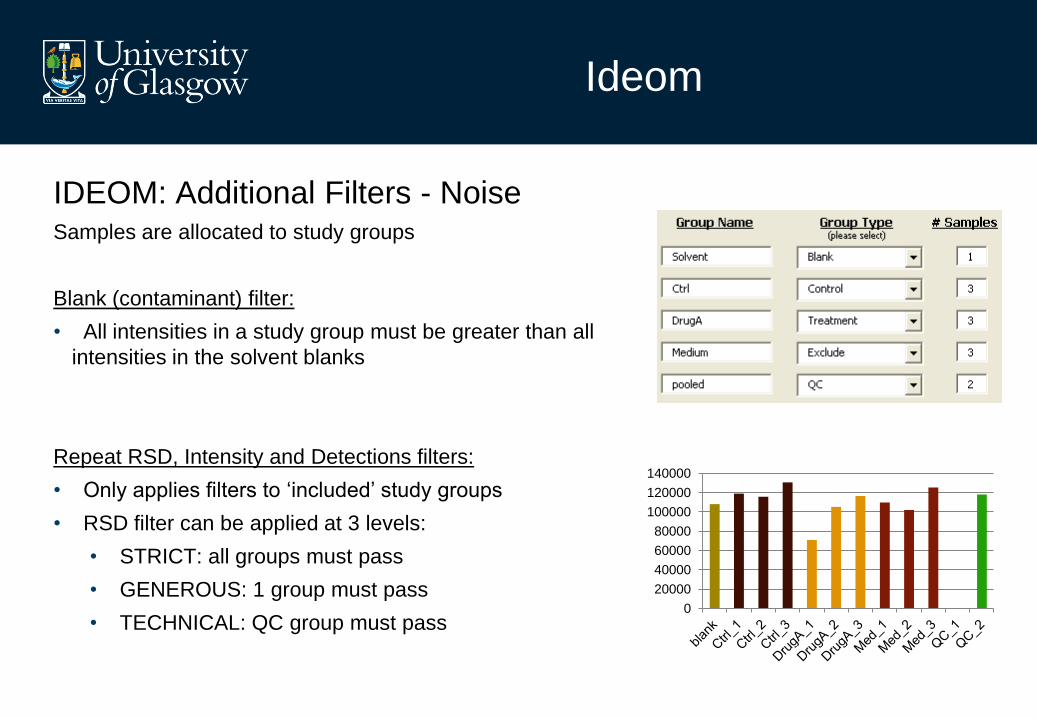
IDEOM: Additional Filters - Noise Samples are allocated to study groups
Blank (contaminant) filter:
• All intensities in a study group must be greater than all
intensities in the solvent blanks
Repeat RSD, Intensity and Detections filters:
• Only applies filters to ‘included’ study groups
• RSD filter can be applied at 3 levels:
• STRICT: all groups must pass
• GENEROUS: 1 group must pass
• TECHNICAL: QC group must pass 0
20000
40000
60000
80000
100000
120000
140000
Ideom
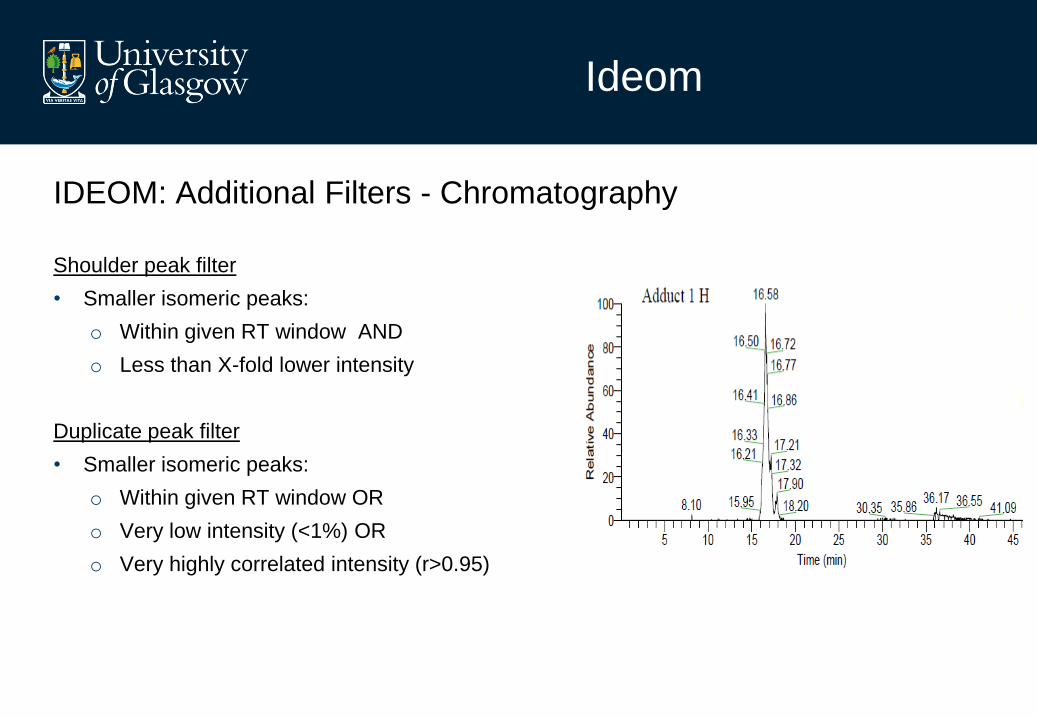
IDEOM: Additional Filters - Chromatography
Shoulder peak filter
• Smaller isomeric peaks:
o Within given RT window AND
o Less than X-fold lower intensity
Duplicate peak filter
• Smaller isomeric peaks:
o Within given RT window OR
o Very low intensity (<1%) OR
o Very highly correlated intensity (r>0.95)
Ideom
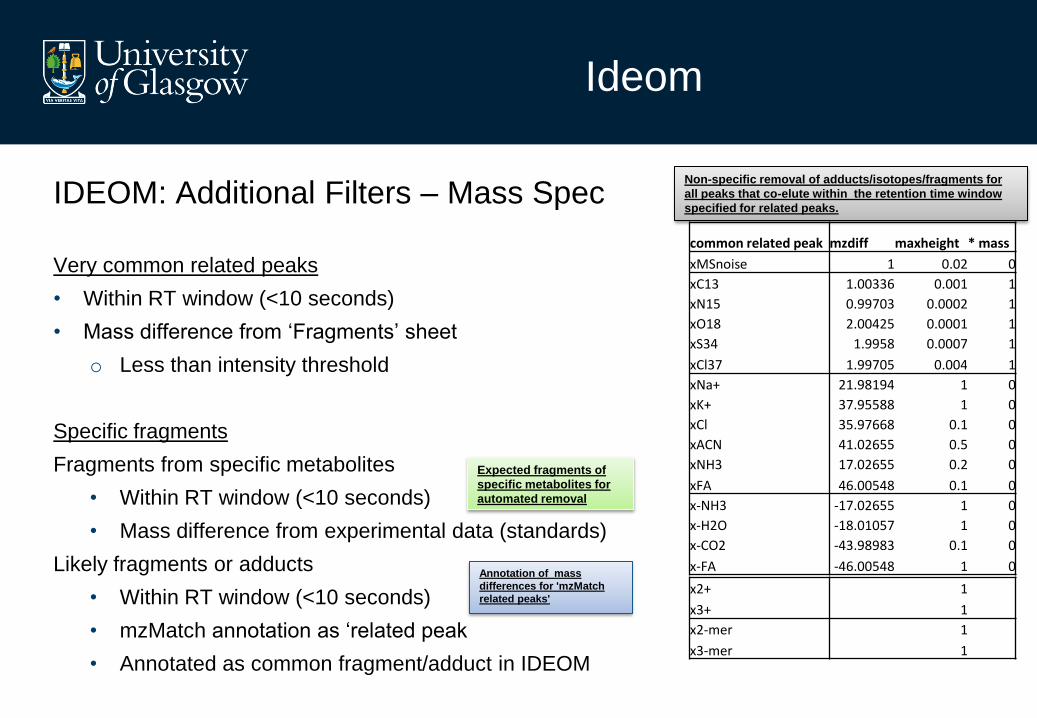
IDEOM: Additional Filters – Mass Spec
Very common related peaks
• Within RT window (<10 seconds)
• Mass difference from ‘Fragments’ sheet
o Less than intensity threshold
Specific fragments
Fragments from specific metabolites
• Within RT window (<10 seconds)
• Mass difference from experimental data (standards)
Likely fragments or adducts
• Within RT window (<10 seconds)
• mzMatch annotation as ‘related peak
• Annotated as common fragment/adduct in IDEOM
x2+ 1
x3+ 1
x2-mer 1
x3-mer 1
common related peak mzdiff maxheight * mass
xMSnoise 1 0.02 0
xC13 1.00336 0.001 1
xN15 0.99703 0.0002 1
xO18 2.00425 0.0001 1
xS34 1.9958 0.0007 1
xCl37 1.99705 0.004 1
xNa+ 21.98194 1 0
xK+ 37.95588 1 0
xCl 35.97668 0.1 0
xACN 41.02655 0.5 0
xNH3 17.02655 0.2 0
xFA 46.00548 0.1 0
x-NH3 -17.02655 1 0
x-H2O -18.01057 1 0
x-CO2 -43.98983 0.1 0
x-FA -46.00548 1 0
Non-specific removal of adducts/isotopes/fragments for
all peaks that co-elute within the retention time window
specified for related peaks.
Annotation of mass
differences for 'mzMatch
related peaks'
Expected fragments of
specific metabolites for
automated removal

Ideom
IDEOM: Additional Filters – Mass Spec
Pipeline
Data processing pipeline:
- Peak Picking
- Group samples
- Noise filtering (reproducibility, peak shape, intensity)
- Gap filling
- Related peaks annotation
- Additional filtering (contaminants, isotopes/adducts)
- Metabolite Identification (mass and RT)
- Univariate statistics and visualisation
- Biological network/pathway analysis
- Multivariate statistics
XCMS
mzMatch
IDEOM
Me
tab
oan
aly
st
# PEAKS
~50,000
~20,000
~500
~20
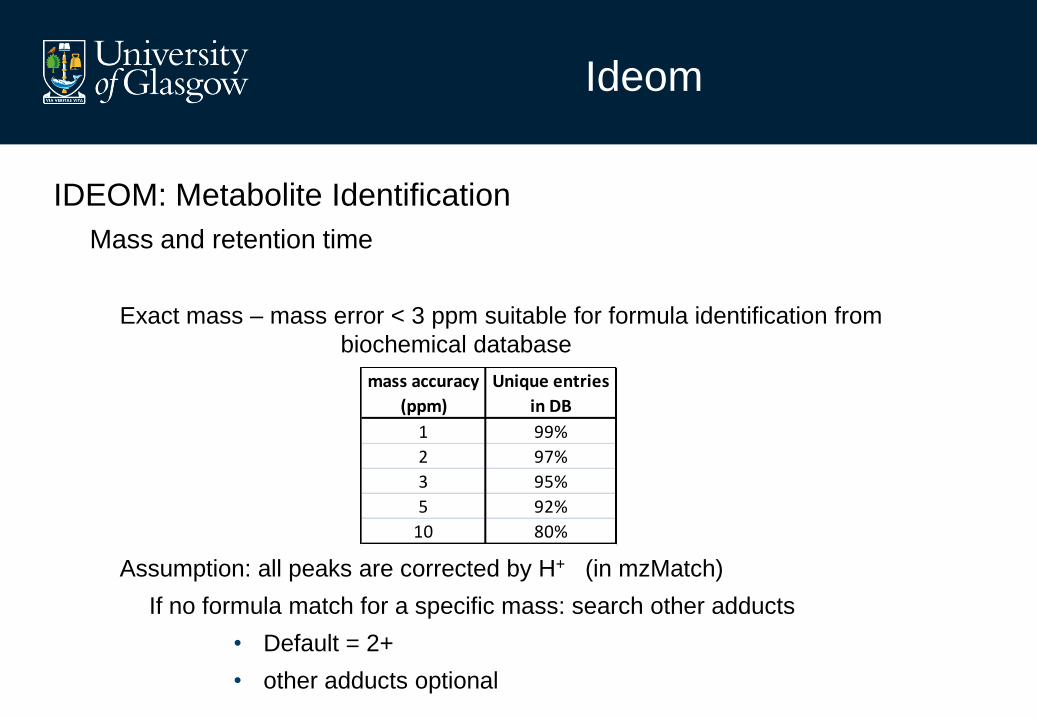
Ideom
IDEOM: Metabolite Identification
Mass and retention time
Exact mass – mass error < 3 ppm suitable for formula identification from
biochemical database
Assumption: all peaks are corrected by H+ (in mzMatch)
If no formula match for a specific mass: search other adducts
• Default = 2+
• other adducts optional
mass accuracy
(ppm)
Unique entries
in DB
1 99%
2 97%
3 95%
5 92%
10 80%
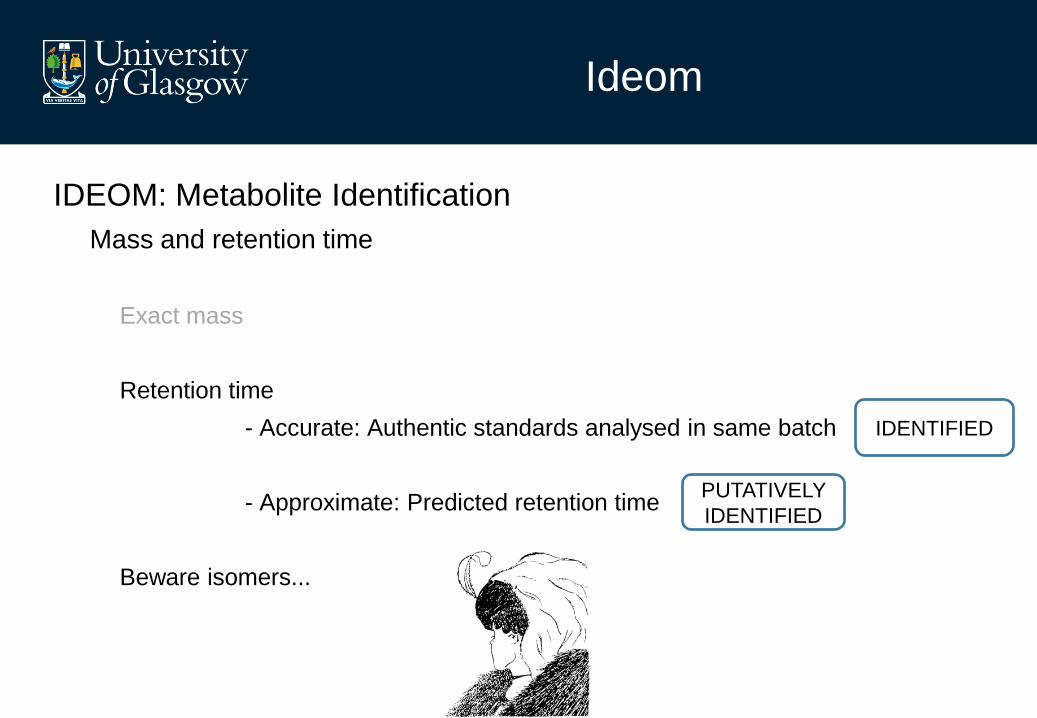
Ideom
IDEOM: Metabolite Identification
Mass and retention time
Exact mass
Retention time
- Accurate: Authentic standards analysed in same batch
- Approximate: Predicted retention time
Beware isomers...
IDENTIFIED
PUTATIVELY
IDENTIFIED
Ideom
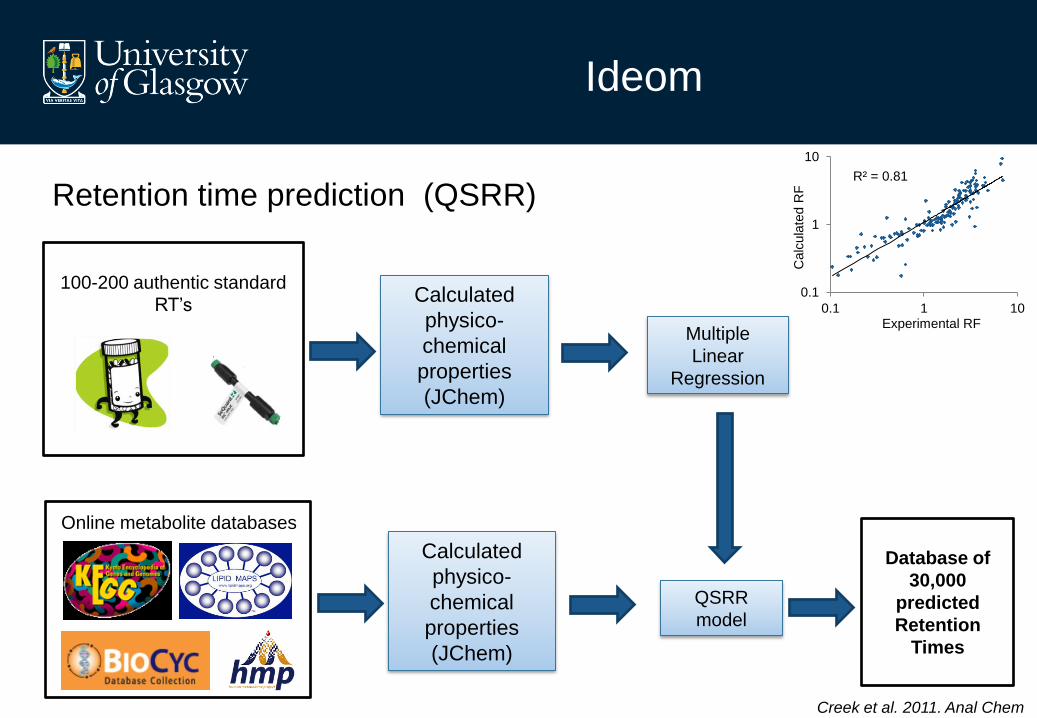
Calculated
physico-
chemical
properties
(JChem)
Multiple
Linear
Regression
Database of
30,000
predicted
Retention
Times
Online metabolite databases
100-200 authentic standard
RT’s
Calculated
physico-
chemical
properties
(JChem)
QSRR
model
R² = 0.81
0.1
1
10
0.1 1 10
Calc
ula
ted R
F
Experimental RF
Retention time prediction (QSRR)
Creek et al. 2011. Anal Chem
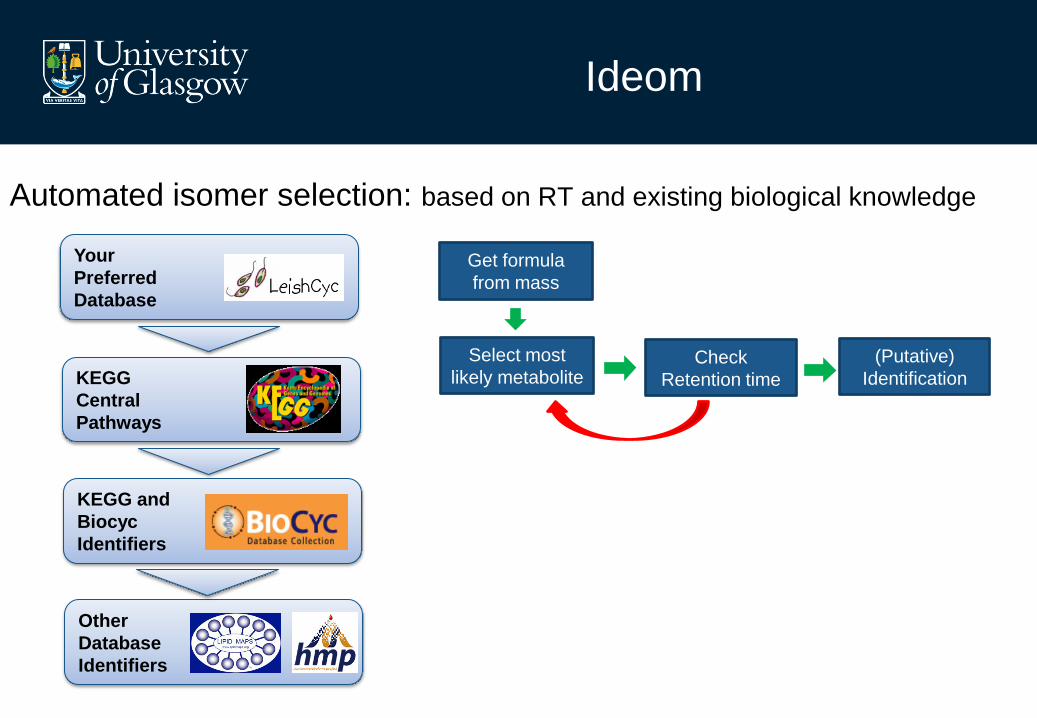
Automated isomer selection: based on RT and existing biological knowledge
Your
Preferred
Database
KEGG
Central
Pathways
KEGG and
Biocyc
Identifiers
Other
Database
Identifiers
Ideom
Get formula
from mass
Select most
likely metabolite Check
Retention time
(Putative)
Identification
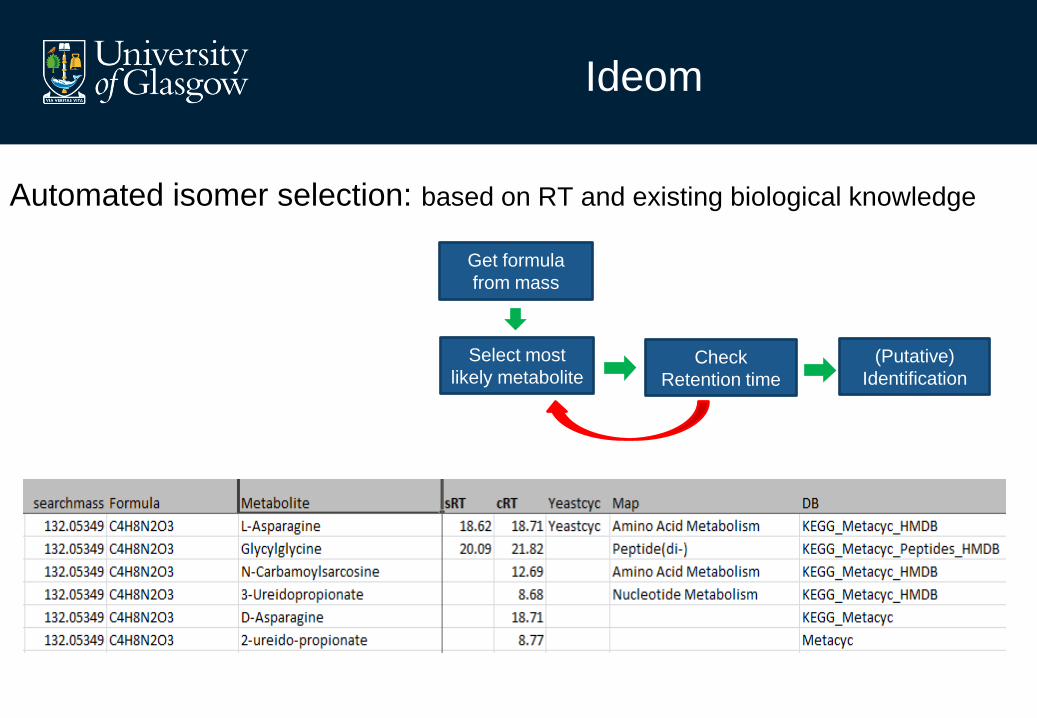
Automated isomer selection: based on RT and existing biological knowledge
Ideom
Get formula
from mass
Select most
likely metabolite Check
Retention time
(Putative)
Identification
Ideom
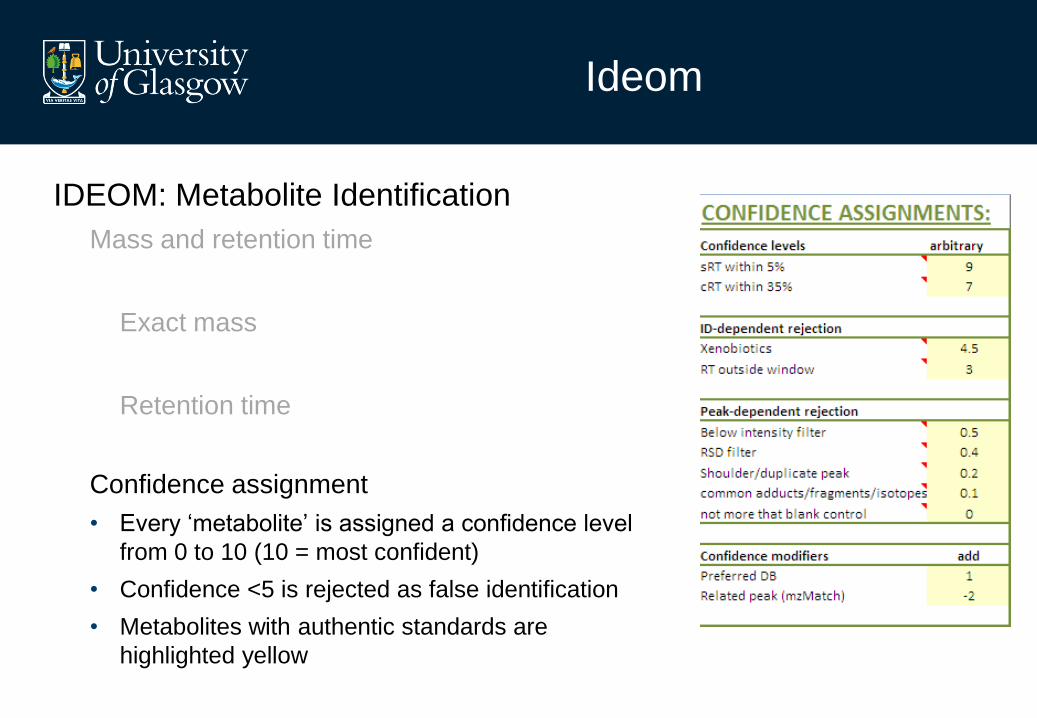
IDEOM: Metabolite Identification
Mass and retention time
Exact mass
Retention time
Confidence assignment
• Every ‘metabolite’ is assigned a confidence level
from 0 to 10 (10 = most confident)
• Confidence <5 is rejected as false identification
• Metabolites with authentic standards are
highlighted yellow
Pipeline
Data processing pipeline:
- Peak Picking
- Group samples
- Noise filtering (reproducibility, peak shape, intensity)
- Gap filling
- Related peaks annotation
- Additional filtering
- Metabolite Identification
- Univariate statistics and visualisation
- Biological network/pathway analysis
- Multivariate statistics
XCMS
mzMatch
IDEOM
Me
tab
oan
aly
st
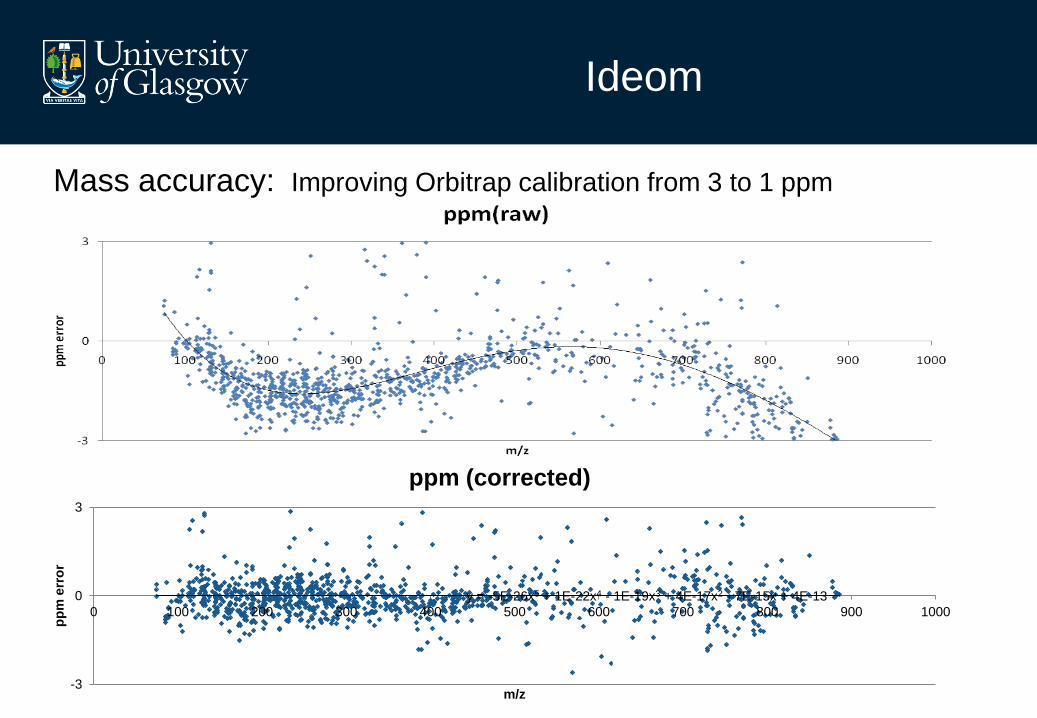
y = -5E-26x5 + 1E-22x4 - 1E-19x3 + 4E-17x2 - 7E-15x + 4E-13
-3
0
3
0 100 200 300 400 500 600 700 800 900 1000
pp
m e
rro
r
m/z
ppm (corrected)
Ideom
Mass accuracy: Improving Orbitrap calibration from 3 to 1 ppm
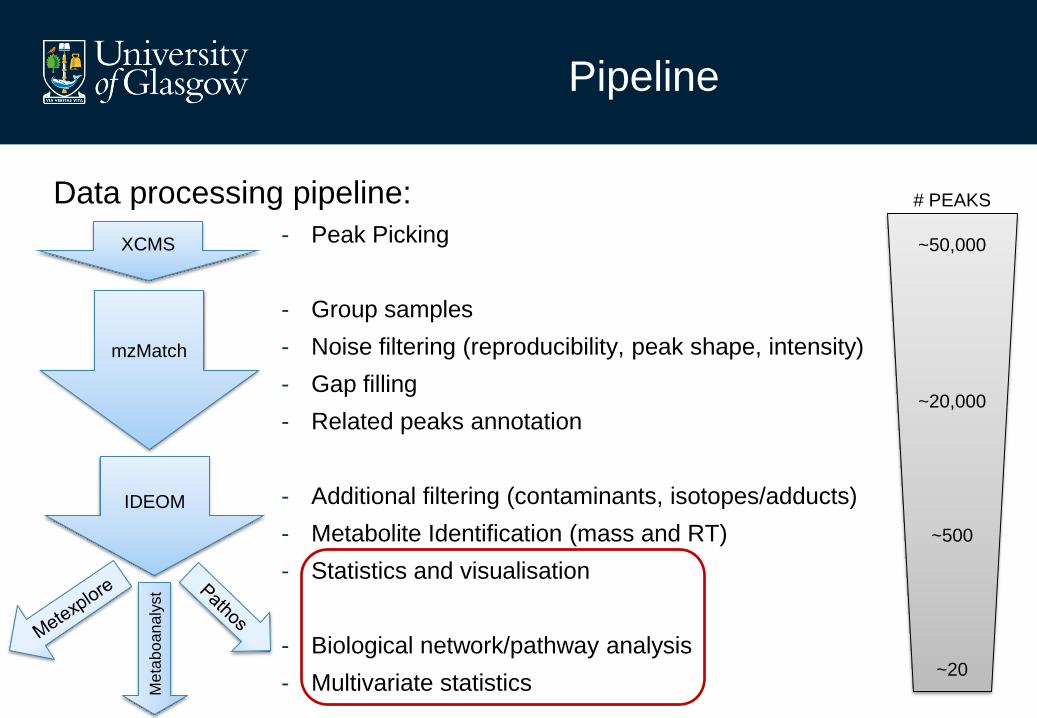
Pipeline
Data processing pipeline:
- Peak Picking
- Group samples
- Noise filtering (reproducibility, peak shape, intensity)
- Gap filling
- Related peaks annotation
- Additional filtering (contaminants, isotopes/adducts)
- Metabolite Identification (mass and RT)
- Statistics and visualisation
- Biological network/pathway analysis
- Multivariate statistics
XCMS
mzMatch
IDEOM
Me
tab
oan
aly
st
# PEAKS
~50,000
~20,000
~500
~20
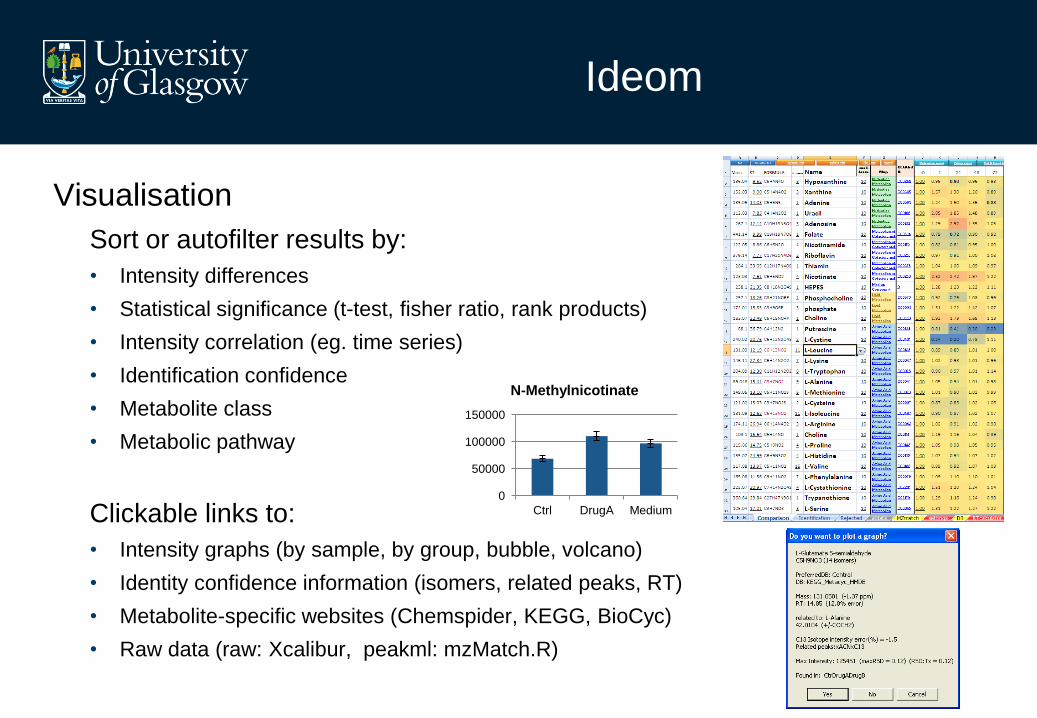
Ideom
Visualisation
Sort or autofilter results by:
• Intensity differences
• Statistical significance (t-test, fisher ratio, rank products)
• Intensity correlation (eg. time series)
• Identification confidence
• Metabolite class
• Metabolic pathway
Clickable links to:
• Intensity graphs (by sample, by group, bubble, volcano)
• Identity confidence information (isomers, related peaks, RT)
• Metabolite-specific websites (Chemspider, KEGG, BioCyc)
• Raw data (raw: Xcalibur, peakml: mzMatch.R)
0
50000
100000
150000
Ctrl DrugA Medium
N-Methylnicotinate
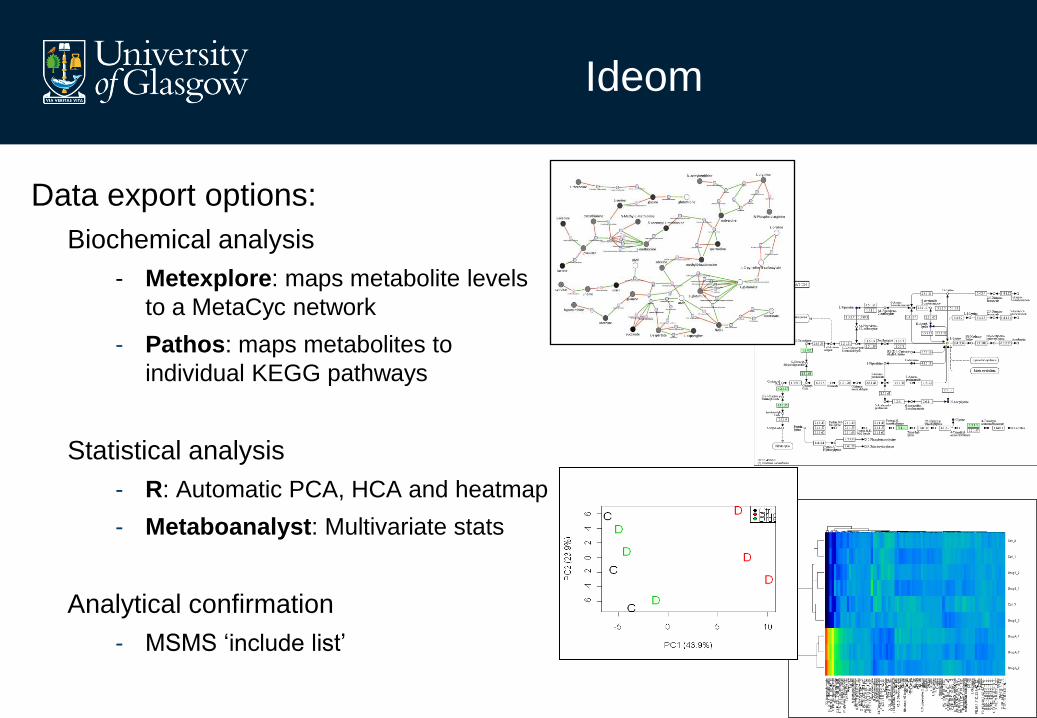
Ideom
Data export options:
Biochemical analysis
- Metexplore: maps metabolite levels
to a MetaCyc network
- Pathos: maps metabolites to
individual KEGG pathways
Statistical analysis
- R: Automatic PCA, HCA and heatmap
- Metaboanalyst: Multivariate stats
Analytical confirmation
- MSMS ‘include list’
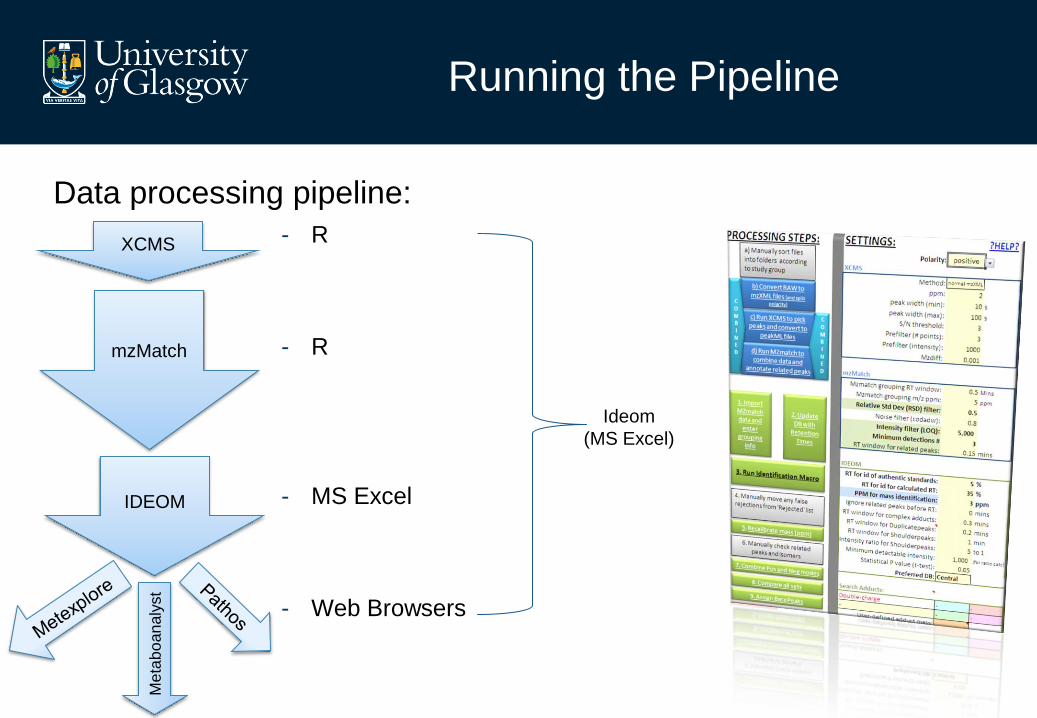
Running the Pipeline
Data processing pipeline:
- R
- R
- MS Excel
- Web Browsers
XCMS
mzMatch
IDEOM
Me
tab
oan
aly
st
Ideom
(MS Excel)
Ideom requirements
• Basic Requirements
• Microsoft Excel 2007 or higher (2003 not sufficient, Mac not fully functional)
• No installation required. Simply open the file and enable macros.
• Requirements for full function
• R Statistical Software : for xcms & mzmatch pre-processing
R packages: XCMS (BioC), mzMatch.R (Rforge), rJava and dependencies
R package: rCDK : for FormulaGenerator
Installation instructions and commands are located in then IDEOM help section
• Msconvert (or ReAdW): for conversion of .RAW to .mzXML files
• Web browser: for Hyperlinks to online databases
• Thermo Xcalibur : for EIC lookup
http://mzmatch.sourceforge.net/ideom.php

Acknowledgements
Mike Barrett
Barrett lab members
Rainer Breitling
Andris Jankevics
Unni Chokkathukalam
Karl Burgess & lab members
Dave Watson & lab members
Tutorial Agenda
• Morning
• Visualizing and interpreting pre-processed data in IDEOM
•Lunch
• Afternoon
• Processing raw data with IDEOM (and mzMatch)
• Additional features in IDEOM
• New features and discussion of future directions
Question
time


![Metabolomics Basics[1]](https://img.pdfslide.us/doc/110x75/553de2815503466f378b4864/metabolomics-basics1.jpg)