Embed Size (px)
Citation preview
MetabolomicsISSN:2153-0769 JOM an open access journal
Research Article Open Access
Metabolomics : Open AccessEvans et al., Metabolomics 2012, 2:3
http://dx.doi.org/10.4172/2153-0769.1000110
Volume 2 • Issue 3 • 1000110
*Corresponding author: Anne M. Evans, Metabolon, Incorporated, 617 Davis Drive, Suite 400, Durham, 27713 North Carolina, Tel: 919-572-1711; Fax: 919-572-1721; E-mail: [email protected]
Received March 09, 2012; Accepted March 29, 2012; Published March 31, 2012
Citation: Evans AM, Mitchell MW, Dai H, DeHaven CD (2012) Categorizing Ion-Features in Liquid Chromatography/Mass Spectrometry Metabolomics Data. Metabolomics 2:110. doi:10.4172/2153-0769.1000110
Copyright: © 2012 Evans AM, et al. This is an open-access article distributed under the terms of the Creative Commons Attribution License, which permits unrestricted use, distribution, and reproduction in any medium, provided the original author and source are credited.
Categorizing Ion-Features in Liquid Chromatography/Mass Spectrometry Metabolomics DataAnne M. Evans*, Matthew W. Mitchell, Hongping Dai and Corey D. DeHaven
Metabolon, Incorporated, 617 Davis Drive, Suite 400, Durham, 27713 North Carolina
AbstractMass spectrometry based metabolomics experiments generate copious amounts of signal data which in turn is
processed to ultimately convert the signal data into identified metabolites so that biological interpretation and pathway analysis can be performed. The actual number of biochemicals detected in global biochemical profiling studies utilizing liquid chromatography coupled to mass spectrometry (LC/MS) is much lower than the total number of mass spectral ion-features detected, particularly when using positive electrospray ionization (ESI+). Given the conflicting numbers of detected metabolites reported in literature, a detailed analysis of the ion-feature composition is warranted. Ultra-high pressure liquid chromatography (UHPLC)/Ion-trap MS and fragmentation (MS2) nominal mass data from 10 human plasma samples were analyzed in triplicate. The resulting detected ion-features were analyzed for ion-feature reproducibility, type and source. It was found that nearly 70% of all ion-features detected were non-reproducible, that 22% were from chemicals contributed to the samples due to storage and processing and that only 25% of the reproducible and annotatable ion-features could be determined to be protonated molecular ions. In addition, a previously undocumented ion-feature type: amalgam adducts, and ion-feature source: ions arising from chemistry of compounds occurring within extracted samples, is reported. This analysis demonstrated that from an average of 10,000 ion-features detected in a human plasma sample, ultimately only 220 compounds of biological origin were detected and identified from a positive ion analysis only.
or peak area correlation analysis across samples, and chromatographic peak shape correlation.
There unfortunately still remains wide differences in the numbers of “features” and biochemicals reported in literature [18-21]. This discrepancy is partly due to a lack of a standardized language in the field to discuss these data, but is certainly also dependent on what methods and data-processing were used. Ultimately the total number of biologically relevant biochemicals detected and identified, rather than the number of ion-features detected, is essential to the actual biological understanding.
While the tools to deconvolute the many ion-features produced by a single chemical are becoming available, there is still a lack of a clear picture as to “how many biochemicals are actually being detected” and a general lack of discussion concerning the source of the ion-features being detected and the amount of reproducibility associated with these types of analyses. Given the implications to successful metabolomics analyses we felt a comprehensive analysis and annotation of the ion-features detected in an electrospray ionization metabolomics dataset was warranted. We analyzed ion-features detected in an ion-trap mass spectrometry based metabolomics study of 10 human plasma samples. This analysis included the distribution of types of ion-features: adducts, isotopes, etc., the number of ion-features which could be classified as non-reproducible, an analysis of the number of ion-features that were
Keywords: Ion-Features; LC/MS; Positive Electrospray Ionization; Metabolomics; Amalgam Adduct
IntroductionGlobal biochemical profiling, also known as metabolomics, is
a technique by which the small molecule complement, generally molecules with masses less than 1000 Da, is analyzed from biological source material for changes resulting from some set of test conditions. Metabolomics has been utilized in a wide range of applications using a wide variety of instrumentation [1-10]. For the purposes of this manuscript we focus on one of the commonly used methods to detect, quantify, and identify this small molecule complement: liquid chromatography coupled to mass spectrometry (LC/MS).
LC/MS methods are commonly used because of the sensitivity and specificity of the data collected. The sensitivity found with these methods allows an analyst to detect and monitor a larger number of small molecules, leading to greater coverage of the biochemical pathways potentially involved in the system being tested. The specificity of mass spectrometry, in the form of mass to charge (m/z) and fragmentation data, gives an analyst the ability to identify the detected biochemicals in order to gain some biological insight to the question at hand. However, the processing and identification of the detected biochemicals is complicated by the fact that a single biochemical does not give rise to a single mass-to-charge signal but rather many in the form of co-eluting isotopes, adducts, in-source fragments, and multimers, especially when electrospray ionization techniques are used [11,12]. This convoluted data can have a significant effect on the time and the ease with which data is interpreted.
Recently there have been a number of publications addressing the need for comprehensive software packages that are capable of deconvoluting such datasets [11,13-17]. These programs are a necessary first step in aiding the analyst to accurately estimate the “actual” number of biochemicals detected. Most of these software packages use combinations of the following principles to deconvolute ion-feature types: predefined known mass relationships, peak intensity
Citation: Evans AM, Mitchell MW, Dai H, DeHaven CD (2012) Categorizing Ion-Features in Liquid Chromatography/Mass Spectrometry Metabolomics Data. Metabolomics 2:110. doi:10.4172/2153-0769.1000110
Page 2 of 8
Volume 2 • Issue 3 • 1000110MetabolomicsISSN:2153-0769 JOM an open access journal
also present in water blanks, i.e. artifacts, as well as an analysis and discussion of other unique ion-feature types not previously reported, to our knowledge, namely ion-features that are amalgams of monomers from two separate co-eluting chemicals and ion-features that arise from chemistry occurring within the extracted chemical samples while awaiting LC/MS analysis.
Materials and MethodsSample material
Ten plasma samples were selected randomly from a large cohort of Europeans with varying degrees of risk factors for insulin resistance. The subjects used in this smaller study ranged in age (30-59) and gender. In addition to these biological samples, aliquots of 18MΩ high purity water were also extracted to serve as process blanks.
Analytical method
The analytical method including sample preparation, LC/MS analysis, data processing and biochemical identification are reported in detail in [22] for the UHPLC method. Brief descriptions of each section are included below but for full method disclosure see [22].
Sample preparation: Prior to extraction, samples were stored at -80ºC. On the day of extraction, samples were thawed on ice. Proteins were precipitated from 100 µL of plasma with methanol using an automated liquid handler (Hamilton LabStar). The methanol contained four standards, which permitted the monitoring of extraction reproducibility. The resulting supernatant was split into two aliquots and dried under nitrogen and then further dried in vacuo. One of the two aliquots was reconstituted in 100 µL of 0.1% formic acid and the other was reserved for other analyses not discussed in this manuscript. In addition to the 10 human plasma samples, 100 µL of 18 MΩ high purity water was also extracted five independent times to serve as process blanks. Every sample analyzed was reconstituted with solvent that contained standards in order to monitor and evaluate instrument and extraction performance and align chromatograms. Most of these standards were isotopically labeled versions of endogenous chemicals and were carefully chosen so as not to interfere with the measurement of the endogenous species.
Instrument analysis: All 10 biological plasma samples were analyzed in triplicate; specifically three separate injections were made from the same extract vial. All sample injections were chromatographically separated using a Waters Acquity UPLC (Waters, Millford, MA). All samples were gradient-eluted at 350 µL/min using (A) 0.1% formic acid in water and (B) 0.1% formic acid in methanol (gradient profile: 0.5%-70% B in 4 min, 70-98% B in 0.5 min, 98% B for 0.9 min) using a 2.1 mm x 100 mm Waters BEH C18 1.7 µm particle column heated to 40ºC. A 5 µL aliquot of sample was injected using 2x overfill and analyzed using an LTQ ion-trap mass spectrometer (MS) (ThermoFisher Corp.) using electrospray ionization (ESI) (detailed MS conditions for positive ion analysis can be found in [22]). The extracts were monitored for positive ions. Injection order, including replicate injections, was randomized, i.e. the replicate injections were not analyzed back-to-back but rather at random times throughout the entire dataset. The instrument scanned 99-1000 m/z and alternated between MS and MS/MS scans utilizing dynamic exclusion at a rate of approximately six total scans/sec.
Data processing and analysis
Quality assessment: Once data collection was completed, the
process coefficients of variation (CVs) were checked for all standards to ensure high quality data including consistent and non-trending instrument response, consistent and non-trending chromatography, and extraction reproducibility. Retention time alignment via internal standards was also checked and validated.
Peak detection and integration: Peak detection and integration were performed by proprietary software, but any vendor-supplied or open access software is sufficient for peak detection and integration. The outcome from this process is a list of detected chromatographic peaks characterized with m/z, retention and area under the curve values. Raw MS data was smoothed with a five point Gaussian smooth, prior to peak detection. Criteria for peak detection included signal to noise threshold of five, height threshold of 2000, area threshold of 15000, and peak width threshold of 0.035 min.
Chromatographic alignment: All samples were aligned chromatographically based on spiked standards. These standards were given a fixed retention index (RI) value [22-24]. The RIs of the experimentally detected peaks were determined assuming a linear fit between their individual flanking markers. Therefore, each compound’s RI was based on its elution relationship to its two surrounding retention markers. This system corrects for any systematic errors in retention time relating to column age or sample pH by setting everything to a locked scale via the retention markers.
Ion-feature binning for reproducibility assessment: The resulting ion-feature list, organized by mass to charge (m/z), retention time/retention index and area, was processed per sample to find common ion features detected among the three replicates for the 10 different plasma samples or the five replicates among the water process blanks. To find and group common ion features among the replicate samples, ion feature data was binned by mass to charge and time [25]. Binning parameters included a mass window of 0.4 m/z and a 35 RI unit window (approximately two sec) for all but the end of the chromatography 0-6 min (~0-6000 RI) and then a 55 RI unit window (approximately three sec) was used from six minutes to the end of data acquisition (~6000-end RI).
Binning includes the following steps:
1. Sorting ions by their areas in descending order.
2. Bin ions with smaller areas around ions with larger areas, with the larger ions serving as the bin centers.
3. Calculate the statistics of each ion bin: mean mass, mean area, mean RI and their standard deviations, respectively, from all singlet ions in the bin.
4. Reset the bin center mass and center RI to its mean mass and mean RI to take into account the ion distribution within the bin. Remove all bins that have no singlet ions.
5. Re-binning all ions into these bins. If an ion can’t be binned into any of them, a new bin is created with its mass and RI as the center mass and RI.
6. Repeat steps 4 and 5 for optimized binning of all ions.
Bins were separated into groups by those with one out of the three common ion features per bin, two out of three common ion features per bin and so on. For those ion features binned and found in all three replicates, the average values of mass, area, and RI were calculated and stored.
Citation: Evans AM, Mitchell MW, Dai H, DeHaven CD (2012) Categorizing Ion-Features in Liquid Chromatography/Mass Spectrometry Metabolomics Data. Metabolomics 2:110. doi:10.4172/2153-0769.1000110
Page 3 of 8
Volume 2 • Issue 3 • 1000110MetabolomicsISSN:2153-0769 JOM an open access journal
Ion-feature bins grouped based on correlation: Only bins with ion-features detected in all three replicates and found in all 10 plasma samples were included in the correlation and grouping analysis. Due to study design (three replicates of 10 different plasma samples) correlation analysis could be skewed by the replicate injections of the same sample. For that reason, when correlation analysis was performed the mean area, mean RT, and the mean mass of the three ion-features per bin per plasma sample were used.
Software utilizing the QUICS method [25] was used to generate groups of ion features with high levels of correlation across all of the samples within the experiment. Each group is therefore composed of the various ion-features that are generated from any given molecule. Settings for the application of the method were that ions must fall within a 35 RI unit window and correlation must be greater than 0.7 across all samples. These groups were then compared to the internal spectral library for matching and identification against a library of standards. This methodology was particularly helpful in identifying in-source fragments and unique adduct and multimer combinations that did not have previously characterized mass relationships.
Identification of artifacts: Artifact detection logic was applied at the bin and group level. This was accomplished by comparing the bins and groups identified within the water process blanks and the experimental samples. Any bin or group found in the experimental samples that was also found in the water process blank samples whose area was not at least five times higher in the experimental samples was automatically marked as a potential artifact.
Compound identification: The resulting data was searched against an in-house chemical library generated by analyzing over 2000 authentic standards through the method described above. Identifications are therefore based on three criteria: retention index within 150 RI units of the proposed identification, experimentally detected precursor mass match to the authentic standard within 0.4 m/z and a MS/MS fragmentation spectral score. The MS/MS score is based on a comparison of the forward and reverse scores, specifically whether all the ions present in the authentic standard library entry are present and at the correct ratios in the experimental MS/MS spectrum and vice versa. All proposed library calls were hand curated by an analyst who ultimately was responsible for library identification being accepted or rejected based on the above stated criteria.
Ion-feature analysis: A detailed analysis of all reproducible ion-features detected (i.e. present in all three replicates) in plasma sample B was performed. This analysis first included identifying which ion-features were isotopes, adducts, protonated molecular ions, multicharged ions, amalgams, in-source fragments and multimers based on approved biochemicals. Approved biochemicals are those biochemicals that were detected and identified from the in-house spectral library and included known named biochemicals from authentic standard analysis, unknown biochemicals routinely detected and monitored standards and artifacts. After the ion-features that originated from these biochemicals were accounted for, the remaining ion-features were analyzed. The groups created by the correlation analysis aided in identifying ion-features that were related even if their chemical composition was unknown. This analysis is particularly helpful in identifying in-source fragments and unique adducts.
Results and DiscussionIon-feature reproducibility
How many of the ion-features detected are noise, i.e. non-
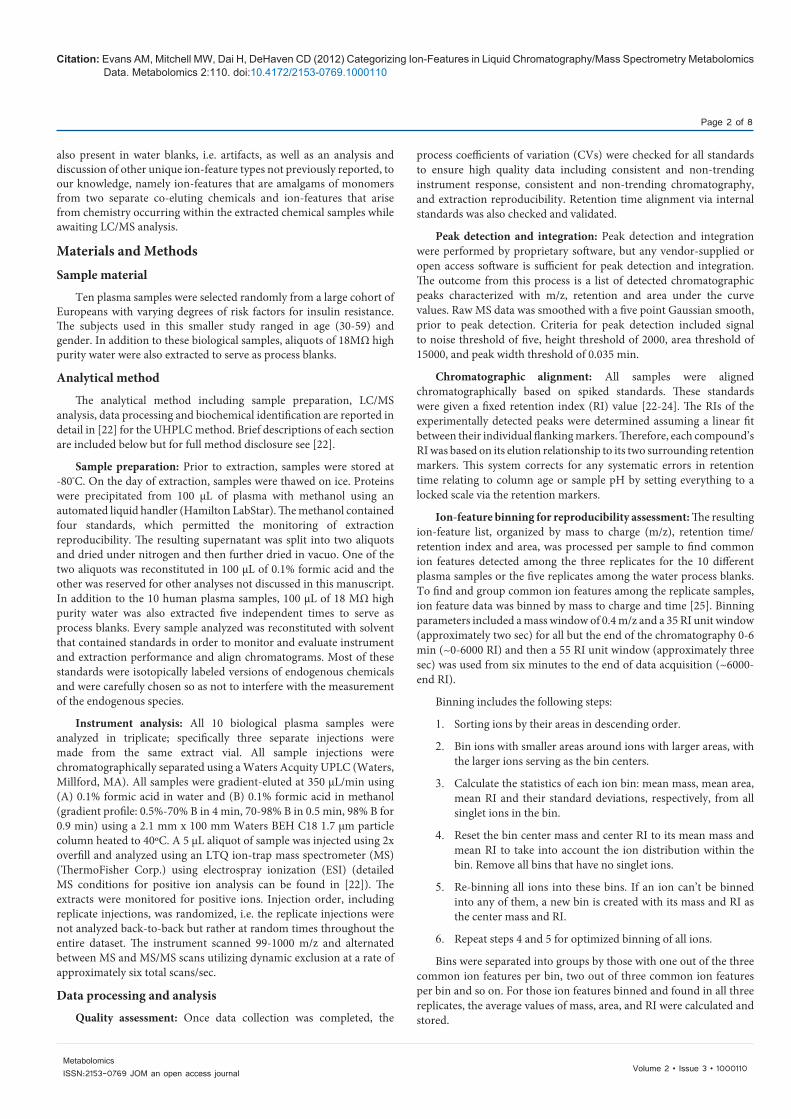
reproducible? In order to estimate this, each biological sample was run in triplicate. The ion-feature totals per replicate, per 10 biologically variant European plasma samples are shown (Figure 1). The total number of ion-features detected across the technical replicates and also from plasma-to-plasma sample does not vary highly. The similarity in ion-feature totals across the different plasma samples might be related to the highly homeostatic nature of plasma in healthy individuals. However, given human variability there were a significant number of ion-features that were only reproducibly detected in sub-fractions of the plasma samples tested, including a large number of ion-features only reproducibly detected in one out of the ten samples tested (Table 1). Many of these include OTC or prescription drugs and their metabolites as well as lifestyle indicators such as nicotine metabolites.
The technical replicate ion-feature totals within each plasma sample are also quite consistent (Figure 1). However, based on an analysis of the same ion-features showing up in these technical replicates, this consistency in total ion-feature counts is not an indication of a high degree of ion-feature reproducibility. An ion-feature was considered to be the same across replicates if the mass of the detected ion-feature was within a 0.4 m/z window and eluted within a ~2 sec window. The number of ion-features detected in all three technical replicates
Figure 1: Total number of Ion-features detected per plasma sample and per replicate. T1, T2, and T3 are technical replicates.
0
2000
4000
6000
8000
10000
12000
14000
Num
ber o
f Ion
-feat
ures
Det
ecte
d
Ion-feature Totals per Sample and Technical Replicate
T1
T2
T3
Number of Plasma Samples out of 10 Number of Reproducible Ion-feature Bins10 6889 2938 2487 2606 3275 3714 5683 7582 13961 3981
Table 1: The number of reproducible i.e. detected in all three technical replicates, ion-feature bins detected in varying sub-fractions of plasma samples. Eg. There were 260 reproducible ion-feature bins detected in 7 out of the 10 plasma samples.
Citation: Evans AM, Mitchell MW, Dai H, DeHaven CD (2012) Categorizing Ion-Features in Liquid Chromatography/Mass Spectrometry Metabolomics Data. Metabolomics 2:110. doi:10.4172/2153-0769.1000110
Page 4 of 8
Volume 2 • Issue 3 • 1000110MetabolomicsISSN:2153-0769 JOM an open access journal
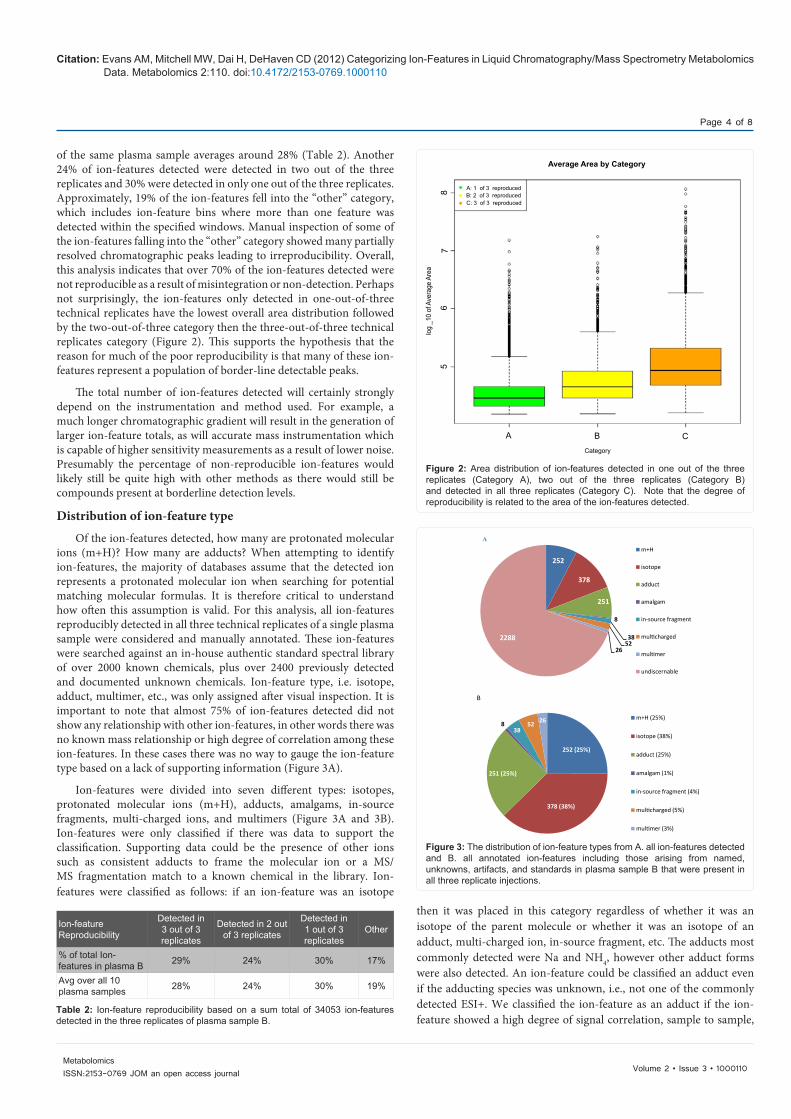
of the same plasma sample averages around 28% (Table 2). Another 24% of ion-features detected were detected in two out of the three replicates and 30% were detected in only one out of the three replicates. Approximately, 19% of the ion-features fell into the “other” category, which includes ion-feature bins where more than one feature was detected within the specified windows. Manual inspection of some of the ion-features falling into the “other” category showed many partially resolved chromatographic peaks leading to irreproducibility. Overall, this analysis indicates that over 70% of the ion-features detected were not reproducible as a result of misintegration or non-detection. Perhaps not surprisingly, the ion-features only detected in one-out-of-three technical replicates have the lowest overall area distribution followed by the two-out-of-three category then the three-out-of-three technical replicates category (Figure 2). This supports the hypothesis that the reason for much of the poor reproducibility is that many of these ion-features represent a population of border-line detectable peaks.
The total number of ion-features detected will certainly strongly depend on the instrumentation and method used. For example, a much longer chromatographic gradient will result in the generation of larger ion-feature totals, as will accurate mass instrumentation which is capable of higher sensitivity measurements as a result of lower noise. Presumably the percentage of non-reproducible ion-features would likely still be quite high with other methods as there would still be compounds present at borderline detection levels.
Distribution of ion-feature type
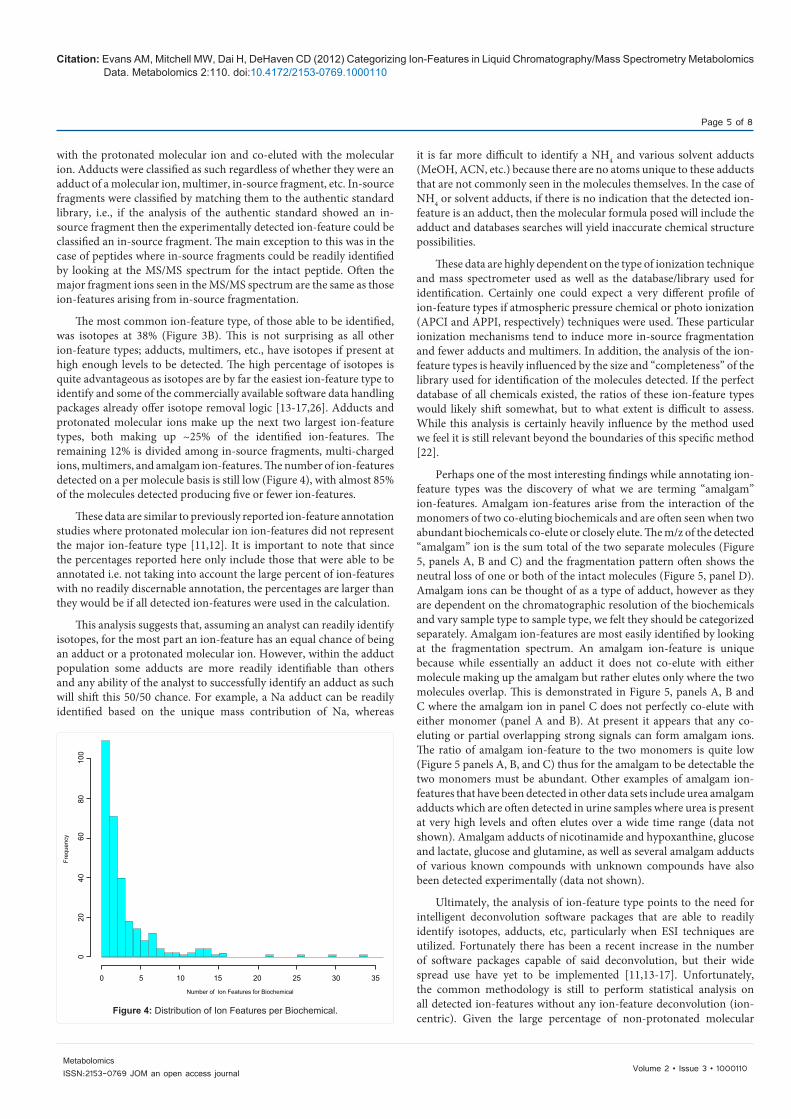
Of the ion-features detected, how many are protonated molecular ions (m+H)? How many are adducts? When attempting to identify ion-features, the majority of databases assume that the detected ion represents a protonated molecular ion when searching for potential matching molecular formulas. It is therefore critical to understand how often this assumption is valid. For this analysis, all ion-features reproducibly detected in all three technical replicates of a single plasma sample were considered and manually annotated. These ion-features were searched against an in-house authentic standard spectral library of over 2000 known chemicals, plus over 2400 previously detected and documented unknown chemicals. Ion-feature type, i.e. isotope, adduct, multimer, etc., was only assigned after visual inspection. It is important to note that almost 75% of ion-features detected did not show any relationship with other ion-features, in other words there was no known mass relationship or high degree of correlation among these ion-features. In these cases there was no way to gauge the ion-feature type based on a lack of supporting information (Figure 3A).
Ion-features were divided into seven different types: isotopes, protonated molecular ions (m+H), adducts, amalgams, in-source fragments, multi-charged ions, and multimers (Figure 3A and 3B). Ion-features were only classified if there was data to support the classification. Supporting data could be the presence of other ions such as consistent adducts to frame the molecular ion or a MS/MS fragmentation match to a known chemical in the library. Ion-features were classified as follows: if an ion-feature was an isotope
then it was placed in this category regardless of whether it was an isotope of the parent molecule or whether it was an isotope of an adduct, multi-charged ion, in-source fragment, etc. The adducts most commonly detected were Na and NH4, however other adduct forms were also detected. An ion-feature could be classified an adduct even if the adducting species was unknown, i.e., not one of the commonly detected ESI+. We classified the ion-feature as an adduct if the ion-feature showed a high degree of signal correlation, sample to sample,
Ion-feature Reproducibility
Detected in 3 out of 3 replicates
Detected in 2 out of 3 replicates
Detected in 1 out of 3 replicates
Other
% of total Ion-features in plasma B 29% 24% 30% 17%
Avg over all 10 plasma samples 28% 24% 30% 19%
Table 2: Ion-feature reproducibility based on a sum total of 34053 ion-features detected in the three replicates of plasma sample B.
Figure 2: Area distribution of ion-features detected in one out of the three replicates (Category A), two out of the three replicates (Category B) and detected in all three replicates (Category C). Note that the degree of reproducibility is related to the area of the ion-features detected.
8 7
65
A B CCategory
Average Area by Category
A: 1 of 3 reproducedB: 2 of 3 reproducedC: 3 of 3 reproduced
log
_10
of A
vera
ge A
rea
Figure 3: The distribution of ion-feature types from A. all ion-features detected and B. all annotated ion-features including those arising from named, unknowns, artifacts, and standards in plasma sample B that were present in all three replicate injections.
252
378
251
8
3852
26
2288
m+H
isotope
adduct
amalgam
in-source fragment
multicharged
multimer
undiscernable
A
252 (25%)
378 (38%)
251 (25%)
838
52 26 m+H (25%)
isotope (38%)
adduct (25%)
amalgam (1%)
in-source fragment (4%)
multicharged (5%)
multimer (3%)
B
Citation: Evans AM, Mitchell MW, Dai H, DeHaven CD (2012) Categorizing Ion-Features in Liquid Chromatography/Mass Spectrometry Metabolomics Data. Metabolomics 2:110. doi:10.4172/2153-0769.1000110
Page 5 of 8
Volume 2 • Issue 3 • 1000110MetabolomicsISSN:2153-0769 JOM an open access journal
with the protonated molecular ion and co-eluted with the molecular ion. Adducts were classified as such regardless of whether they were an adduct of a molecular ion, multimer, in-source fragment, etc. In-source fragments were classified by matching them to the authentic standard library, i.e., if the analysis of the authentic standard showed an in-source fragment then the experimentally detected ion-feature could be classified an in-source fragment. The main exception to this was in the case of peptides where in-source fragments could be readily identified by looking at the MS/MS spectrum for the intact peptide. Often the major fragment ions seen in the MS/MS spectrum are the same as those ion-features arising from in-source fragmentation.
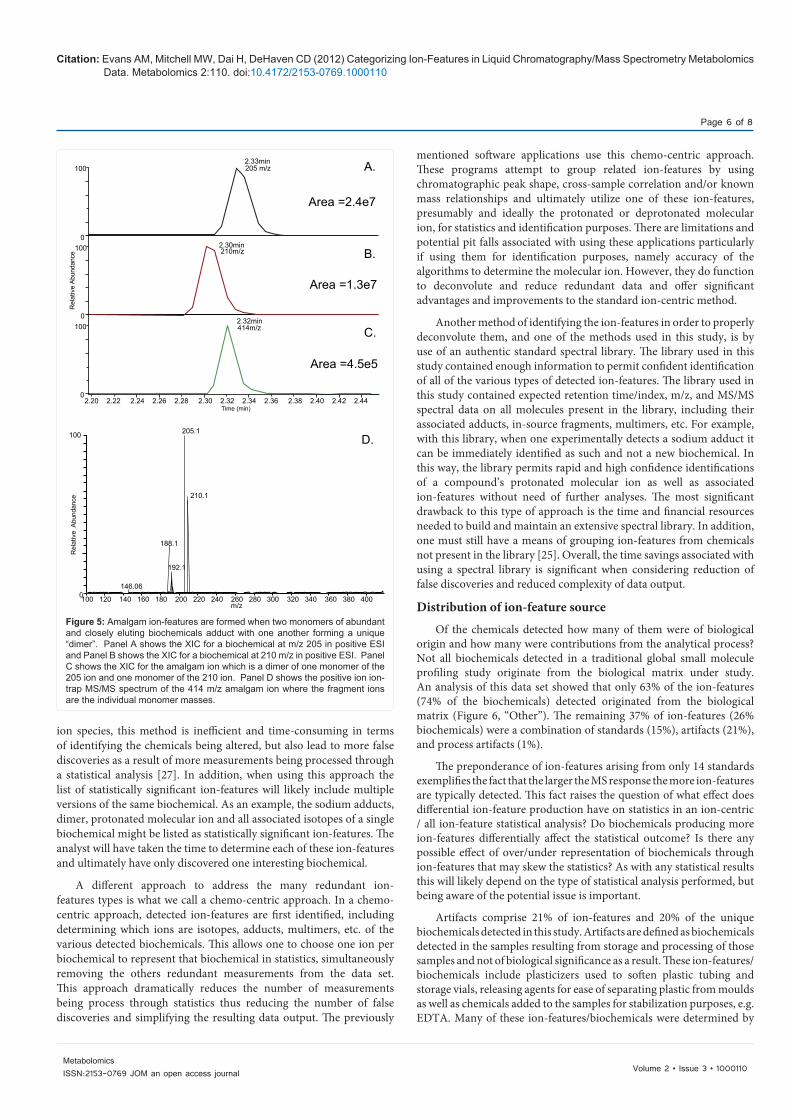
The most common ion-feature type, of those able to be identified, was isotopes at 38% (Figure 3B). This is not surprising as all other ion-feature types; adducts, multimers, etc., have isotopes if present at high enough levels to be detected. The high percentage of isotopes is quite advantageous as isotopes are by far the easiest ion-feature type to identify and some of the commercially available software data handling packages already offer isotope removal logic [13-17,26]. Adducts and protonated molecular ions make up the next two largest ion-feature types, both making up ~25% of the identified ion-features. The remaining 12% is divided among in-source fragments, multi-charged ions, multimers, and amalgam ion-features. The number of ion-features detected on a per molecule basis is still low (Figure 4), with almost 85% of the molecules detected producing five or fewer ion-features.
These data are similar to previously reported ion-feature annotation studies where protonated molecular ion ion-features did not represent the major ion-feature type [11,12]. It is important to note that since the percentages reported here only include those that were able to be annotated i.e. not taking into account the large percent of ion-features with no readily discernable annotation, the percentages are larger than they would be if all detected ion-features were used in the calculation.
This analysis suggests that, assuming an analyst can readily identify isotopes, for the most part an ion-feature has an equal chance of being an adduct or a protonated molecular ion. However, within the adduct population some adducts are more readily identifiable than others and any ability of the analyst to successfully identify an adduct as such will shift this 50/50 chance. For example, a Na adduct can be readily identified based on the unique mass contribution of Na, whereas
it is far more difficult to identify a NH4 and various solvent adducts (MeOH, ACN, etc.) because there are no atoms unique to these adducts that are not commonly seen in the molecules themselves. In the case of NH4 or solvent adducts, if there is no indication that the detected ion-feature is an adduct, then the molecular formula posed will include the adduct and databases searches will yield inaccurate chemical structure possibilities.
These data are highly dependent on the type of ionization technique and mass spectrometer used as well as the database/library used for identification. Certainly one could expect a very different profile of ion-feature types if atmospheric pressure chemical or photo ionization (APCI and APPI, respectively) techniques were used. These particular ionization mechanisms tend to induce more in-source fragmentation and fewer adducts and multimers. In addition, the analysis of the ion-feature types is heavily influenced by the size and “completeness” of the library used for identification of the molecules detected. If the perfect database of all chemicals existed, the ratios of these ion-feature types would likely shift somewhat, but to what extent is difficult to assess. While this analysis is certainly heavily influence by the method used we feel it is still relevant beyond the boundaries of this specific method [22].
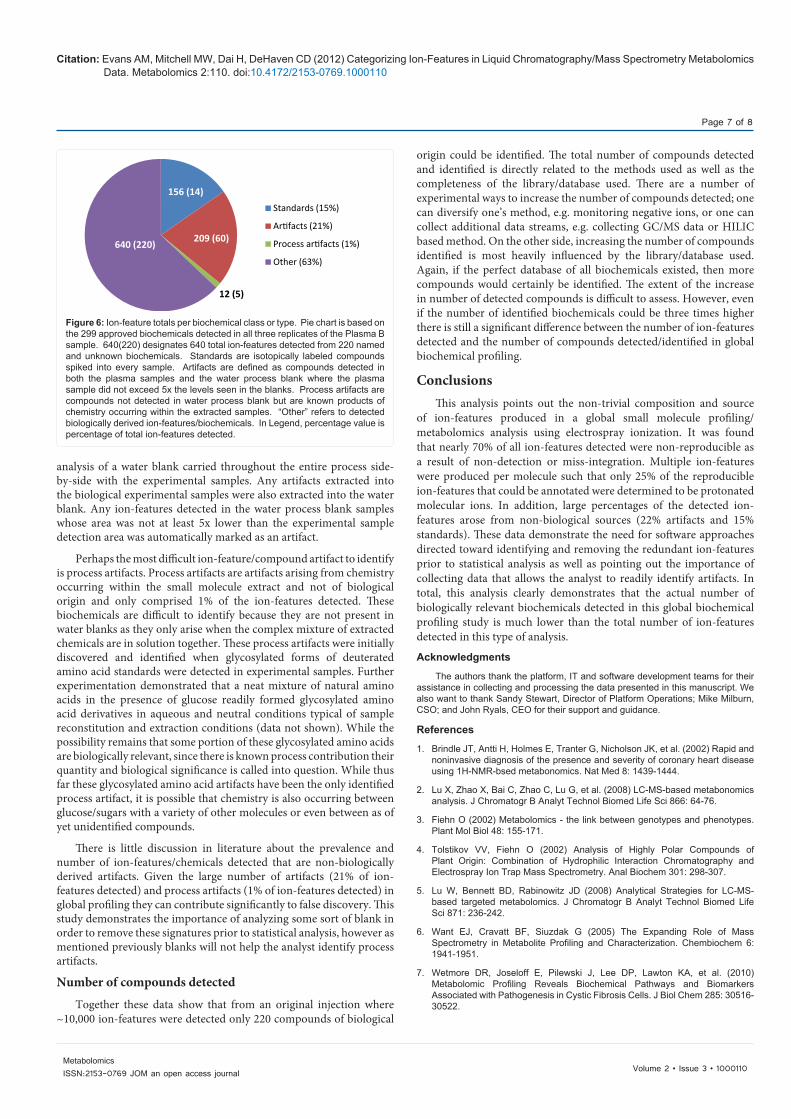
Perhaps one of the most interesting findings while annotating ion-feature types was the discovery of what we are terming “amalgam” ion-features. Amalgam ion-features arise from the interaction of the monomers of two co-eluting biochemicals and are often seen when two abundant biochemicals co-elute or closely elute. The m/z of the detected “amalgam” ion is the sum total of the two separate molecules (Figure 5, panels A, B and C) and the fragmentation pattern often shows the neutral loss of one or both of the intact molecules (Figure 5, panel D). Amalgam ions can be thought of as a type of adduct, however as they are dependent on the chromatographic resolution of the biochemicals and vary sample type to sample type, we felt they should be categorized separately. Amalgam ion-features are most easily identified by looking at the fragmentation spectrum. An amalgam ion-feature is unique because while essentially an adduct it does not co-elute with either molecule making up the amalgam but rather elutes only where the two molecules overlap. This is demonstrated in Figure 5, panels A, B and C where the amalgam ion in panel C does not perfectly co-elute with either monomer (panel A and B). At present it appears that any co-eluting or partial overlapping strong signals can form amalgam ions. The ratio of amalgam ion-feature to the two monomers is quite low (Figure 5 panels A, B, and C) thus for the amalgam to be detectable the two monomers must be abundant. Other examples of amalgam ion-features that have been detected in other data sets include urea amalgam adducts which are often detected in urine samples where urea is present at very high levels and often elutes over a wide time range (data not shown). Amalgam adducts of nicotinamide and hypoxanthine, glucose and lactate, glucose and glutamine, as well as several amalgam adducts of various known compounds with unknown compounds have also been detected experimentally (data not shown).
Ultimately, the analysis of ion-feature type points to the need for intelligent deconvolution software packages that are able to readily identify isotopes, adducts, etc, particularly when ESI techniques are utilized. Fortunately there has been a recent increase in the number of software packages capable of said deconvolution, but their wide spread use have yet to be implemented [11,13-17]. Unfortunately, the common methodology is still to perform statistical analysis on all detected ion-features without any ion-feature deconvolution (ion-centric). Given the large percentage of non-protonated molecular
Figure 4: Distribution of Ion Features per Biochemical.
0
20
40
60
80
100
0 5 10 15 20 25 30 35
Number of lon Features for Biochemical
Freq
uenc
y
Citation: Evans AM, Mitchell MW, Dai H, DeHaven CD (2012) Categorizing Ion-Features in Liquid Chromatography/Mass Spectrometry Metabolomics Data. Metabolomics 2:110. doi:10.4172/2153-0769.1000110
Page 6 of 8
Volume 2 • Issue 3 • 1000110MetabolomicsISSN:2153-0769 JOM an open access journal
ion species, this method is inefficient and time-consuming in terms of identifying the chemicals being altered, but also lead to more false discoveries as a result of more measurements being processed through a statistical analysis [27]. In addition, when using this approach the list of statistically significant ion-features will likely include multiple versions of the same biochemical. As an example, the sodium adducts, dimer, protonated molecular ion and all associated isotopes of a single biochemical might be listed as statistically significant ion-features. The analyst will have taken the time to determine each of these ion-features and ultimately have only discovered one interesting biochemical.
A different approach to address the many redundant ion-features types is what we call a chemo-centric approach. In a chemo-centric approach, detected ion-features are first identified, including determining which ions are isotopes, adducts, multimers, etc. of the various detected biochemicals. This allows one to choose one ion per biochemical to represent that biochemical in statistics, simultaneously removing the others redundant measurements from the data set. This approach dramatically reduces the number of measurements being process through statistics thus reducing the number of false discoveries and simplifying the resulting data output. The previously
mentioned software applications use this chemo-centric approach. These programs attempt to group related ion-features by using chromatographic peak shape, cross-sample correlation and/or known mass relationships and ultimately utilize one of these ion-features, presumably and ideally the protonated or deprotonated molecular ion, for statistics and identification purposes. There are limitations and potential pit falls associated with using these applications particularly if using them for identification purposes, namely accuracy of the algorithms to determine the molecular ion. However, they do function to deconvolute and reduce redundant data and offer significant advantages and improvements to the standard ion-centric method.
Another method of identifying the ion-features in order to properly deconvolute them, and one of the methods used in this study, is by use of an authentic standard spectral library. The library used in this study contained enough information to permit confident identification of all of the various types of detected ion-features. The library used in this study contained expected retention time/index, m/z, and MS/MS spectral data on all molecules present in the library, including their associated adducts, in-source fragments, multimers, etc. For example, with this library, when one experimentally detects a sodium adduct it can be immediately identified as such and not a new biochemical. In this way, the library permits rapid and high confidence identifications of a compound’s protonated molecular ion as well as associated ion-features without need of further analyses. The most significant drawback to this type of approach is the time and financial resources needed to build and maintain an extensive spectral library. In addition, one must still have a means of grouping ion-features from chemicals not present in the library [25]. Overall, the time savings associated with using a spectral library is significant when considering reduction of false discoveries and reduced complexity of data output.
Distribution of ion-feature source
Of the chemicals detected how many of them were of biological origin and how many were contributions from the analytical process? Not all biochemicals detected in a traditional global small molecule profiling study originate from the biological matrix under study. An analysis of this data set showed that only 63% of the ion-features (74% of the biochemicals) detected originated from the biological matrix (Figure 6, “Other”). The remaining 37% of ion-features (26% biochemicals) were a combination of standards (15%), artifacts (21%), and process artifacts (1%).
The preponderance of ion-features arising from only 14 standards exemplifies the fact that the larger the MS response the more ion-features are typically detected. This fact raises the question of what effect does differential ion-feature production have on statistics in an ion-centric / all ion-feature statistical analysis? Do biochemicals producing more ion-features differentially affect the statistical outcome? Is there any possible effect of over/under representation of biochemicals through ion-features that may skew the statistics? As with any statistical results this will likely depend on the type of statistical analysis performed, but being aware of the potential issue is important.
Artifacts comprise 21% of ion-features and 20% of the unique biochemicals detected in this study. Artifacts are defined as biochemicals detected in the samples resulting from storage and processing of those samples and not of biological significance as a result. These ion-features/biochemicals include plasticizers used to soften plastic tubing and storage vials, releasing agents for ease of separating plastic from moulds as well as chemicals added to the samples for stabilization purposes, e.g. EDTA. Many of these ion-features/biochemicals were determined by
Figure 5: Amalgam ion-features are formed when two monomers of abundant and closely eluting biochemicals adduct with one another forming a unique “dimer”. Panel A shows the XIC for a biochemical at m/z 205 in positive ESI and Panel B shows the XIC for a biochemical at 210 m/z in positive ESI. Panel C shows the XIC for the amalgam ion which is a dimer of one monomer of the 205 ion and one monomer of the 210 ion. Panel D shows the positive ion ion-trap MS/MS spectrum of the 414 m/z amalgam ion where the fragment ions are the individual monomer masses.
2.20 2.22 2.24 2.26 2.28 2.30 2.32 2.34 2.36 2.38 2.40 2.42 2.44
100
100
100
100
100 120 140 160 180 200 220 240 260 280 300 320 340 360 380 400
0
0
0
0
2.33min205 m/z
Area =2.4e7
A.
B.
C.
D.
2.30min210m/z
Area =1.3e7
Area =4.5e5
2.32min414m/z
205.1
210.1
146.06
188.1
192.1
m/z
Rel
ativ
e A
bund
ance
Rel
ativ
e Ab
unda
nce
Time (min)
Citation: Evans AM, Mitchell MW, Dai H, DeHaven CD (2012) Categorizing Ion-Features in Liquid Chromatography/Mass Spectrometry Metabolomics Data. Metabolomics 2:110. doi:10.4172/2153-0769.1000110
Page 7 of 8
Volume 2 • Issue 3 • 1000110MetabolomicsISSN:2153-0769 JOM an open access journal
analysis of a water blank carried throughout the entire process side-by-side with the experimental samples. Any artifacts extracted into the biological experimental samples were also extracted into the water blank. Any ion-features detected in the water process blank samples whose area was not at least 5x lower than the experimental sample detection area was automatically marked as an artifact.
Perhaps the most difficult ion-feature/compound artifact to identify is process artifacts. Process artifacts are artifacts arising from chemistry occurring within the small molecule extract and not of biological origin and only comprised 1% of the ion-features detected. These biochemicals are difficult to identify because they are not present in water blanks as they only arise when the complex mixture of extracted chemicals are in solution together. These process artifacts were initially discovered and identified when glycosylated forms of deuterated amino acid standards were detected in experimental samples. Further experimentation demonstrated that a neat mixture of natural amino acids in the presence of glucose readily formed glycosylated amino acid derivatives in aqueous and neutral conditions typical of sample reconstitution and extraction conditions (data not shown). While the possibility remains that some portion of these glycosylated amino acids are biologically relevant, since there is known process contribution their quantity and biological significance is called into question. While thus far these glycosylated amino acid artifacts have been the only identified process artifact, it is possible that chemistry is also occurring between glucose/sugars with a variety of other molecules or even between as of yet unidentified compounds.
There is little discussion in literature about the prevalence and number of ion-features/chemicals detected that are non-biologically derived artifacts. Given the large number of artifacts (21% of ion-features detected) and process artifacts (1% of ion-features detected) in global profiling they can contribute significantly to false discovery. This study demonstrates the importance of analyzing some sort of blank in order to remove these signatures prior to statistical analysis, however as mentioned previously blanks will not help the analyst identify process artifacts.
Number of compounds detected
Together these data show that from an original injection where ~10,000 ion-features were detected only 220 compounds of biological
origin could be identified. The total number of compounds detected and identified is directly related to the methods used as well as the completeness of the library/database used. There are a number of experimental ways to increase the number of compounds detected; one can diversify one’s method, e.g. monitoring negative ions, or one can collect additional data streams, e.g. collecting GC/MS data or HILIC based method. On the other side, increasing the number of compounds identified is most heavily influenced by the library/database used. Again, if the perfect database of all biochemicals existed, then more compounds would certainly be identified. The extent of the increase in number of detected compounds is difficult to assess. However, even if the number of identified biochemicals could be three times higher there is still a significant difference between the number of ion-features detected and the number of compounds detected/identified in global biochemical profiling.
ConclusionsThis analysis points out the non-trivial composition and source
of ion-features produced in a global small molecule profiling/metabolomics analysis using electrospray ionization. It was found that nearly 70% of all ion-features detected were non-reproducible as a result of non-detection or miss-integration. Multiple ion-features were produced per molecule such that only 25% of the reproducible ion-features that could be annotated were determined to be protonated molecular ions. In addition, large percentages of the detected ion-features arose from non-biological sources (22% artifacts and 15% standards). These data demonstrate the need for software approaches directed toward identifying and removing the redundant ion-features prior to statistical analysis as well as pointing out the importance of collecting data that allows the analyst to readily identify artifacts. In total, this analysis clearly demonstrates that the actual number of biologically relevant biochemicals detected in this global biochemical profiling study is much lower than the total number of ion-features detected in this type of analysis.
Acknowledgments
The authors thank the platform, IT and software development teams for their assistance in collecting and processing the data presented in this manuscript. We also want to thank Sandy Stewart, Director of Platform Operations; Mike Milburn, CSO; and John Ryals, CEO for their support and guidance.
References
1. Brindle JT, Antti H, Holmes E, Tranter G, Nicholson JK, et al. (2002) Rapid and noninvasive diagnosis of the presence and severity of coronary heart disease using 1H-NMR-bsed metabonomics. Nat Med 8: 1439-1444.
2. Lu X, Zhao X, Bai C, Zhao C, Lu G, et al. (2008) LC-MS-based metabonomics analysis. J Chromatogr B Analyt Technol Biomed Life Sci 866: 64-76.
3. Fiehn O (2002) Metabolomics - the link between genotypes and phenotypes. Plant Mol Biol 48: 155-171.
4. Tolstikov VV, Fiehn O (2002) Analysis of Highly Polar Compounds of Plant Origin: Combination of Hydrophilic Interaction Chromatography and Electrospray Ion Trap Mass Spectrometry. Anal Biochem 301: 298-307.
5. Lu W, Bennett BD, Rabinowitz JD (2008) Analytical Strategies for LC-MS-based targeted metabolomics. J Chromatogr B Analyt Technol Biomed Life Sci 871: 236-242.
6. Want EJ, Cravatt BF, Siuzdak G (2005) The Expanding Role of Mass Spectrometry in Metabolite Profiling and Characterization. Chembiochem 6: 1941-1951.
7. Wetmore DR, Joseloff E, Pilewski J, Lee DP, Lawton KA, et al. (2010) Metabolomic Profiling Reveals Biochemical Pathways and Biomarkers Associated with Pathogenesis in Cystic Fibrosis Cells. J Biol Chem 285: 30516-30522.
Figure 6: Ion-feature totals per biochemical class or type. Pie chart is based on the 299 approved biochemicals detected in all three replicates of the Plasma B sample. 640(220) designates 640 total ion-features detected from 220 named and unknown biochemicals. Standards are isotopically labeled compounds spiked into every sample. Artifacts are defined as compounds detected in both the plasma samples and the water process blank where the plasma sample did not exceed 5x the levels seen in the blanks. Process artifacts are compounds not detected in water process blank but are known products of chemistry occurring within the extracted samples. “Other” refers to detected biologically derived ion-features/biochemicals. In Legend, percentage value is percentage of total ion-features detected.
156 (14)
209 (60)
12 (5)
640 (220)
Standards (15%)
Artifacts (21%)
Process artifacts (1%)
Other (63%)
Citation: Evans AM, Mitchell MW, Dai H, DeHaven CD (2012) Categorizing Ion-Features in Liquid Chromatography/Mass Spectrometry Metabolomics Data. Metabolomics 2:110. doi:10.4172/2153-0769.1000110
Page 8 of 8
Volume 2 • Issue 3 • 1000110MetabolomicsISSN:2153-0769 JOM an open access journal
8. Sha W, da Costa KA, Fischer LM, Milburn MV, Lawton KA, et al. (2010) Metabolic profiling can predict which humans will develop liver dysfunction when deprived of dietary choline. FASEB J 24: 2962-2975.
9. Boudonck KJ, Mitchell MW, Német L, Keresztes L, Nyska A, et al. (2009) Discovery of Metabolomics Biomarkers for Early Detection of Nephrotoxicity. Toxicol Pathol 37: 280-292.
10. Watson M, Roulston A, Bélec L, Billot X, Marcellus R, et al. (2009) The Small Molecule GMX1778 is a Potent Inhibitor of NAD+ Biosynthesis: Strategy for Enhanced Therapy in NAPRT1-Deficient Tumors. Mol Cell Biol 29: 5872-5888.
11. Scheltema R, Decuypere S, Dujardin J, Watson D, Jansen R, et al. (2009) Simple data-reduction method for high-resolution LC-MS data in metabolomics. Bioanalysis 1: 1551-1557.
12. Brown M, Dunn WB, Dobson P, Patel Y, Winder CL, et al. (2009) Mass spectrometry tools and metabolite-specific databases for molecular identification in metabolomics. Analyst 134: 1322-1332.
13. Tautenhahn R, Bottcher C, Neumann S (2007) Annotation of LC/ESI-MS Mass Signals. Bioinformatics Research and Development 4414/2007: 371-380.
14. Alonso A, Julià A, Beltran A, Vinaixa M, Díaz M, et al. (2011) AStream: an R package for annotating LC/MS metabolomic data. Bioinformatics 27: 1339-1340.
15. Kuhl C, Tautenhahn R, Böttcher C, Larson TR, Neumann S (2012) CAMERA: An Integrated Strategy for Compound Spectra Extraction and Annotation of Liquid Chromatography/Mass Spectrometry Data Sets. Anal Chem 84: 283-289.
16. Scheltema RA, Jankevics A, Jansen RC, Swertz MA, Breitling R (2011) PeakML/mzMatch: A File Format, Java Library, R Library, and Tool-Chain for Mass Spectrometry Data Analysis. Anal Chem 83: 2786-2793.
17. Brown M, Wedge DC, Goodacre R, Kell DB, Baker PN, et al. (2011) Automated
workflows for accurate mass-based putative metabolite identification in LC/MS-derived metabolomic datasets. Bioinformatics 27: 1108-1112.
18. Clarke CJ, Haselden JN (2008) Metabolic Profiling as a Tool for Understanding Mechanisms of Toxicity. Toxicol Pathol 36: 140-147.
19. Roy SM, Anderle M, Lin H, Becker CH (2004) Differencial expression profiling of serum proteins and metabolites for biomarker discovery. Int J Mass Spectrom 238: 163-171.
20. Yang F, Yan S, Wang F, He Y, Guo Y, et al. (2008) DNA Immunization Perturbs Lipid Metabolites and Increases Risk of Atherogenesis. J Proteome Res 7: 741-748.
21. Shen Y, Zhang R, Moore RJ, Kim J, Metz TO, et al. (2005) Automated 20kpsi RPLC-MS and MS/MS with Chromtagraphic Peak Capacities of 1000-1500 and Capabilities in Proteomics and Metabolomics. Anal Chem 77: 3090-3100.
22. Evans A, DeHaven CD, Barrett T, Mitchell M, Milgram E (2009) Integrated, Non-targeted Ultrahigh Performance Liquid Chromatography/Electrospray Ionization Tandem Mass Spectrometry Platform for the Identification and Relative Quantification of the Small-Molecule Complement of Biological Systems. Anal Chem 81: 6656-6667.
23. Halket JM, Waterman D, Przyborowska AM, Patel RK, Fraser PD, et al. (2005) Chemical derivatization and mass spectral libraries in metabolic profiling by GC/MS and LC/MS/MS. J Exp Bot 56: 219-243.
24. IUPAC (1997) Compendium of Chemical Terminology, 2nd ed. (the “Gold Book”). Blackwell Scientific Publications, Oxford.
25. Dehaven CD, Evans AM, Dai H, Lawton KA (2010) Organization of GC/MS and LC/MS metabolomics data into chemical libraries. J Cheminform 2: 9.
26. Katajamaa M, Oresic M (2007) Data Processing for mass spectrometry-based metabolomics. J Chromatogr A 1158: 318-328.
27. Broadhurst DI, Kell DB (2006) Statistical strategies for avoiding false discoveries in metabolomics and related experiments. Metabolomics 2: 171-196.
Submit your next manuscript and get advantages of OMICS Group submissionsUnique features:
• Userfriendly/feasiblewebsite-translationofyourpaperto50world’sleadinglanguages• AudioVersionofpublishedpaper• Digitalarticlestoshareandexplore
Special features:
• 200OpenAccessJournals• 15,000editorialteam• 21daysrapidreviewprocess• Qualityandquickeditorial,reviewandpublicationprocessing• IndexingatPubMed(partial),Scopus,DOAJ,EBSCO,IndexCopernicusandGoogleScholaretc• SharingOption:SocialNetworkingEnabled• Authors,ReviewersandEditorsrewardedwithonlineScientificCredits• Betterdiscountforyoursubsequentarticles
Submityourmanuscriptat:http://www.omicsonline.org/submission/