Embed Size (px)
Citation preview
Metabolomics
Gabi Kastenmüller
Helmholtz Zentrum München Institute of Bioinformatics and Systems Biology
Munich, 17.02.16
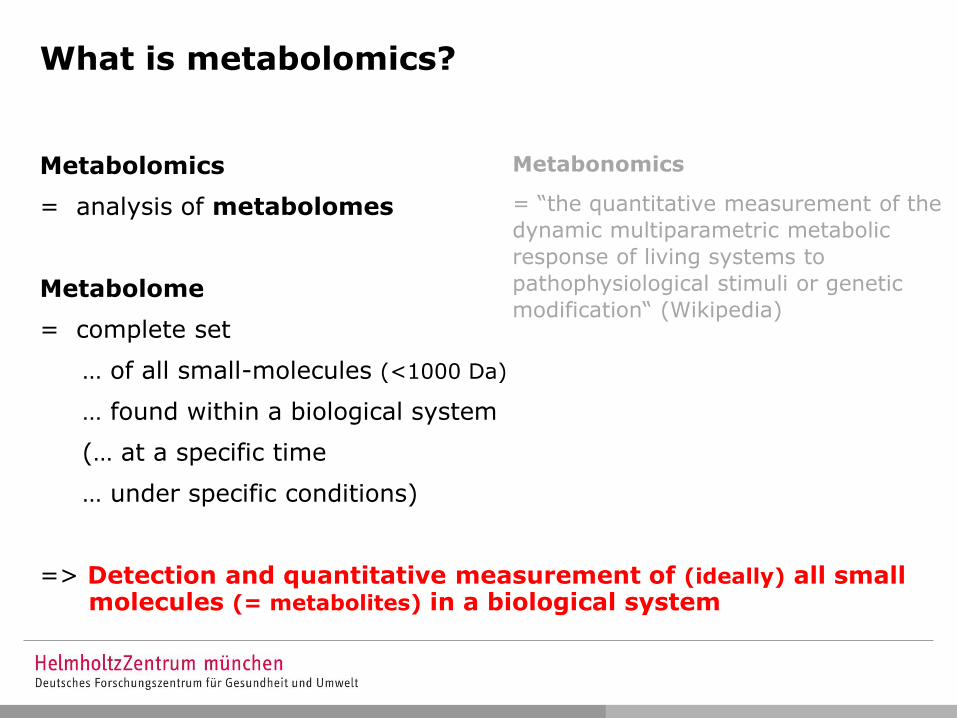
What is metabolomics?
Metabolomics
= analysis of metabolomes
Metabolome
= complete set
… of all small-molecules (<1000 Da)
… found within a biological system
(… at a specific time
… under specific conditions)
=> Detection and quantitative measurement of (ideally) all small molecules (= metabolites) in a biological system
Metabonomics
= “the quantitative measurement of the
dynamic multiparametric metabolic
response of living systems to
pathophysiological stimuli or genetic
modification“ (Wikipedia)
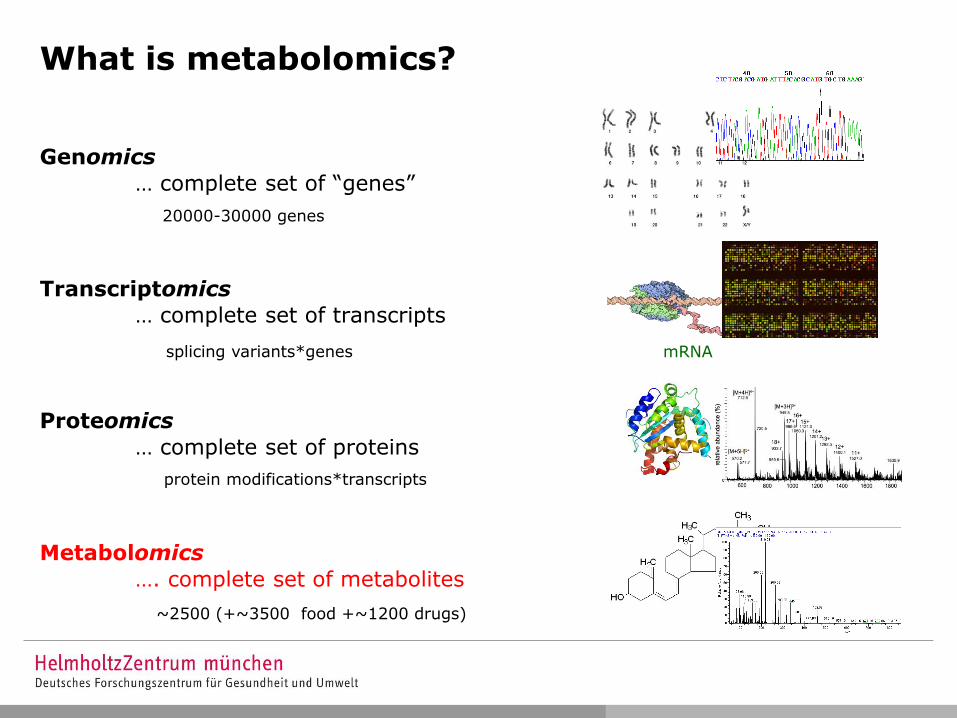
What is metabolomics?
Genomics
Transcriptomics
Proteomics
Metabolomics
20000-30000 genes
splicing variants*genes
protein modifications*transcripts
~2500 (+~3500 food +~1200 drugs)
DNA
mRNA
… complete set of “genes”
… complete set of transcripts
… complete set of proteins
…. complete set of metabolites
© KEGG
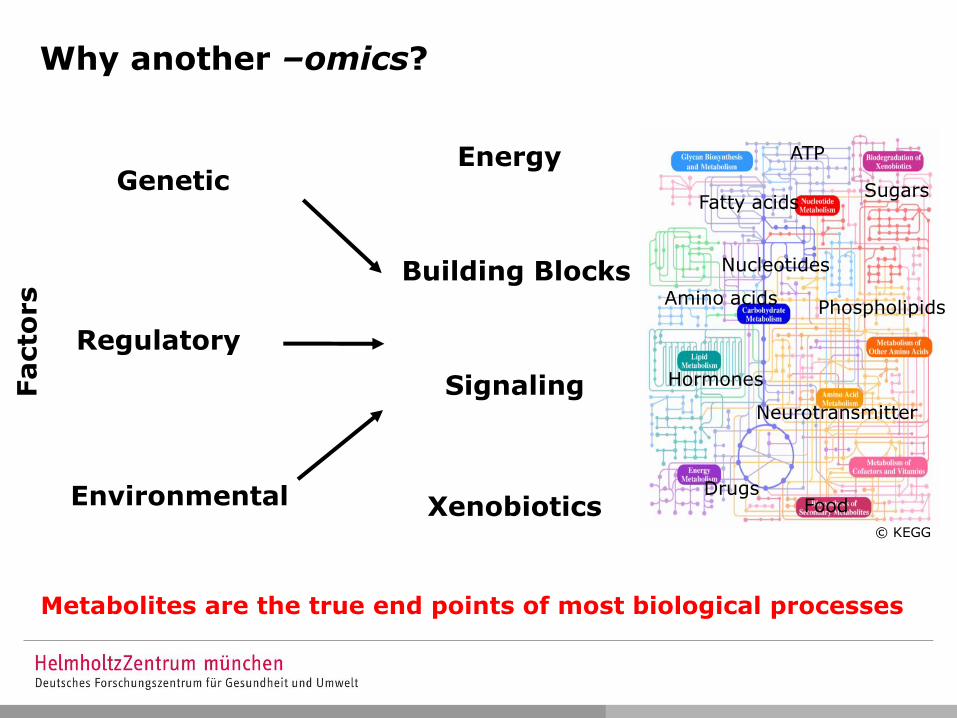
Why another –omics?
Signaling
Energy
Building Blocks
Xenobiotics
Metabolites are the true end points of most biological processes
Genetic
Regulatory
Environmental
Facto
rs
Fatty acids Sugars
ATP
Hormones
Amino acids
Neurotransmitter
Drugs
Nucleotides
Phospholipids
Food
© Metabolon
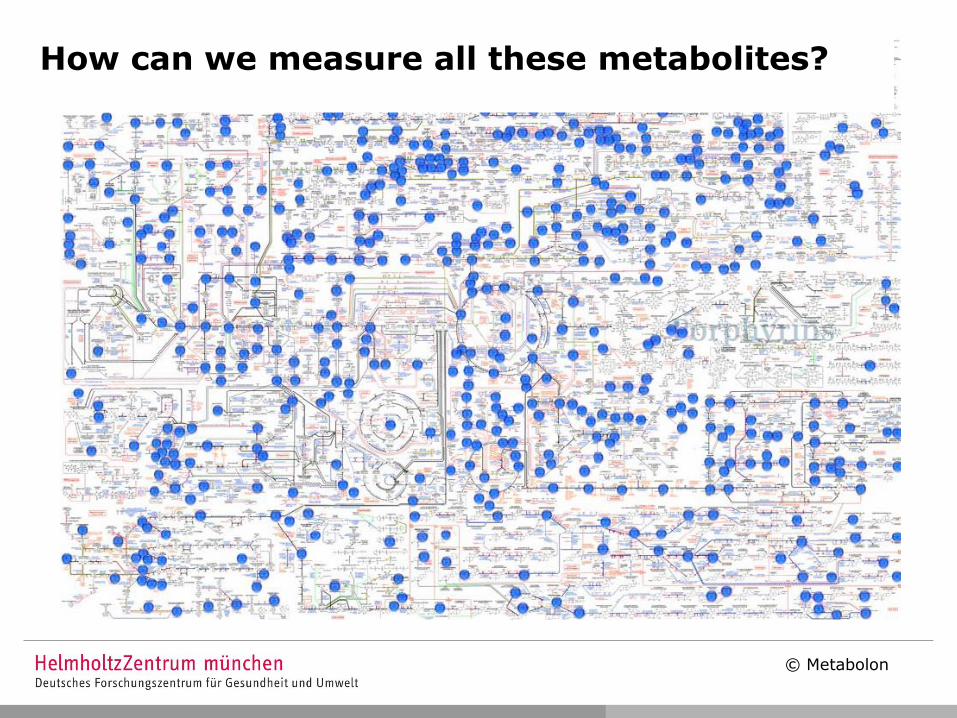
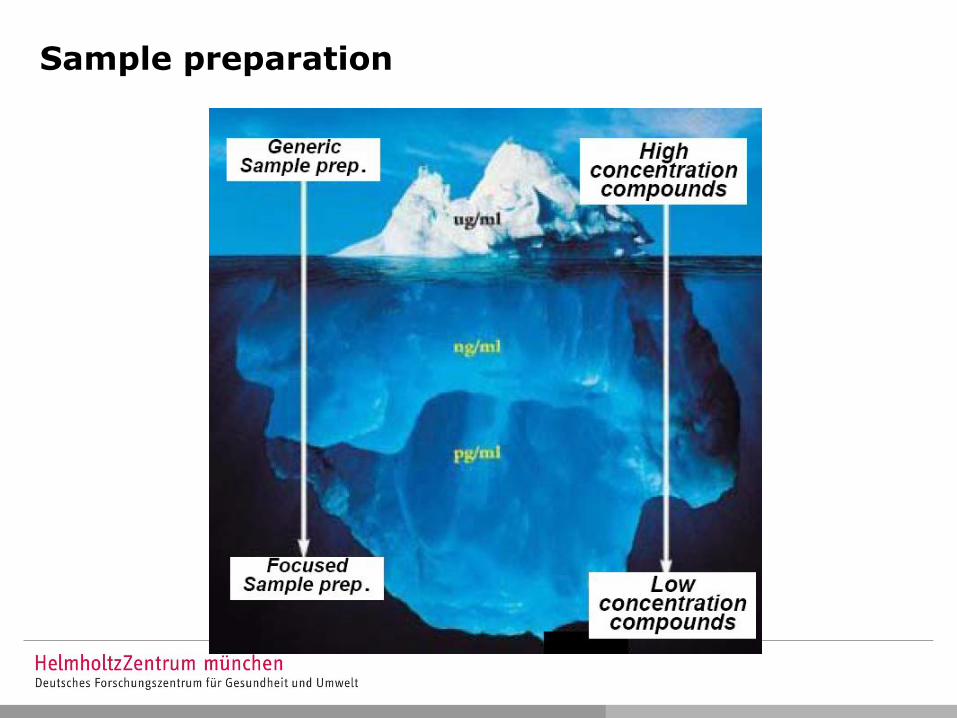
How can we measure all these metabolites?
EXPERIMENTAL BACKGROUND
SAMPLE COLLECTION
Sample types
• Cerebrospinal Fluid
• Peritoneal Fluid
• Saliva
• Sweat
• Tears
• Feces
• Breath air/condensate
• Blood
• Urine
• Further body fluids
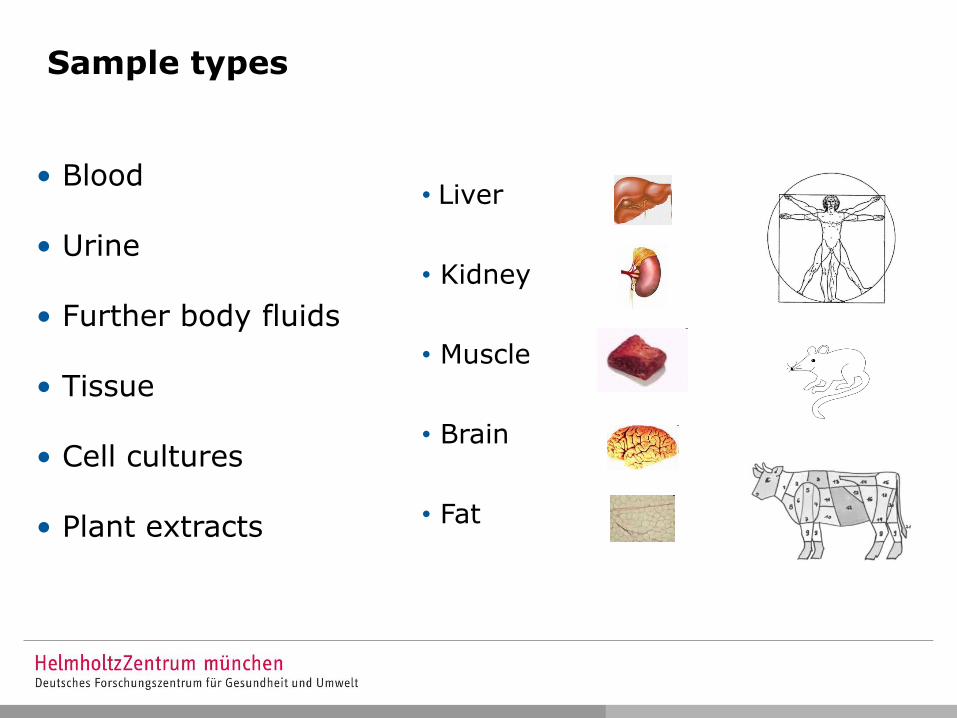
Sample types
• Liver
• Kidney
• Muscle
• Brain
• Fat
• Blood
• Urine
• Further body fluids
• Tissue
• Cell cultures
• Plant extracts
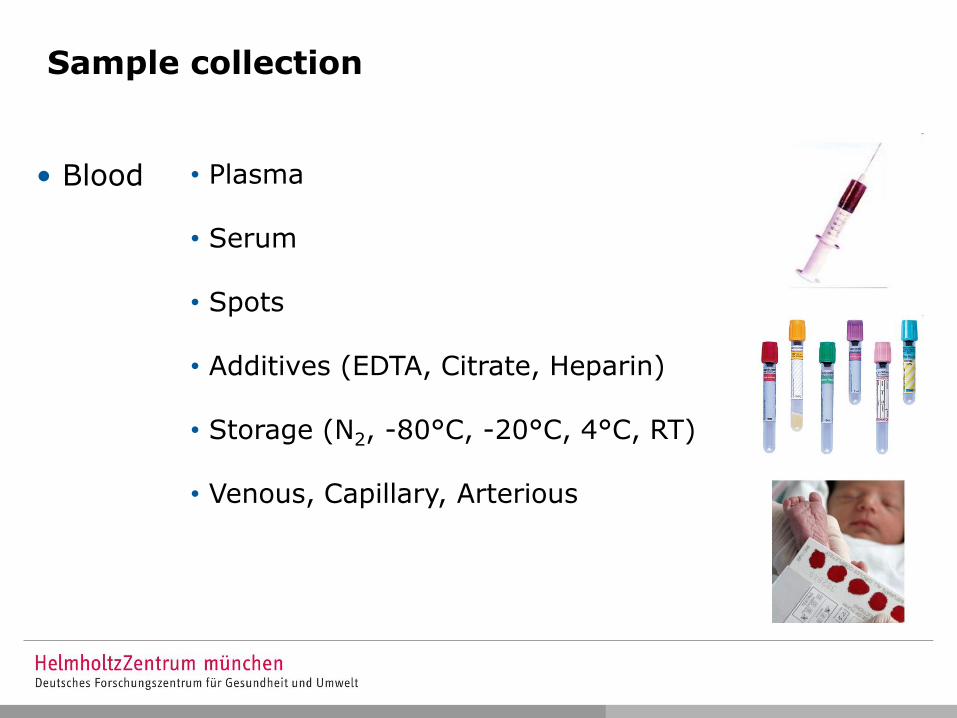
Sample collection
• Plasma
• Serum
• Spots
• Additives (EDTA, Citrate, Heparin)
• Storage (N2, -80°C, -20°C, 4°C, RT)
• Venous, Capillary, Arterious
• Blood
Things to think about BEFORE sample collection
• Is there any established metabolomics method for the sample
type („matrix)?
• Additives can disturb the measurement (e.g. DNA stabilisors).
• Reactions go on at room temperature
=> standard operating procedures (SOPs) to ensure comparability
• Lab differences might be large
=> cases/controls from all sites
Discuss study design with collaborators for analytics and data analysis!
Sample collection …
… what you loose here
… you will never see (again)!
METABOLITE DETECTION & QUANTIFICATION
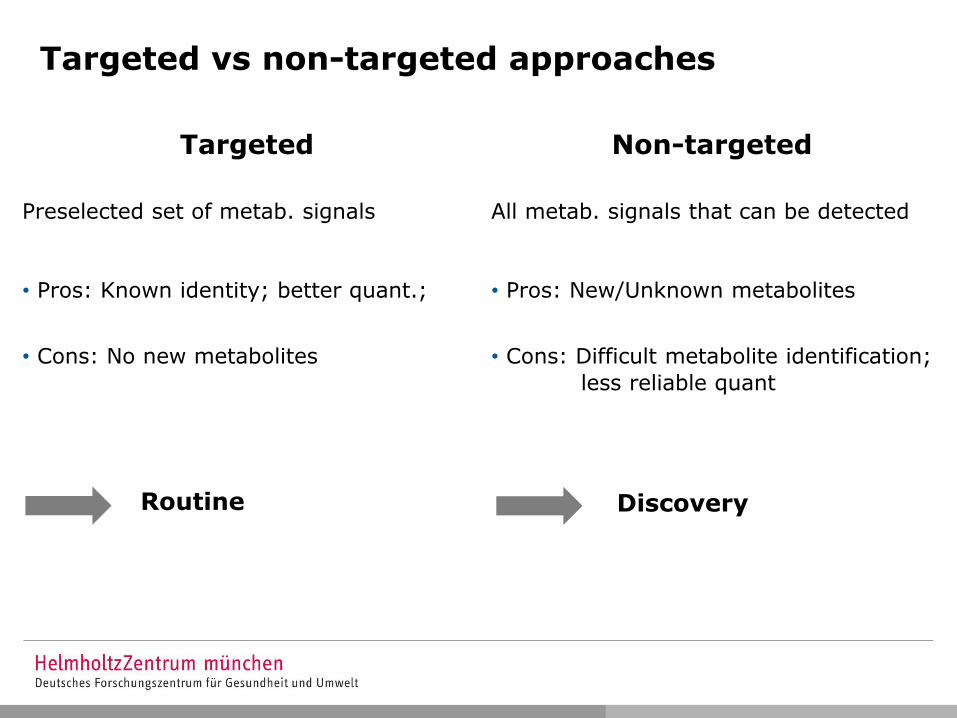
Targeted vs non-targeted approaches
Targeted
Preselected set of metab. signals
• Pros: Known identity; better quant.;
• Cons: No new metabolites
Routine
Non-targeted
All metab. signals that can be detected
• Pros: New/Unknown metabolites
• Cons: Difficult metabolite identification;
less reliable quant
Discovery
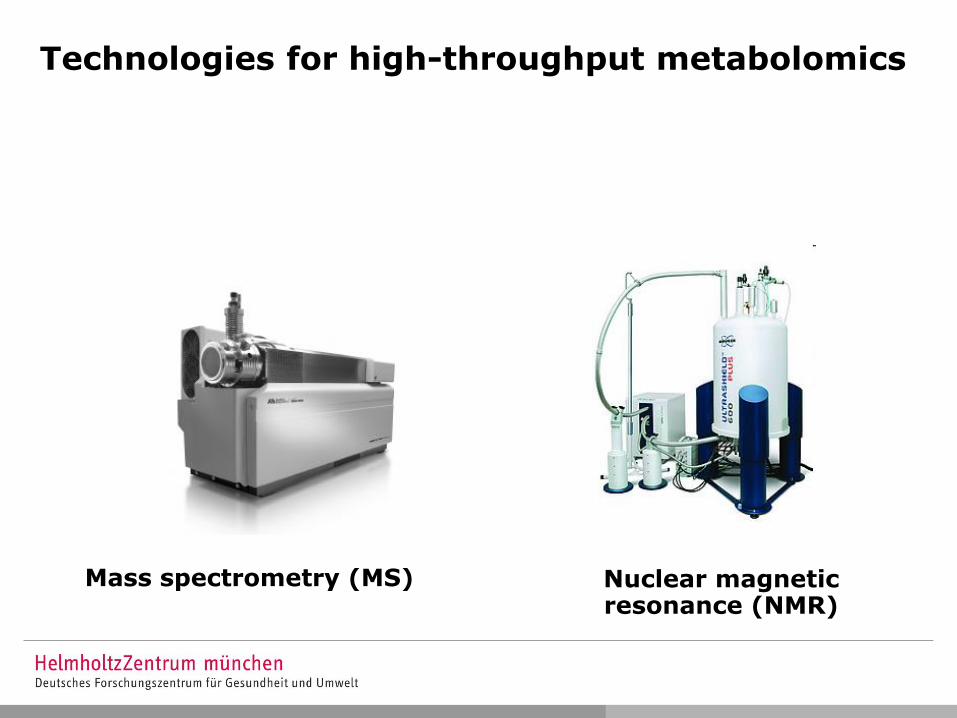
Technologies for high-throughput metabolomics
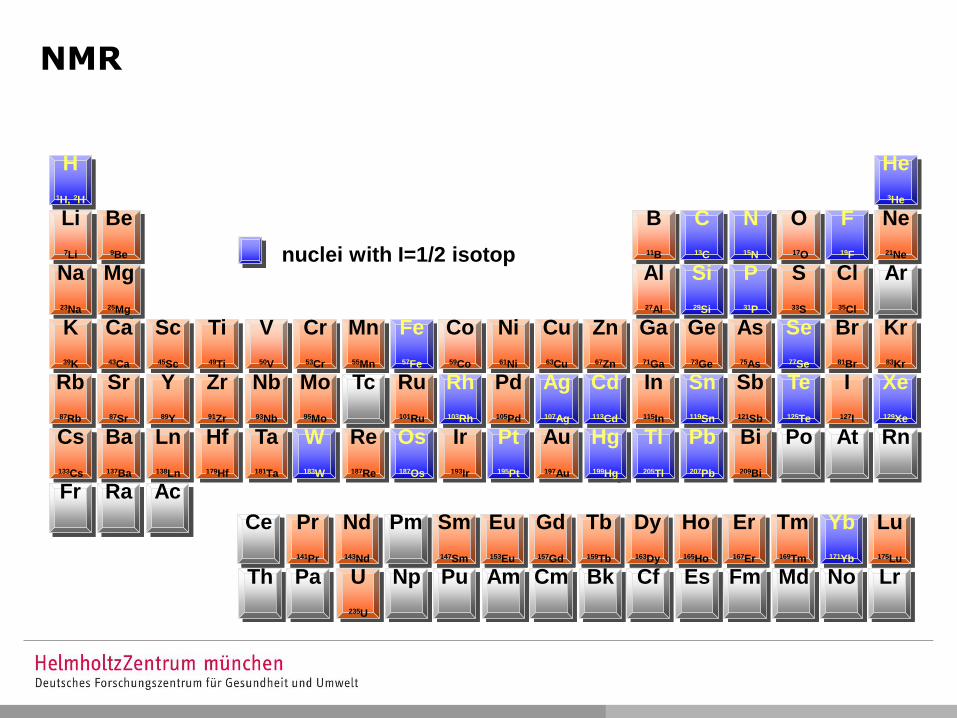
Mass spectrometry (MS) Nuclear magnetic resonance (NMR)
NUCLEAR MAGNETIC RESONANCE (NMR)
H
1H, 2H
Li
7Li
Na
23Na
Be
9Be
Mg
25Mg
K
39K
Ca
43Ca
Rb
87Rb
Sr
87Sr
Cs
133Cs
Ba
137Ba
Sc
45Sc
Ti
49Ti
V
50V
Cr
53Cr
Mn
55Mn
Co
59Co
Ni
61Ni
Cu
63Cu
Zn
67Zn
Ga
71Ga
Ge
73Ge
As
75As
Y
89Y
Zr
91Zr
Nb
93Nb
Mo
95Mo
Ru
101Ru
Pd
105Pd
In
115In
Sb
121Sb
Ln
138Ln
Hf
179Hf
Ta
181Ta
Re
187Re
Ir
193Ir
Au
197Au
Bi
209Bi
Br
81Br
Kr
83Kr
I
127I
B
11B
O
17O
Al
27Al
S
33S
Ne
21Ne
Cl
35Cl
Ar
He
3He
C
13C
N
15N
F
19F
Si
29Si
P
31P
Fe
57Fe
Se
77Se
Te
125Te
Xe
129Xe
Sn
119Sn
Pb
207Pb
Tl
205Tl
Po
At
Rn
Hg
199Hg
Pt
195Pt
Rh
103Rh
Os
187Os
W
183W
Tc
Ag
107Ag
Cd
113Cd
Fr
Ra
Ac
Pr
141Pr
Nd
143Nd
Sm
147Sm
Eu
153Eu
Tb
159Tb
Er
167Er
Tm
169Tm
Yb
171Yb
No
Pm
Ce
Gd
157Gd
Dy
163Dy
Ho
165Ho
Lu
175Lu
Md
Fm
Es
Cf
Bk
Cm
Am
Pa
Th
U
235U
Pu
Np
Lr
nuclei with NMR active isotop
nuclei with I=1/2 isotop
NMR
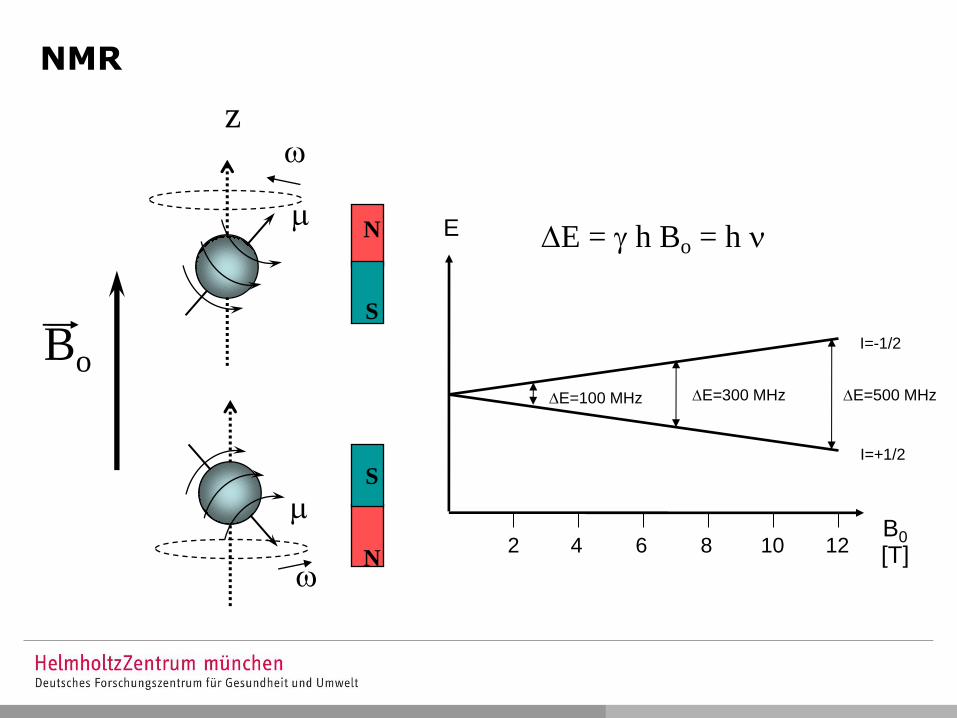
Bo
w z
m
m
w
N
S
S
N
DE = g h Bo = h n
10 12 8 6 4 2 B0
[T]
E
I=-1/2
I=+1/2
DE=100 MHz DE=300 MHz DE=500 MHz
NMR
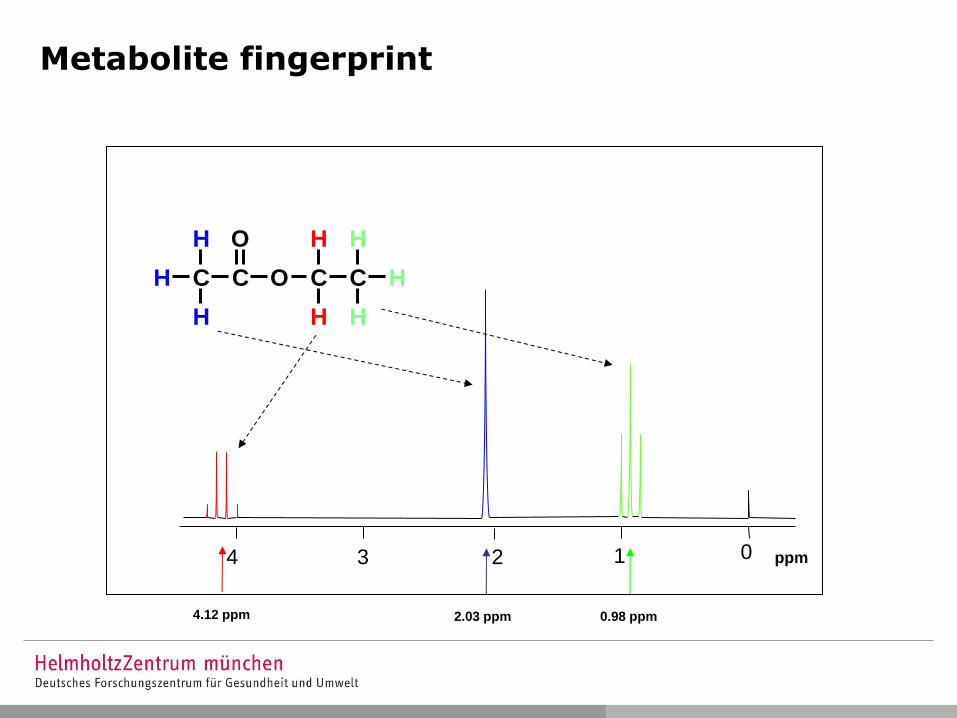
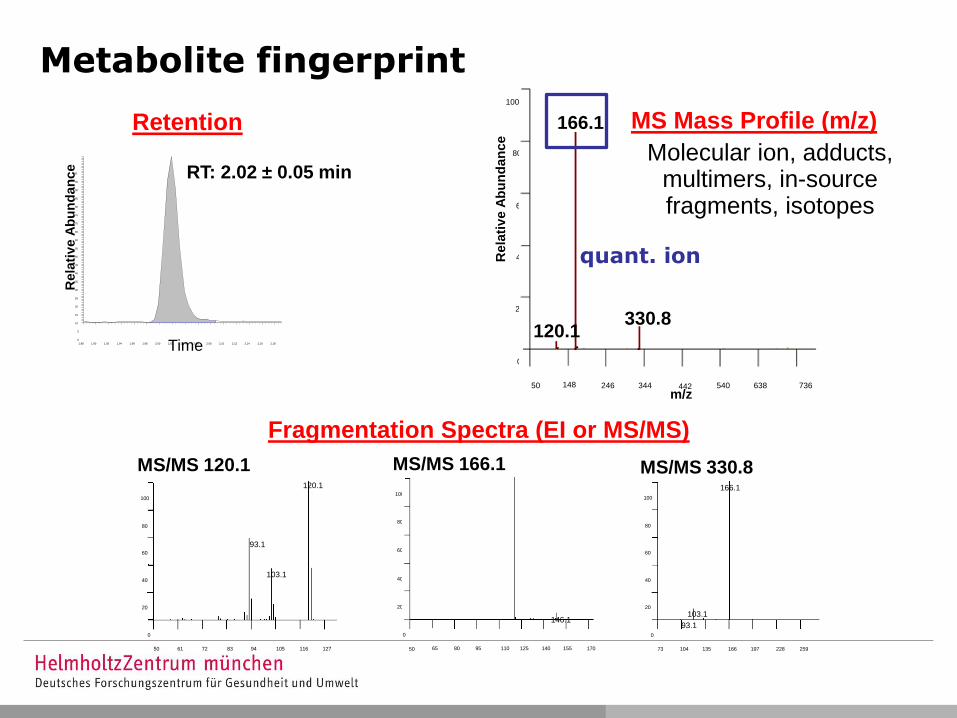
Metabolite fingerprint
0 1 2 3 4 ppm
H C
H
H
C
O
O C
H
H
C
H
H
H
0.98 ppm 2.03 ppm 4.12 ppm
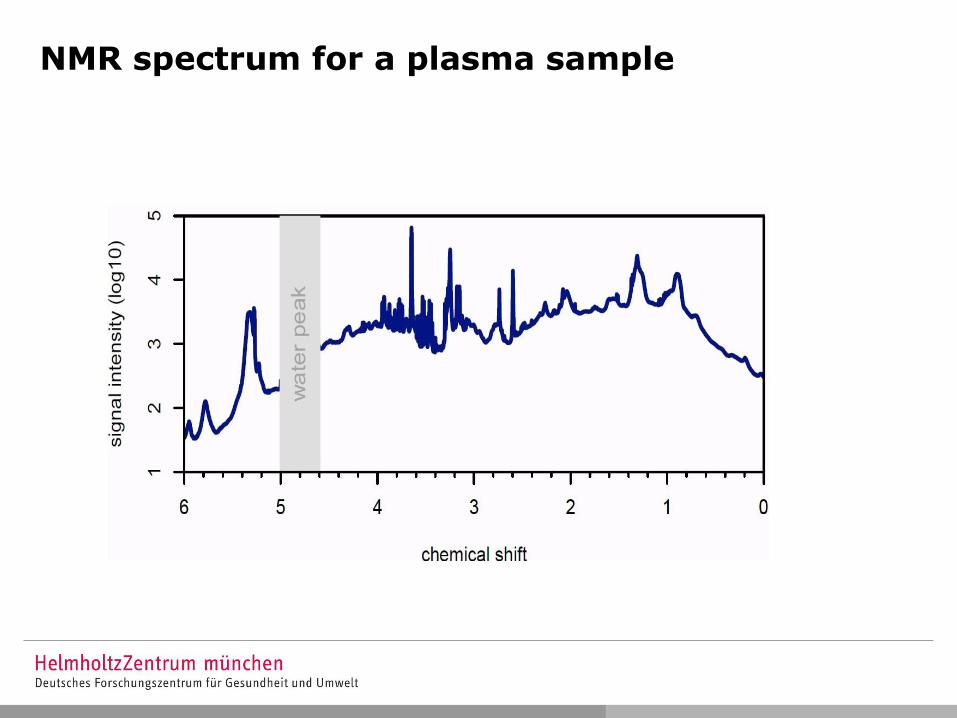
NMR spectrum for a plasma sample
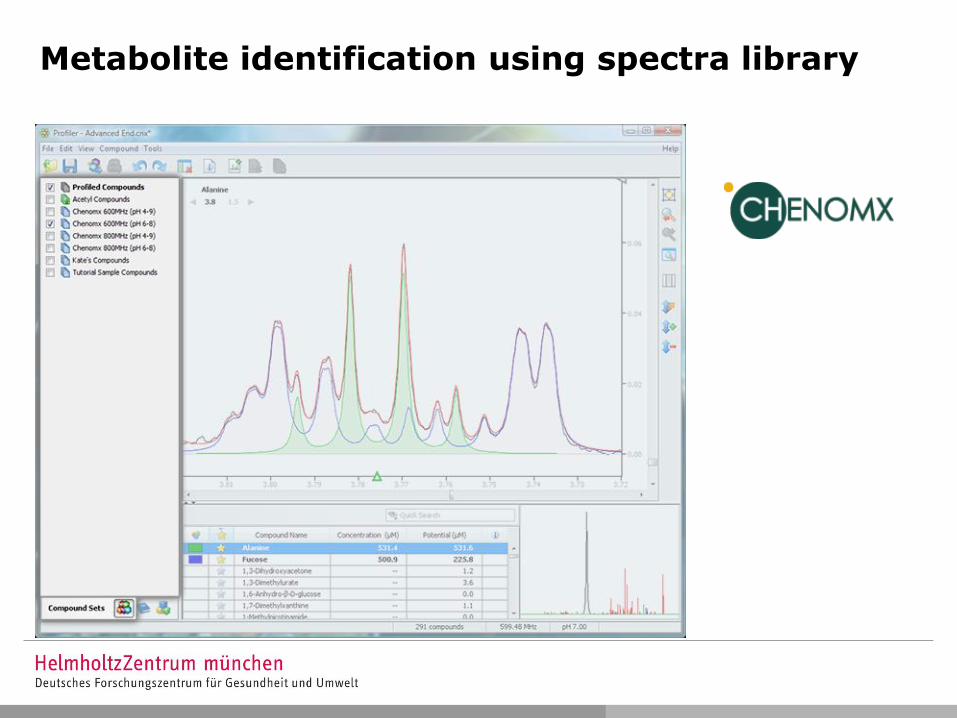
Metabolite identification using spectra library
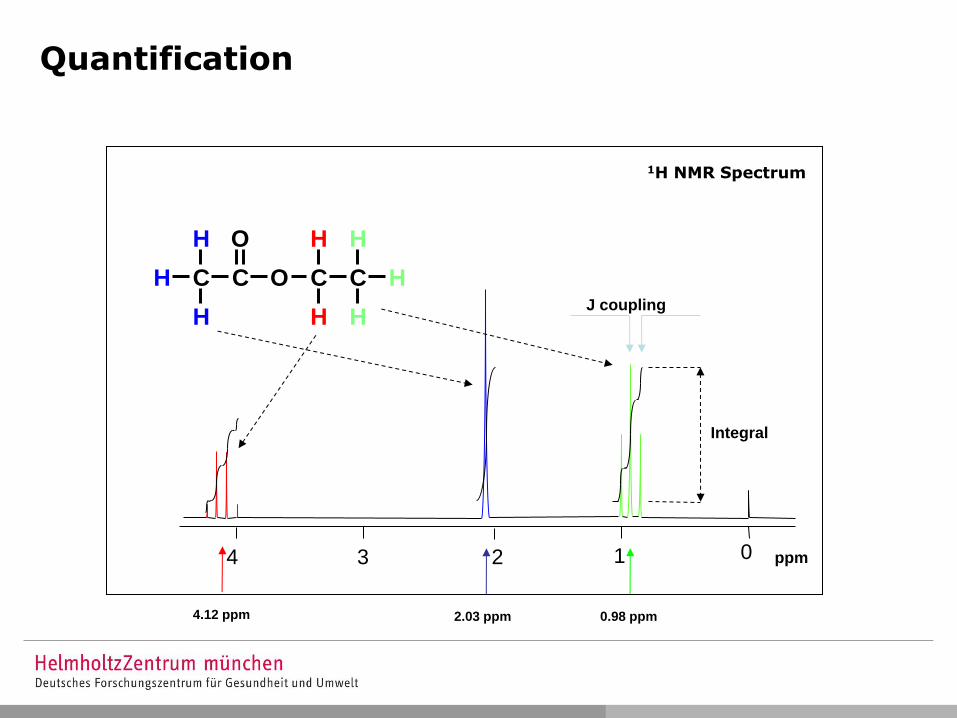
Quantification
0 1 2 3 4 ppm
H C
H
H
C
O
O C
H
H
C
H
H
HJ coupling
Integral
0.98 ppm 2.03 ppm 4.12 ppm
1H NMR Spectrum
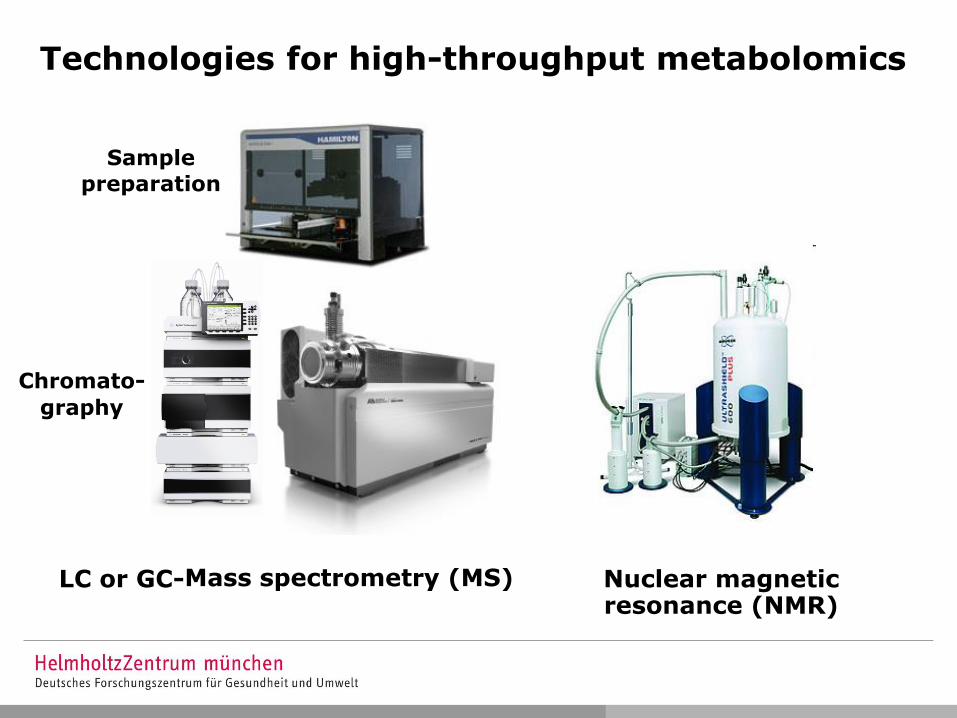
Technologies for high-throughput metabolomics
Mass spectrometry (MS) Nuclear magnetic resonance (NMR)
LC or GC-
Sample
preparation
Chromato-
graphy
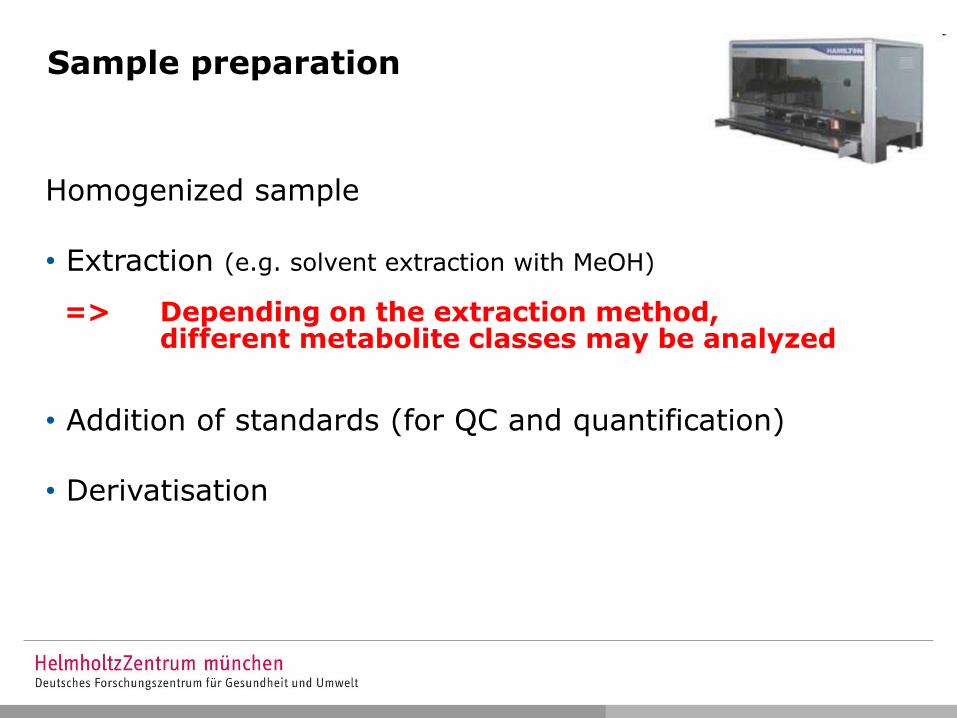
Sample preparation
Homogenized sample
• Extraction (e.g. solvent extraction with MeOH)
• Addition of standards (for QC and quantification)
• Derivatisation
=> Depending on the extraction method, different metabolite classes may be analyzed
Sample preparation
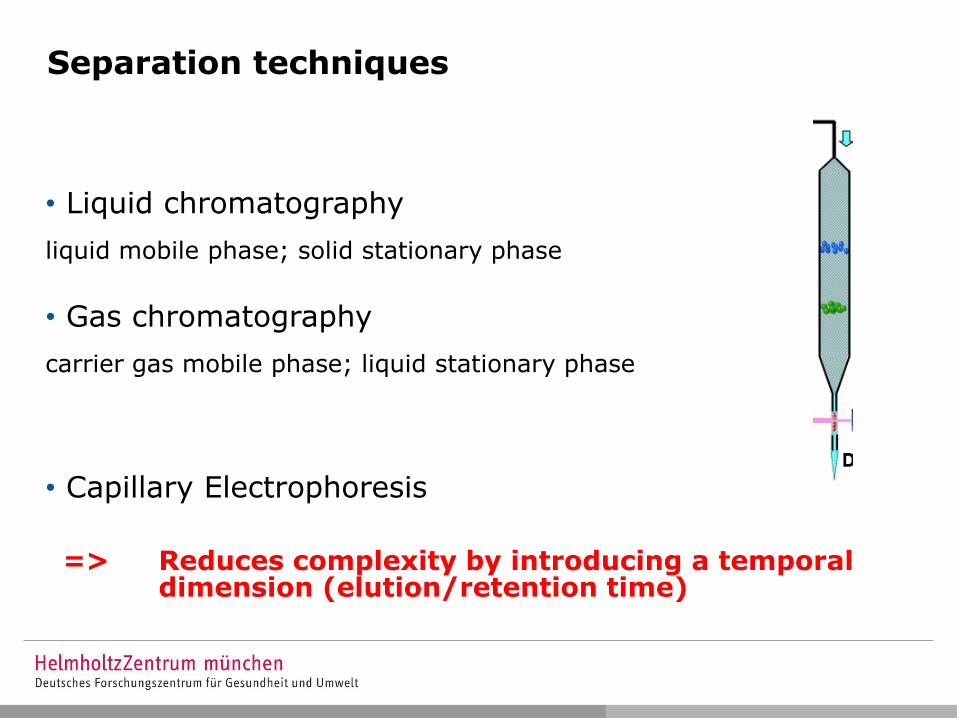
Separation techniques
• Liquid chromatography
liquid mobile phase; solid stationary phase
• Gas chromatography
carrier gas mobile phase; liquid stationary phase
• Capillary Electrophoresis
=> Reduces complexity by introducing a temporal dimension (elution/retention time)
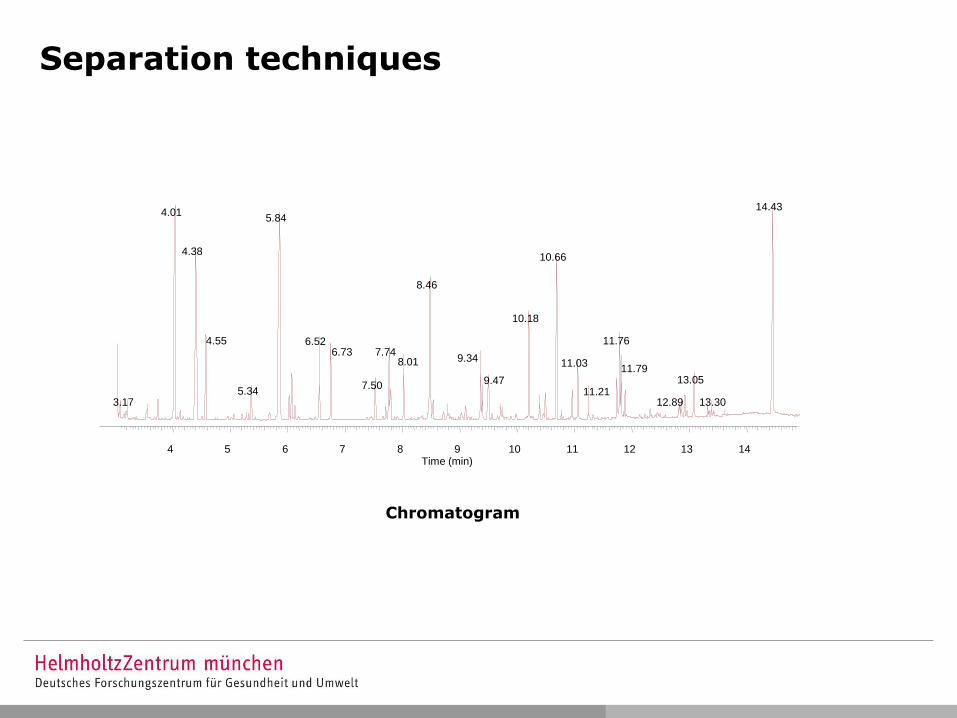
Separation techniques
4 5 6 7 8 9 10 11 12 13 14 Time (min)
4.01 14.43
5.84
4.38 10.66
8.46
10.18
11.76 4.55 6.52 6.73 7.74
9.34 11.79
11.03
13.05 9.47 7.50 11.21 5.34
12.89 3.17 13.30
8.01
Chromatogram
MASS SPECTROMETRY (MS)
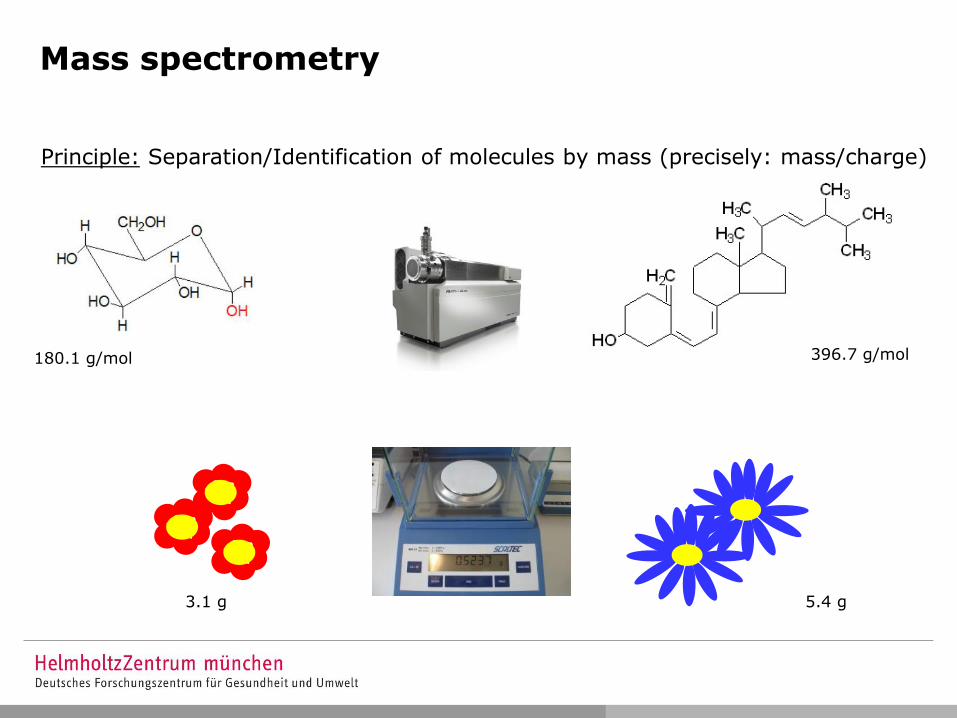
Mass spectrometry
Principle: Separation/Identification of molecules by mass (precisely: mass/charge)
3.1 g 5.4 g
396.7 g/mol 180.1 g/mol
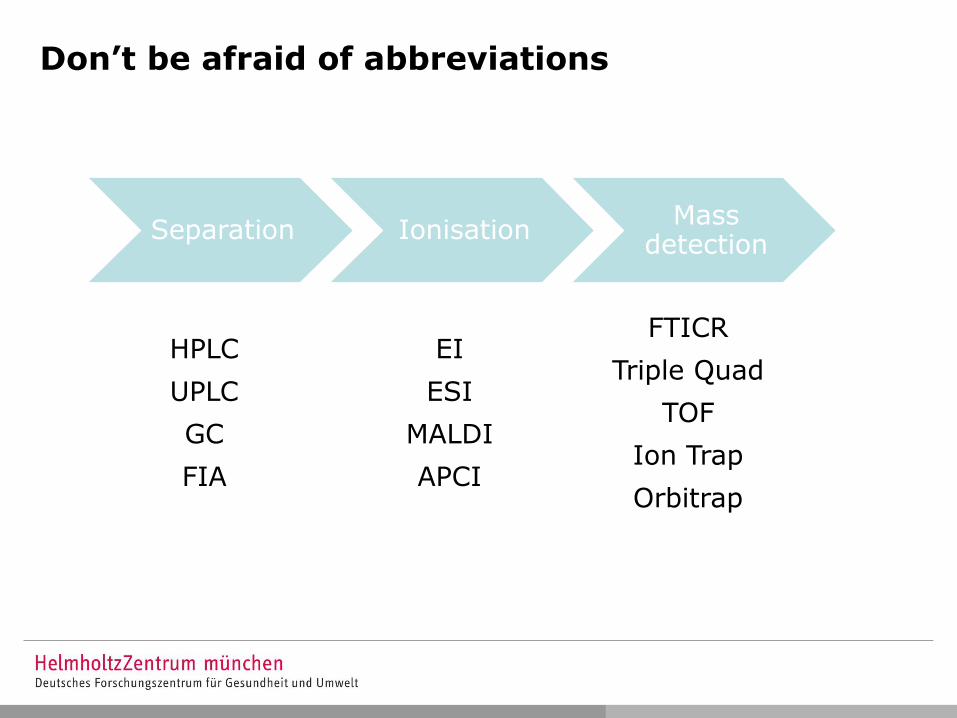
Don’t be afraid of abbreviations
EI
ESI
MALDI
APCI
FTICR
Triple Quad
TOF
Ion Trap
Orbitrap
HPLC
UPLC
GC
FIA
Separation Ionisation Mass
detection
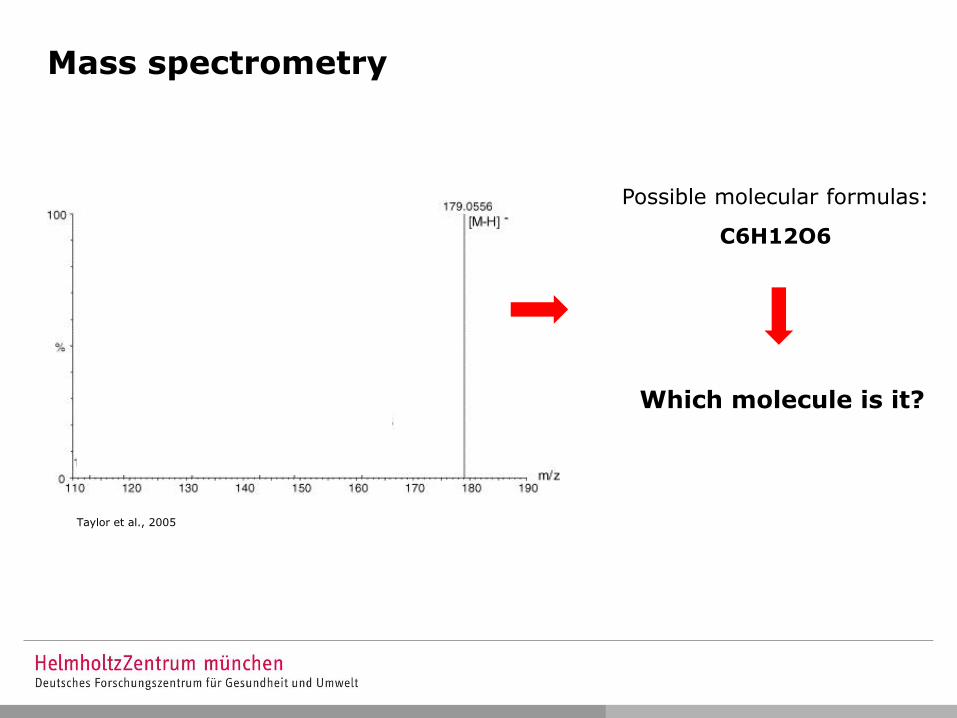
Mass spectrometry
Taylor et al., 2005
Possible molecular formulas:
C6H12O6
Which molecule is it?
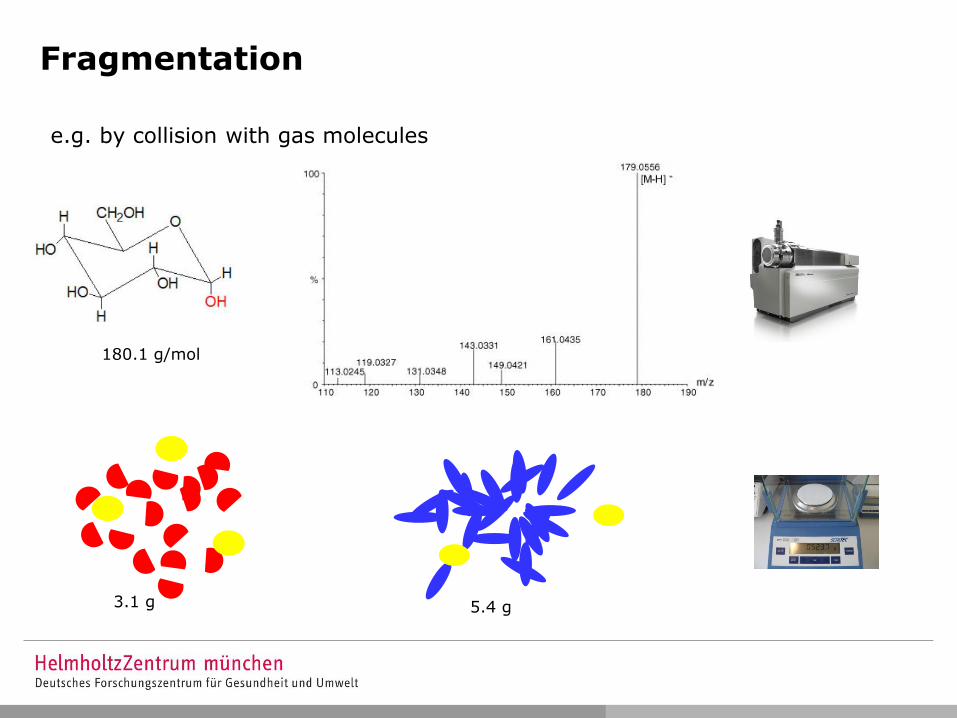
Fragmentation
3.1 g 5.4 g
180.1 g/mol
e.g. by collision with gas molecules
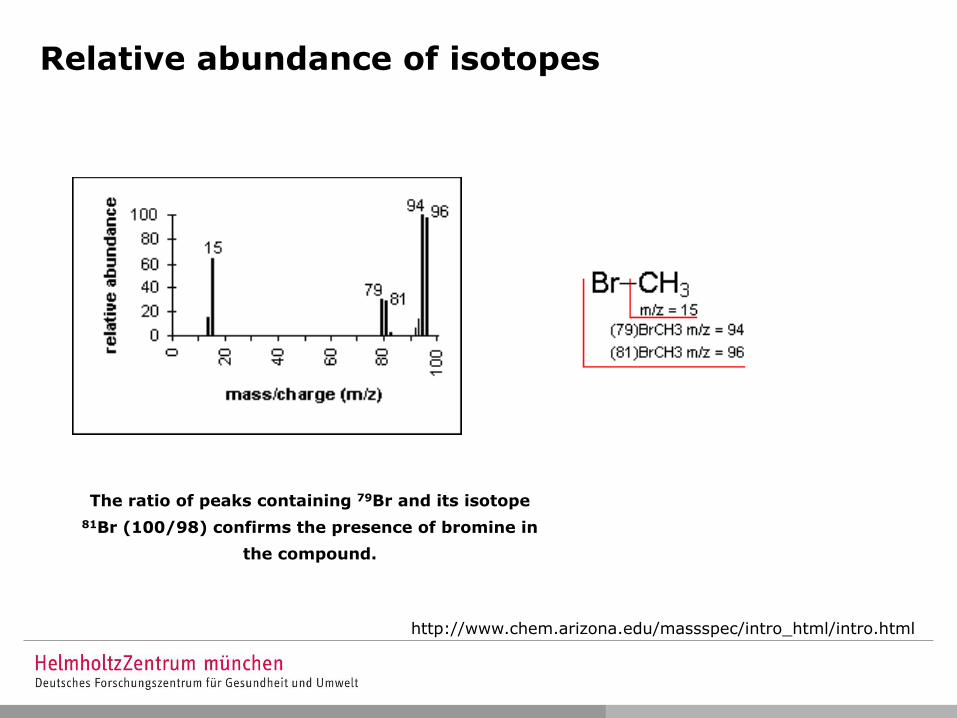
Relative abundance of isotopes
The ratio of peaks containing 79Br and its isotope
81Br (100/98) confirms the presence of bromine in
the compound.
http://www.chem.arizona.edu/massspec/intro_html/intro.html
4 5 6 7 8 9 10 11 12 13 14 Time (min)
4.01 14.43 5.84
4.38 10.66
8.46
10.18 11.76 4.55 6.52 6.73 7.74 9.34 11.79 11.03
13.05 9.47 7.50 11.21 5.34 12.89 3.17 13.30
8.01
Chromatogram
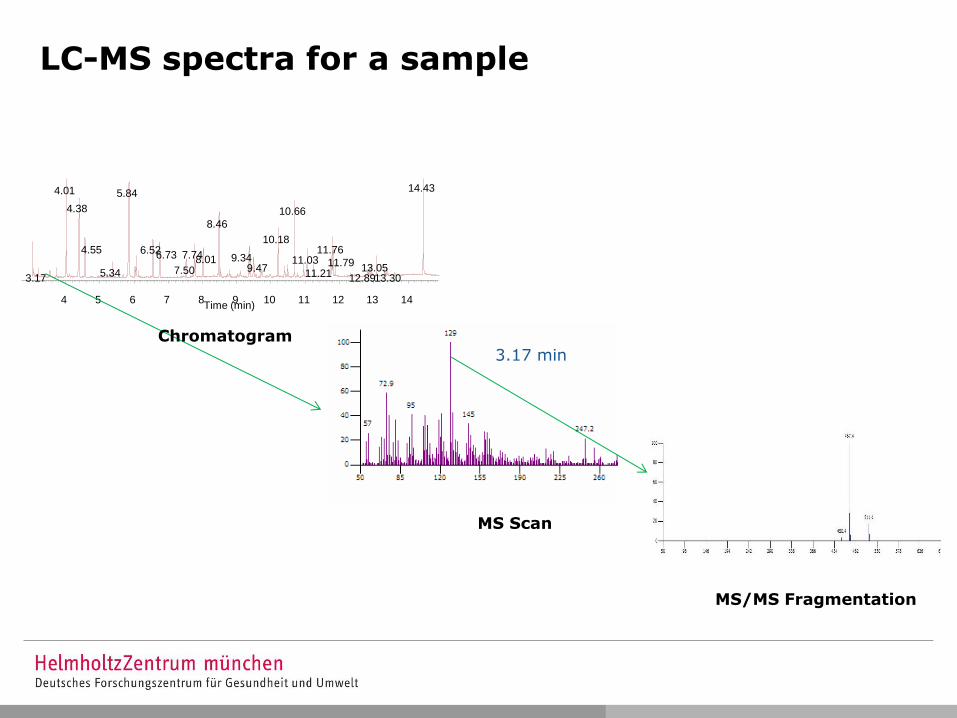
LC-MS spectra for a sample
3.17 min
MS Scan
MS/MS Fragmentation
4 5 6 7 8 9 10 11 12 13 14 Time (min)
4.01 14.43 5.84
4.38 10.66
8.46
10.18 11.76 4.55 6.52 6.73 7.74 9.34 11.79 11.03
13.05 9.47 7.50 11.21 5.34 12.89 3.17 13.30
8.01
Chromatogram 3.17 min
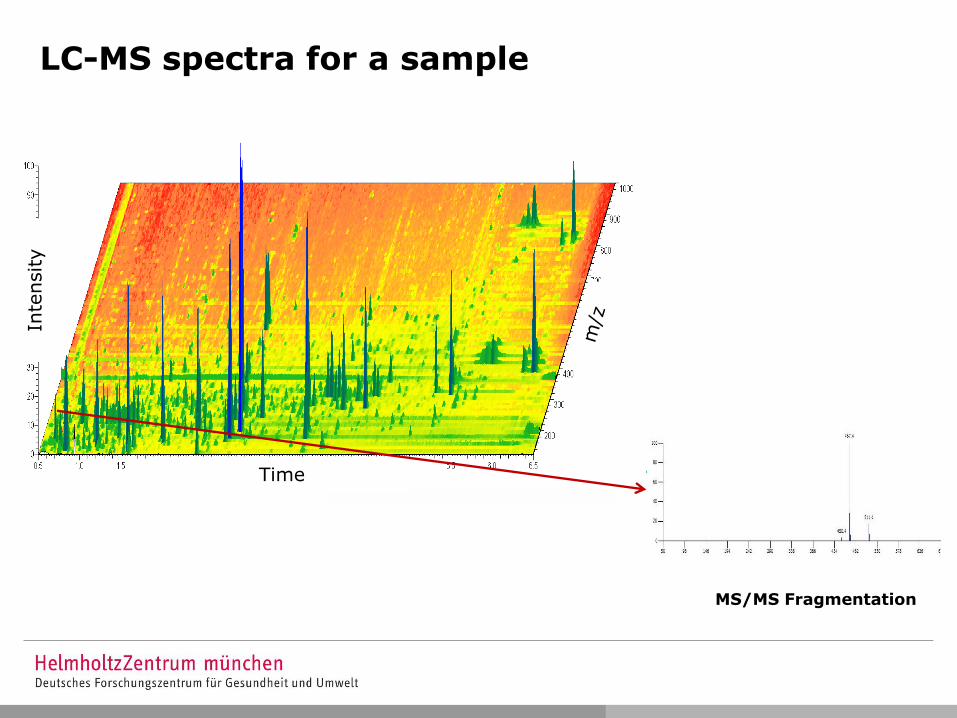
MS/MS Fragmentation
Time
Inte
nsity
LC-MS spectra for a sample
120.1
103.1
93.1
50 61 72 83 94 105 116 127
20
0
40
60
80
100
MS/MS 120.1
1.88 1.90 1.92 1.94 1.96 1.98 2.00 2.02 2.04 2.06 2.08 2.10 2.12 2.14 2.16 2.18
0
5
10
15
20
25
30
35
40
45
50
55
60
65
70
75
80
85
90
95
100 RT: 2.02 ± 0.05 min
Time
Rela
tiv
e A
bu
nd
an
ce
166.1
50 148 246 344 442 540 638 736
0
20
40
60
80
100
m/z
Rela
tiv
e A
bu
nd
an
ce
166.1
120.1 330.8
Retention MS Mass Profile (m/z)
120.1
50 65 80 95 110 125 140 155
20
0
40
60
80
100
170
146.1
MS/MS 166.1
73 104 135 166 197 228 259
166.1
103.1
93.1
20
0
40
60
80
100
MS/MS 330.8
Fragmentation Spectra (EI or MS/MS)
Molecular ion, adducts, multimers, in-source fragments, isotopes
Metabolite fingerprint
quant. ion
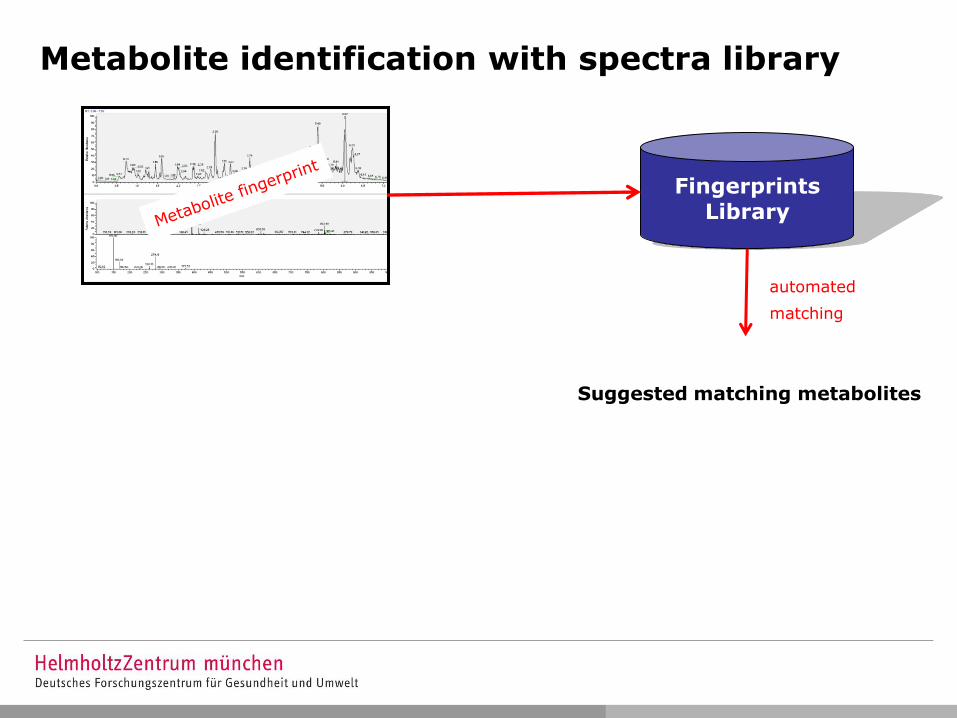
Fingerprints Library
automated
matching
Suggested matching metabolites
Metabolite identification with spectra library
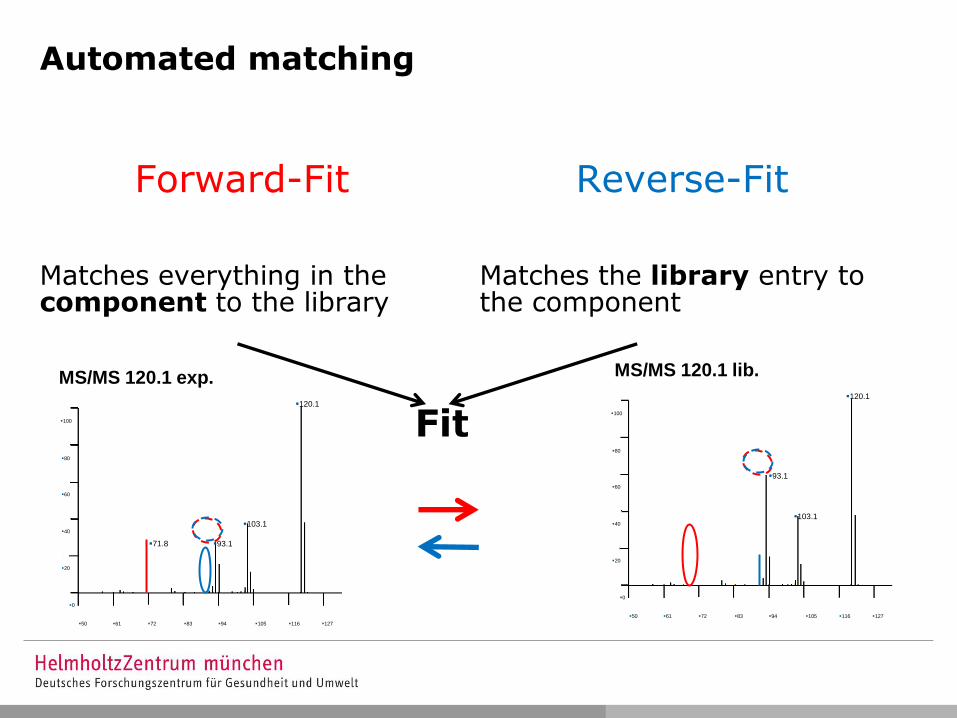
Forward-Fit
Matches everything in the component to the library
Reverse-Fit
Matches the library entry to the component
Fit 120.1
103.1
93.1
50 61 72 83 94 105 116 127
20
0
40
60
80
100
MS/MS 120.1 lib.
120.1
103.1
50 61 72 83 94 105 116 127
20
0
40
60
80
100
MS/MS 120.1 exp.
93.1 71.8
Automated matching
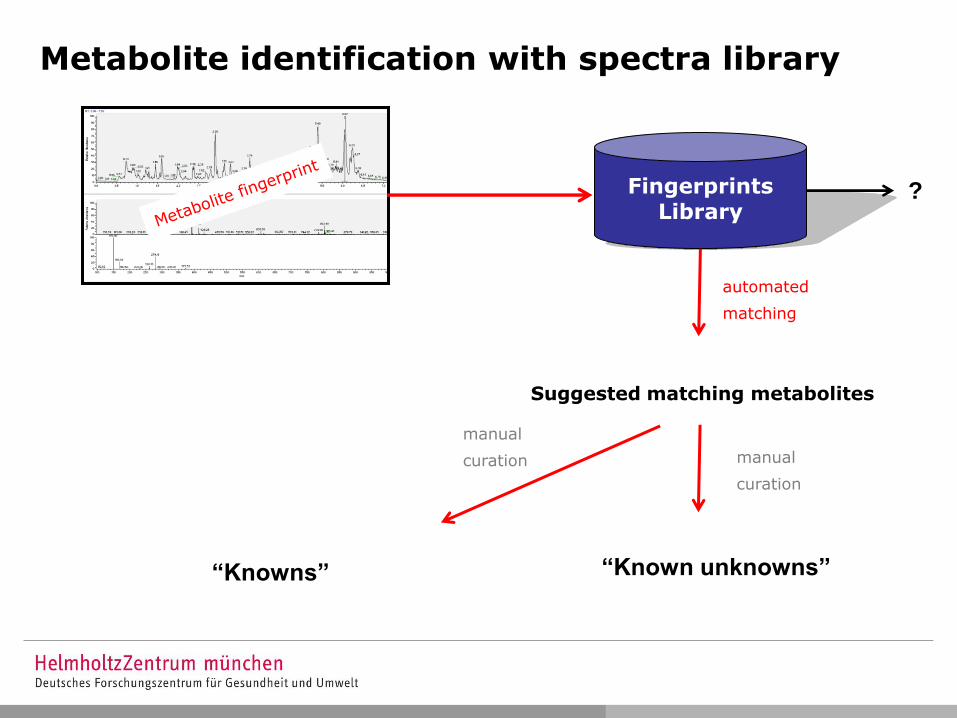
Fingerprints Library
automated
matching
Suggested matching metabolites
Metabolite identification with spectra library
“Knowns”
manual
curation
“Known unknowns”
manual
curation
?
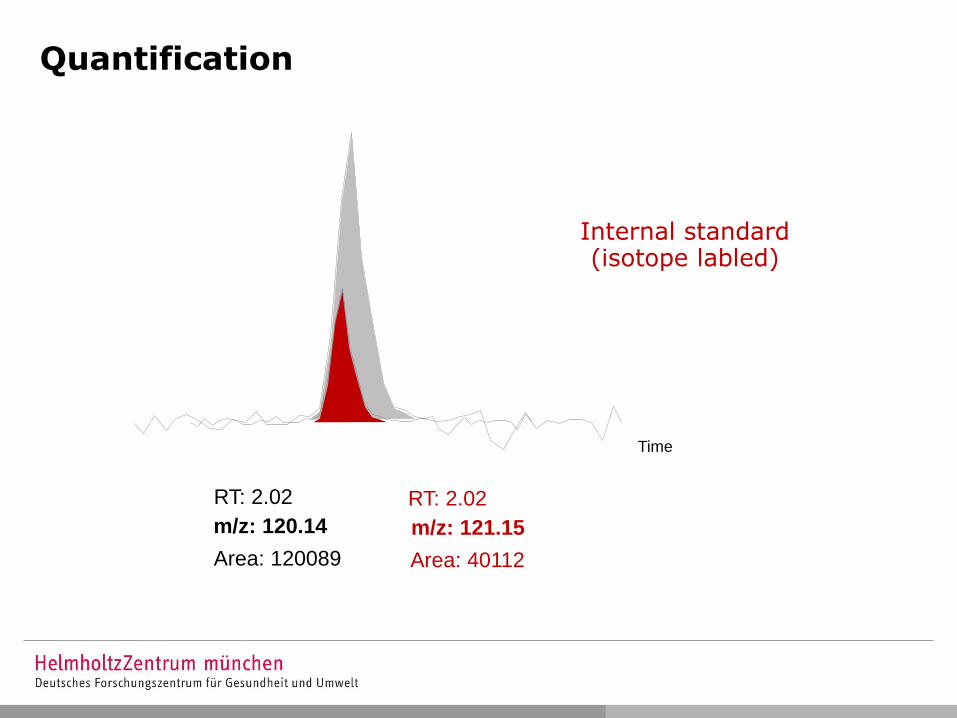
Quantification
RT: 2.02
Area: 120089
m/z: 120.14
Time
RT: 2.02
Area: 40112
m/z: 121.15
Internal standard (isotope labled)
DATA ANALYSIS
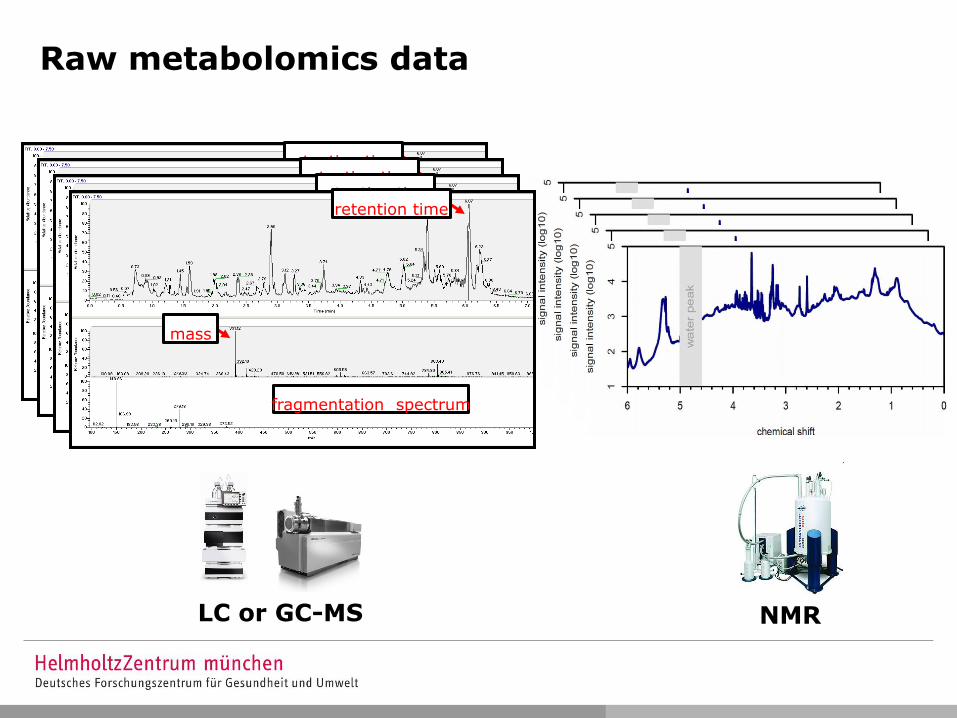
Raw metabolomics data
LC or GC-MS NMR
fragmentation spectrum
mass
retention time
fragmentation spectrum
mass
retention time
fragmentation spectrum
mass
retention time
fragmentation spectrum
mass
retention time
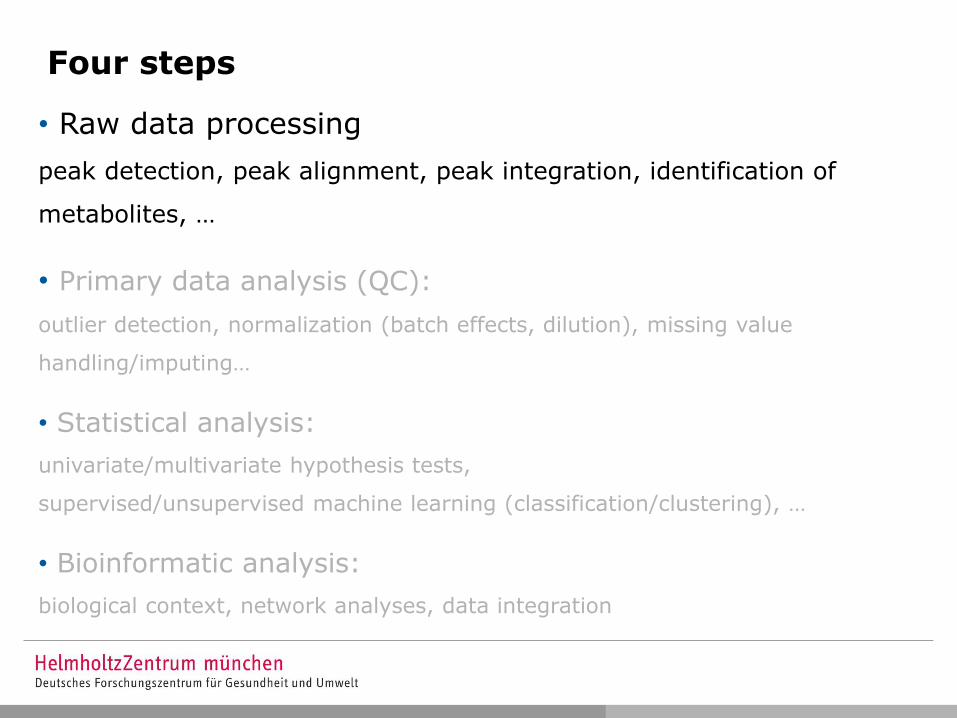
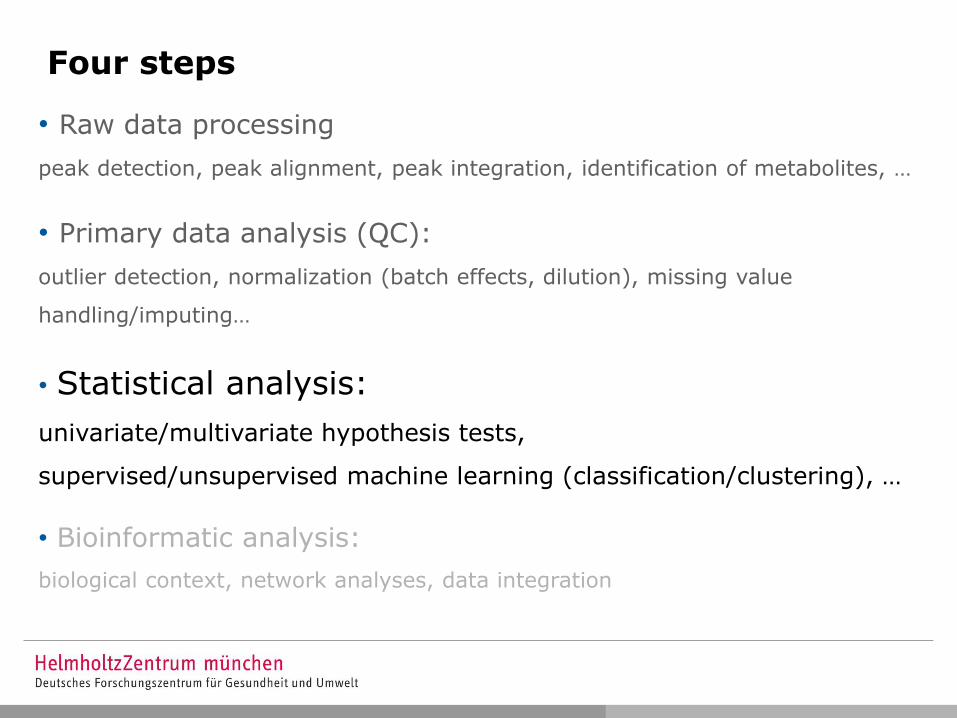
Four steps
• Raw data processing
peak detection, peak alignment, peak integration, identification of
metabolites, …
• Primary data analysis (QC):
outlier detection, normalization (batch effects, dilution), missing value
handling/imputing…
• Statistical analysis:
univariate/multivariate hypothesis tests,
supervised/unsupervised machine learning (classification/clustering), …
• Bioinformatic analysis:
biological context, network analyses, data integration
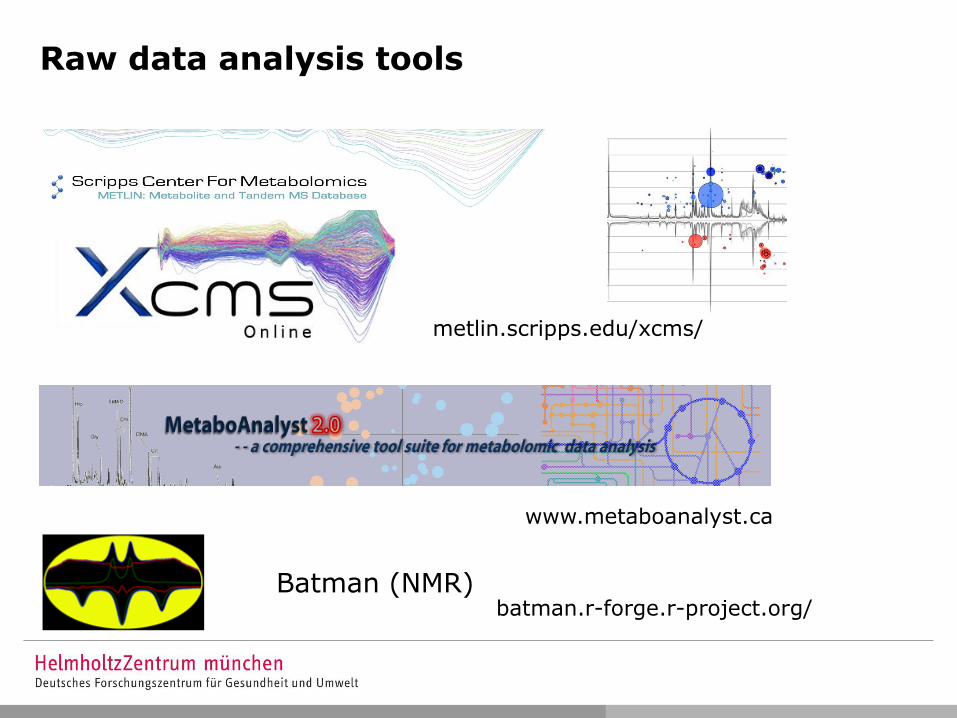
Raw data analysis tools
metlin.scripps.edu/xcms/
www.metaboanalyst.ca
Batman (NMR) batman.r-forge.r-project.org/
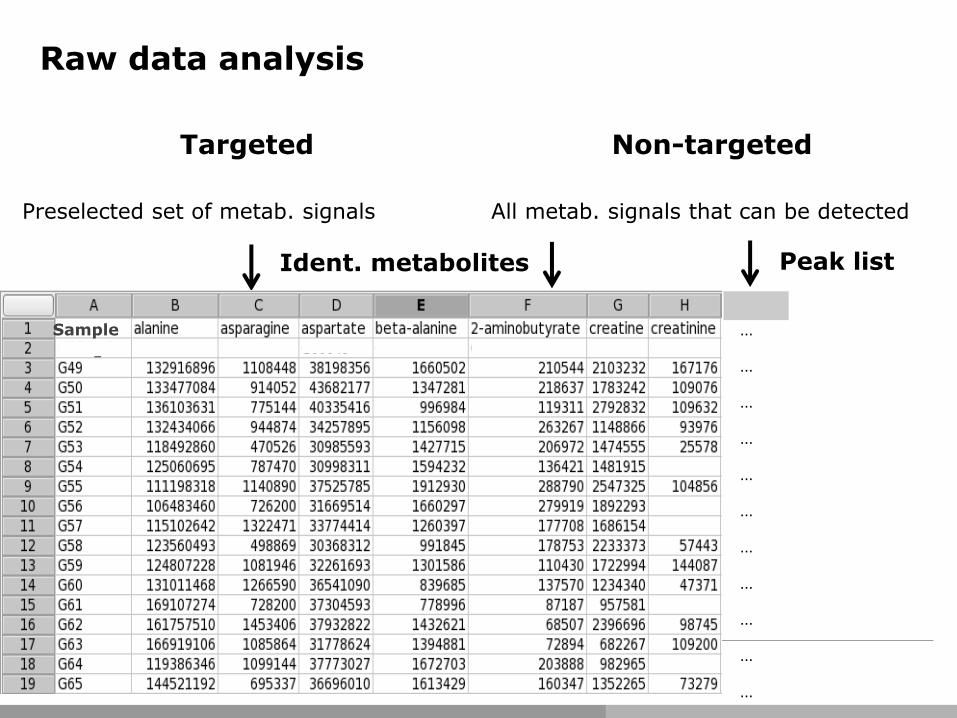
Raw data analysis
Targeted
Preselected set of metab. signals
Non-targeted
All metab. signals that can be detected
…
…
…
…
…
…
…
…
…
…
…
…
Sample
Ident. metabolites Peak list
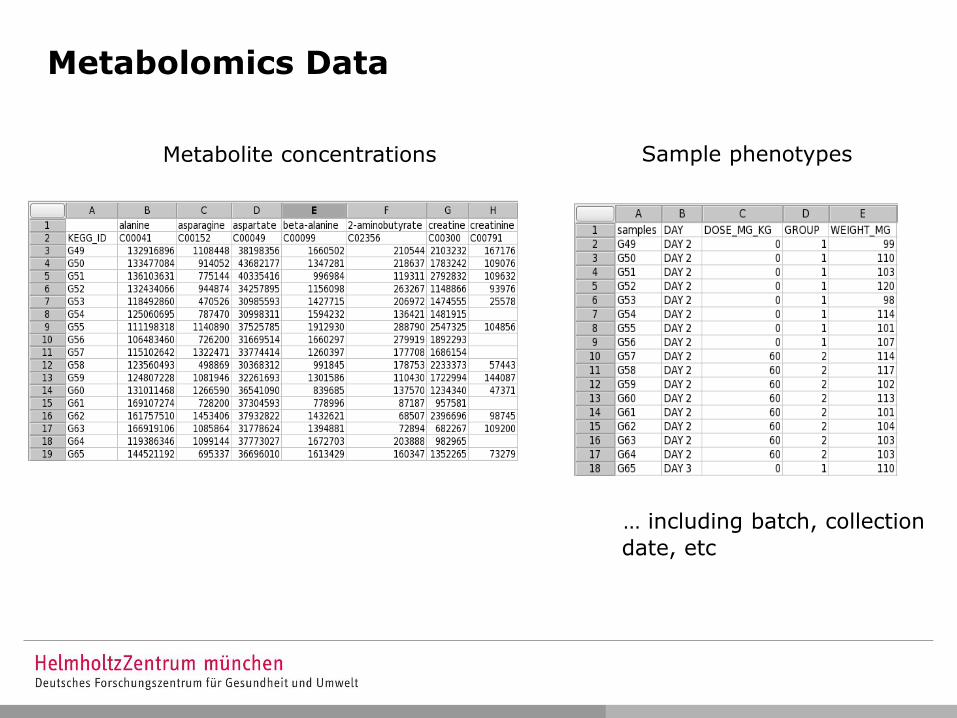
Metabolomics Data
Sample phenotypes Metabolite concentrations
… including batch, collection
date, etc
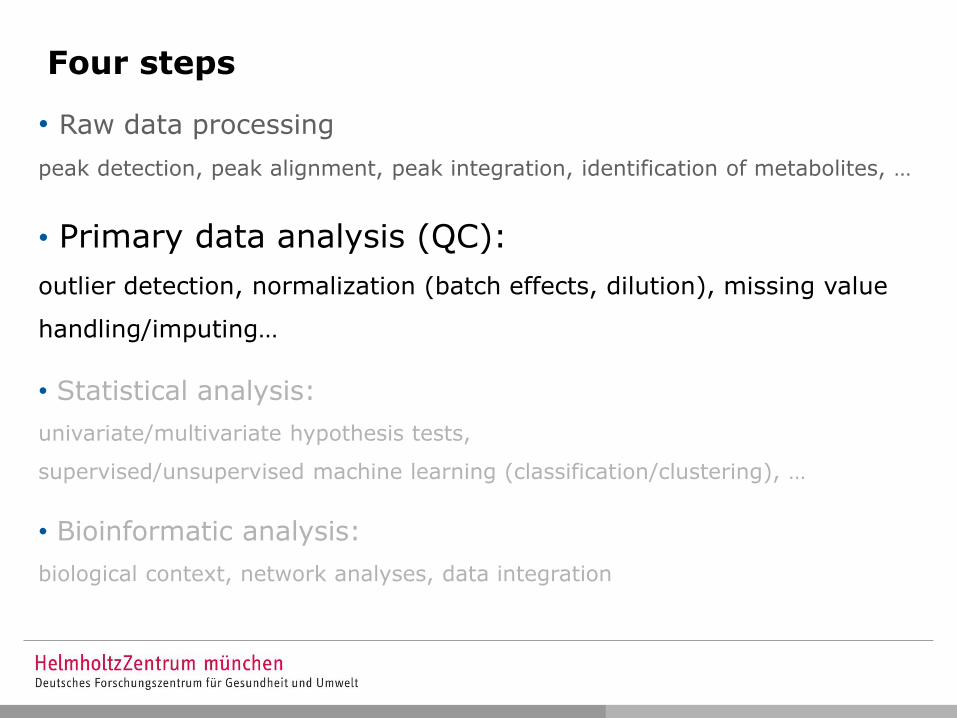
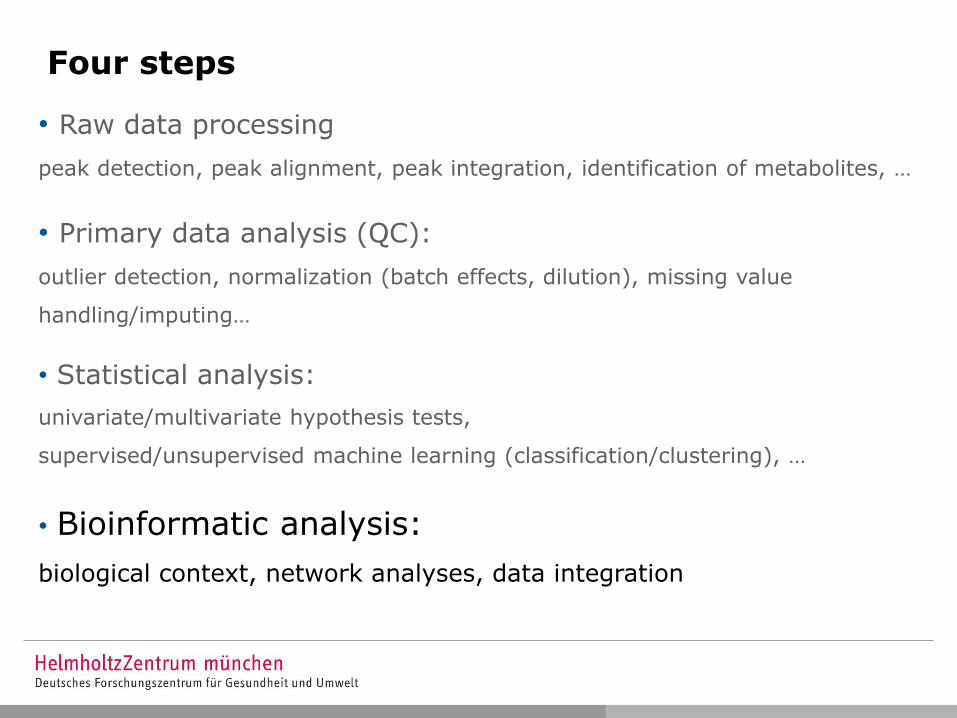
Four steps
• Raw data processing
peak detection, peak alignment, peak integration, identification of metabolites, …
• Primary data analysis (QC):
outlier detection, normalization (batch effects, dilution), missing value
handling/imputing…
• Statistical analysis:
univariate/multivariate hypothesis tests,
supervised/unsupervised machine learning (classification/clustering), …
• Bioinformatic analysis:
biological context, network analyses, data integration
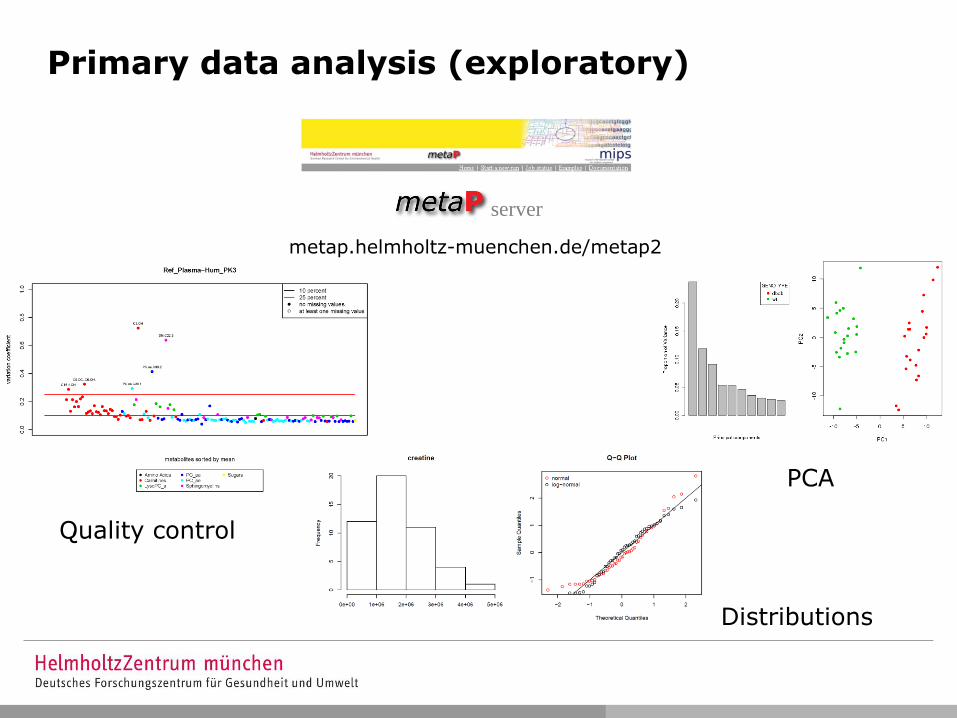
server
Quality control
PCA
Primary data analysis (exploratory)
metap.helmholtz-muenchen.de/metap2
Distributions
Four steps
• Raw data processing
peak detection, peak alignment, peak integration, identification of metabolites, …
• Primary data analysis (QC):
outlier detection, normalization (batch effects, dilution), missing value
handling/imputing…
• Statistical analysis:
univariate/multivariate hypothesis tests,
supervised/unsupervised machine learning (classification/clustering), …
• Bioinformatic analysis:
biological context, network analyses, data integration
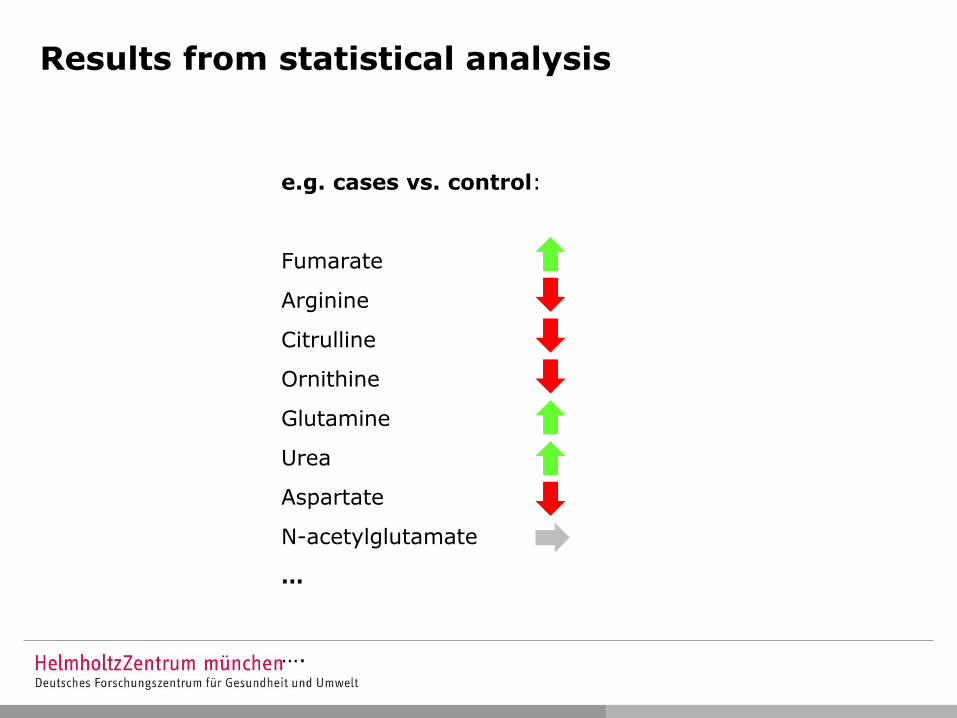
Results from statistical analysis
e.g. cases vs. control:
Fumarate
Arginine
Citrulline
Ornithine
Glutamine
Urea
Aspartate
N-acetylglutamate
…
….
Four steps
• Raw data processing
peak detection, peak alignment, peak integration, identification of metabolites, …
• Primary data analysis (QC):
outlier detection, normalization (batch effects, dilution), missing value
handling/imputing…
• Statistical analysis:
univariate/multivariate hypothesis tests,
supervised/unsupervised machine learning (classification/clustering), …
• Bioinformatic analysis:
biological context, network analyses, data integration
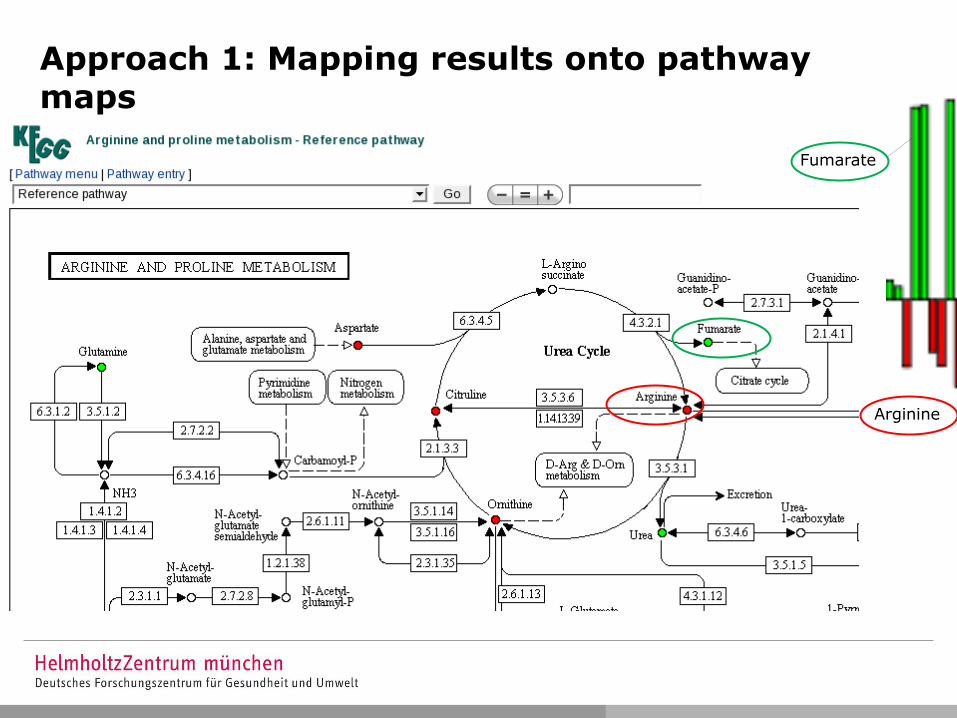
Approach 1: Mapping results onto pathway maps
Fumarate
Arginine
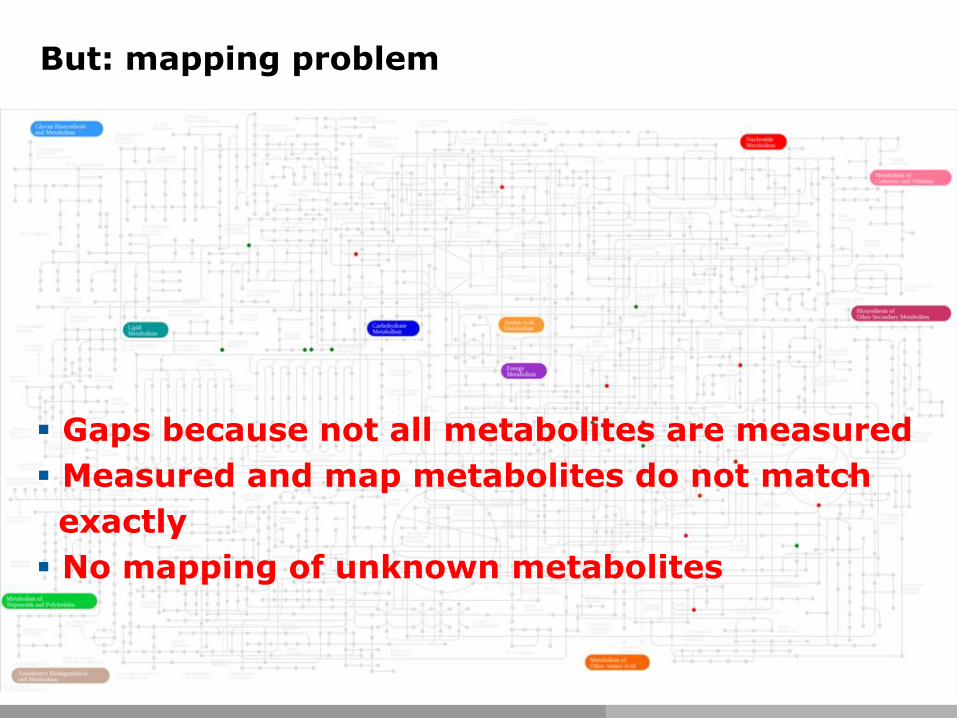
But: mapping problem
Gaps because not all metabolites are measured
Measured and map metabolites do not match
exactly
No mapping of unknown metabolites
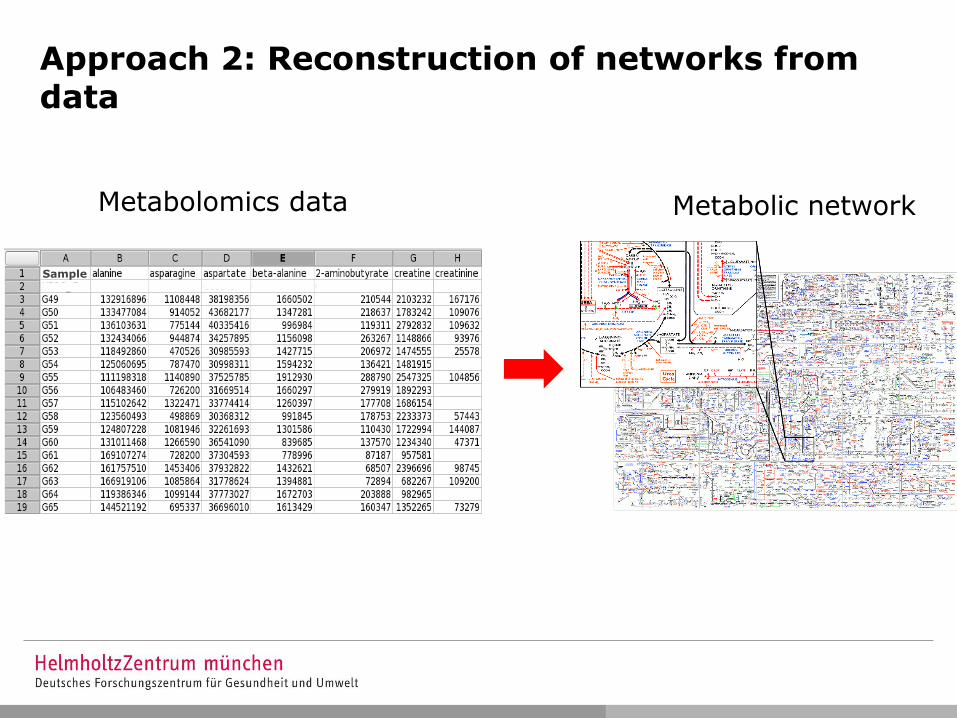
Approach 2: Reconstruction of networks from data
Metabolomics data Metabolic network
Sample
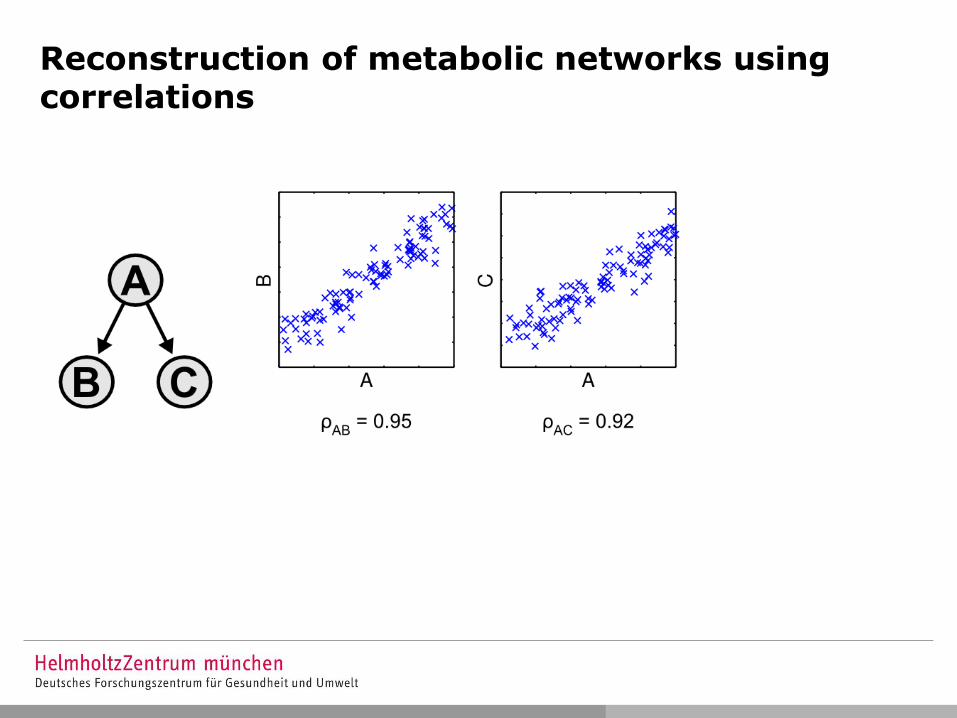
Reconstruction of metabolic networks using correlations
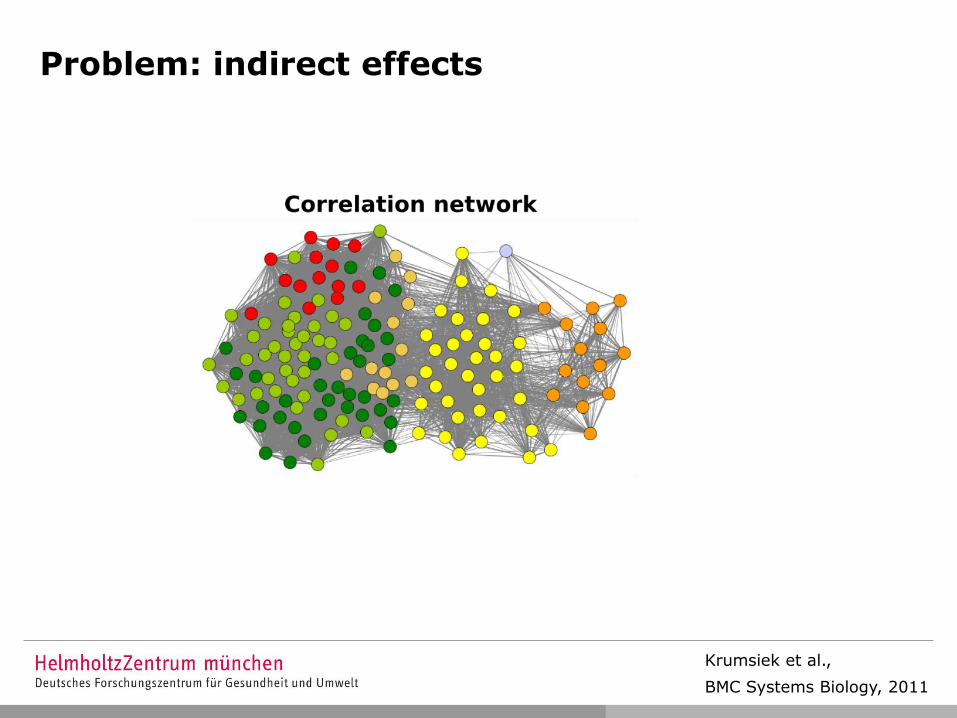
Krumsiek et al.,
BMC Systems Biology, 2011
Problem: indirect effects
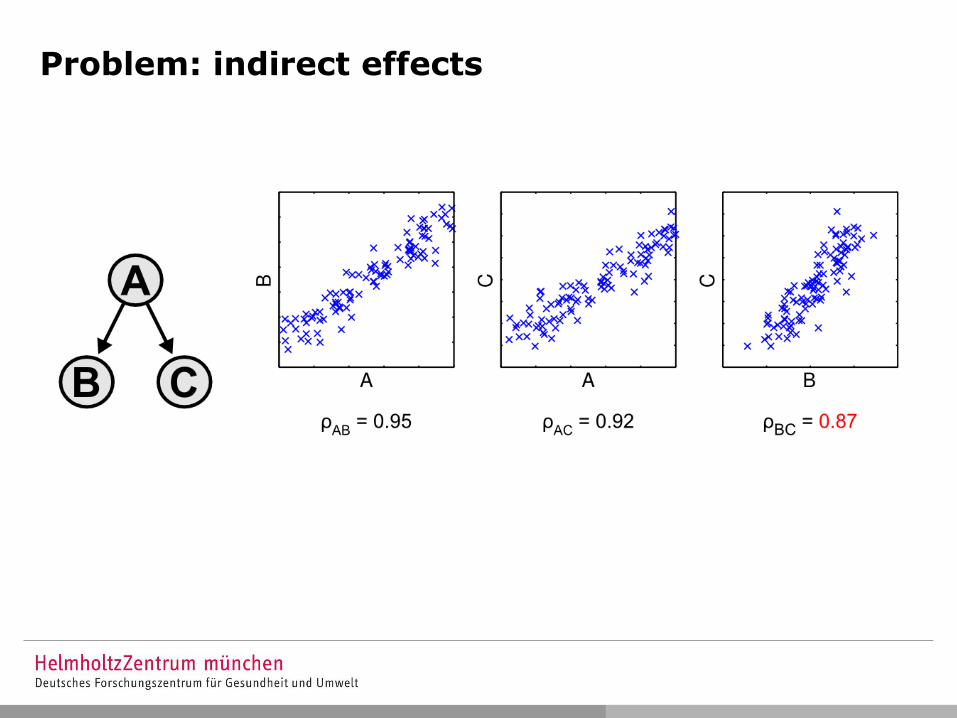
Problem: indirect effects
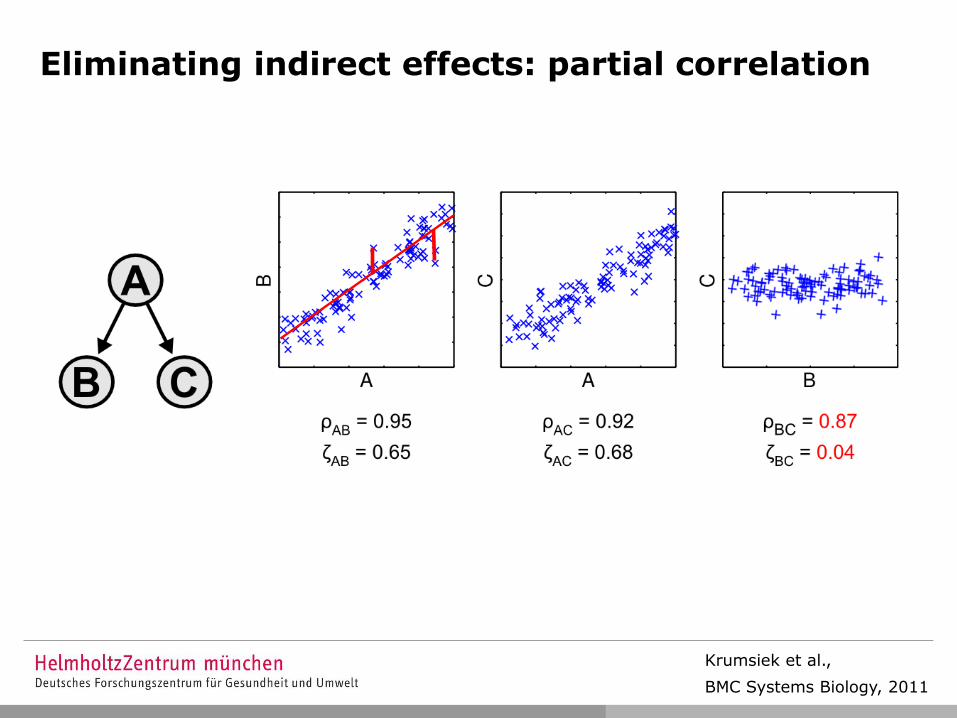
Eliminating indirect effects: partial correlation
Krumsiek et al.,
BMC Systems Biology, 2011
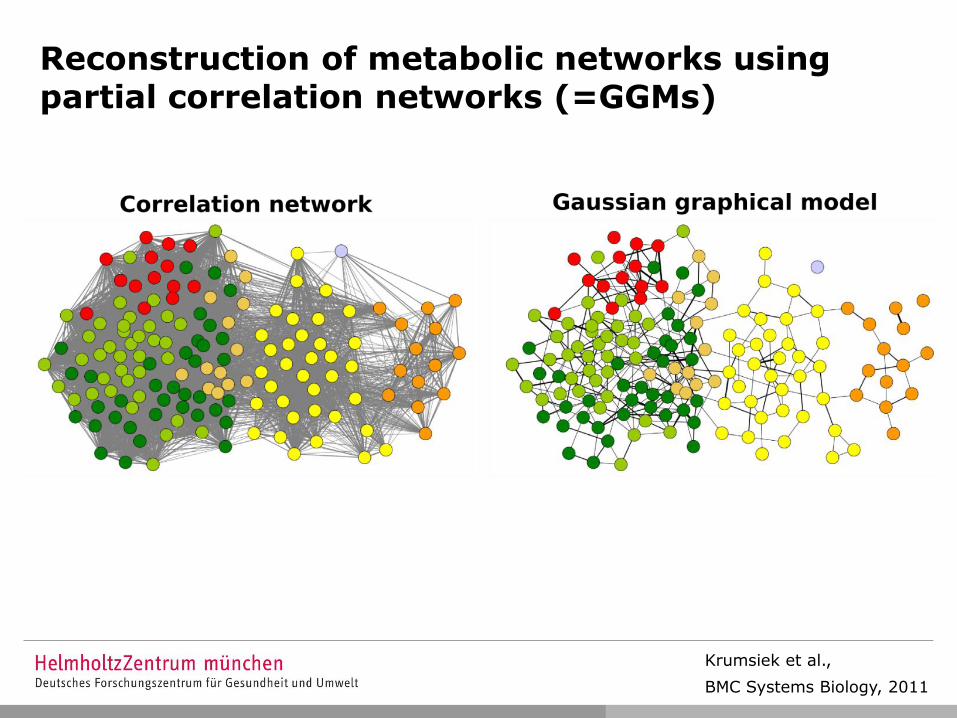
Reconstruction of metabolic networks using partial correlation networks (=GGMs)
Krumsiek et al.,
BMC Systems Biology, 2011
+
Metabolic databases
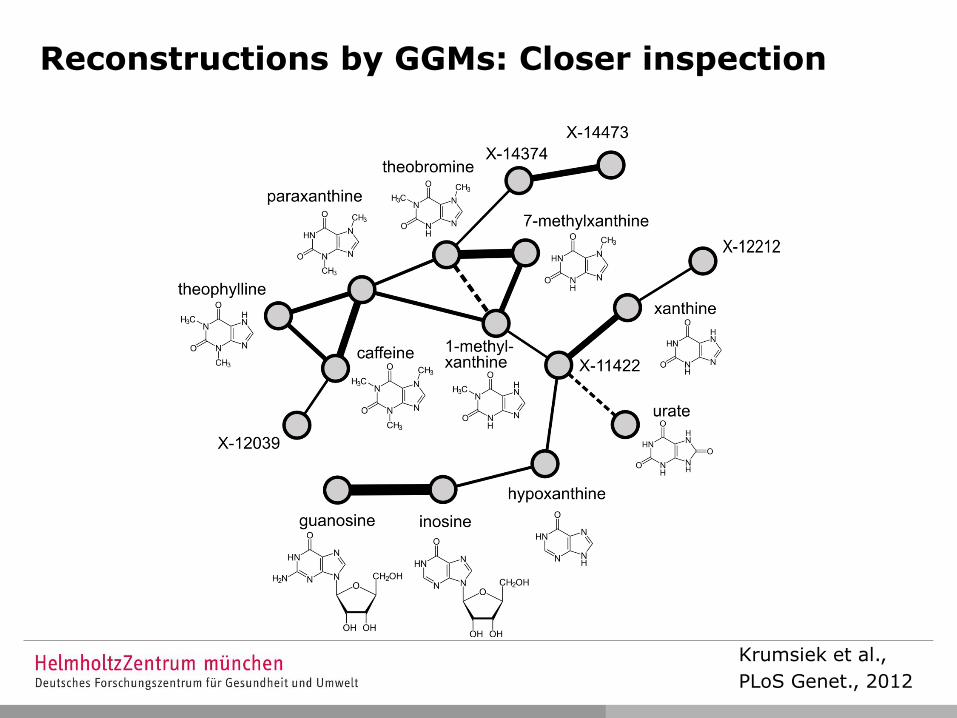
Krumsiek et al.,
PLoS Genet., 2012
Reconstructions by GGMs: Closer inspection

APPLICATIONS & AIMS
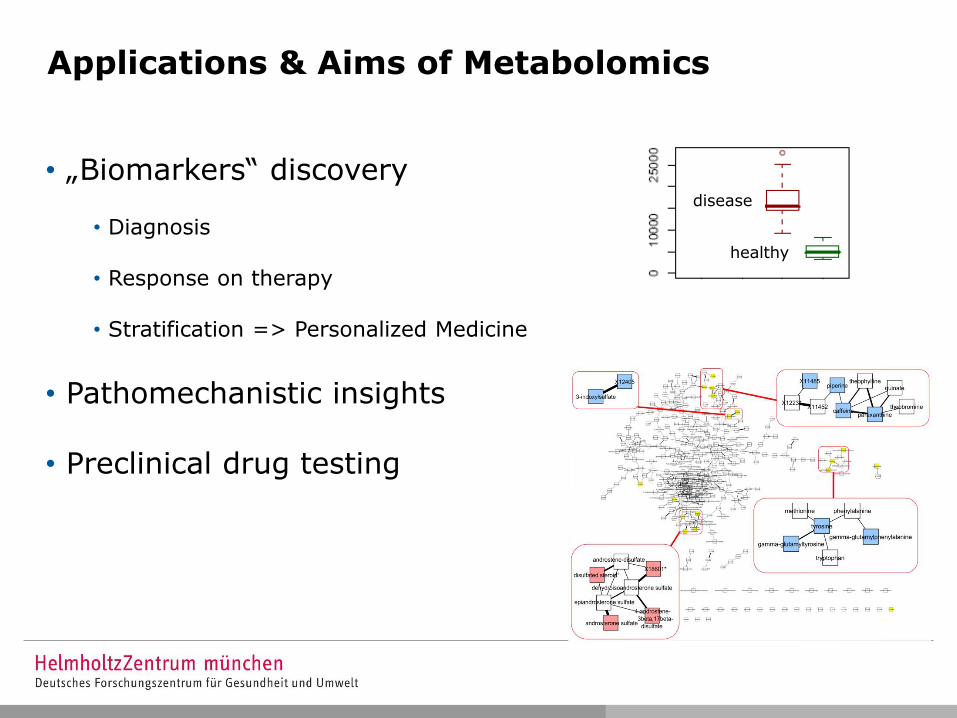
Applications & Aims of Metabolomics
• „Biomarkers“ discovery
• Diagnosis
• Response on therapy
• Stratification => Personalized Medicine
• Pathomechanistic insights
• Preclinical drug testing
disease
healthy
Applications & Aims of Metabolomics
• Biomarkers discovery
• Diagnosis
• Response on therapy
• Stratification => Personalized Medicine
• Pathomechanistic insights
• Preclinical drug testing
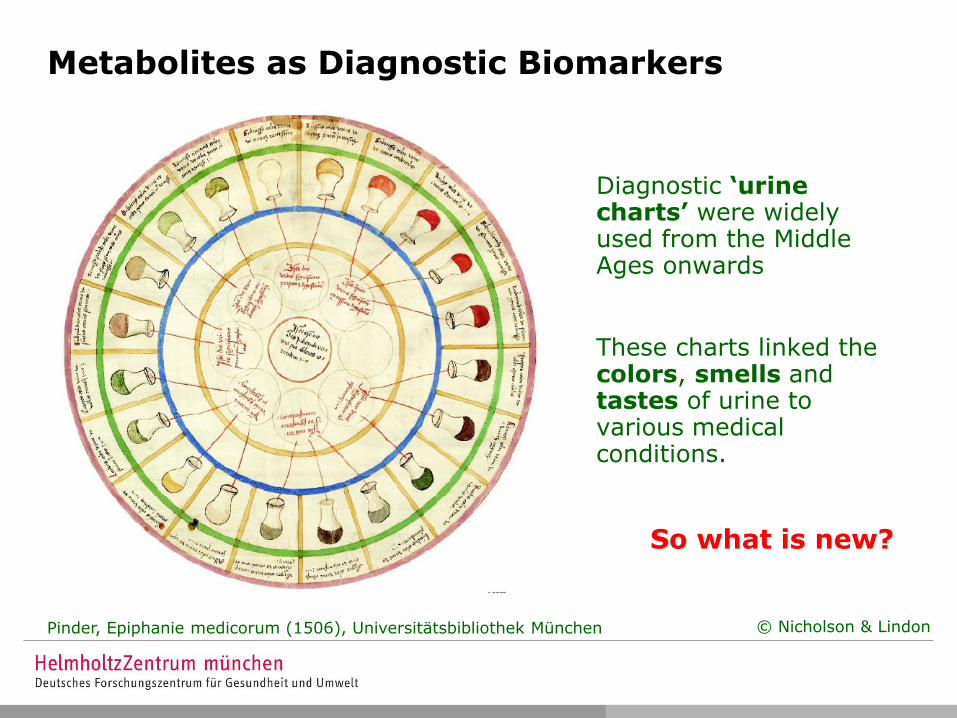
Diagnostic ‘urine charts’ were widely used from the Middle Ages onwards
These charts linked the colors, smells and tastes of urine to various medical conditions.
© Nicholson & Lindon
So what is new?
Pinder, Epiphanie medicorum (1506), Universitätsbibliothek München
Metabolites as Diagnostic Biomarkers
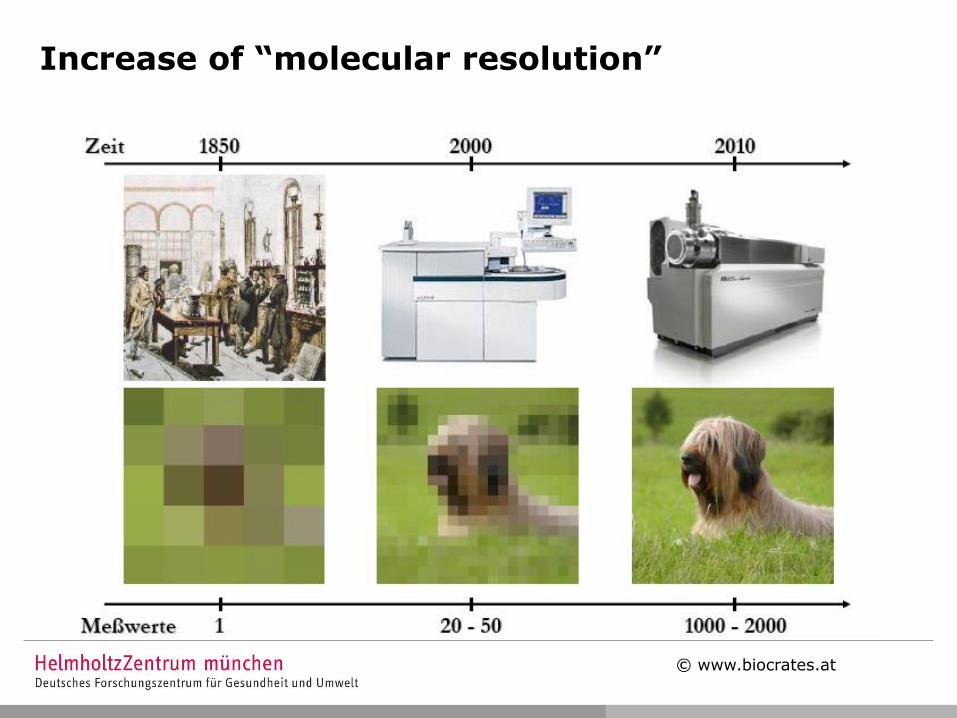
Increase of “molecular resolution”
© www.biocrates.at
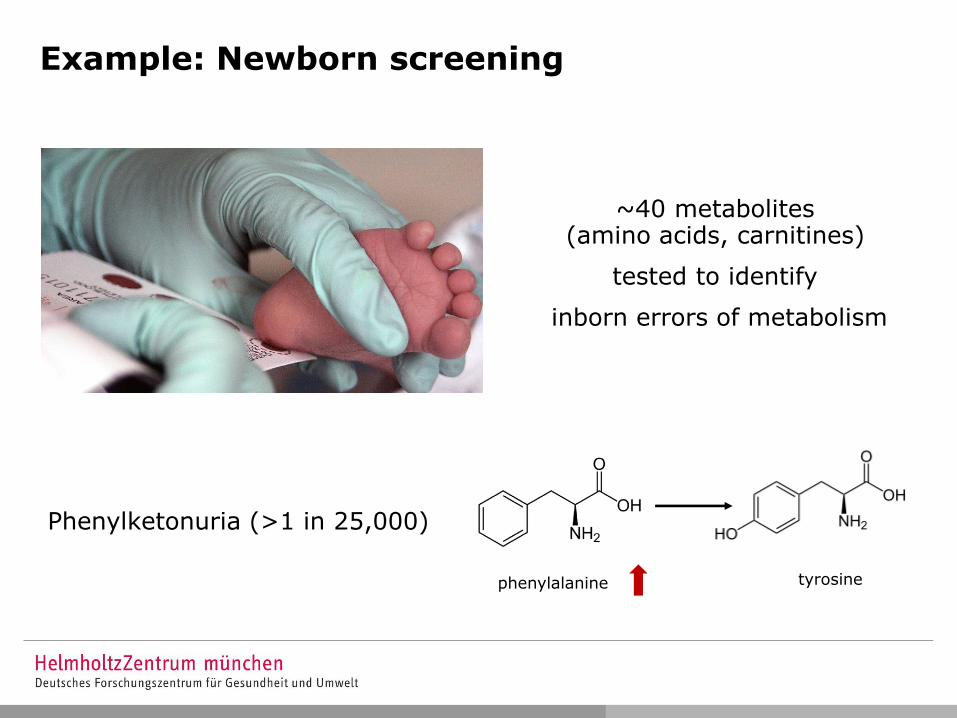
Example: Newborn screening
phenylalanine tyrosine
Phenylketonuria (>1 in 25,000)
~40 metabolites (amino acids, carnitines)
tested to identify
inborn errors of metabolism
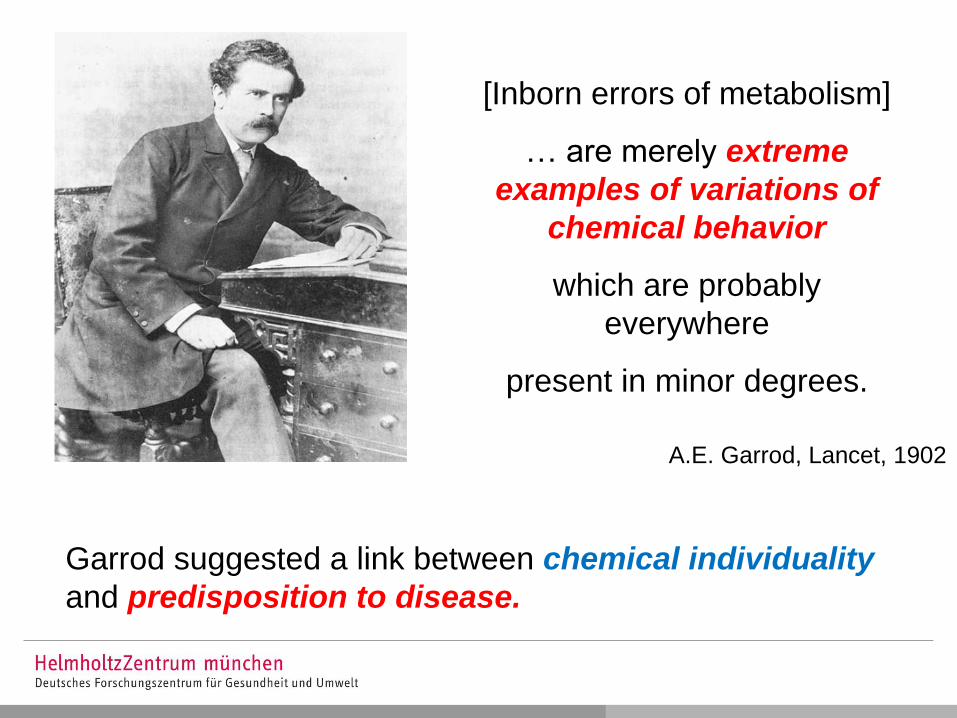
[Inborn errors of metabolism]
… are merely extreme
examples of variations of
chemical behavior
which are probably
everywhere
present in minor degrees.
A.E. Garrod, Lancet, 1902
Garrod suggested a link between chemical individuality
and predisposition to disease.
THE “NORMAL” HUMAN METABOLOME (HUMET) Krug et al., FASEB, 2012
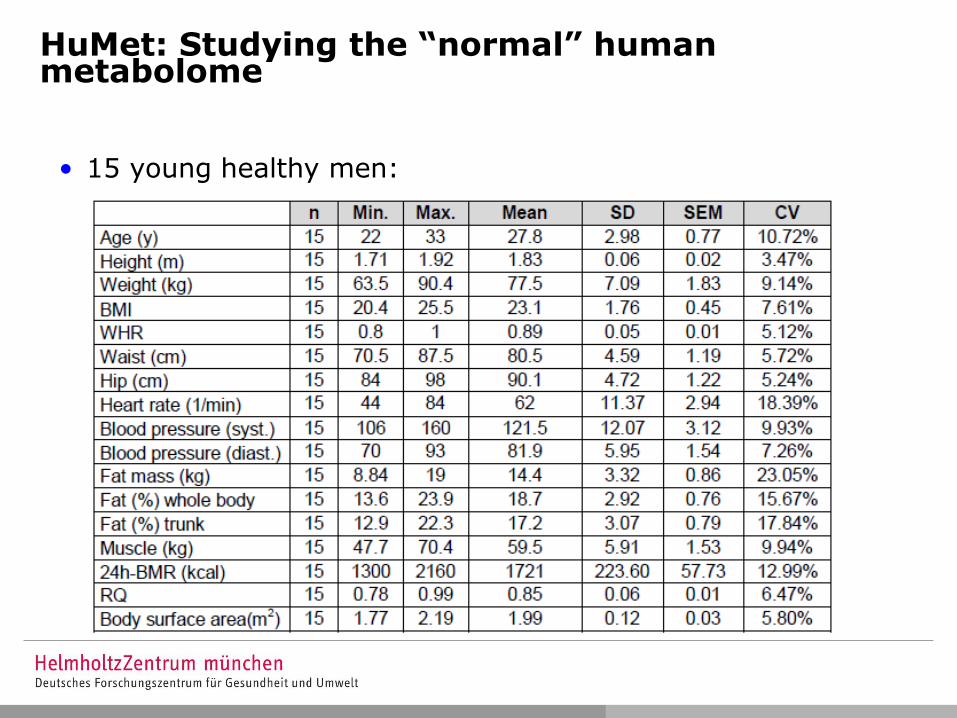
HuMet: Studying the “normal” human metabolome
• 15 young healthy men:
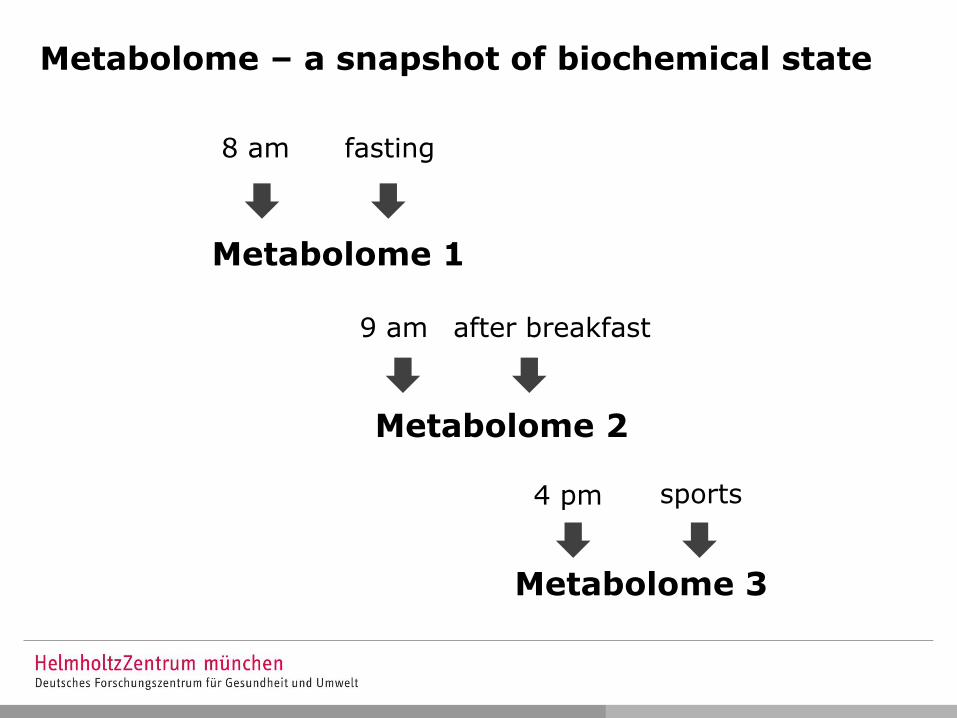
Metabolome – a snapshot of biochemical state
Metabolome 1
Metabolome 2
Metabolome 3
8 am fasting
9 am after breakfast
4 pm sports
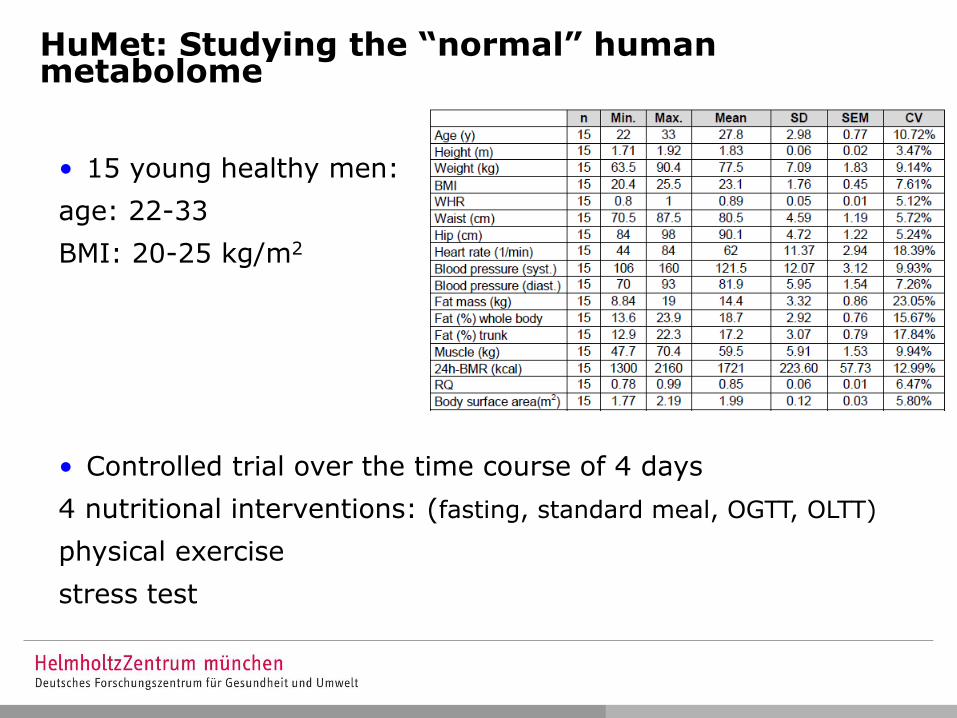
HuMet: Studying the “normal” human metabolome
• 15 young healthy men:
age: 22-33
BMI: 20-25 kg/m2
• Controlled trial over the time course of 4 days
4 nutritional interventions: (fasting, standard meal, OGTT, OLTT)
physical exercise
stress test
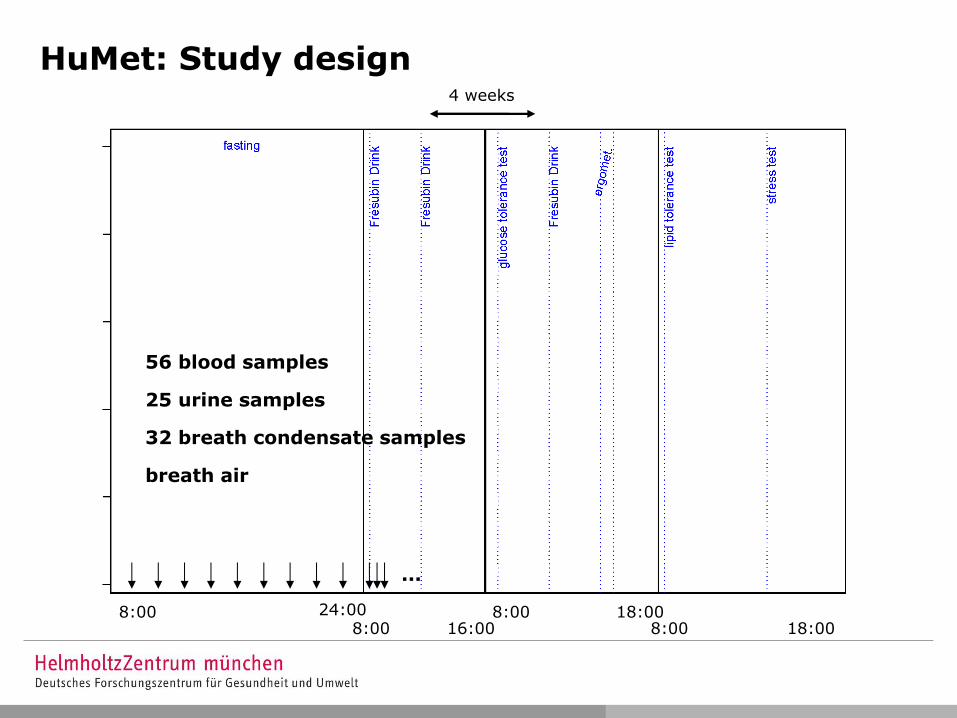
HuMet: Study design
8:00 24:00 8:00 16:00
...
8:00 18:00 8:00 18:00
4 weeks
56 blood samples
25 urine samples
32 breath condensate samples
breath air
O
O
O
O
ON
+
OP
O
O
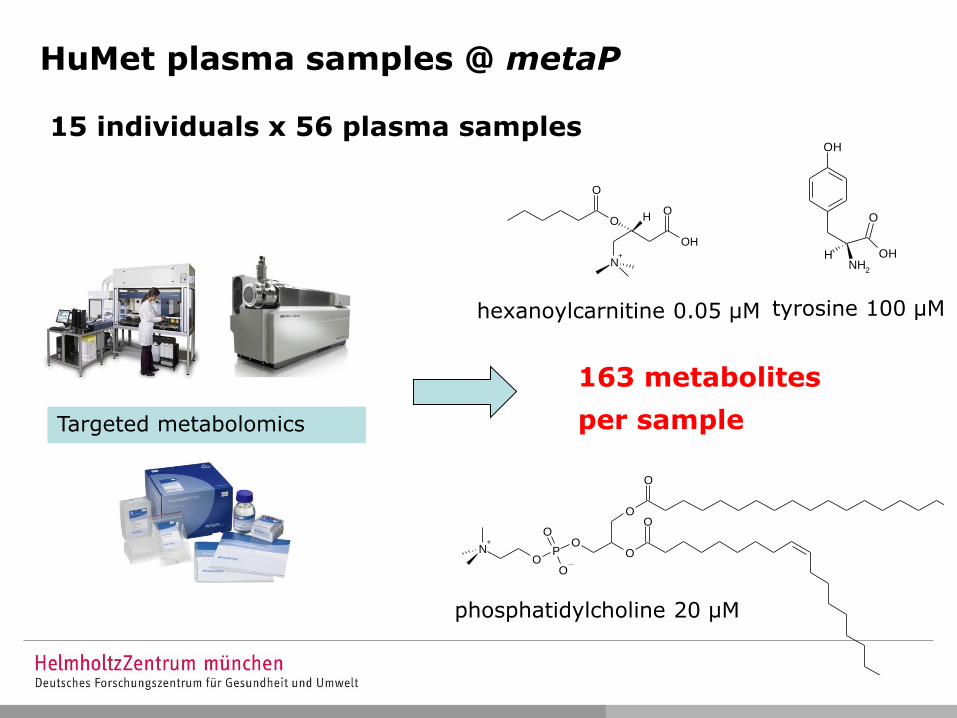
HuMet plasma samples @ metaP
Targeted metabolomics
HNH
2
OH
O
OH
tyrosine 100 µM
163 metabolites
per sample
phosphatidylcholine 20 µM
hexanoylcarnitine 0.05 µM
O
O
OH
O
N+
H
15 individuals x 56 plasma samples
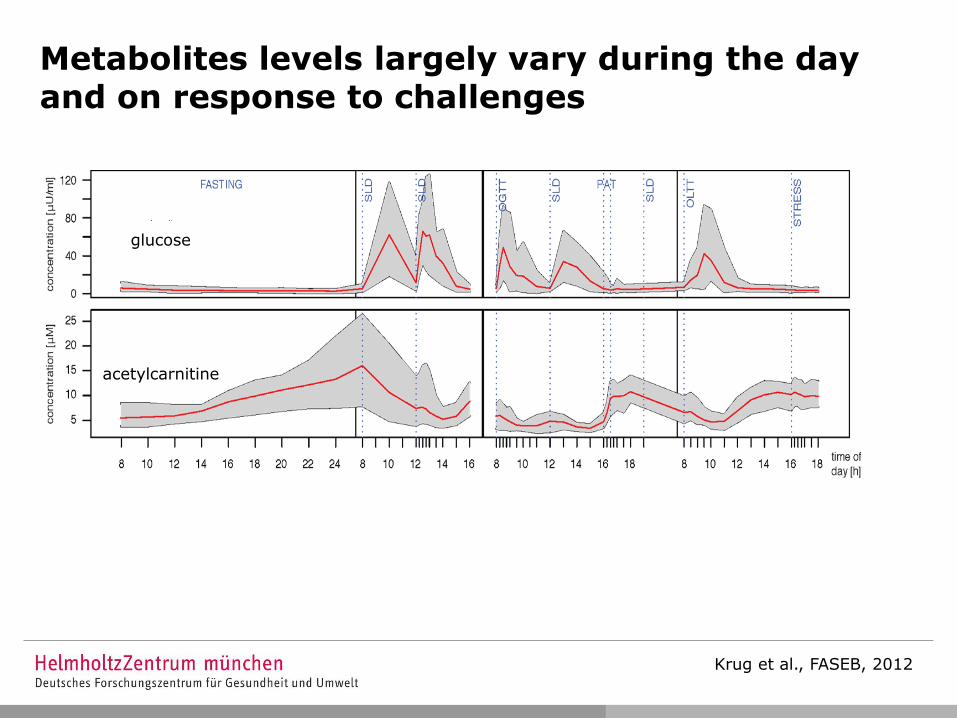
Metabolites levels largely vary during the day and on response to challenges
glucose
acetylcarnitine
Krug et al., FASEB, 2012

sta
ndard
ized c
oncentr
ations
Switching from anabolism to catabolism and back …
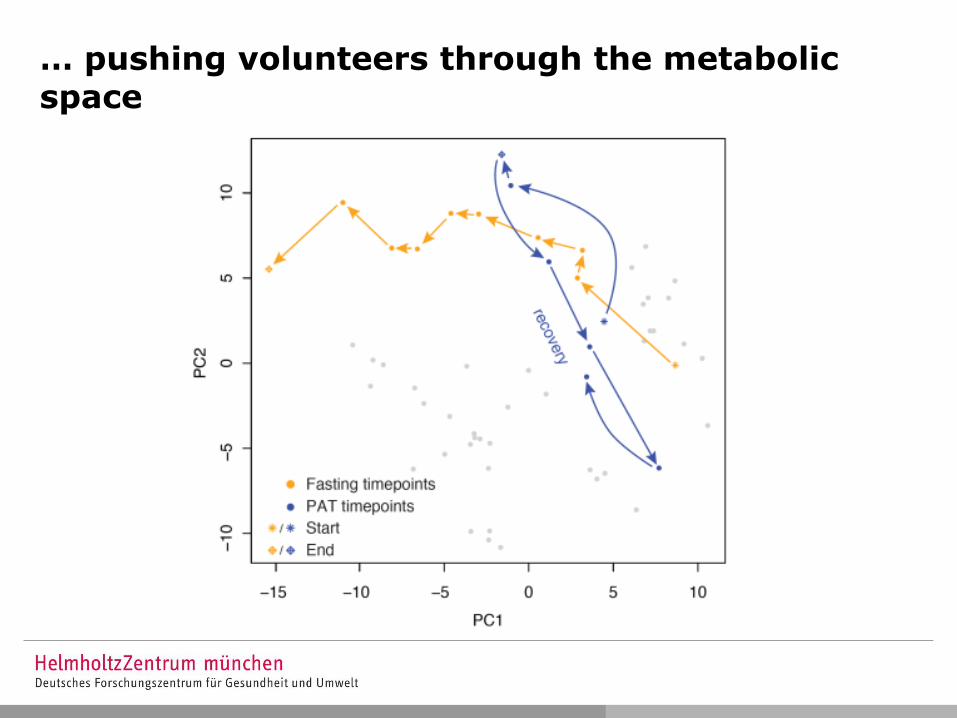
… pushing volunteers through the metabolic space
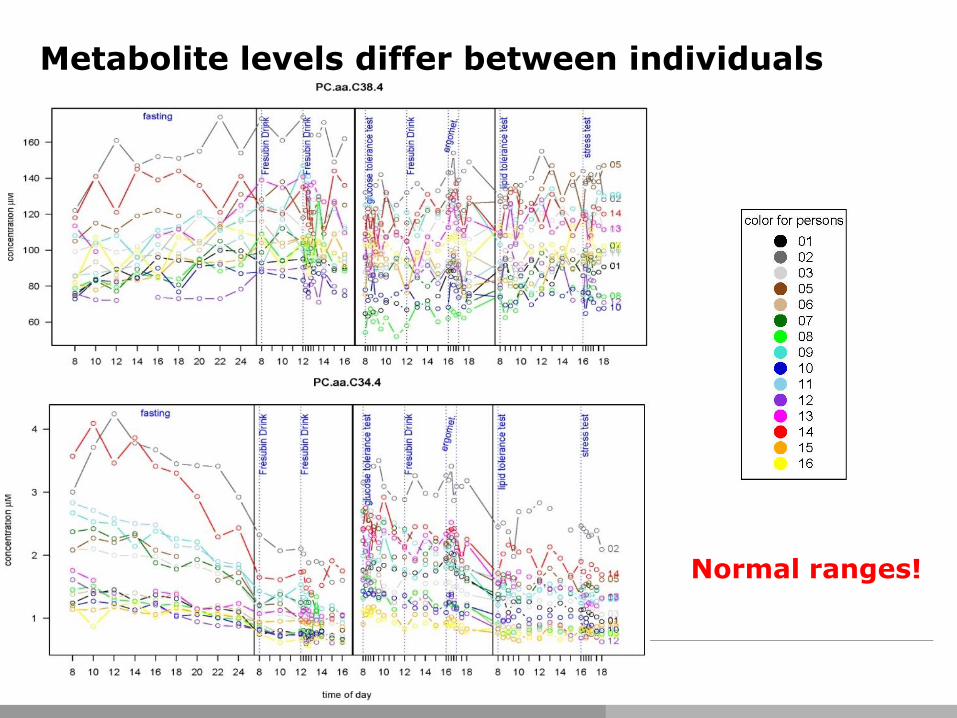
Metabolite levels differ between individuals
Normal ranges!
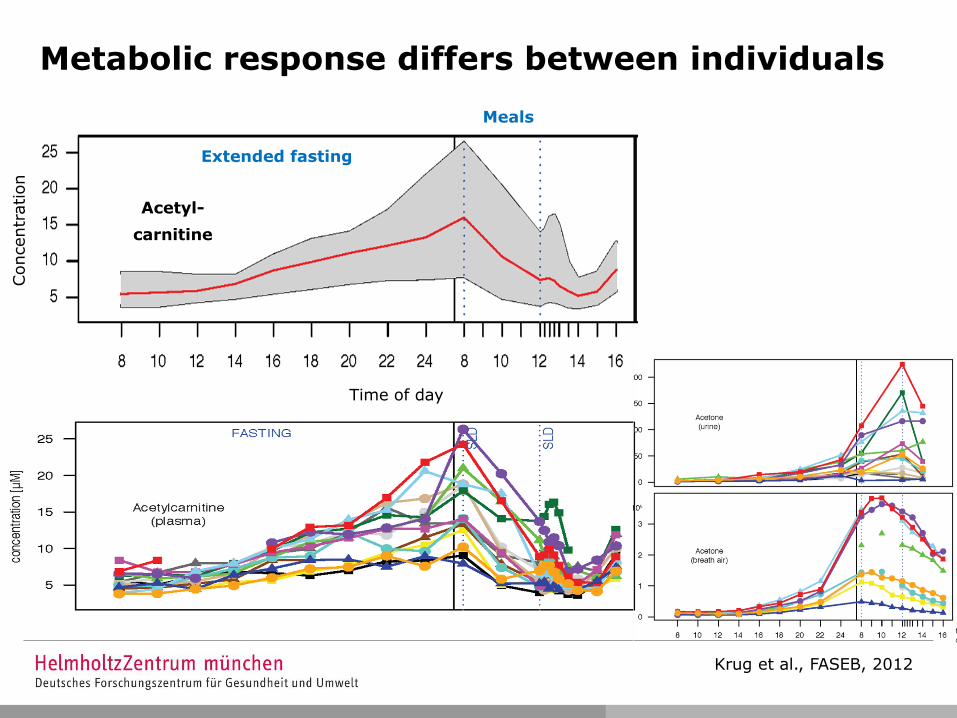
Metabolic response differs between individuals
Krug et al., FASEB, 2012
Acetyl-
carnitine
Time of day
Extended fasting
Meals
Concentr
ation
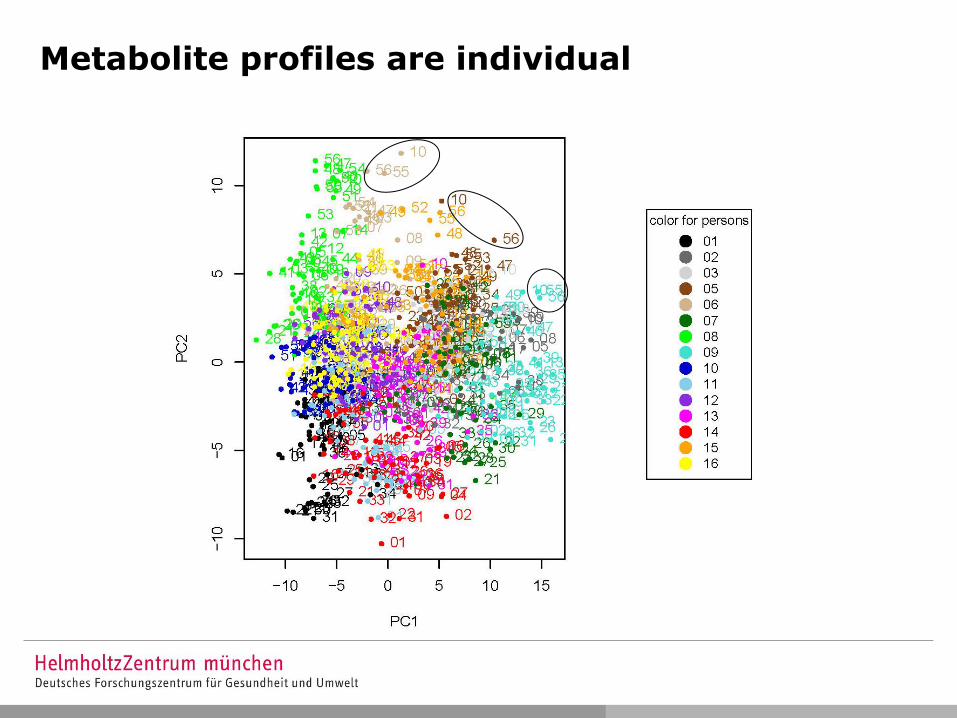
Metabolite profiles are individual
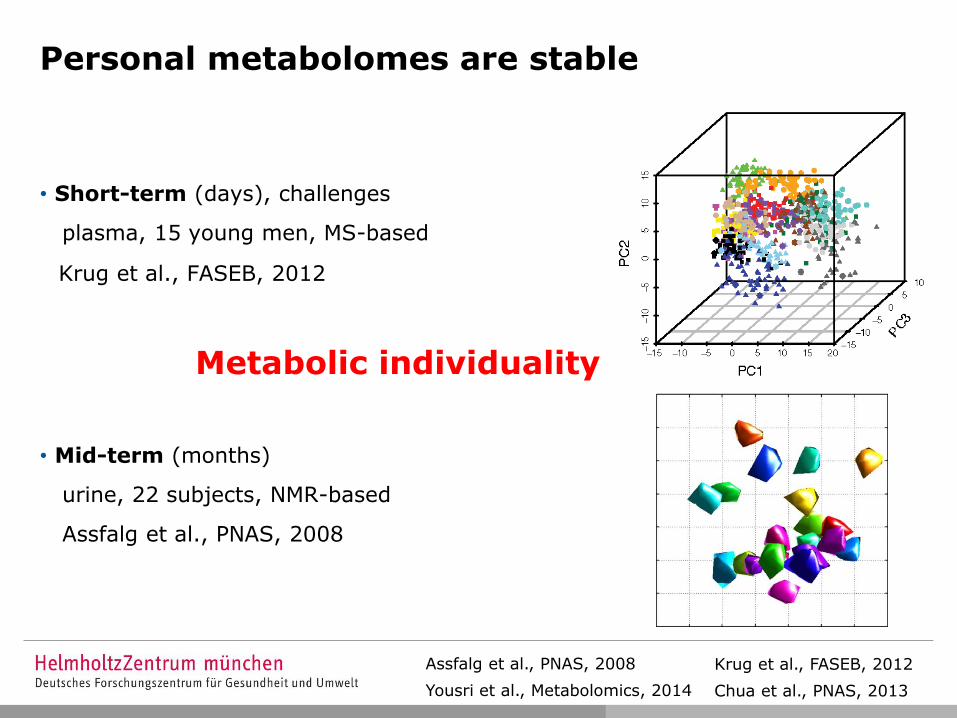
Personal metabolomes are stable
• Short-term (days), challenges
plasma, 15 young men, MS-based
Krug et al., FASEB, 2012
• Mid-term (months)
urine, 22 subjects, NMR-based
Assfalg et al., PNAS, 2008
Metabolic individuality
Krug et al., FASEB, 2012
Chua et al., PNAS, 2013
Assfalg et al., PNAS, 2008
Yousri et al., Metabolomics, 2014
Long-term stability (years)?
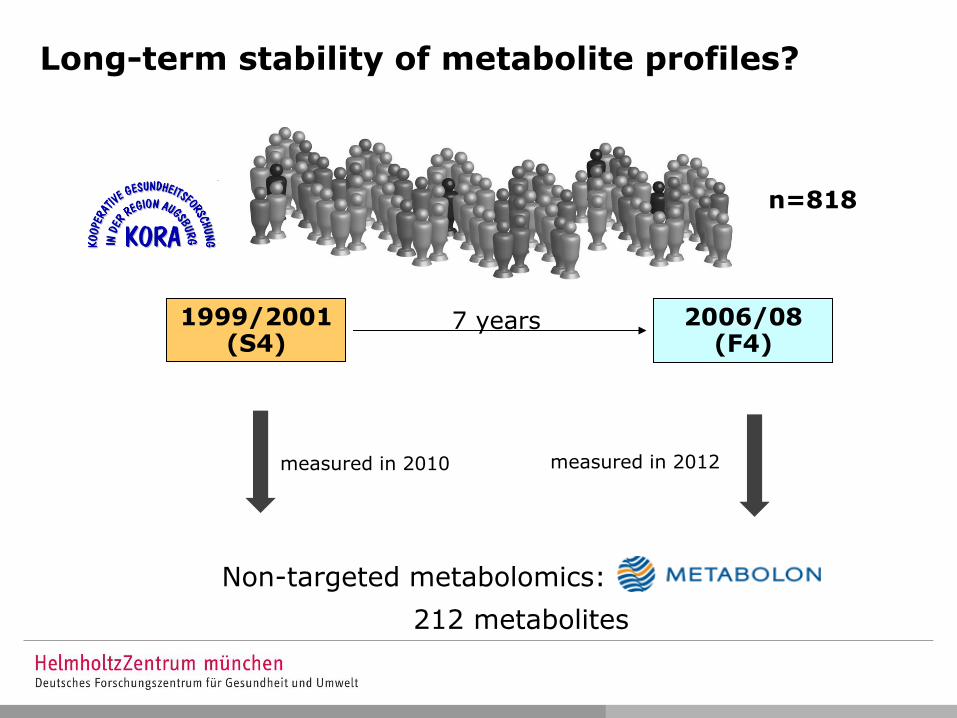
1999/2001 (S4)
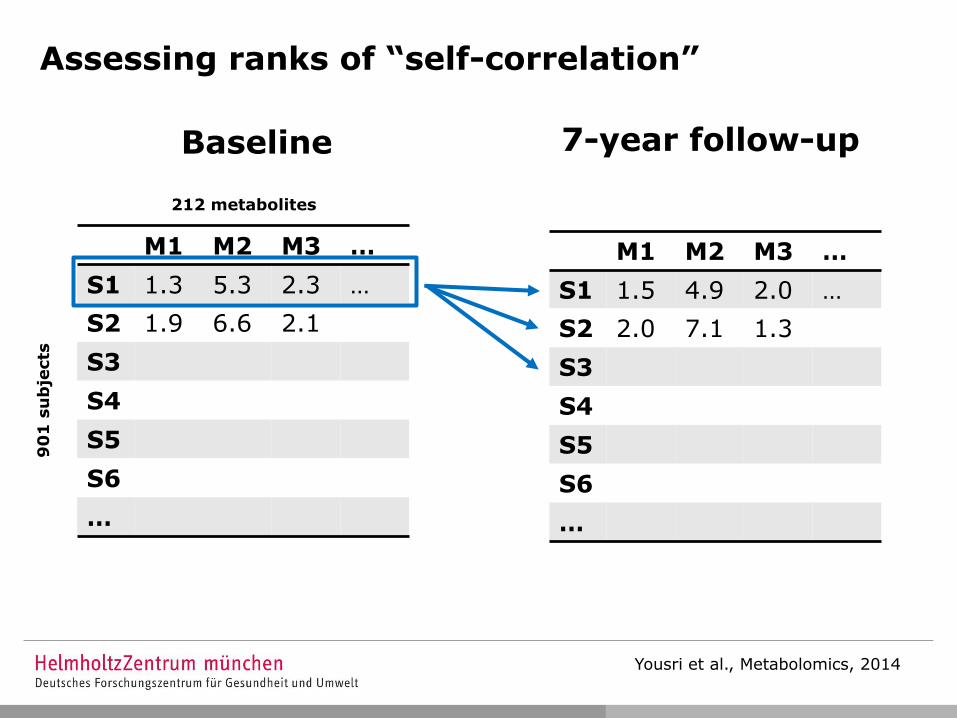
Long-term stability of metabolite profiles?
Non-targeted metabolomics:
212 metabolites
n=818
2006/08 (F4)
7 years
measured in 2010 measured in 2012
M1 M2 M3 …
S1 1.3 5.3 2.3 …
S2 1.9 6.6 2.1
S3
S4
S5
S6
…
M1 M2 M3 …
S1 1.5 4.9 2.0 …
S2 2.0 7.1 1.3
S3
S4
S5
S6
…
Baseline 7-year follow-up
Assessing ranks of “self-correlation”
Yousri et al., Metabolomics, 2014
212 metabolites
90
1 s
ub
jects
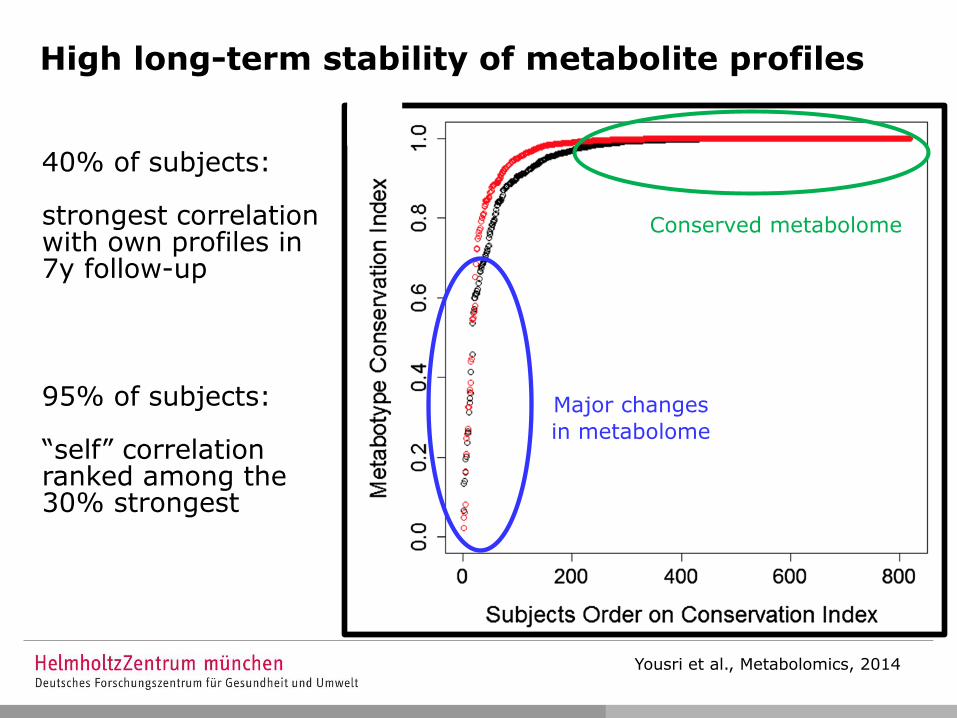
High long-term stability of metabolite profiles
Yousri et al., Metabolomics, 2014
40% of subjects: strongest correlation with own profiles in 7y follow-up
95% of subjects: “self” correlation ranked among the 30% strongest
Major changes
in metabolome
Conserved metabolome
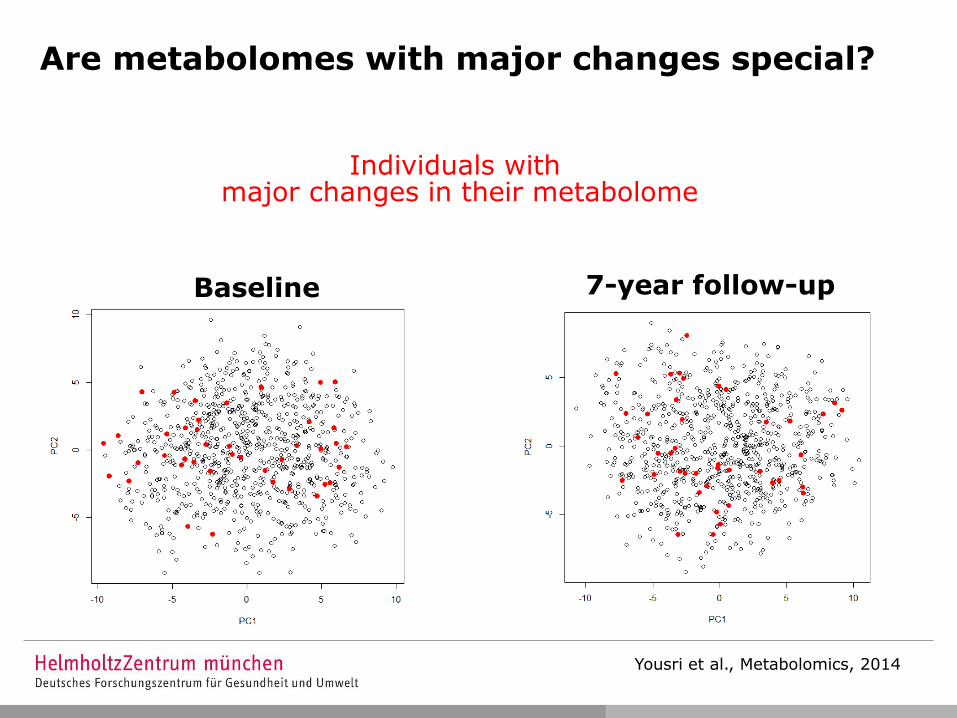
Are metabolomes with major changes special?
Baseline 7-year follow-up
Yousri et al., Metabolomics, 2014
Individuals with major changes in their metabolome
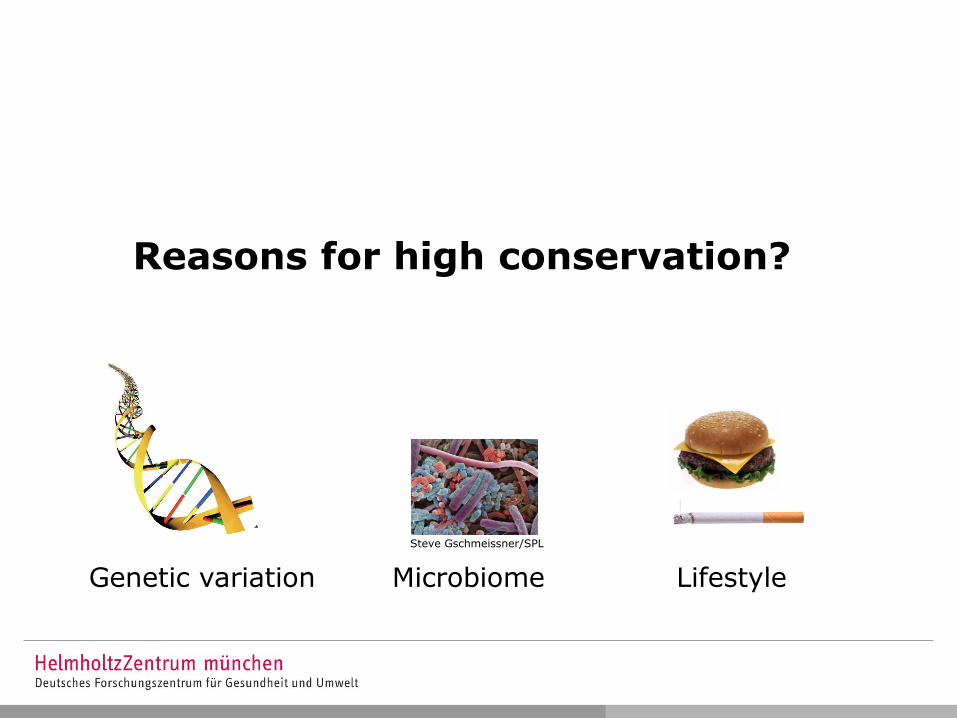
Reasons for high conservation?
Genetic variation Lifestyle Microbiome
Steve Gschmeissner/SPL
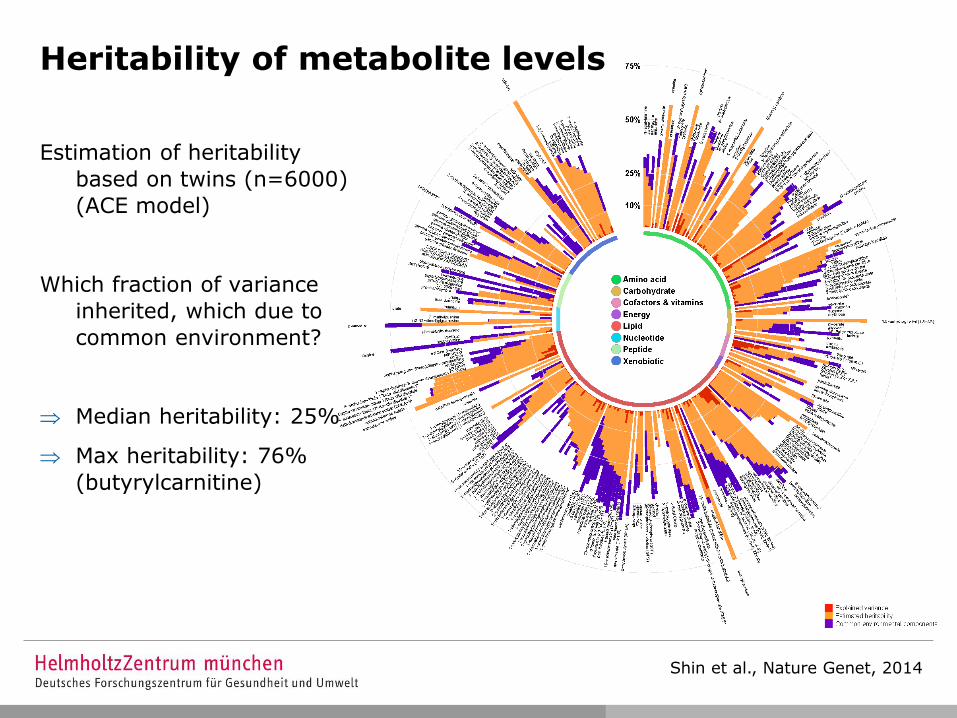
Estimation of heritability
based on twins (n=6000)
(ACE model)
Which fraction of variance
inherited, which due to
common environment?
Median heritability: 25%
Max heritability: 76%
(butyrylcarnitine)
Shin et al., Nature Genet, 2014
Heritability of metabolite levels
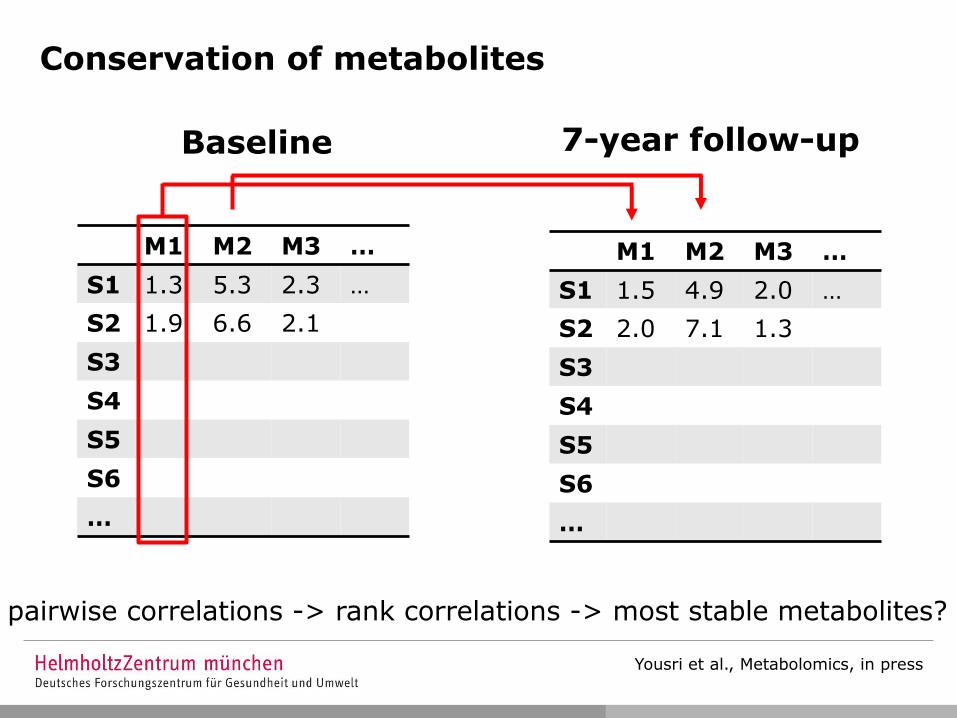
M1 M2 M3 …
S1 1.3 5.3 2.3 …
S2 1.9 6.6 2.1
S3
S4
S5
S6
…
M1 M2 M3 …
S1 1.5 4.9 2.0 …
S2 2.0 7.1 1.3
S3
S4
S5
S6
…
Baseline 7-year follow-up
pairwise correlations -> rank correlations -> most stable metabolites?
Conservation of metabolites
Yousri et al., Metabolomics, in press
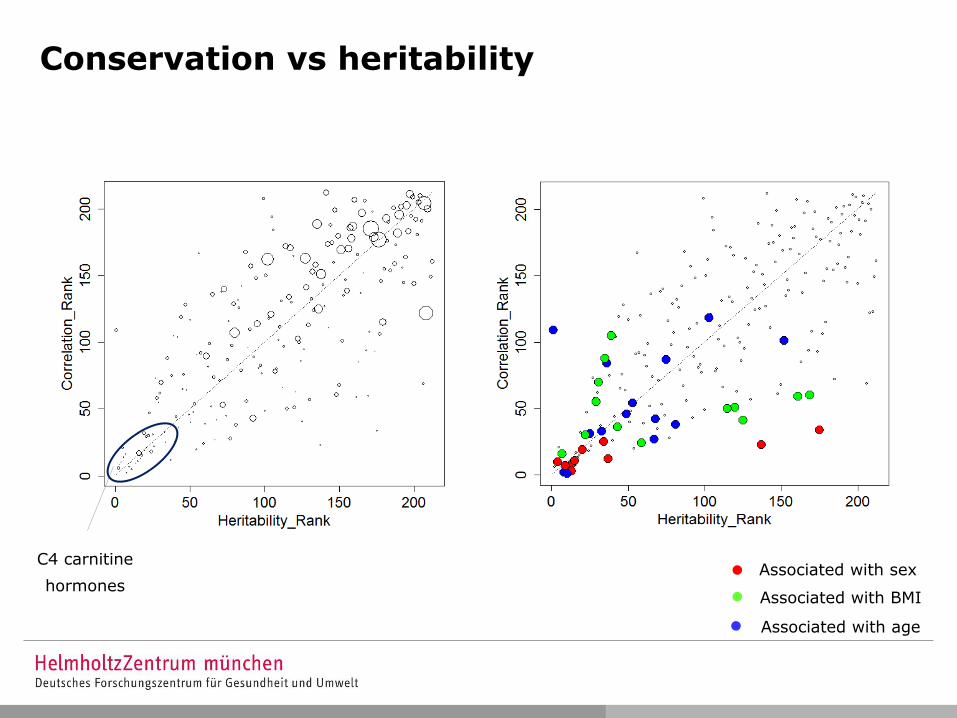
Conservation vs heritability
Associated with sex
Associated with BMI
Associated with age
C4 carnitine
hormones
Can heritability be explained by
common genetic variants?
Partnerships with industry and science
IEG IOEC
IGE AME
Thank you for your attention !
© K. Suhre


![Metabolomics Basics[1]](https://img.pdfslide.us/doc/110x75/553de2815503466f378b4864/metabolomics-basics1.jpg)