Embed Size (px)
Citation preview
Metabolic effects of intravenous lipid emulsions based on LCT (soybean
oil) or LCT/MCT (soybean oil/coconut oil) in preterm infants
Frauke Lehner1, Hans Demmelmair1, Wulf Röschinger1, Tamás Decsi2, Mária Szász2, Károly Adamovich2, Ralf Arnecke3, Berthold Koletzko1
1Dr. von Hauner Childrens Hospital, Ludwig-Maximilians-University, Munich, Germany
2Department of Paediatrics, University Medical School of Pécs, Pécs, Hungary 3Laboratory Becker, Olgemöller&Collegues, Munich, Germany
Running title: LCT/MCT lipid emulsions for preterm infants
Correspondence:
Berthold Koletzko, MD, Professor of Paediatrics
Div. Metabolic Diseases and Nutrition
Dr. von Hauner Children's Hospital, Univ. of Munich
Lindwurmstr. 4
D-80337 Muenchen, Germany
Tel: +49 89 5160 3967, Fax: +49 89 5160 3336
Email: [email protected] 1
Abreviations: AA: arachidonic acid, AGA: appropriate for gestational age ALA: α-linolenic
acid, DGLA: dihohomo γ-linolenic acid, DHA: docosahexaenoic acid, DPA: docosapentaenoic
acid, EPA: eicosapentaenoic acid, EFA: essential fatty acids, GC: gas chromatography, GLA: γ-
linolenic acid, LA: linoleic acid, LC-PUFA: long-chain polyunsaturated fatty acids, LCT: long-
chain triacylglycerols , MCT: medium-chain triacylglycerols, MUFA: monounsaturated fatty
acids, PL: phospholipids, PUFA: polyunsaturated fatty acids, SGA: small for gestational age,
TG: triacylglycerols
by guest, on March 14, 2019
ww
w.jlr.org
Dow
nloaded from
2
Abstract Most lipid emulsions for parenteral feeding of premature infants are based on long-chain
triacylglycerols (LCT), but inclusion of medium-chain-triacylglycerols (MCT) might provide a
more readily oxidisable energy source. The influence of these emulsions on plasma fatty acid
composition and essential fatty acid (EFA) metabolism was studied in twelve premature
neonates, who were randomly assigned to receive either an LCT emulsion (control) or an
emulsion with a mixture of MCT and LCT (1/1, wt/wt) for 8 days. On day 7, all infants received
tracer doses of 13C-labeled linoleic (LA) and α-linolenic acids (ALA) orally. The fatty acid
composition of plasma phospholipids and triacylglycerols and 13C-enrichments of plasma
phospholipid fatty acids were determined on day 8. After 8 days of lipid infusion plasma
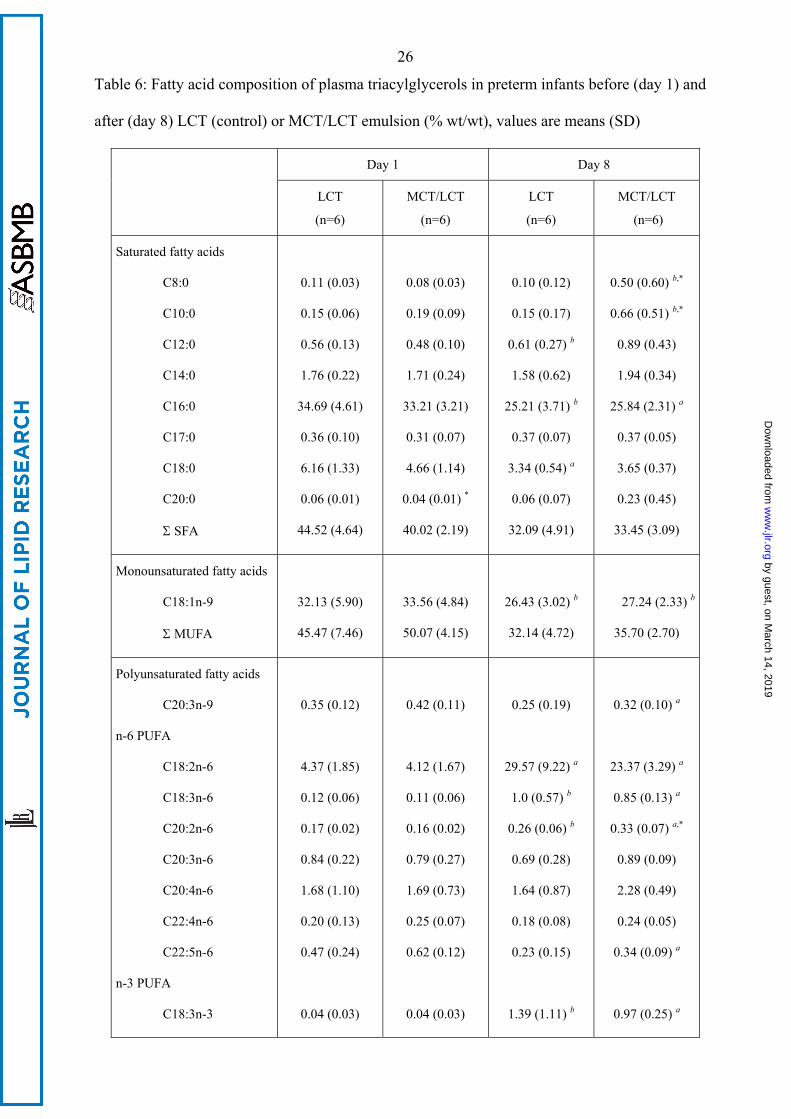
triacylglycerols in the MCT/LCT group had higher contents of C8:0 (0.50±0.60% vs.
0.10±0.12%, M±SD ) and C10:0 (0.66±0.51% vs. 0.15±0.17%) than controls. The MCT/LCT-
group showed a slightly lower LA content of plasma phospholipids (16.47±1.16% vs.
18.57±2.09%), while long chain polyunsaturated derivatives (LC-PUFA) of LA and ALA tended
to be higher in the MCT/LCT group. The tracer distributions between precursor fatty acids and
products (LC-PUFA) were not significantly different between groups. Both lipid emulsions
achieve similar plasma EFA contents and similar proportional conversion of EFA to LC-PUFA.
The MCT/LCT emulsion seems to protect EFA and LC-PUFA from ß-oxidation.
Key words: premature infants, medium chain triacylglycerols, long chain triacylglycerols, long
chain polyunsaturated fatty acids, essential fatty acids, stable isotope
by guest, on March 14, 2019
ww
w.jlr.org
Dow
nloaded from
3
Introduction
For many paediatric patients, parenteral nutrition is an essential and often life-saving therapy (1).
Parenteral nutrition of infants and children depends on the use of lipid emulsions that provide a
high energy density in an isotonic solution and supply essential fatty acids (EFA) and fat soluble
vitamins. In premature infants EFA body stores are very low, while their metabolic requirements
are high, therefore, EFA supply is of critical importance (2). Conventional fat-emulsions for
premature neonates are prepared from long-chain fatty acid containing triacylglycerols (LCT),
mostly soybean oil. An emulsion based on physical mixtures of LCT and medium-chain-
triacylglycerols (MCT) is widely used for the parenteral nutrition of adult patients and provides
an energy source which is rapidly oxidised (3). The MCT/LCT-emulsion provides less
polyunsaturated fatty acids (PUFA) than an LCT-emulsion, and thus has been associated with a
lower risk of lipid peroxidation and less alterations of membrane structures (4). High amounts of
linoleic acid (LA, C18:2n-6) and α-linolenic acid (ALA, C18:3n-3) were reported to inhibit ∆6-
desaturation, the initial step in the formation of long-chain polyunsaturated fatty acids (LC-
PUFA) (5). Thus we hypothesized that a reduced supply of LA and ALA with the MCT/LCT
emulsion might enhance LC-PUFA formation.
Because of the fast growth of brain and retina during the perinatal period, an inadequate supply
of LC-PUFA, mainly arachidonic acid (AA, C20:4n-6) and docosahexaenoic acid (DHA,
C22:6n-3), may have profound effects on the development of brain and visual function of
preterm infants (6, 7). Although infants are able to synthesise LC-PUFA from LA (C18:2n-6)
and ALA (C18:3n-3) by desaturation and elongation from the first postnatal week onwards, the
rate of synthesis seems to be rather low relative to the requirements for tissue incorporation (8,
9).
In human adults, infused MCT are oxidised faster and to a greater extent than LCT (10), but data
on their metabolism in infants are scarce (1, 11). We hypothesised that in preterm infants the
supply of a MCT/LCT-emulsion would result in predominant oxidation of MCT, rather than
by guest, on March 14, 2019
ww
w.jlr.org
Dow
nloaded from
4
LCT, as a major energy source, and thus via decreased LCT oxidation the lower LCT intake
might be partly compensated by a higher availability of LCT for structural functions and for
conversion into LC-PUFA.
In this randomised study in preterm infants who received total parenteral nutrition for 8 days, we
compared the effects of a MCT/LCT-based emulsion and of a LCT emulsion on the fatty acid
composition of plasma phospholipids (PL) and triacylglycerols (TG). For a more detailed
description of the metabolism of EFA and its LC-PUFA derivatives we applied 13C-labeled fatty
acid tracers, which allow for the comparison of endogenous LC-PUFA synthesis under different
conditions (12, 13).
by guest, on March 14, 2019
ww
w.jlr.org
Dow
nloaded from
5
Subjects and Methods
Premature neonates were recruited in the Division of Neonatology, University of Pécs, Hungary.
Inclusion criteria for the study were: gestational age between 25 and 37 weeks, birth weight
below 3000 g, the indication for total parenteral feeding (expected enteral feeding < 20 % of
daily energy intake) for at least 8 days, and the intention to supply a lipid emulsion within 48
hours after birth. Infants with known metabolic diseases were excluded.
In the randomised, double-blind trial, premature infants were assigned either to the control group
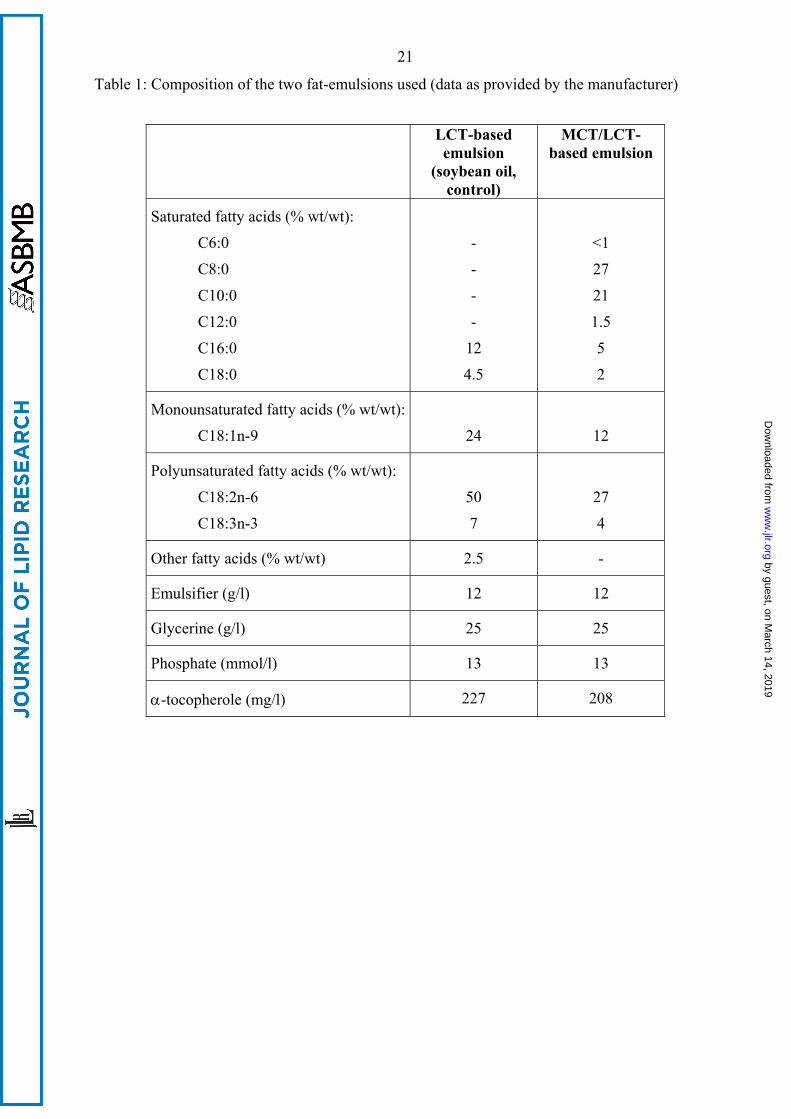
receiving a conventional 20% LCT fat emulsion (soy bean oil; Lipofundin N 20%) or to the
MCT/LCT group who received a 20% MCT/LCT emulsion [physical mixture (1:1 by weight) of
soybean oil and coconut oil; Lipofundin MCT 20%; Tab 1]. The parenteral nutrition also
provided glucose 10 %, amino acids, electrolytes (sodium chloride, potassium chloride, calcium
gluconate), trace elements (Ped-el, Pharmacia, Budapest, Hungary) and water-soluble vitamins
(Soluvit, Baxter, Deerfield, USA).
On day 7 of the study, 10 mg/kg body weight of uniformly 13C labelled (98 %) linoleic acid and
2 mg/kg body weight of uniformly 13C labelled (98 %) α-linolenic acid (Martek, Bioscience
Corp., Columbia, MD, USA) were given orally to the infants, dissolved in a small volume of
human milk. Blood samples were obtained on day 1 (before introducing the study emulsions), on
day 7 (before tracer application) and on day 8. Biochemical safety parameters were measured
each day of the study (data not shown). The study protocol was approved by the ethical
committee of the University of Pécs and written informed consent was obtained from the parents
of each infant before study entry.
Blood samples
Blood samples were obtained by venipuncture and collected in EDTA tubes. Plasma and red
blood cells were separated by centrifugation at 1500 x g for 5 minutes. An aliquot was used for
by guest, on March 14, 2019
ww
w.jlr.org
Dow
nloaded from
6
measuring plasma lipids (cholesterol, total TG, total PL and total non esterified fatty acids) and
3-hydroxybutyrate. The enzymatic analyses were performed in Pécs (Hungary) with standard
clinical chemistry methods (Lipid-Kits of Boehringer Mannheim, Mannheim, Germany).
Plasma free carnitine and acylcarnitines were determined by electrospray tandem mass
spectrometry (14, 15) and α- and γ-tocopherol by high performance liquid chromatography from
100 µl of plasma (16).
For the analysis of plasma fatty acids an internal standard was added to the samples (trinonanoin
for the quantification of C8:0, C10:0, and C12:0 in TG, dipentadecanoylphosphatidylcholine and
tripentadecanoin for the quantification of fatty acids with 14 or more carbon atoms; Sigma, St
Louis, MO, USA). Samples were extracted with hexane-isopropanol, as previously described
(17). Plasma phospholipids and triacylglycerols were isolated by thin layer chromatography (18).
For transesterification TG were dissolved in a methanolic HCl/hexane mixture, while for the
transesterification of PL pure methanolic HCl was used. After cooling of the mixture, water was
added to TG-samples to achieve phase separation and an aliquot of the organic phase was used
for GC analysis. Evaporation steps were omitted in the preparation of FA-methylesters from TG,
to avoid losses of volatile medium chain fatty acids. After cooling of the PL-samples the reactant
mixture was neutralised with a dry carbonate buffer. Methylesters were extracted twice into
hexane, dried under nitrogen and taken up in hexane containing 2,6 di-tert.-butyl-4-kresol for GC
analysis (19).
Gas liquid chromatography and mass spectrometry
A HP 5890 II gas chromatograph (Hewlett Packard, Waldbronn, Germany), equipped with a
split/splitless injector, a flame ionisation detector and a BPX70 column (length: 60 m, inner
diameter 0.32 mm, SGE, Weiterstadt, Germany) was used for quantitative analyses. The tem-
perature program started at 130 °C and increased with 3 K per minute up to 210 °C. Fatty acid
by guest, on March 14, 2019
ww
w.jlr.org
Dow
nloaded from
7
methyl esters were identified by comparison of the retention times with those of authentical
standard compounds.
13C contents in plasma PL fatty acid methyl esters were determined by gas chromatography-
combustion-isotope ratio mass spectrometry using an HP 5890 series II gas chromatograph and a
Finnigan MAT delta S isotope ratio–mass spectrometer (Thermo Finnigan, Bremen, Germany)
(9). Samples were analysed in duplicate and further calculations were performed with the means
of the δ13C-values (‰) obtained.
Calculations
The δ13C (‰) value is the deviation of the 13C/12C ratio (RFA) of a sample from the 13C/12C ratio
(RPDB) of the PDB (Pee Dee Belmnite) standard in relation to the ratio of the international PDB
standard (20).
δ13CFA [‰] = [(RFA-RPDB)/RPDB] · 1000
The atom percent 13C (APFA, %) of the fatty acid methyl ester was calculated as the percentage
content of 13C relative to the total C:
APFA = RFA / (1+ RFA) · 100
13C contents on day 7 were used as baseline values and subtracted from the values of day 8, to
obtain tracer induced atom percent excess (APEFA):
APEFA = APFA day 8 - APFA day 7
Absolute tracer concentrations in plasma PL fatty acids (µmol 13C/l) were calculated as µmol of
13C derived from the tracer in each fatty acid per litre plasma.
Tracer-13CFA [µmol/l] = µMolFA · (number of carbon atoms of FA + 1) · APEFA/ 100
by guest, on March 14, 2019
ww
w.jlr.org
Dow
nloaded from
8
Statistical analyses
Statistical analyses were performed using SAS (SAS System for Windows, Release 6.12, SAS
Institute Inc., Cary, NC, USA). Results are given as mean and standard deviation. Differences
between the two feeding groups were examined by the U-Mann-Whitney-Wilcoxon test. Sig-
nificant differences over time within one feeding group were examined by paired t-tests. Sta-
tistical significance was assumed with p < 0.05.
by guest, on March 14, 2019
ww
w.jlr.org
Dow
nloaded from
9
Results
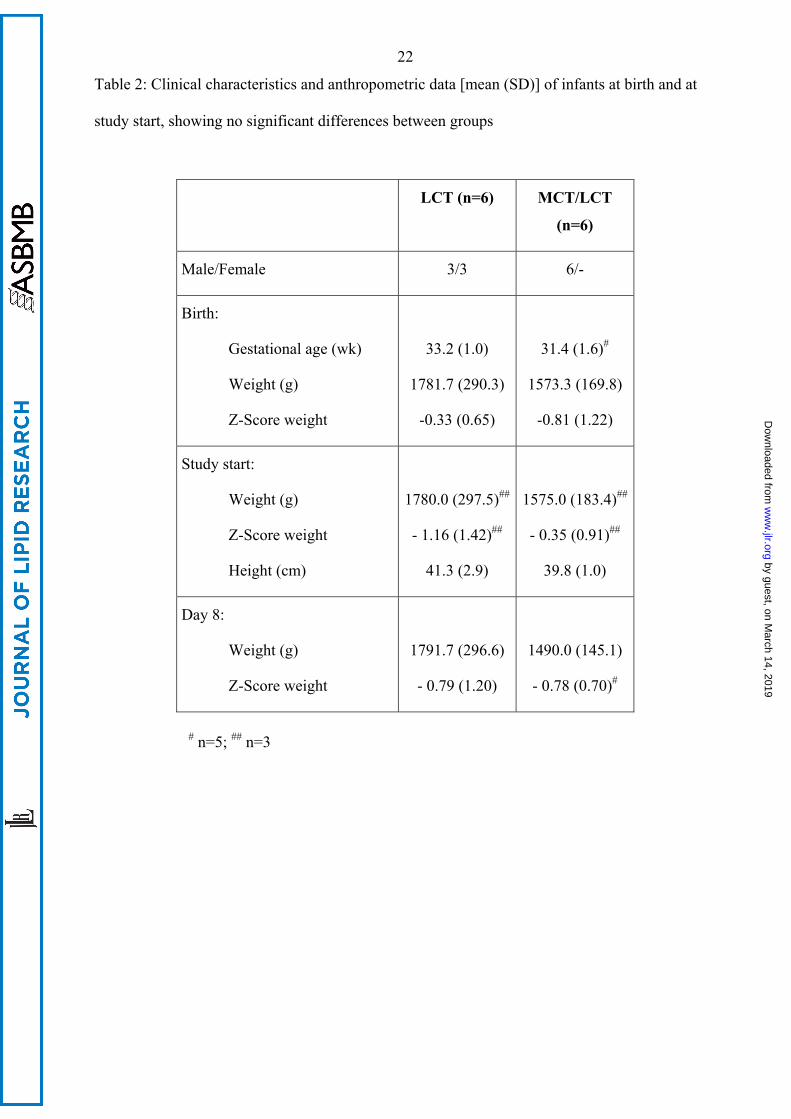
Fifteen infants were enrolled and randomised, 12 (6 per group) completed the study according to
the protocol (Tab. 2). Three infants, all assigned to the MCT/LCT group, were excluded because
of wrong randomisation, breaching of the study-conditions, and contraindication against the
feeding protocol, respectively. No drop out was related to any adverse effects of the study
medication.
In the control group, birth weights were appropriate for gestational age (AGA) in 5 infants and
small for gestational age (SGA) in 1, whereas all infants in the MCT/LCT-group were AGA. At
baseline the MCT/LCT-group tended to have a lower body weight than the control group, which
was preserved until day 8 (Tab. 2) and day 10 (1545±140 g vs. 1802±282 g). Z-scores for body
weight were calculated based on the data of the longitudinal study of Kramer et al. (21) and
showed no group differences (Tab. 2). Average daily nutrient intakes for days 1 to 9 are shown
in Table 3.
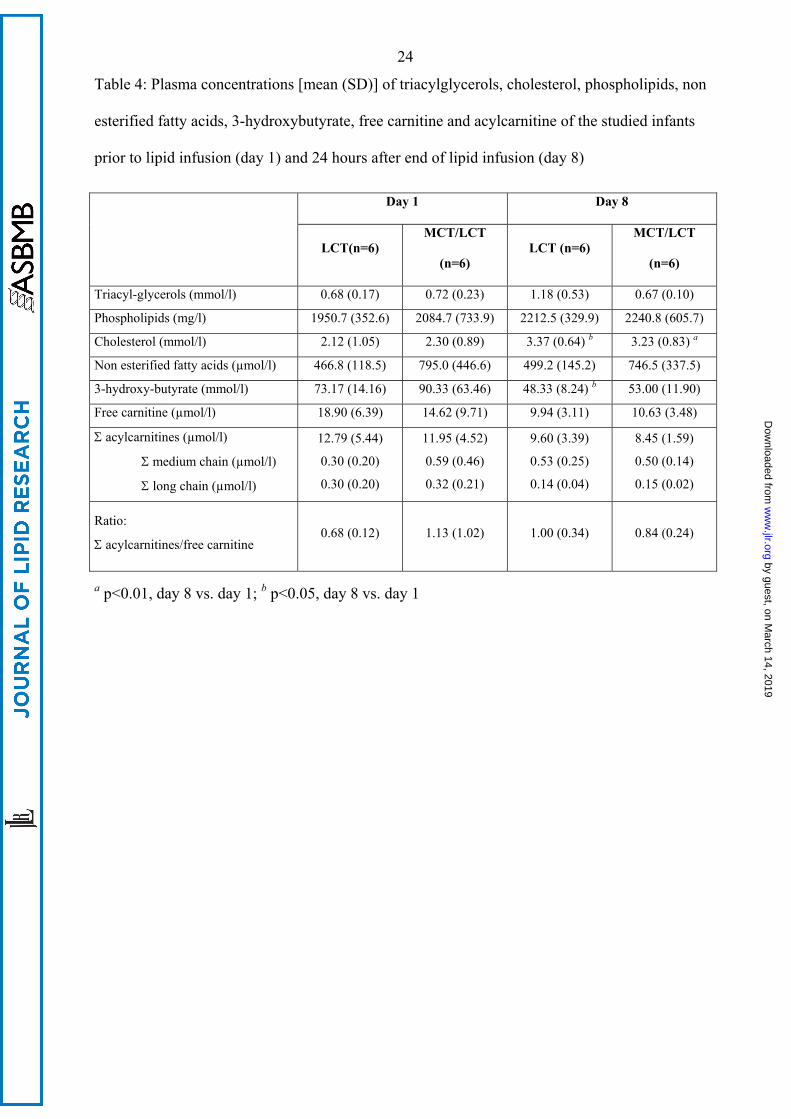
TG levels of the two groups were similar (Tab. 4) and within the range of reference values (22),
no hypertriacylglycerolemia was observed. Plasma cholesterol concentrations were within the
reference range (22). During the study period cholesterol levels increased significantly to
3.23±0.83 mmol/l in the MCT/LCT-group and to 3.37±0.64 mmol/l in the control-group,
respectively. Non esterified fatty acid levels were not different between the two groups or
between study time points. 3-hydroxybutyrate concentrations decreased during the study period
in the control group. Free carnitine and acylcarnitine concentrations were similar in the two
groups. Neither free carnitine nor total carnitine or individual acylcarnitines decreased
significantly from day 1 to day 8 in either group.
At study start the control-group had significantly lower levels of γ-tocopherol (0.57 µmol/l vs.
not detectable; control vs. MCT/LCT-group), while there were no differences in α-tocopherol
(10.94 µmol/l vs. 8.65 µmol/l). In both groups α- and γ-tocopherol levels increased significantly
by guest, on March 14, 2019
ww
w.jlr.org
Dow
nloaded from
10
during the study period (day 8: 54.16 µmol/l α-tocopherol and 17.13 µmol/l γ-tocopherol in
controls; 49.48 µmol/l α-tocopherol and 9.55 µmol/l γ-tocopherol in the MCT/LCT-group), with
no significant group differences on day 8.
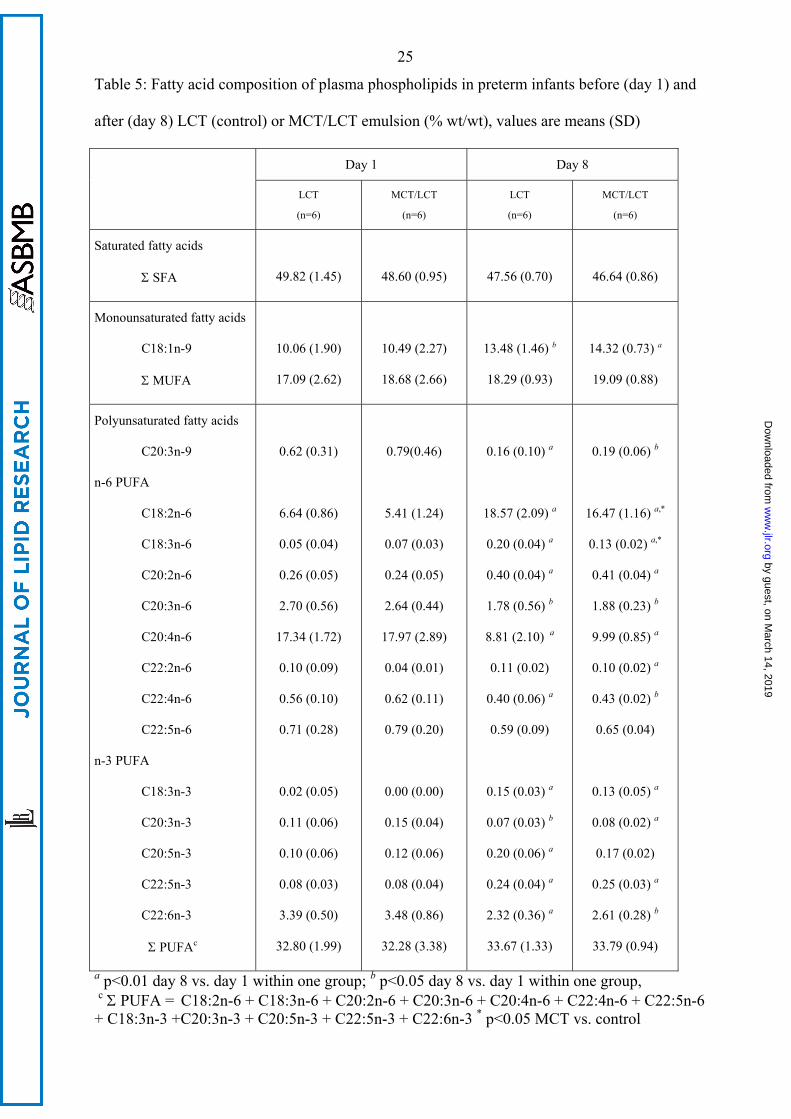
There were no significant differences between groups in percentage values of PL fatty acids at
baseline, but LA and GLA values on day 8 were significantly higher in the LCT group (Tab. 5).
Despite a 50 % lower LA (C18:2n-6) and ALA (C18:3n-3) supply with the MCT/LCT-emulsion,
LA (C18:2n-6) levels increased to a similar threefold extent in both groups from day 1 to day 8.
ALA (C18:3n-3) levels showed a marked, 13-fold increase in the MCT/LCT group, and an 8-
fold increase in the LCT-group.
On day 8 the MCT/LCT-group showed significantly higher levels of medium chain fatty acids
(C8:0 and C10:0). MUFA and PUFA in plasma TG were not different on day 1, with the
exception of eicosanoic acid (C20:0) (Tab. 6). In both groups, LA (C18:2n-6) and ALA (C18:3n-
3) in PL and TG increased significantly from baseline to day 8, while AA (C20:4n-6) and DHA
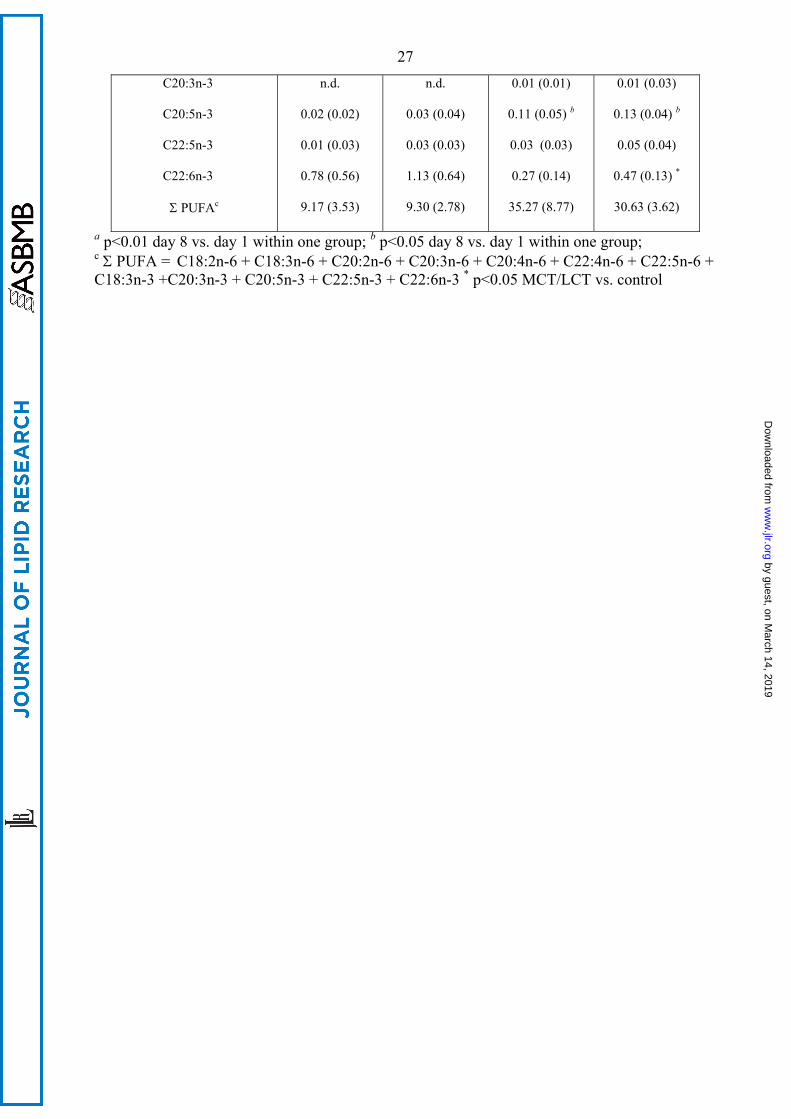
(C22:6n-3) decreased. In the MCT/LCT-group there was a trend to higher LC-PUFA contents in
TG and PL, with significantly higher levels of C20:2n-6 and DHA (C22:6n-3) in TG.
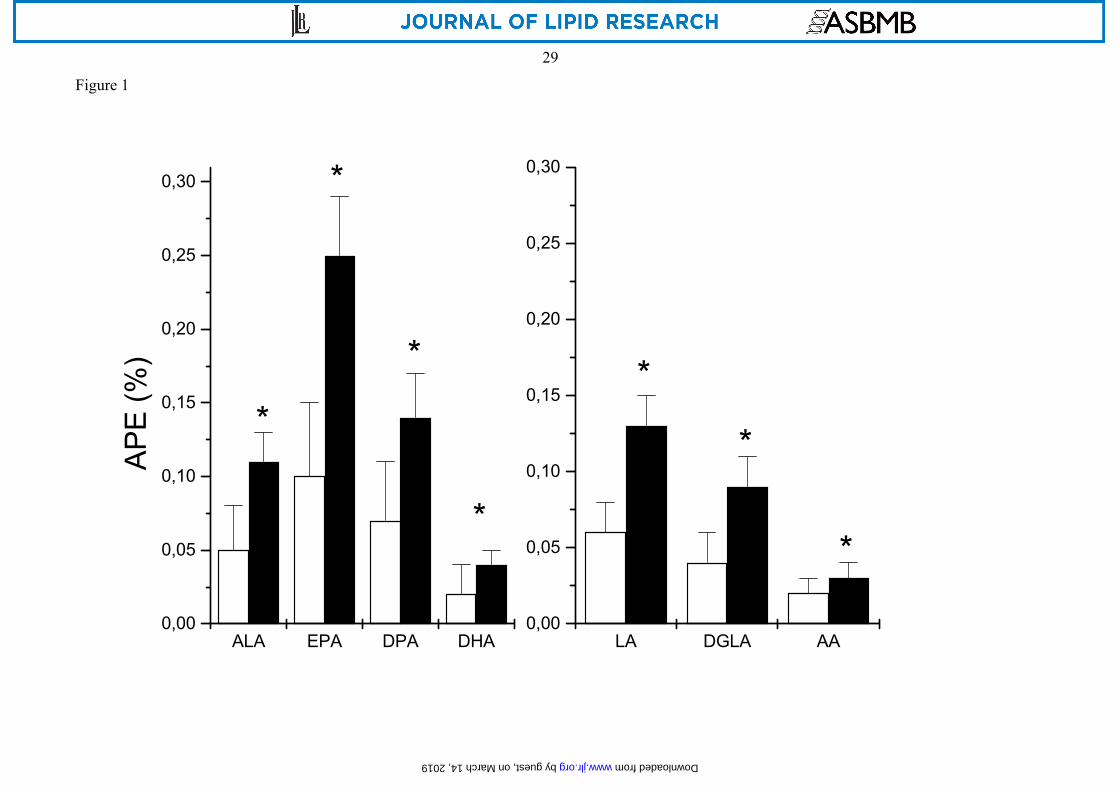
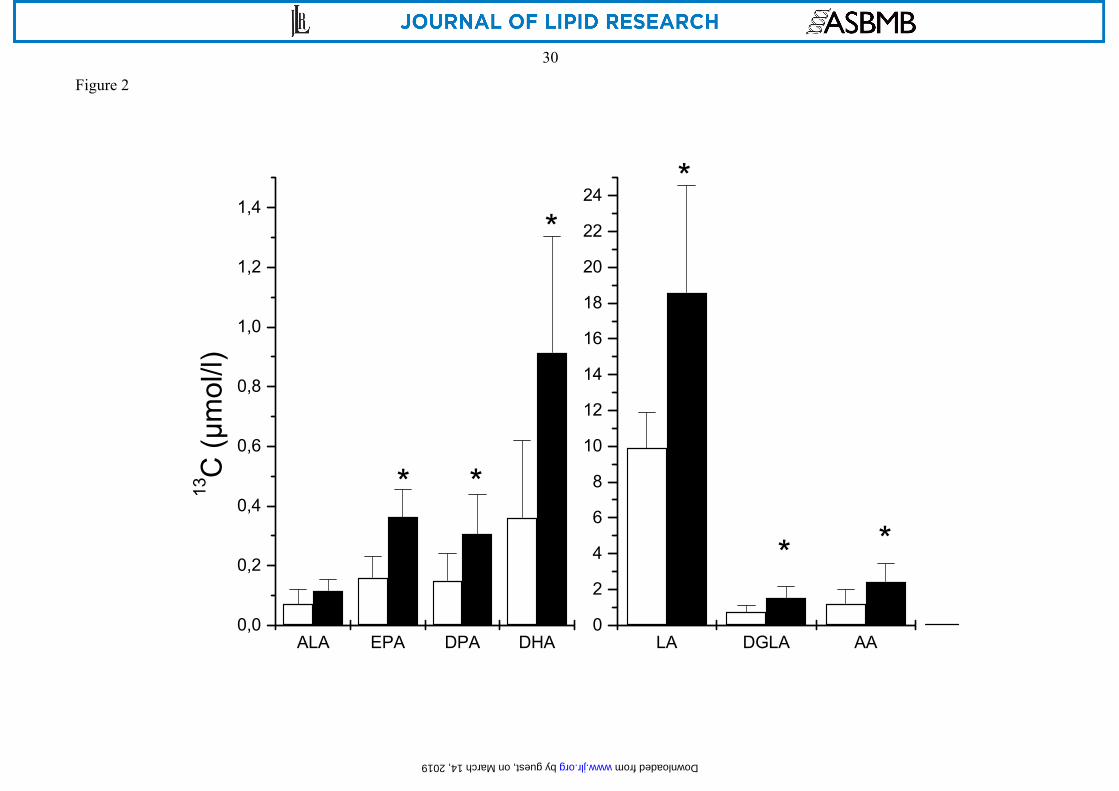
At 24 h after tracer administration, infants in the MCT/LCT group had significantly higher 13C-
APE values and 13C-tracer concentrations in plasma PL fatty acids than infants receiving the
LCT-emulsion (Figures 1 and 2).
by guest, on March 14, 2019
ww
w.jlr.org
Dow
nloaded from
11
Discussion
This study shows that infants receiving the MCT/LCT lipid emulsion, with half the EFA supply
than with the LCT emulsion, have similar EFA contents in plasma PL and TG, while LC-PUFA
levels tend to be higher. Thus, MCT seem to enhance EFA and LC-PUFA incorporation into
circulating lipids.
Both lipid emulsions were well tolerated in the infants that we followed, similar to observations
made in previous studies (23). Compared to the control group, the MCT/LCT-group tended
towards a lower body weight at baseline (n.s.), showed a greater weight loss and regained birth
weight later, although the extent of parenteral nutrition and caloric intake was comparable in the
two groups. Postnatal weight loss during the first days of life reflects primarily loss of relatively
expanded foetal water compartments and is proportionally greater in infants with lower birth
weight (24, 25). The postnatal weight loss in the MCT/LCT-group (11.4%) is within the
expected range of 7.3% to 14.5% (26). Weight gain can best be compared with Z-scores for
weight related to gender and age which do not differ between the two groups, suggesting that
under the conditions of our study the choice of the lipid emulsion did not affect weight gain.
The observed plasma TG concentrations are within the accepted references range, and the results
for PL and non esterified fatty acids are similar to previous reports for premature neonates (27,
28). The increase in cholesterol levels during the first days of life has already been described in
previous studies after parenteral and enteral nutrition (29, 30). In agreement with previous
studies we found no appreciable differences in plasma free carnitine and acylcarnitine values
between the two groups (28). A significant effect of MCT in the diet or of carnitine free
parenteral nutrition might become apparent after longer periods, but during short periods of
parenteral nutrition carnitine supplementation has no demonstrable benefits (44).
The control group showed lower γ-tocopherol levels on day 1, but a trend to higher values on
days 7 and 8 (n. s.) reflecting the higher content of γ-tocopherol in the LCT-emulsion with its
by guest, on March 14, 2019
ww
w.jlr.org
Dow
nloaded from
12
higher content of soy oil (45). The concentrations of α-tocopherol, the most important lipid
soluble antioxidant, were similar with both emulsions (Tab. 2) and well above 12.4 µmol/l
considered as a threshold for vitamin E sufficiency in premature neonates (46).
Triacylglycerols from emulsions containing a MCT/LCT mixture are hydrolysed faster than
those containing exclusively LCT, apparently due to physicochemical effects of MCT
incorporated into the surface of emulsion particles (31). The liberated medium chain fatty acids
are rapidly oxidised largely independent of carnitine (32), but only minor amounts are
incorporated into plasma TG (Table 6). In contrast to MCFA, LCFA are preferentially activated
in the cytosol and esterified into TG and PL, and only a small proportion enters the mitochondria
via the carnitine cycle (32). It has been suggested that during MCT/LCT ingestion the carnitine
palmitoyltransferase I is inhibited by the production of malonyl-CoA, and consequently oxida-
tion of LCFA is reduced while their incorporation into complex lipids is enhanced (33). Indeed,
we have recently found reduced LA oxidation in preterm infants fed an enteral formula with 40
% of the fat provided by MCT compared to a 100 % LCT formula (34). Even though the LCT-
emulsion provided about twice the amounts of palmitic acid (C16:0), stearic acid (C18:0), oleic
acid (C18:1n-9), LA (C18:2n-6), and ALA (C18:3n-3) as the MCT/LCT-emulsion, plasma levels
of these fatty acids were rather similar in both groups, except for a slightly higher LA (C18:2n-6)
value in plasma PL on day 8 in the LCT group (Tab. 5). This striking effect may result in part
from a decreased LCFA oxidation in the MCT/LCT group and thus incorporation of a larger
proportion of the LCFA supplied into plasma lipids. The trend to slightly higher values of
palmitic (C16:0), stearic (C18:0) and oleic acids (C18:1n-9) but slightly lower LA (C18:2n-6)
and ALA (C18:3n-3) in the MCT group, as compared to LCT, might reflect the greater oxidation
of polyunsaturated fatty acids than saturated fatty acids (35). Alternatively, long chain saturated
fatty acids and oleic acid (C18:1n-9) might have been synthesised in the LCT/MCT group from
readily available medium chain fatty acids (36).
by guest, on March 14, 2019
ww
w.jlr.org
Dow
nloaded from
13
Over the course of the postnatal study period, EFA increased in plasma lipids whereas LC-PUFA
decreased. The observed values and their changes were similar to those found in enterally fed
preterm neonates and reflect the change from placental fatty acid transfer, with a preferential
supply of LC-PUFA (37) to a feeding regimen supplying predominantly EFA (9).
Polyunsaturated fatty acid turnover was assessed in this study with 13C-labeled tracer fatty acids
given orally with small volumes of human milk. Plasma APE values of LA (C18:2n-6) and ALA
(C18:3n-3) in the MCT/LCT-group were significantly higher, presumably because plasma LA
(C18:2n-6) and ALA (C18:3n-3) pools were similar in the groups and the tracer intake was
higher in this group relative to the infused amounts of LA (C18:2-6) and ALA (C18:3n-3). Thus
there was less dilution of the tracer before incorporation into PL or conversion to LC-PUFA,
which would also explain higher concentrations of 13C-labelled LA (C18:2n-6), ALA (C18:3n-
3), and their labelled derivatives in the MCT/LCT than in the control group.
Excessive availability of LA (C18:2n-6) or ALA (C18:3n-3) may inhibit desaturase activity,
which would influence tracer distribution between precursor and product fatty acids at 24 h after
tracer intake when samples were obtained (38, 39). Based on lower DHA (C22:6n-3)
incorporation in plasma phospholipids in preterm infants fed formulae with MCT (40), it has
been postulated that MCT might interfere with the conversion of DPA (C22:5n-3) to DHA
(C22:6n-3), which involves peroxisomal chain shortening of a 24 carbon intermediate (41).
However, the observed distribution of the tracer amounts between precursor and products was
very similar between groups for the n-6 series (LA: 82,5±4,2 % vs. 84.8±7.8 %, MCT/LCT vs.
LCT, DGLA: 6.7±1.3 % vs. 5.8±2.3 %, AA: 10.8±3.0 % vs. 9.5±5.6 %) and for the n-3 fatty
acids (ALA: 7.3±3.2 % vs. 12.1±8.9 %, EPA: 22.0±5.1 vs. 25.0±8.7, DPA: 17.7±3.2 % vs.
19.6±4.9 %, DHA: 52.9±9.5 vs. 43.3±12.7 %). Also, the 13C-APE ratios between product and
precursor fatty acids were similar between the two groups (AA/DGLA 0.31±0.08 vs.
0.30±0.003; DGLA/LA 0.69±0.11 vs. 0.70±0.10; DHA/DPA 0.24±0.09 vs. 0.29±0.08;
DHA/EPA 0.16±0.09 vs. 0.16±0.06). Thus, the relative conversion of essential fatty acids to LC-
by guest, on March 14, 2019
ww
w.jlr.org
Dow
nloaded from
14
PUFA is not influenced by the intake of MCT or the intake of LA (C18:2n-6) and ALA (C18:3n-
3) under the conditions of this study. Also, the MCT supply with the lipid emulsion seems not to
influence the relative incorporation of the different n-6 and n-3 fatty acids into plasma
phospholipids. For the n-6 series most of the tracer is found in LA (C18:2n-6), whereas in the n-
3 series the distribution is skewed towards DHA (C22:6n-3), reflecting that LA (C18:2n-6) is the
most abundant n-6 fatty acid while DHA shows the highest percentage contribution of the n-3
fatty acids. Of importance, the tracer distribution depends on the relative incorporation of the
individual fatty acids in phospholipids, but does not indicate a higher relative LC-PUFA
synthesis in the n-3 series.
Given no detectable differential effect of the emulsions on relative conversion of precursors to
LC-PUFA, the trend to higher LC-PUFA values in the MCT/LCT group appears to result from
reduced LC-PUFA oxidation. In animal studies, dietary LC-PUFA are oxidised to a limited
extent, but are preferentially incorporated into structural lipids and oxidised to a lower extent
than other fatty acids (saturated, monounsaturated, LA, ALA) (42, 43). We presume that the
parenteral MCT supply has effectively reduced LC-PUFA oxidation and, thereby, induced the
trend to increase LC-PUFA contents in plasma lipids.
In contrast to LC-PUFA, the EFA intermediate γ-linolenic acid (C18:3n-6) showed significantly
higher contents in PL of the control group, which was also found after longer infusion periods in
adults (39) but not after 5 days of lipid infusion in neonates (28). We could not determine tracer
contents in γ-linolenic acid (C18:3n-6) in the small samples available from these preterm infants
and thus can only speculate that a rapid exchange between the relatively large LA (C18:2n-6)
pool and the relatively small γ-linolenic acid (C18:3n-6) pool might be the underlying metabolic
cause.
We conclude that the use of the MCT/LCT emulsion in parenteral nutrition of preterm infants for
a period of 8 days is well tolerated and provides an equivalent carnitine, vitamin E and essential
fatty acid status as compared to the LCT emulsion. The concentration of the functionally
by guest, on March 14, 2019
ww
w.jlr.org
Dow
nloaded from
15
important n-3 fatty acid DHA (C22:6n-3) was higher in plasma TG of the MCT/LCT-group, and
there is also a trend to higher levels of other LC-PUFA in TG and PL. Since the availability of
LC-PUFA and particularly of DHA (C22:6n-3) was shown to be of great functional importance
in early life for the development of visual acuity (7) and cognitive development (6), the use of
the MCT/LCT-emulsion might provide important clinical benefits over the use of a standard
soybean oil emulsion in these patients.
by guest, on March 14, 2019
ww
w.jlr.org
Dow
nloaded from
16
Acknowledgement
Statistical analyses were performed by D. Osterkorn and K. Osterkorn, Medizinisches
Wirtschaftsinstitut GmbH, Munich, Germany. This study was financially supported in part by
Deutsche Forschungsgemeinschaft, Bonn, Germany (Ko 912/5-1, Ko 912/5-2), B. Braun,
Melsungen, Germany and by the Child Health Foundation, Munich, Germany.
by guest, on March 14, 2019
ww
w.jlr.org
Dow
nloaded from
17
References
1. Koletzko, B. 2002. Intravenous lipid infusion in infancy - physiological aspects and clinical relevance. Clin. Nutr. 21: S53-S65.
2. Koletzko, B., C. Agostoni, S. E. Carlson, T. M. Clandinin , G. Hornstra, M. Neuringer, R. Uauy, Y. Yamashiro, and P. Willatts. 2001. Long chain polyunsaturated fatty acids (LC-PUFA) and perinatal development. Acta Paediatr 90: 460-464.
3. Adolph, M. 1999. Lipid emulsions in parenteral nutrition. Ann. Nutr. Metab. 43: 1-13.
4. Halliwell, B. and S. Chirico. 1993. Lipid peroxidation: its mechanism, measurement and significance. Am. J. Clin. Nutr. 57: 715S-725S.
5. Spielmann, D., U. Bracco, H. Traitler, G. Crozier, R. T. Holman, M. Ward, and R. Cotter. 1988. Alternative lipids to usual omega 6 PUFAS: gamma-linolenic acid, alpha linolenic acid, stearidonic acid, EPA etc. J. Parenteral. Enteral. Nutr. 12: 111S-123S.
6. O´Connor, D. L., R. Hall, D. Adamkin, N. Auestad, M. Castillo, W. E. Connor, S. L. Connor, K. Fitzgerald, S. Groh-Wargo, E. Hartmann et al. 2001. Growth and development in preterm infants fed long-chain polyunsaturated fatty acids: A prospective, randomized controlled trial. Pediatrics 108: 359-371.
7. SanGiovanni, J. P., S. Parra-Cabrera, G. A. Colditz, C. S. Berkey, and J. T. Dwyer. 2000. Meta-analysis of dietary essential fatty acids and long-chain polyunsaturated fatty acids as they relate to visual resolution acuity in healthy preterm infants. Pediatrics 105: 1292-1298.
8. Salem, N., B. Wegher, P. Mena, and R. Uauy. 1996. Arachidonic and docohexaenoic acids are biosynthesized from their 18-carbon precursors in human infants. Proc. Natl. Acad. Sci. USA 93: 49-54.
9. Szitanyi, P., B. Koletzko, A. Mydlilova, and H. Demmelmair. 1999. Metabolism of 13C-labelled linoleic acid in newborn infants during the first week of life. Pediatr. Res. 45: 669-673.
10. Metges, C. C. and G. Wolfram. 1991. Medium- and long-chain triglycerides labeled with 13C: A comparison of oxidation after oral or parenteral administration in humans. J. Nutr. 121: 31-36.
11. Rubin, M., A. Moser, N. Naor, P. Merloh, R. Pakula, and L. Sirota. 1994. Effect of three intravenously administered fat emulsions containing different concentrations of fatty acids on the plasma fatty acid composition of premature infants. J. Pediatr. 125: 596-602.
12. Demmelmair, H., B. Iser, A. Rauh-Pfeiffer, and B. Koletzko. 1999. Comparison of bolus versus fractionated oral applications of [13C]-linoleic acid in humans. Eur J Clin Invest 29: 603-609.
13. Uauy, R., P. Mena, B. Wegher, S. Nieto, and N. Salem. 2000. Long chain polyunsaturated fatty acid formation in neonates: Effect of gestational age and intrauterine growth. Pediatr. Res. 47: 127-135.
by guest, on March 14, 2019
ww
w.jlr.org
Dow
nloaded from
18
14. Millington, D. S., N. Kodo, D. L. Norwood, and C. R. Roe. 1990. Tandem mass spectrometry: a new method for acylcarnitine profiling with potential for neonatal screening for inborn errors of metabolism. J. Inherit. Metab. Dis. 13: 321-324.
15. Fingerhut, R., W. Röschinger, A. C. Muntau, T. Dame, J. Kreischer, R. Arnecke, A. Superti-Furga, H. Troxler, B. Liebl, and B. Olgemöller. 2001. Hepatic carnitine palmitoyltransferase I deficiency: Acylcarnitine profiles in blood spots are highly specific. Clin. Chem. 47: 1763-1768.
16. Göbel, Y., C. Schaffer, and B. Koletzko. 1997. Simultaneous determination of low plasma concentrations of retinol and tocopherols in preterm infants by a high-performance liquid chromatographic micromethod. J. Chromatogr. B 688: 57-62.
17. Kolarovic, L. and N. C. Fournier. 1986. A comparison of extraction methods for the isolation of phospholipids from biological sources. Anal. Biochem. 156: 244-250.
18. Carnielli, V. P., F. Pederzini, R. Vittorangeli, I. H. T. Luijendijk, W. E. M. Boomaars, D. Pedrotti, and P. J. J. Sauer. 1996. Plasma and red blood cell fatty acid of very low birth weight infants fed exclusively with expressed preterm human milk. Pediatr. Res. 39: 671-679.
19. Demmelmair, H., F. Feldl, I. Horvath, T. Niederland, V. Ruszinko, D. Raederstorff, C. De Min, R. Muggli, and B. Koletzko. 2001. Influence of formulas with borage oil or borage oil plus fish oil on the arachidonic acid status in premature infants. Lipids 36: 555-566.
20. Craig, H. 1957. Isotopic standards for carbon and oxygen and correction factors for mass spectrometric analysis of carbon dioxide. Geochim. Cosmochim. Acta 12: 133-149.
21. Kramer, M. S., R. W. Platt, S. W. Wen, K. S. Joseph, and A. A. Allen. 2001. A new and improved population-based Canadian reference for birth weight for gestational age. Ped. 108: E35.
22. Behrman,R.E., Kliegman,R.M., and Jenson,H.B. 2000. Nelson Textbook of Pediatrics. W.B. Saunders Company, Philadelphia. 2210 pp.
23. Donnell, S. C., D. A. Lloyd, S. Eaton, and A. Pierro. 2002. The metabolic response to intravenous medium-chain triglycerides in infants after surgery. J. Pediatr. 141: 689-694.
24. Shaffer, S. G., C. L. Quimiro, J. V. Anderson, and R. T. Hall. 1987. Postnatal weight changes in low birth weight infants. Ped. 5: 702-705.
25. Shaffer, S. G., S. K. Bradth, and R. T. Hall. 1986. Postnatal changes in total body water and extracellular volume in the preterm infant with respiratory distress syndrom. J. Pediatr. 109: 509-514.
26. Pauls, J., K. Bauer, and H. Versmold. 1998. Postnatal body weight curves for infants below 100g birth weight receiving early enteral and parenteral nutrition. Eur. J. Pediatr. 157: 416-421.
27. Haumont, D., M. Richelle, R. J. Deckelbaum, and Y. A. Carpentier. 1993. Effect of liposomal content of lipid emulsions on plasma lipid concentrations in low birth weight infants receiving parenteral nutrition. J. Pediatr. 121: 759-763.
by guest, on March 14, 2019
ww
w.jlr.org
Dow
nloaded from
19
28. Angsten, G., M. Boberg, G. Cederblad, S. Meurling, and H. Stiernström. 2002. Metabolic effects in neonates receiving intravenous medium-chain triglycerides. Acta Paediatr 91: 188-197.
29. Rovamo, L. M., E. A. Nikkila, M. R. Taskinen, and K. O. Raivio. 1984. Postheparin plasma lipoprotein and hepatic lipases in preterm neonates. Pediatr. Res. 18: 1104-1107.
30. Genzel-Boroviczény, O. and R. Hroboticky. 1996. Plasma values of polyunsaturated fatty acids in extremely low birth weight (ELBW) infants fed breast milk or formula very early in life. Eur. J. Med. Res. 18: 1104-1107.
31. Carpentier, Y. A., Ch. Simoens, V. Siderova, I. El Nakadi, V. Vanweyenberg, D. Eggerickx, and R. J. Deckelbaum. 1997. Recent developments in lipid emulsions: relevance to intensive care. Nutrition 13: 73S-78S.
32. Bach, A. C. and V. K. Babayan. 1982. Medium-chain triglycerides: an update. Am J Clin Nutr 36: 950-962.
33. Bach, A. C., Y. Ingenbleek, and A. Frey. 1996. The usefulness of dietary medium-chain triglycerides in body weight control: fact or fancy? J. Lipid Res. 37: 708-726.
34. Rodriguez, M., S. Funke, M. Fink, H. Demmelmair, M. Turini, G. Crozier, and B. Koletzko. 2003. Plasma fatty acids and [13C]linoleic acid metabolism in preterm infants fed a formula with medium-chain triglycerides. J. Lipid Res. 44: 41-48.
35. DeLany, J. P., M. M. Windhauser, C. M. Champagne, and G. A. Bray. 2000. Differential oxidation of individual dietary fatty acids in humans. Am. J. Clin. Nutr. 72: 905-911.
36. Carnielli, V. P., E. J. Sulkers, C. Moretti, J. L. D. Wattimena, J. B. van Goudoever, H. J. Degenhart, F. Zacchello, and P. J. J. Sauer. 1994. Conversion of octanoic acid into long-chain saturated fatty acids in premature infants fed a formula containing medium-chain triglycerides. Metabolism 43: 1287-1292.
37. Larque, E., H. Demmelmair, B. Berger, U. Hasbargen, and B. Koletzko. 2003. In vivo investigation of the placental transfer of (13)C-labeled fatty acids in humans. J Lipid Res 44: 49-55.
38. Chern, J. C. and J. E. Kinsella. 1983. The effects of unsaturated fatty acids on the synthesis of arachidonic acid in rat kidney cells. Biochim. Biophys. Acta 750: 465-471.
39. Martin-Peña, G., J. M. Culebras, L. De la Hoz-Perales, J. P. Barro-Ordovás, R. Catalá-Pizarro, and J. Ruiz-Galiana. 2002. Effect of 2 lipid emulsions (LCT versus MCT/LCT) on the fatty acid composition of plasma phospholipid: A double-blind ranomized trial. J. Parenteral. Enteral. Nutr. 26: 30-41.
40. Carnielli, V. P., K. Rossi, T. Badon, B. Gregori, G. Verlato, A. Orzali, and F. Zachello. 1996. Medium-chain triacylglycerols in formulas for preterm infants: effect on plasma lipids, circulating concentrations of medium-chain fatty acids, and essential fatty acids. Am. J. Clin. Nutr. 64: 152-158.
41. Sprecher, H. 2000. Metabolism of highly unsaturated n-3 and n-6 fatty acids. Biochim. Biophys. Acta 1486: 219-231.
by guest, on March 14, 2019
ww
w.jlr.org
Dow
nloaded from
20
42. Leyton, J., P. J. Drury, and M. A. Crawford. 1987. Different oxidation of saturated and unsaturated fatty acids in vivo in the rat. Br J Nutr 57: 383-393.
43. Leyton, J., P. J. Drury, and M. A. Crawford. 1987. In vivo incorporation of labeled fatty acids in rat liver lipids after oral administration. Lipids 22: 553-558.
44. Cairns, P. A. and D. J. Stalker. 2000. Carnitine supplementation of parenterally fed neonates. The Cochrane Library Oxford.
45. Souci,S.W., Fachmann,W., and Kraut,H. 2005. Die Zusammensetzung der Lebensmittel. Nährwerttabellen 1989/90. Wissenschaftliche Verlagsgesellschaft, Stuttgart.
46. Kaempf, D. E. and O. Linderkamp. 1998. Do healthy premature infants fed breast milk need vitamin E supplementation: α- and γ-tocopherol levels in blood components and buccal mucosal cells. Pediatr. Res. 44: 54-59.
by guest, on March 14, 2019
ww
w.jlr.org
Dow
nloaded from
21
Table 1: Composition of the two fat-emulsions used (data as provided by the manufacturer)
LCT-based emulsion
(soybean oil, control)
MCT/LCT-based emulsion
Saturated fatty acids (% wt/wt):
C6:0
C8:0
C10:0
C12:0
C16:0
C18:0
-
-
-
-
12
4.5
<1
27
21
1.5
5
2
Monounsaturated fatty acids (% wt/wt):
C18:1n-9
24
12
Polyunsaturated fatty acids (% wt/wt):
C18:2n-6
C18:3n-3
50
7
27
4
Other fatty acids (% wt/wt) 2.5 -
Emulsifier (g/l) 12 12
Glycerine (g/l) 25 25
Phosphate (mmol/l) 13 13
α-tocopherole (mg/l) 227 208
by guest, on March 14, 2019
ww
w.jlr.org
Dow
nloaded from
22
Table 2: Clinical characteristics and anthropometric data [mean (SD)] of infants at birth and at
study start, showing no significant differences between groups
LCT (n=6) MCT/LCT
(n=6)
Male/Female 3/3 6/-
Birth:
Gestational age (wk)
Weight (g)
Z-Score weight
33.2 (1.0)
1781.7 (290.3)
-0.33 (0.65)
31.4 (1.6)#
1573.3 (169.8)
-0.81 (1.22)
Study start:
Weight (g)
Z-Score weight
Height (cm)
1780.0 (297.5)##
- 1.16 (1.42)##
41.3 (2.9)
1575.0 (183.4)##
- 0.35 (0.91)##
39.8 (1.0)
Day 8:
Weight (g)
Z-Score weight
1791.7 (296.6)
- 0.79 (1.20)
1490.0 (145.1)
- 0.78 (0.70)#
# n=5; ## n=3
by guest, on March 14, 2019
ww
w.jlr.org
Dow
nloaded from
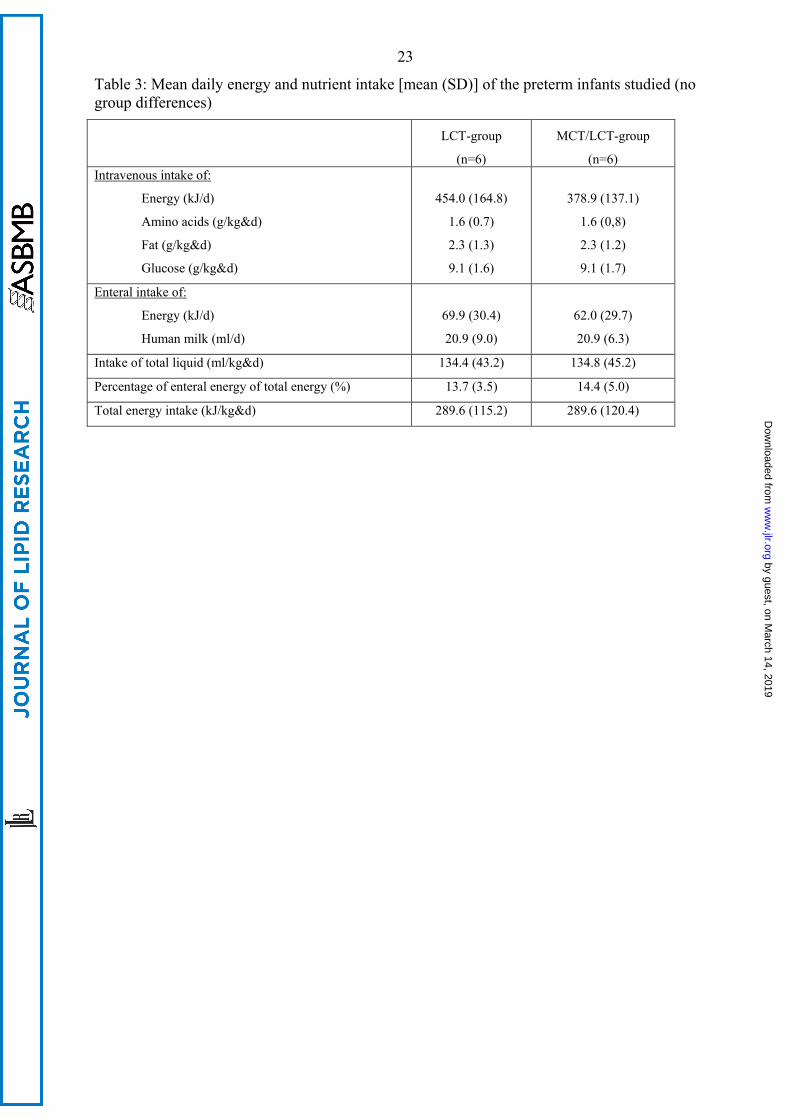
23
Table 3: Mean daily energy and nutrient intake [mean (SD)] of the preterm infants studied (no group differences) LCT-group
(n=6)
MCT/LCT-group
(n=6) Intravenous intake of:
Energy (kJ/d)
Amino acids (g/kg&d)
Fat (g/kg&d)
Glucose (g/kg&d)
454.0 (164.8)
1.6 (0.7)
2.3 (1.3)
9.1 (1.6)
378.9 (137.1)
1.6 (0,8)
2.3 (1.2)
9.1 (1.7)
Enteral intake of:
Energy (kJ/d)
Human milk (ml/d)
69.9 (30.4)
20.9 (9.0)
62.0 (29.7)
20.9 (6.3)
Intake of total liquid (ml/kg&d) 134.4 (43.2) 134.8 (45.2)
Percentage of enteral energy of total energy (%) 13.7 (3.5) 14.4 (5.0)
Total energy intake (kJ/kg&d) 289.6 (115.2) 289.6 (120.4)
by guest, on March 14, 2019
ww
w.jlr.org
Dow
nloaded from
24
Table 4: Plasma concentrations [mean (SD)] of triacylglycerols, cholesterol, phospholipids, non
esterified fatty acids, 3-hydroxybutyrate, free carnitine and acylcarnitine of the studied infants
prior to lipid infusion (day 1) and 24 hours after end of lipid infusion (day 8)
Day 1 Day 8
LCT(n=6)
MCT/LCT
(n=6) LCT (n=6)
MCT/LCT
(n=6)
Triacyl-glycerols (mmol/l) 0.68 (0.17) 0.72 (0.23) 1.18 (0.53) 0.67 (0.10)
Phospholipids (mg/l) 1950.7 (352.6) 2084.7 (733.9) 2212.5 (329.9) 2240.8 (605.7)
Cholesterol (mmol/l) 2.12 (1.05) 2.30 (0.89) 3.37 (0.64) b 3.23 (0.83) a
Non esterified fatty acids (µmol/l) 466.8 (118.5) 795.0 (446.6) 499.2 (145.2) 746.5 (337.5)
3-hydroxy-butyrate (mmol/l) 73.17 (14.16) 90.33 (63.46) 48.33 (8.24) b 53.00 (11.90)
Free carnitine (µmol/l) 18.90 (6.39) 14.62 (9.71) 9.94 (3.11) 10.63 (3.48)
Σ acylcarnitines (µmol/l)
Σ medium chain (µmol/l)
Σ long chain (µmol/l)
12.79 (5.44)
0.30 (0.20)
0.30 (0.20)
11.95 (4.52)
0.59 (0.46)
0.32 (0.21)
9.60 (3.39)
0.53 (0.25)
0.14 (0.04)
8.45 (1.59)
0.50 (0.14)
0.15 (0.02)
Ratio:
Σ acylcarnitines/free carnitine 0.68 (0.12)
1.13 (1.02)
1.00 (0.34)
0.84 (0.24)
a p<0.01, day 8 vs. day 1; b p<0.05, day 8 vs. day 1
by guest, on March 14, 2019
ww
w.jlr.org
Dow
nloaded from
25
Table 5: Fatty acid composition of plasma phospholipids in preterm infants before (day 1) and
after (day 8) LCT (control) or MCT/LCT emulsion (% wt/wt), values are means (SD)
Day 1 Day 8
LCT
(n=6)
MCT/LCT
(n=6)
LCT
(n=6)
MCT/LCT
(n=6)
Saturated fatty acids
Σ SFA
49.82 (1.45)
48.60 (0.95)
47.56 (0.70)
46.64 (0.86)
Monounsaturated fatty acids
C18:1n-9
Σ MUFA
10.06 (1.90)
17.09 (2.62)
10.49 (2.27)
18.68 (2.66)
13.48 (1.46) b
18.29 (0.93)
14.32 (0.73) a
19.09 (0.88)
Polyunsaturated fatty acids
C20:3n-9
n-6 PUFA
C18:2n-6
C18:3n-6
C20:2n-6
C20:3n-6
C20:4n-6
C22:2n-6
C22:4n-6
C22:5n-6
n-3 PUFA
C18:3n-3
C20:3n-3
C20:5n-3
C22:5n-3
C22:6n-3
Σ PUFAc
0.62 (0.31)
6.64 (0.86)
0.05 (0.04)
0.26 (0.05)
2.70 (0.56)
17.34 (1.72)
0.10 (0.09)
0.56 (0.10)
0.71 (0.28)
0.02 (0.05)
0.11 (0.06)
0.10 (0.06)
0.08 (0.03)
3.39 (0.50)
32.80 (1.99)
0.79(0.46)
5.41 (1.24)
0.07 (0.03)
0.24 (0.05)
2.64 (0.44)
17.97 (2.89)
0.04 (0.01)
0.62 (0.11)
0.79 (0.20)
0.00 (0.00)
0.15 (0.04)
0.12 (0.06)
0.08 (0.04)
3.48 (0.86)
32.28 (3.38)
0.16 (0.10) a
18.57 (2.09) a
0.20 (0.04) a
0.40 (0.04) a
1.78 (0.56) b
8.81 (2.10) a
0.11 (0.02)
0.40 (0.06) a
0.59 (0.09)
0.15 (0.03) a
0.07 (0.03) b
0.20 (0.06) a
0.24 (0.04) a
2.32 (0.36) a
33.67 (1.33)
0.19 (0.06) b
16.47 (1.16) a,*
0.13 (0.02) a,*
0.41 (0.04) a
1.88 (0.23) b
9.99 (0.85) a
0.10 (0.02) a
0.43 (0.02) b
0.65 (0.04)
0.13 (0.05) a
0.08 (0.02) a
0.17 (0.02)
0.25 (0.03) a
2.61 (0.28) b
33.79 (0.94)
a p<0.01 day 8 vs. day 1 within one group; b p<0.05 day 8 vs. day 1 within one group, c Σ PUFA = C18:2n-6 + C18:3n-6 + C20:2n-6 + C20:3n-6 + C20:4n-6 + C22:4n-6 + C22:5n-6 + C18:3n-3 +C20:3n-3 + C20:5n-3 + C22:5n-3 + C22:6n-3 * p<0.05 MCT vs. control
by guest, on March 14, 2019
ww
w.jlr.org
Dow
nloaded from
26
Table 6: Fatty acid composition of plasma triacylglycerols in preterm infants before (day 1) and
after (day 8) LCT (control) or MCT/LCT emulsion (% wt/wt), values are means (SD)
Day 1 Day 8
LCT
(n=6)
MCT/LCT
(n=6)
LCT
(n=6)
MCT/LCT
(n=6)
Saturated fatty acids
C8:0
C10:0
C12:0
C14:0
C16:0
C17:0
C18:0
C20:0
Σ SFA
0.11 (0.03)
0.15 (0.06)
0.56 (0.13)
1.76 (0.22)
34.69 (4.61)
0.36 (0.10)
6.16 (1.33)
0.06 (0.01)
44.52 (4.64)
0.08 (0.03)
0.19 (0.09)
0.48 (0.10)
1.71 (0.24)
33.21 (3.21)
0.31 (0.07)
4.66 (1.14)
0.04 (0.01) *
40.02 (2.19)
0.10 (0.12)
0.15 (0.17)
0.61 (0.27) b
1.58 (0.62)
25.21 (3.71) b
0.37 (0.07)
3.34 (0.54) a
0.06 (0.07)
32.09 (4.91)
0.50 (0.60) b,*
0.66 (0.51) b,*
0.89 (0.43)
1.94 (0.34)
25.84 (2.31) a
0.37 (0.05)
3.65 (0.37)
0.23 (0.45)
33.45 (3.09)
Monounsaturated fatty acids
C18:1n-9
Σ MUFA
32.13 (5.90)
45.47 (7.46)
33.56 (4.84)
50.07 (4.15)
26.43 (3.02) b
32.14 (4.72)
27.24 (2.33) b
35.70 (2.70)
Polyunsaturated fatty acids
C20:3n-9
n-6 PUFA
C18:2n-6
C18:3n-6
C20:2n-6
C20:3n-6
C20:4n-6
C22:4n-6
C22:5n-6
n-3 PUFA
C18:3n-3
0.35 (0.12)
4.37 (1.85)
0.12 (0.06)
0.17 (0.02)
0.84 (0.22)
1.68 (1.10)
0.20 (0.13)
0.47 (0.24)
0.04 (0.03)
0.42 (0.11)
4.12 (1.67)
0.11 (0.06)
0.16 (0.02)
0.79 (0.27)
1.69 (0.73)
0.25 (0.07)
0.62 (0.12)
0.04 (0.03)
0.25 (0.19)
29.57 (9.22) a
1.0 (0.57) b
0.26 (0.06) b
0.69 (0.28)
1.64 (0.87)
0.18 (0.08)
0.23 (0.15)
1.39 (1.11) b
0.32 (0.10) a
23.37 (3.29) a
0.85 (0.13) a
0.33 (0.07) a,*
0.89 (0.09)
2.28 (0.49)
0.24 (0.05)
0.34 (0.09) a
0.97 (0.25) a
by guest, on March 14, 2019
ww
w.jlr.org
Dow
nloaded from
27
C20:3n-3
C20:5n-3
C22:5n-3
C22:6n-3
Σ PUFAc
n.d.
0.02 (0.02)
0.01 (0.03)
0.78 (0.56)
9.17 (3.53)
n.d.
0.03 (0.04)
0.03 (0.03)
1.13 (0.64)
9.30 (2.78)
0.01 (0.01)
0.11 (0.05) b
0.03 (0.03)
0.27 (0.14)
35.27 (8.77)
0.01 (0.03)
0.13 (0.04) b
0.05 (0.04)
0.47 (0.13) *
30.63 (3.62)
a p<0.01 day 8 vs. day 1 within one group; b p<0.05 day 8 vs. day 1 within one group; c Σ PUFA = C18:2n-6 + C18:3n-6 + C20:2n-6 + C20:3n-6 + C20:4n-6 + C22:4n-6 + C22:5n-6 + C18:3n-3 +C20:3n-3 + C20:5n-3 + C22:5n-3 + C22:6n-3 * p<0.05 MCT/LCT vs. control
by guest, on March 14, 2019
ww
w.jlr.org
Dow
nloaded from
28
Figure 1: 13C atom percent excess (APE, M+SD) in plasma phospholipid fatty acids of preterm
infants falling 7 days of i.v. lipid infusion 24 h after tracer intake
( control group, soybean oil MCT/LCT group, *p<0.05 between groups)
Figure 2: Tracer concentrations (M+SD) in plasma phospholipid fatty acids of preterm infants
falling 7 days of i.v. lipid infusion 24 h after tracer intake
( control group, soybean oil MCT/LCT group, *p<0.05 between groups)
by guest, on March 14, 2019
ww
w.jlr.org
Dow
nloaded from
29
Figure 1
ALA EPA DPA DHA0,00
0,05
0,10
0,15
0,20
0,25
0,30
*
*
*
*A
PE
(%)
LA DGLA AA0,00
0,05
0,10
0,15
0,20
0,25
0,30
*
*
*
by guest, on March 14, 2019 www.jlr.org Downloaded from
30
Figure 2
ALA EPA DPA DHA0,0
0,2
0,4
0,6
0,8
1,0
1,2
1,4
* *
*13
C (µ
mol
/l)
LA DGLA AA0
2
4
6
8
10
12
14
16
18
20
22
24
**
*
by guest, on March 14, 2019 www.jlr.org Downloaded from