Embed Size (px)
Citation preview

tblConstEquipMitigation Tier No Change Tier 3
tblConstEquipMitigation NumberOfEquipmentMitigated 0.00 1.00
tblConstEquipMitigation NumberOfEquipmentMitigated 0.00 1.00
Off-road Equipment -
Off-road Equipment - Equipment list provided by SCE
Trips and VMT - On road vehicle trips provided by SCE
Demolition -
Construction Off-road Equipment Mitigation - All equipment pieces mitigated to Tier 3
Table Name Column Name Default Value New Value
N2O Intensity (lb/MWhr)
0.006
1.3 User Entered Comments & Non-Default Data
Project Characteristics -
Land Use -
Construction Phase - Schedule provided by SCE
Utility Company Southern California Edison
CO2 Intensity (lb/MWhr)
630.89 CH4 Intensity (lb/MWhr)
0.029
Precipitation Freq (Days) 31
Climate Zone 9 Operational Year 2016
1.1 Land Usage
1.2 Other Project Characteristics
Urbanization Urban Wind Speed (m/s) 2.2
CalEEMod Version: CalEEMod.2013.2.2 Page 1 of 1 Date: 9/24/2015 2:06 PM
Mesa Substation Project - Well DecommissioningSouth Coast Air Basin, Annual
1.0 Project Characteristics

Mitigated Construction
0.0000 16.2405 16.2405 4.0400e-003
0.0000 16.32552.5100e-003
2.6300e-003
5.1400e-003
5.9000e-004
2.4200e-003
3.0100e-003
Total 6.3100e-003
0.0932 0.0429 1.8000e-004
0.0000 16.2405 16.2405 4.0400e-003
0.0000 16.32552.5100e-003
2.6300e-003
5.1400e-003
5.9000e-004
2.4200e-003
3.0100e-003
2016 6.3100e-003
0.0932 0.0429 1.8000e-004
NBio- CO2
Total CO2 CH4 N2O CO2e
Year tons/yr MT/yr
Exhaust PM10
PM10 Total
Fugitive PM2.5
Exhaust PM2.5
PM2.5 Total
Bio- CO2
2.0 Emissions Summary
2.1 Overall ConstructionUnmitigated Construction
ROG NOx CO SO2 Fugitive PM10
tblOffRoadEquipment PhaseName Well Decommissioning
tblProjectCharacteristics OperationalYear 2014 2016
tblOffRoadEquipment OffRoadEquipmentUnitAmount 0.00 1.00
tblOffRoadEquipment PhaseName Well Decommissioning
tblOffRoadEquipment LoadFactor 0.38 0.37
tblOffRoadEquipment OffRoadEquipmentUnitAmount 0.00 1.00
tblOffRoadEquipment HorsePower 400.00 97.00
tblOffRoadEquipment LoadFactor 0.50 0.73
tblConstructionPhase NumDays 0.00 18.00
tblOffRoadEquipment HorsePower 205.00 250.00
tblConstEquipMitigation Tier No Change Tier 3

Total CO2 CH4 N2O CO2ePM10 Total
Fugitive PM2.5
Exhaust PM2.5
PM2.5 Total
Bio- CO2 NBio- CO2
Mitigated Operational
ROG NOx CO SO2 Fugitive PM10
Exhaust PM10
0.0000 0.0000 0.0000 0.0000 0.0000 0.00000.0000 0.0000 0.0000 0.0000Total 0.0000
0.0000 0.0000 0.0000 0.0000 0.0000 0.00000.0000 0.0000 0.0000 0.0000Area 0.0000
Total CO2 CH4 N2O CO2e
Category tons/yr MT/yr
PM10 Total
Fugitive PM2.5
Exhaust PM2.5
PM2.5 Total
Bio- CO2 NBio- CO2
2.2 Overall OperationalUnmitigated Operational
ROG NOx CO SO2 Fugitive PM10
Exhaust PM10
0.00 0.00 0.00 0.00 0.00 0.0017.53 -3.04 7.00 11.86 -11.57 -6.98
NBio-CO2 Total CO2 CH4 N20 CO2e
Percent Reduction
33.28 18.11 -99.04 0.00
Exhaust PM10
PM10 Total
Fugitive PM2.5
Exhaust PM2.5
PM2.5 Total
Bio- CO2ROG NOx CO SO2 Fugitive PM10
0.0000 16.2405 16.2405 4.0400e-003
0.0000 16.32542.0700e-003
2.7100e-003
4.7800e-003
5.2000e-004
2.7000e-003
3.2200e-003
Total 4.2100e-003
0.0763 0.0854 1.8000e-004
0.0000 16.2405 16.2405 4.0400e-003
0.0000 16.32542.0700e-003
2.7100e-003
4.7800e-003
5.2000e-004
2.7000e-003
3.2200e-003
2016 4.2100e-003
0.0763 0.0854 1.8000e-004
Total CO2 CH4 N2O CO2e
Year tons/yr MT/yr
PM10 Total
Fugitive PM2.5
Exhaust PM2.5
PM2.5 Total
Bio- CO2 NBio- CO2
ROG NOx CO SO2 Fugitive PM10
Exhaust PM10

Trips and VMT
Well Decommissioning Off-Highway Trucks 1 8.00 97 0.37
Load Factor
Well Decommissioning Bore/Drill Rigs 1 8.00 250 0.73
OffRoad Equipment
Phase Name Offroad Equipment Type Amount Usage Hours Horse Power
18 Decommission 10 Groundwater Monitoring Wells
Acres of Grading (Site Preparation Phase): 0
Acres of Grading (Grading Phase): 0
Acres of Paving: 0
Residential Indoor: 0; Residential Outdoor: 0; Non-Residential Indoor: 0; Non-Residential Outdoor: 0 (Architectural Coating – sqft)
End Date Num Days Week
Num Days Phase Description
1 Well Decommissioning Demolition 6/13/2016 7/6/2016 5
3.0 Construction Detail
Construction Phase
Phase Number
Phase Name Phase Type Start Date
0.00 0.00 0.00 0.00 0.00 0.000.00 0.00 0.00 0.00 0.00 0.00
NBio-CO2 Total CO2 CH4 N20 CO2e
Percent Reduction
0.00 0.00 0.00 0.00
Exhaust PM10
PM10 Total
Fugitive PM2.5
Exhaust PM2.5
PM2.5 Total
Bio- CO2ROG NOx CO SO2 Fugitive PM10
0.0000 0.0000 0.0000 0.0000 0.0000 0.00000.0000 0.0000 0.0000 0.0000Total 0.0000
0.0000 0.0000 0.0000 0.0000 0.0000 0.00000.0000 0.0000 0.0000 0.0000Area 0.0000
Category tons/yr MT/yr

Total CO2 CH4 N2O CO2e
Category tons/yr MT/yr
PM10 Total
Fugitive PM2.5
Exhaust PM2.5
PM2.5 Total
Bio- CO2 NBio- CO2
Unmitigated Construction Off-Site
ROG NOx CO SO2 Fugitive PM10
Exhaust PM10
0.0000 13.1959 13.1959 3.9800e-003
0.0000 13.27958.0000e-004
2.4700e-003
3.2700e-003
1.2000e-004
2.2700e-003
2.3900e-003
Total 5.5800e-003
0.0841 0.0328 1.4000e-004
0.0000 13.1959 13.1959 3.9800e-003
0.0000 13.27952.4700e-003
2.4700e-003
2.2700e-003
2.2700e-003
Off-Road 5.5800e-003
0.0841 0.0328 1.4000e-004
0.0000 0.0000 0.0000 0.0000 0.0000 0.00008.0000e-004
0.0000 8.0000e-004
1.2000e-004
0.0000 1.2000e-004
Fugitive Dust
CH4 N2O CO2e
Category tons/yr MT/yr
Fugitive PM2.5
Exhaust PM2.5
PM2.5 Total
Bio- CO2 NBio- CO2
Total CO2
Unmitigated Construction On-Site
ROG NOx CO SO2 Fugitive PM10
Exhaust PM10
PM10 Total
Use Cleaner Engines for Construction Equipment
Use Soil Stabilizer
Water Exposed Area
Reduce Vehicle Speed on Unpaved Roads
Clean Paved Roads
3.2 Well Decommissioning - 2016
30.00 45.00 LD_Mix HDT_Mix HDT_Mix
3.1 Mitigation Measures Construction
Well Decommissioning 0 5.00 2.00 11.00 30.00
Worker Trip Length
Vendor Trip Length
Hauling Trip Length
Worker Vehicle Class
Vendor Vehicle Class
Hauling Vehicle Class
Phase Name Offroad Equipment Count
Worker Trip Number
Vendor Trip Number
Hauling Trip Number
0.0000 0.9341 0.9341 5.0000e-005
0.0000 0.93511.0100e-003
1.0000e-005
1.0200e-003
2.7000e-004
1.0000e-005
2.7000e-004
Worker 2.5000e-004
5.2000e-004
5.2900e-003
1.0000e-005
0.0000 1.4502 1.4502 1.0000e-005
0.0000 1.45044.8000e-004
1.1000e-004
5.9000e-004
1.4000e-004
1.0000e-004
2.4000e-004
Vendor 3.4000e-004
5.9100e-003
3.4600e-003
2.0000e-005
0.0000 0.6604 0.6604 0.0000 0.0000 0.66052.2000e-004
5.0000e-005
2.7000e-004
6.0000e-005
4.0000e-005
1.1000e-004
Hauling 1.4000e-004
2.6600e-003
1.3300e-003
1.0000e-005
Total CO2 CH4 N2O CO2e
Category tons/yr MT/yr
PM10 Total
Fugitive PM2.5
Exhaust PM2.5
PM2.5 Total
Bio- CO2 NBio- CO2
Mitigated Construction Off-Site
ROG NOx CO SO2 Fugitive PM10
Exhaust PM10
0.0000 13.1959 13.1959 3.9800e-003
0.0000 13.27953.6000e-004
2.5500e-003
2.9100e-003
5.0000e-005
2.5500e-003
2.6000e-003
Total 3.4800e-003
0.0672 0.0753 1.4000e-004
0.0000 13.1959 13.1959 3.9800e-003
0.0000 13.27952.5500e-003
2.5500e-003
2.5500e-003
2.5500e-003
Off-Road 3.4800e-003
0.0672 0.0753 1.4000e-004
0.0000 0.0000 0.0000 0.0000 0.0000 0.00003.6000e-004
0.0000 3.6000e-004
5.0000e-005
0.0000 5.0000e-005
Fugitive Dust
Total CO2 CH4 N2O CO2e
Category tons/yr MT/yr
PM10 Total
Fugitive PM2.5
Exhaust PM2.5
PM2.5 Total
Bio- CO2 NBio- CO2
Mitigated Construction On-Site
ROG NOx CO SO2 Fugitive PM10
Exhaust PM10
0.0000 3.0446 3.0446 6.0000e-005
0.0000 3.04591.7100e-003
1.7000e-004
1.8800e-003
4.7000e-004
1.5000e-004
6.2000e-004
Total 7.3000e-004
9.0900e-003
0.0101 4.0000e-005
0.0000 0.9341 0.9341 5.0000e-005
0.0000 0.93511.0100e-003
1.0000e-005
1.0200e-003
2.7000e-004
1.0000e-005
2.7000e-004
Worker 2.5000e-004
5.2000e-004
5.2900e-003
1.0000e-005
0.0000 1.4502 1.4502 1.0000e-005
0.0000 1.45044.8000e-004
1.1000e-004
5.9000e-004
1.4000e-004
1.0000e-004
2.4000e-004
Vendor 3.4000e-004
5.9100e-003
3.4600e-003
2.0000e-005
0.0000 0.6604 0.6604 0.0000 0.0000 0.66052.2000e-004
5.0000e-005
2.7000e-004
6.0000e-005
4.0000e-005
1.1000e-004
Hauling 1.4000e-004
2.6600e-003
1.3300e-003
1.0000e-005

4.4 Fleet MixHistorical Energy Use: N
5.1 Mitigation Measures Energy
6.0 Area Detail
6.1 Mitigation Measures Area
0.001929 0.002512 0.004343 0.000595 0.002093
5.0 Energy Detail
SBUS MH
0.514315 0.060290 0.180146 0.139458 0.042007 0.006636 0.015782 0.029894
LHD2 MHD HHD OBUS UBUS MCY
H-S or C-C H-O or C-NW Primary Diverted Pass-by
LDA LDT1 LDT2 MDV LHD1
4.3 Trip Type Information
Miles Trip % Trip Purpose %
Land Use H-W or C-W H-S or C-C H-O or C-NW H-W or C-W
Total
MitigatedLand Use Weekday Saturday Sunday Annual VMT Annual VMT
4.0 Operational Detail - Mobile
4.1 Mitigation Measures Mobile
4.2 Trip Summary Information
Average Daily Trip Rate Unmitigated
0.0000 3.0446 3.0446 6.0000e-005
0.0000 3.04591.7100e-003
1.7000e-004
1.8800e-003
4.7000e-004
1.5000e-004
6.2000e-004
Total 7.3000e-004
9.0900e-003
0.0101 4.0000e-005

Total CO2 CH4 N2O CO2e
SubCategory tons/yr MT/yr
PM10 Total
Fugitive PM2.5
Exhaust PM2.5
PM2.5 Total
Bio- CO2 NBio- CO2
Mitigated
ROG NOx CO SO2 Fugitive PM10
Exhaust PM10
0.0000 0.0000 0.0000 0.0000 0.0000 0.00000.0000 0.0000 0.0000 0.0000Total 0.0000
0.0000 0.0000 0.0000 0.0000 0.0000 0.00000.0000 0.0000 0.0000 0.0000Architectural Coating
0.0000
0.0000 0.0000 0.0000 0.0000 0.0000 0.00000.0000 0.0000 0.0000 0.0000Consumer Products
0.0000
Total CO2 CH4 N2O CO2e
SubCategory tons/yr MT/yr
PM10 Total
Fugitive PM2.5
Exhaust PM2.5
PM2.5 Total
Bio- CO2 NBio- CO2
6.2 Area by SubCategoryUnmitigated
ROG NOx CO SO2 Fugitive PM10
Exhaust PM10
0.0000 0.0000 0.0000 0.0000 0.0000 0.00000.0000 0.0000 0.0000 0.0000Unmitigated 0.0000
0.0000 0.0000 0.0000 0.0000 0.0000 0.00000.0000 0.0000 0.0000 0.0000
CO2e
Category tons/yr MT/yr
Mitigated 0.0000
PM2.5 Total
Bio- CO2 NBio- CO2
Total CO2 CH4 N2OSO2 Fugitive PM10
Exhaust PM10
PM10 Total
Fugitive PM2.5
Exhaust PM2.5
ROG NOx CO

Hours/Day Days/Year Horse Power Load Factor Fuel Type
10.0 Vegetation
7.0 Water Detail
7.1 Mitigation Measures Water
8.0 Waste Detail
8.1 Mitigation Measures Waste
9.0 Operational Offroad
Equipment Type Number
0.0000 0.0000 0.0000 0.0000 0.0000 0.00000.0000 0.0000 0.0000 0.0000Total 0.0000
0.0000 0.0000 0.0000 0.0000 0.0000 0.00000.0000 0.0000 0.0000 0.0000Architectural Coating
0.0000
0.0000 0.0000 0.0000 0.0000 0.0000 0.00000.0000 0.0000 0.0000 0.0000Consumer Products
0.0000

South Coast Air Basin, Mitigation Report
Mesa Substation Project - Well Decommissioning
Construction Mitigation Summary
Phase ROG NOx CO SO2Exhaust
PM10Exhaust PM2.5 Bio- CO2
NBio- CO2 Total CO2 CH4 N2O CO2e
Percent Reduction
Well Decommissioning 0.33 0.18 -0.99 0.00 -0.03 -0.12 0.00 0.00 0.00 0.00 0.00 0.00
OFFROAD Equipment Mitigation
Equipment Type Fuel Type Tier Number Mitigated Total Number of Equipment DPF Oxidation Catalyst
Bore/Drill Rigs Diesel Tier 3 1 1 No Change 0.00
Off-Highway Trucks Diesel Tier 3 1 1 No Change 0.00
Equipment Type ROG NOx CO SO2 Exhaust PM10 Exhaust PM2.5 Bio- CO2 NBio- CO2 Total CO2 CH4 N2O CO2e
Unmitigated tons/yr Unmitigated mt/yr
Bore/Drill Rigs 5.58000E-003 8.40700E-002 3.28200E-002 1.40000E-004 2.47000E-003 2.27000E-003 0.00000E+000 1.31959E+001 1.31959E+001 3.98000E-003 0.00000E+000 1.32795E+001
Equipment Type ROG NOx CO SO2 Exhaust PM10 Exhaust PM2.5 Bio- CO2 NBio- CO2 Total CO2 CH4 N2O CO2e
Mitigated tons/yr Mitigated mt/yr
Bore/Drill Rigs 3.48000E-003 6.72100E-002 7.53200E-002 1.40000E-004 2.55000E-003 2.55000E-003 0.00000E+000 1.31959E+001 1.31959E+001 3.98000E-003 0.00000E+000 1.32795E+001
CalEEMod Version: CalEEMod.2013.2.2 Date: 9/24/2015 2:09 PMPage 1 of 6

Fugitive Dust Mitigation
Yes Soil Stabilizer for unpaved Roads
PM10 Reduction 55.00 PM2.5 Reduction 55.00
No Replace Ground Cover of Area Disturbed
PM10 Reduction 0.00 PM2.5 Reduction 0.00
Yes Water Exposed Area PM10 Reduction 55.00 PM2.5 Reduction 55.00 Frequency (per day)
2.00
No Unpaved Road Mitigation Moisture Content %
0.00 Vehicle Speed (mph)
15.00
Yes Clean Paved Road % PM Reduction 0.00
Operational Percent Reduction Summary
Equipment Type ROG NOx CO SO2 Exhaust PM10 Exhaust PM2.5 Bio- CO2 NBio- CO2 Total CO2 CH4 N2O CO2e
Percent Reduction
Bore/Drill Rigs 3.76344E-001 2.00547E-001 -1.29494E+000 0.00000E+000 -3.23887E-002 -1.23348E-001 0.00000E+000 7.57810E-007 7.57810E-007 0.00000E+000 0.00000E+000 1.50608E-006
Unmitigated Mitigated Percent Reduction
Phase Source PM10 PM2.5 PM10 PM2.5 PM10 PM2.5
Well Decommissioning Fugitive Dust 0.00 0.00 0.00 0.00 0.55 0.58
Well Decommissioning Roads 0.00 0.00 0.00 0.00 0.00 0.00
Yes/No Mitigation InputMitigation InputMitigation InputMitigation Measure
CalEEMod Version: CalEEMod.2013.2.2 Date: 9/24/2015 2:09 PMPage 2 of 6

Category ROG NOx CO SO2Exhaust
PM10Exhaust PM2.5 Bio- CO2
NBio- CO2 Total CO2 CH4 N2O CO2e
Percent Reduction
Architectural Coating 0.00 0.00 0.00 0.00 0.00 0.00 0.00 0.00 0.00 0.00 0.00 0.00
Consumer Products 0.00 0.00 0.00 0.00 0.00 0.00 0.00 0.00 0.00 0.00 0.00 0.00
Electricity 0.00 0.00 0.00 0.00 0.00 0.00 0.00 0.00 0.00 0.00 0.00 0.00
Hearth 0.00 0.00 0.00 0.00 0.00 0.00 0.00 0.00 0.00 0.00 0.00 0.00
Landscaping 0.00 0.00 0.00 0.00 0.00 0.00 0.00 0.00 0.00 0.00 0.00 0.00
Mobile 0.00 0.00 0.00 0.00 0.00 0.00 0.00 0.00 0.00 0.00 0.00 0.00
Natural Gas 0.00 0.00 0.00 0.00 0.00 0.00 0.00 0.00 0.00 0.00 0.00 0.00
Water Indoor 0.00 0.00 0.00 0.00 0.00 0.00 0.00 0.00 0.00 0.00 0.00 0.00
Water Outdoor 0.00 0.00 0.00 0.00 0.00 0.00 0.00 0.00 0.00 0.00 0.00 0.00
Operational Mobile Mitigation
Mitigation Selected
No
No
No
No
No
No
Category
Land Use
Land Use
Land Use
Land Use
Land Use
Land Use
Land Use
% Reduction
0.00
0.00
0.00
0.25
0.00
0.00
0.00
Input Value 1
0.15
Input Value 2 Input Value 3Measure
Increase Diversity
Land Use SubTotal
Integrate Below Market Rate Housing
Increase Transit Accessibility
Improve Destination Accessibility
Improve Walkability Design
Increase Density
Project Setting:
CalEEMod Version: CalEEMod.2013.2.2 Date: 9/24/2015 2:09 PMPage 3 of 6

No
No
No Neighborhood Enhancements
Neighborhood Enhancements
Neighborhood Enhancements
0.00Implement NEV Network
Provide Traffic Calming Measures
Improve Pedestrian Network
No
No
No
No
No
No
Parking Policy Pricing
Transit Improvements
Transit Improvements
Transit Improvements
Transit Improvements
Parking Policy Pricing
Parking Policy Pricing
Parking Policy Pricing
Neighborhood Enhancements 0.00
0.00
0.00
0.00
0.00
0.00
0.00
0.00
0.00
0.00Limit Parking Supply
Land Use and Site Enhancement Subtotal
Transit Improvements Subtotal
Increase Transit Frequency
Expand Transit Network
Provide BRT System
Parking Policy Pricing Subtotal
On-street Market Pricing
Unbundle Parking Costs
Neighborhood Enhancements Subtotal
No
No
No
No
No
No
No
No
Commute
Commute
Commute
Commute
Commute
Commute
Commute
Commute
Commute
0.00
0.00
0.00
0.00
2.00
Transit Subsidy
Commute Subtotal
Provide Ride Sharing Program
Employee Vanpool/Shuttle
Market Commute Trip Reduction Option
Encourage Telecommuting and Alternative Work Schedules
Workplace Parking Charge
Implement Employee Parking "Cash Out"
Implement Trip Reduction Program
CalEEMod Version: CalEEMod.2013.2.2 Date: 9/24/2015 2:09 PMPage 4 of 6

Area Mitigation
Measure Implemented
No
No
No
No
No
No
No
No
No
No
Mitigation Measure
No Hearth
% Electric Chainsaw
% Electric Leafblower
% Electric Lawnmower
Use Low VOC Paint (Non-residential Exterior)
Use Low VOC Paint (Non-residential Interior)
Use Low VOC Paint (Residential Exterior)
Use Low VOC Paint (Residential Interior)
Use Low VOC Cleaning Supplies
Only Natural Gas Hearth
Input Value
250.00
250.00
100.00
50.00
Energy Mitigation Measures
Measure Implemented
No
No
No
Mitigation Measure
Install High Efficiency Lighting
On-site Renewable
Exceed Title 24
Input Value 1 Input Value 2
Appliance Type Land Use Subtype % Improvement
ClothWasher 30.00
No School Trip 0.00Implement School Bus Program
0.00Total VMT Reduction
CalEEMod Version: CalEEMod.2013.2.2 Date: 9/24/2015 2:09 PMPage 5 of 6

DishWasher 15.00
Fan 50.00
Refrigerator 15.00
Water Mitigation Measures
Measure Implemented
No
No
No
Mitigation Measure
Use Reclaimed Water
Use Grey Water
Apply Water Conservation on Strategy
Input Value 1 Input Value 2
No
No
No
No
Install low-flow bathroom faucet
Install low-flow Toilet
Install low-flow Shower
Install low-flow Kitchen faucet
32.00
18.00
20.00
20.00
No
No
No
Turf Reduction
Water Efficient Landscape
Use Water Efficient Irrigation Systems 6.10
Solid Waste Mitigation
Mitigation Measures
Institute Recycling and Composting ServicesPercent Reduction in Waste Disposed
Input Value
CalEEMod Version: CalEEMod.2013.2.2 Date: 9/24/2015 2:09 PMPage 6 of 6

Project Characteristics -
Land Use -
Construction Phase - Schedule provided by SCE
Off-road Equipment -
Off-road Equipment - Equipment list provided by SCE
Trips and VMT - On road vehicle trips provided by SCE
Demolition -
Construction Off-road Equipment Mitigation - All equipment pieces mitigated to Tier 3
South Coast Air Basin, Summer
Mesa Substation Project - Well Decommissioning
1.1 Land Usage
1.2 Other Project Characteristics
Urbanization
Climate Zone
Urban
9
Wind Speed (m/s) Precipitation Freq (Days)2.2 31
1.3 User Entered Comments & Non-Default Data
1.0 Project Characteristics
Utility Company Southern California Edison
2016Operational Year
CO2 Intensity (lb/MWhr)
630.89 0.029CH4 Intensity (lb/MWhr)
0.006N2O Intensity (lb/MWhr)
CalEEMod Version: CalEEMod.2013.2.2 Date: 9/24/2015 2:08 PMPage 1 of 11

2.0 Emissions Summary
Table Name Column Name Default Value New Value
tblConstEquipMitigation NumberOfEquipmentMitigated 0.00 1.00
tblConstEquipMitigation NumberOfEquipmentMitigated 0.00 1.00
tblConstEquipMitigation Tier No Change Tier 3
tblConstEquipMitigation Tier No Change Tier 3
tblConstructionPhase NumDays 0.00 18.00
tblOffRoadEquipment HorsePower 205.00 250.00
tblOffRoadEquipment HorsePower 400.00 97.00
tblOffRoadEquipment LoadFactor 0.50 0.73
tblOffRoadEquipment LoadFactor 0.38 0.37
tblOffRoadEquipment OffRoadEquipmentUnitAmount 0.00 1.00
tblOffRoadEquipment OffRoadEquipmentUnitAmount 0.00 1.00
tblOffRoadEquipment PhaseName Well Decommissioning
tblOffRoadEquipment PhaseName Well Decommissioning
tblProjectCharacteristics OperationalYear 2014 2016
CalEEMod Version: CalEEMod.2013.2.2 Date: 9/24/2015 2:08 PMPage 2 of 11

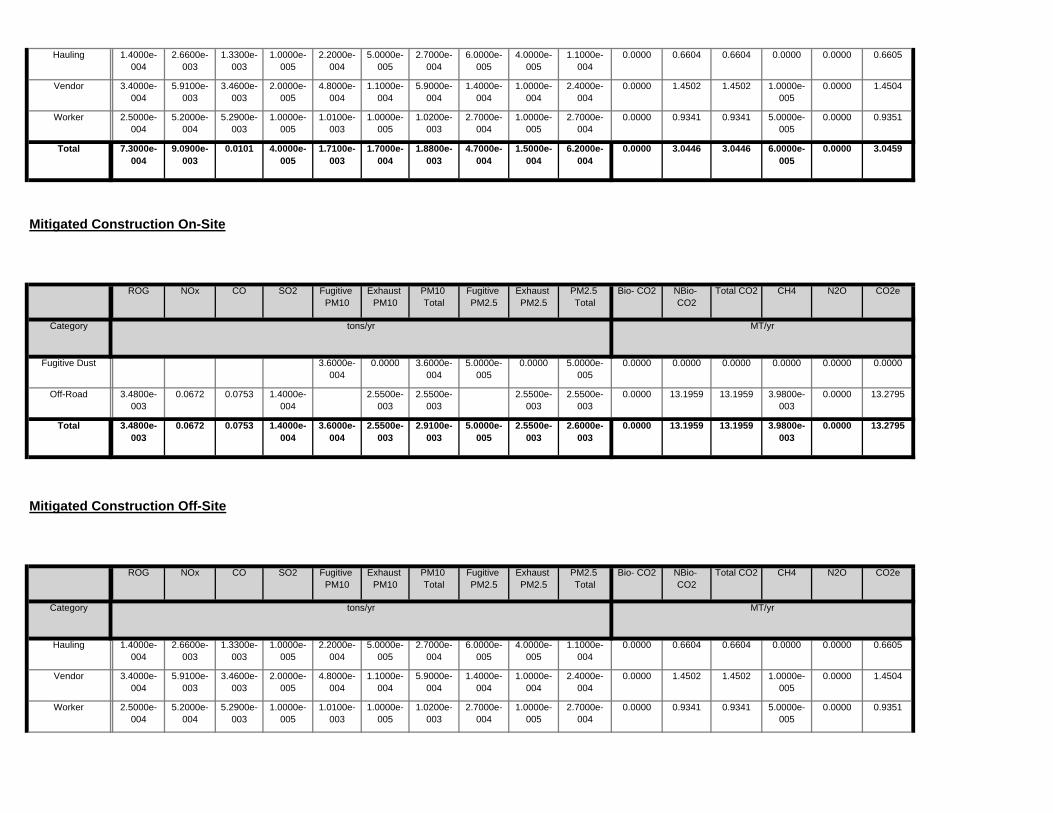
2.1 Overall Construction (Maximum Daily Emission)
ROG NOx CO SO2 Fugitive PM10
Exhaust PM10
PM10 Total
Fugitive PM2.5
Exhaust PM2.5
PM2.5 Total Bio- CO2 NBio- CO2 Total CO2 CH4 N2O CO2e
Year lb/day lb/day
2016 0.7007 10.2934 4.7680 0.0196 0.2822 0.2924 0.5746 0.0662 0.2690 0.3352 0.0000 1,995.0737
1,995.0737
0.4952 0.0000 2,005.4729
Total 0.7007 10.2934 4.7680 0.0196 0.2822 0.2924 0.5746 0.0662 0.2690 0.3352 0.0000 1,995.0737
1,995.0737
0.4952 0.0000 2,005.4729
Unmitigated Construction
ROG NOx CO SO2 Fugitive PM10
Exhaust PM10
PM10 Total
Fugitive PM2.5
Exhaust PM2.5
PM2.5 Total
Bio- CO2 NBio- CO2 Total CO2 CH4 N2O CO2e
Year lb/day lb/day
2016 0.4672 8.4197 9.4900 0.0196 0.2331 0.3015 0.5346 0.0588 0.3000 0.3588 0.0000 1,995.0737
1,995.0737
0.4952 0.0000 2,005.4729
Total 0.4672 8.4197 9.4900 0.0196 0.2331 0.3015 0.5346 0.0588 0.3000 0.3588 0.0000 1,995.0737
1,995.0737
0.4952 0.0000 2,005.4729
Mitigated Construction
ROG NOx CO SO2 Fugitive PM10
Exhaust PM10
PM10 Total
Fugitive PM2.5
Exhaust PM2.5
PM2.5 Total
Bio- CO2 NBio-CO2 Total CO2 CH4 N20 CO2e
Percent Reduction
33.32 18.20 -99.03 0.00 17.38 -3.10 6.96 11.21 -11.52 -7.03 0.00 0.00 0.00 0.00 0.00 0.00
CalEEMod Version: CalEEMod.2013.2.2 Date: 9/24/2015 2:08 PMPage 3 of 11

2.2 Overall Operational
ROG NOx CO SO2 Fugitive PM10
Exhaust PM10
PM10 Total
Fugitive PM2.5
Exhaust PM2.5
PM2.5 Total Bio- CO2 NBio- CO2 Total CO2 CH4 N2O CO2e
Category lb/day lb/day
Area 0.0000 0.0000 0.0000 0.0000 0.0000 0.0000 0.0000
Total 0.0000 0.0000 0.0000 0.0000 0.0000 0.0000 0.0000
Unmitigated Operational
ROG NOx CO SO2 Fugitive PM10
Exhaust PM10
PM10 Total
Fugitive PM2.5
Exhaust PM2.5
PM2.5 Total Bio- CO2 NBio- CO2 Total CO2 CH4 N2O CO2e
Category lb/day lb/day
Area 0.0000 0.0000 0.0000 0.0000 0.0000 0.0000 0.0000
Total 0.0000 0.0000 0.0000 0.0000 0.0000 0.0000 0.0000
Mitigated Operational
ROG NOx CO SO2 Fugitive PM10
Exhaust PM10
PM10 Total
Fugitive PM2.5
Exhaust PM2.5
PM2.5 Total
Bio- CO2 NBio-CO2 Total CO2 CH4 N20 CO2e
Percent Reduction
0.00 0.00 0.00 0.00 0.00 0.00 0.00 0.00 0.00 0.00 0.00 0.00 0.00 0.00 0.00 0.00
CalEEMod Version: CalEEMod.2013.2.2 Date: 9/24/2015 2:08 PMPage 4 of 11

3.0 Construction Detail
3.1 Mitigation Measures Construction
Construction Phase
Phase Number
Phase Name Phase Type Start Date End Date Num Days Week
Num Days Phase Description
1 Well Decommissioning Demolition 6/13/2016 7/6/2016 5 18 Decommission 10 Groundwater Monitoring Wells
OffRoad Equipment
Phase Name Offroad Equipment Type Amount Usage Hours Horse Power Load Factor
Well Decommissioning Bore/Drill Rigs 1 8.00 250 0.73
Well Decommissioning Off-Highway Trucks 1 8.00 97 0.37
Trips and VMT
Phase Name Offroad Equipment Count
Worker Trip Number
Vendor Trip Number
Hauling Trip Number
Worker Trip Length
Vendor Trip Length
Hauling Trip Length
Worker Vehicle Class
Vendor Vehicle Class
Hauling Vehicle Class
Well Decommissioning
0 5.00 2.00 11.00 30.00 30.00 45.00 LD_Mix HDT_Mix HDT_Mix
Residential Indoor: 0; Residential Outdoor: 0; Non-Residential Indoor: 0; Non-Residential Outdoor: 0 (Architectural Coating – sqft)
Acres of Grading (Site Preparation Phase): 0
Acres of Grading (Grading Phase): 0
Acres of Paving: 0
CalEEMod Version: CalEEMod.2013.2.2 Date: 9/24/2015 2:08 PMPage 5 of 11

3.2 Well Decommissioning - 2016
ROG NOx CO SO2 Fugitive PM10
Exhaust PM10
PM10 Total
Fugitive PM2.5
Exhaust PM2.5
PM2.5 Total Bio- CO2 NBio- CO2 Total CO2 CH4 N2O CO2e
Category lb/day lb/day
Fugitive Dust 0.0892 0.0000 0.0892 0.0135 0.0000 0.0135 0.0000 0.0000
Off-Road 0.6198 9.3411 3.6468 0.0156 0.2742 0.2742 0.2523 0.2523 1,616.2239
1,616.2239
0.4875 1,626.4616
Total 0.6198 9.3411 3.6468 0.0156 0.0892 0.2742 0.3634 0.0135 0.2523 0.2658 1,616.2239
1,616.2239
0.4875 1,626.4616
Unmitigated Construction On-Site
Use Cleaner Engines for Construction Equipment
Use Soil Stabilizer
Water Exposed Area
Reduce Vehicle Speed on Unpaved Roads
Clean Paved Roads
CalEEMod Version: CalEEMod.2013.2.2 Date: 9/24/2015 2:08 PMPage 6 of 11

3.2 Well Decommissioning - 2016
ROG NOx CO SO2 Fugitive PM10
Exhaust PM10
PM10 Total
Fugitive PM2.5
Exhaust PM2.5
PM2.5 Total Bio- CO2 NBio- CO2 Total CO2 CH4 N2O CO2e
Category lb/day lb/day
Hauling 0.0153 0.2792 0.1378 8.0000e-004
0.0248 5.4200e-003
0.0303 7.0600e-003
4.9900e-003
0.0121 80.9314 80.9314 5.1000e-004
80.9421
Vendor 0.0369 0.6224 0.3519 1.7700e-003
0.0542 0.0119 0.0661 0.0154 0.0109 0.0263 177.7692 177.7692 1.1400e-003
177.7930
Worker 0.0288 0.0507 0.6315 1.4300e-003
0.1140 9.1000e-004
0.1149 0.0302 8.4000e-004
0.0311 120.1493 120.1493 6.0500e-003
120.2762
Total 0.0809 0.9522 1.1212 4.0000e-003
0.1930 0.0182 0.2112 0.0527 0.0168 0.0695 378.8498 378.8498 7.7000e-003
379.0113
Unmitigated Construction Off-Site
ROG NOx CO SO2 Fugitive PM10
Exhaust PM10
PM10 Total
Fugitive PM2.5
Exhaust PM2.5
PM2.5 Total Bio- CO2 NBio- CO2 Total CO2 CH4 N2O CO2e
Category lb/day lb/day
Fugitive Dust 0.0401 0.0000 0.0401 6.0800e-003
0.0000 6.0800e-003
0.0000 0.0000
Off-Road 0.3863 7.4675 8.3688 0.0156 0.2833 0.2833 0.2833 0.2833 0.0000 1,616.2239
1,616.2239
0.4875 1,626.4616
Total 0.3863 7.4675 8.3688 0.0156 0.0401 0.2833 0.3234 6.0800e-003
0.2833 0.2893 0.0000 1,616.2239
1,616.2239
0.4875 1,626.4616
Mitigated Construction On-Site
CalEEMod Version: CalEEMod.2013.2.2 Date: 9/24/2015 2:08 PMPage 7 of 11

4.0 Operational Detail - Mobile
4.1 Mitigation Measures Mobile
4.2 Trip Summary Information
4.3 Trip Type Information
Average Daily Trip Rate Unmitigated Mitigated
Land Use Weekday Saturday Sunday Annual VMT Annual VMT
Total
Miles Trip % Trip Purpose %
Land Use H-W or C-W H-S or C-C H-O or C-NW H-W or C-W H-S or C-C H-O or C-NW Primary Diverted Pass-by
3.2 Well Decommissioning - 2016
ROG NOx CO SO2 Fugitive PM10
Exhaust PM10
PM10 Total
Fugitive PM2.5
Exhaust PM2.5
PM2.5 Total Bio- CO2 NBio- CO2 Total CO2 CH4 N2O CO2e
Category lb/day lb/day
Hauling 0.0153 0.2792 0.1378 8.0000e-004
0.0248 5.4200e-003
0.0303 7.0600e-003
4.9900e-003
0.0121 80.9314 80.9314 5.1000e-004
80.9421
Vendor 0.0369 0.6224 0.3519 1.7700e-003
0.0542 0.0119 0.0661 0.0154 0.0109 0.0263 177.7692 177.7692 1.1400e-003
177.7930
Worker 0.0288 0.0507 0.6315 1.4300e-003
0.1140 9.1000e-004
0.1149 0.0302 8.4000e-004
0.0311 120.1493 120.1493 6.0500e-003
120.2762
Total 0.0809 0.9522 1.1212 4.0000e-003
0.1930 0.0182 0.2112 0.0527 0.0168 0.0695 378.8498 378.8498 7.7000e-003
379.0113
Mitigated Construction Off-Site
CalEEMod Version: CalEEMod.2013.2.2 Date: 9/24/2015 2:08 PMPage 8 of 11

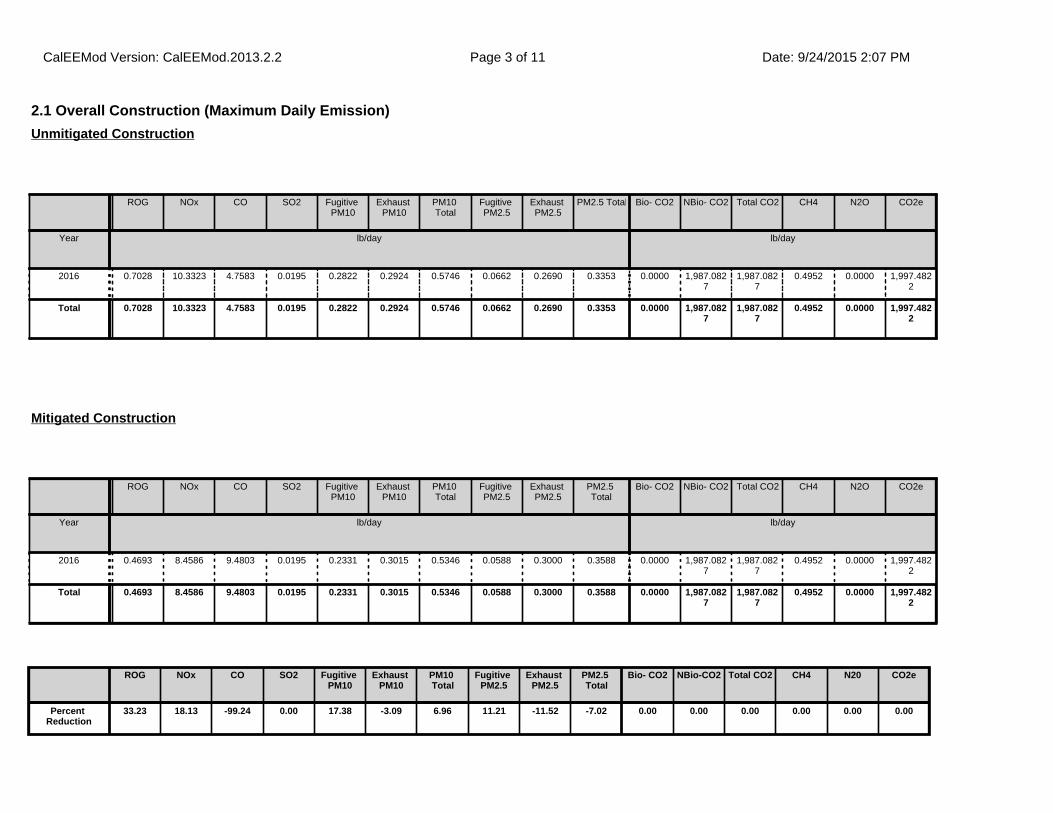
6.1 Mitigation Measures Area
5.0 Energy Detail
6.0 Area Detail
ROG NOx CO SO2 Fugitive PM10
Exhaust PM10
PM10 Total
Fugitive PM2.5
Exhaust PM2.5
PM2.5 Total Bio- CO2 NBio- CO2 Total CO2 CH4 N2O CO2e
Category lb/day lb/day
Mitigated 0.0000 0.0000 0.0000 0.0000 0.0000 0.0000 0.0000
Unmitigated 0.0000 0.0000 0.0000 0.0000 0.0000 0.0000 0.0000
5.1 Mitigation Measures Energy
4.4 Fleet Mix
LDA LDT1 LDT2 MDV LHD1 LHD2 MHD HHD OBUS UBUS MCY SBUS MH
0.514315 0.060290 0.180146 0.139458 0.042007 0.006636 0.015782 0.029894 0.001929 0.002512 0.004343 0.000595 0.002093
Historical Energy Use: N
CalEEMod Version: CalEEMod.2013.2.2 Date: 9/24/2015 2:08 PMPage 9 of 11

7.1 Mitigation Measures Water
7.0 Water Detail
6.2 Area by SubCategory
ROG NOx CO SO2 Fugitive PM10
Exhaust PM10
PM10 Total
Fugitive PM2.5
Exhaust PM2.5
PM2.5 Total Bio- CO2 NBio- CO2 Total CO2 CH4 N2O CO2e
SubCategory lb/day lb/day
Consumer Products
0.0000 0.0000 0.0000 0.0000 0.0000 0.0000 0.0000
Architectural Coating
0.0000 0.0000 0.0000 0.0000 0.0000 0.0000 0.0000
Total 0.0000 0.0000 0.0000 0.0000 0.0000 0.0000 0.0000
Unmitigated
ROG NOx CO SO2 Fugitive PM10
Exhaust PM10
PM10 Total
Fugitive PM2.5
Exhaust PM2.5
PM2.5 Total Bio- CO2 NBio- CO2 Total CO2 CH4 N2O CO2e
SubCategory lb/day lb/day
Architectural Coating
0.0000 0.0000 0.0000 0.0000 0.0000 0.0000 0.0000
Consumer Products
0.0000 0.0000 0.0000 0.0000 0.0000 0.0000 0.0000
Total 0.0000 0.0000 0.0000 0.0000 0.0000 0.0000 0.0000
Mitigated
CalEEMod Version: CalEEMod.2013.2.2 Date: 9/24/2015 2:08 PMPage 10 of 11

8.1 Mitigation Measures Waste
8.0 Waste Detail
10.0 Vegetation
9.0 Operational Offroad
Equipment Type Number Hours/Day Days/Year Horse Power Load Factor Fuel Type
CalEEMod Version: CalEEMod.2013.2.2 Date: 9/24/2015 2:08 PMPage 11 of 11

Project Characteristics -
Land Use -
Construction Phase - Schedule provided by SCE
Off-road Equipment -
Off-road Equipment - Equipment list provided by SCE
Trips and VMT - On road vehicle trips provided by SCE
Demolition -
Construction Off-road Equipment Mitigation - All equipment pieces mitigated to Tier 3
South Coast Air Basin, Winter
Mesa Substation Project - Well Decommissioning
1.1 Land Usage
1.2 Other Project Characteristics
Urbanization
Climate Zone
Urban
9
Wind Speed (m/s) Precipitation Freq (Days)2.2 31
1.3 User Entered Comments & Non-Default Data
1.0 Project Characteristics
Utility Company Southern California Edison
2016Operational Year
CO2 Intensity (lb/MWhr)
630.89 0.029CH4 Intensity (lb/MWhr)
0.006N2O Intensity (lb/MWhr)
CalEEMod Version: CalEEMod.2013.2.2 Date: 9/24/2015 2:07 PMPage 1 of 11

2.0 Emissions Summary
Table Name Column Name Default Value New Value
tblConstEquipMitigation NumberOfEquipmentMitigated 0.00 1.00
tblConstEquipMitigation NumberOfEquipmentMitigated 0.00 1.00
tblConstEquipMitigation Tier No Change Tier 3
tblConstEquipMitigation Tier No Change Tier 3
tblConstructionPhase NumDays 0.00 18.00
tblOffRoadEquipment HorsePower 205.00 250.00
tblOffRoadEquipment HorsePower 400.00 97.00
tblOffRoadEquipment LoadFactor 0.50 0.73
tblOffRoadEquipment LoadFactor 0.38 0.37
tblOffRoadEquipment OffRoadEquipmentUnitAmount 0.00 1.00
tblOffRoadEquipment OffRoadEquipmentUnitAmount 0.00 1.00
tblOffRoadEquipment PhaseName Well Decommissioning
tblOffRoadEquipment PhaseName Well Decommissioning
tblProjectCharacteristics OperationalYear 2014 2016
CalEEMod Version: CalEEMod.2013.2.2 Date: 9/24/2015 2:07 PMPage 2 of 11
2.1 Overall Construction (Maximum Daily Emission)
ROG NOx CO SO2 Fugitive PM10
Exhaust PM10
PM10 Total
Fugitive PM2.5
Exhaust PM2.5
PM2.5 Total Bio- CO2 NBio- CO2 Total CO2 CH4 N2O CO2e
Year lb/day lb/day
2016 0.7028 10.3323 4.7583 0.0195 0.2822 0.2924 0.5746 0.0662 0.2690 0.3353 0.0000 1,987.0827
1,987.0827
0.4952 0.0000 1,997.4822
Total 0.7028 10.3323 4.7583 0.0195 0.2822 0.2924 0.5746 0.0662 0.2690 0.3353 0.0000 1,987.0827
1,987.0827
0.4952 0.0000 1,997.4822
Unmitigated Construction
ROG NOx CO SO2 Fugitive PM10
Exhaust PM10
PM10 Total
Fugitive PM2.5
Exhaust PM2.5
PM2.5 Total
Bio- CO2 NBio- CO2 Total CO2 CH4 N2O CO2e
Year lb/day lb/day
2016 0.4693 8.4586 9.4803 0.0195 0.2331 0.3015 0.5346 0.0588 0.3000 0.3588 0.0000 1,987.0827
1,987.0827
0.4952 0.0000 1,997.4822
Total 0.4693 8.4586 9.4803 0.0195 0.2331 0.3015 0.5346 0.0588 0.3000 0.3588 0.0000 1,987.0827
1,987.0827
0.4952 0.0000 1,997.4822
Mitigated Construction
ROG NOx CO SO2 Fugitive PM10
Exhaust PM10
PM10 Total
Fugitive PM2.5
Exhaust PM2.5
PM2.5 Total
Bio- CO2 NBio-CO2 Total CO2 CH4 N20 CO2e
Percent Reduction
33.23 18.13 -99.24 0.00 17.38 -3.09 6.96 11.21 -11.52 -7.02 0.00 0.00 0.00 0.00 0.00 0.00
CalEEMod Version: CalEEMod.2013.2.2 Date: 9/24/2015 2:07 PMPage 3 of 11

2.2 Overall Operational
ROG NOx CO SO2 Fugitive PM10
Exhaust PM10
PM10 Total
Fugitive PM2.5
Exhaust PM2.5
PM2.5 Total Bio- CO2 NBio- CO2 Total CO2 CH4 N2O CO2e
Category lb/day lb/day
Area 0.0000 0.0000 0.0000 0.0000 0.0000 0.0000 0.0000
Total 0.0000 0.0000 0.0000 0.0000 0.0000 0.0000 0.0000
Unmitigated Operational
ROG NOx CO SO2 Fugitive PM10
Exhaust PM10
PM10 Total
Fugitive PM2.5
Exhaust PM2.5
PM2.5 Total Bio- CO2 NBio- CO2 Total CO2 CH4 N2O CO2e
Category lb/day lb/day
Area 0.0000 0.0000 0.0000 0.0000 0.0000 0.0000 0.0000
Total 0.0000 0.0000 0.0000 0.0000 0.0000 0.0000 0.0000
Mitigated Operational
ROG NOx CO SO2 Fugitive PM10
Exhaust PM10
PM10 Total
Fugitive PM2.5
Exhaust PM2.5
PM2.5 Total
Bio- CO2 NBio-CO2 Total CO2 CH4 N20 CO2e
Percent Reduction
0.00 0.00 0.00 0.00 0.00 0.00 0.00 0.00 0.00 0.00 0.00 0.00 0.00 0.00 0.00 0.00
CalEEMod Version: CalEEMod.2013.2.2 Date: 9/24/2015 2:07 PMPage 4 of 11

3.0 Construction Detail
3.1 Mitigation Measures Construction
Construction Phase
Phase Number
Phase Name Phase Type Start Date End Date Num Days Week
Num Days Phase Description
1 Well Decommissioning Demolition 6/13/2016 7/6/2016 5 18 Decommission 10 Groundwater Monitoring Wells
OffRoad Equipment
Phase Name Offroad Equipment Type Amount Usage Hours Horse Power Load Factor
Well Decommissioning Bore/Drill Rigs 1 8.00 250 0.73
Well Decommissioning Off-Highway Trucks 1 8.00 97 0.37
Trips and VMT
Phase Name Offroad Equipment Count
Worker Trip Number
Vendor Trip Number
Hauling Trip Number
Worker Trip Length
Vendor Trip Length
Hauling Trip Length
Worker Vehicle Class
Vendor Vehicle Class
Hauling Vehicle Class
Well Decommissioning 0 5.00 2.00 11.00 30.00 30.00 45.00 LD_Mix HDT_Mix HDT_Mix
Residential Indoor: 0; Residential Outdoor: 0; Non-Residential Indoor: 0; Non-Residential Outdoor: 0 (Architectural Coating – sqft)
Acres of Grading (Site Preparation Phase): 0
Acres of Grading (Grading Phase): 0
Acres of Paving: 0
CalEEMod Version: CalEEMod.2013.2.2 Date: 9/24/2015 2:07 PMPage 5 of 11

3.2 Well Decommissioning - 2016
ROG NOx CO SO2 Fugitive PM10
Exhaust PM10
PM10 Total
Fugitive PM2.5
Exhaust PM2.5
PM2.5 Total Bio- CO2 NBio- CO2 Total CO2 CH4 N2O CO2e
Category lb/day lb/day
Fugitive Dust 0.0892 0.0000 0.0892 0.0135 0.0000 0.0135 0.0000 0.0000
Off-Road 0.6198 9.3411 3.6468 0.0156 0.2742 0.2742 0.2523 0.2523 1,616.2239
1,616.2239
0.4875 1,626.4616
Total 0.6198 9.3411 3.6468 0.0156 0.0892 0.2742 0.3634 0.0135 0.2523 0.2658 1,616.2239
1,616.2239
0.4875 1,626.4616
Unmitigated Construction On-Site
Use Cleaner Engines for Construction Equipment
Use Soil Stabilizer
Water Exposed Area
Reduce Vehicle Speed on Unpaved Roads
Clean Paved Roads
CalEEMod Version: CalEEMod.2013.2.2 Date: 9/24/2015 2:07 PMPage 6 of 11

3.2 Well Decommissioning - 2016
ROG NOx CO SO2 Fugitive PM10
Exhaust PM10
PM10 Total
Fugitive PM2.5
Exhaust PM2.5
PM2.5 Total Bio- CO2 NBio- CO2 Total CO2 CH4 N2O CO2e
Category lb/day lb/day
Hauling 0.0158 0.2900 0.1494 8.0000e-004
0.0248 5.4300e-003
0.0303 7.0600e-003
5.0000e-003
0.0121 80.8196 80.8196 5.1000e-004
80.8304
Vendor 0.0385 0.6455 0.3907 1.7600e-003
0.0542 0.0119 0.0661 0.0154 0.0109 0.0264 177.4035 177.4035 1.1400e-003
177.4275
Worker 0.0288 0.0557 0.5714 1.3400e-003
0.1140 9.1000e-004
0.1149 0.0302 8.4000e-004
0.0311 112.6357 112.6357 6.0500e-003
112.7627
Total 0.0830 0.9911 1.1115 3.9000e-003
0.1930 0.0182 0.2113 0.0527 0.0168 0.0695 370.8588 370.8588 7.7000e-003
371.0206
Unmitigated Construction Off-Site
ROG NOx CO SO2 Fugitive PM10
Exhaust PM10
PM10 Total
Fugitive PM2.5
Exhaust PM2.5
PM2.5 Total Bio- CO2 NBio- CO2 Total CO2 CH4 N2O CO2e
Category lb/day lb/day
Fugitive Dust 0.0401 0.0000 0.0401 6.0800e-003
0.0000 6.0800e-003
0.0000 0.0000
Off-Road 0.3863 7.4675 8.3688 0.0156 0.2833 0.2833 0.2833 0.2833 0.0000 1,616.2239
1,616.2239
0.4875 1,626.4616
Total 0.3863 7.4675 8.3688 0.0156 0.0401 0.2833 0.3234 6.0800e-003
0.2833 0.2893 0.0000 1,616.2239
1,616.2239
0.4875 1,626.4616
Mitigated Construction On-Site
CalEEMod Version: CalEEMod.2013.2.2 Date: 9/24/2015 2:07 PMPage 7 of 11

4.0 Operational Detail - Mobile
4.1 Mitigation Measures Mobile
4.2 Trip Summary Information
4.3 Trip Type Information
Average Daily Trip Rate Unmitigated Mitigated
Land Use Weekday Saturday Sunday Annual VMT Annual VMT
Total
Miles Trip % Trip Purpose %
Land Use H-W or C-W H-S or C-C H-O or C-NW H-W or C-W H-S or C-C H-O or C-NW Primary Diverted Pass-by
3.2 Well Decommissioning - 2016
ROG NOx CO SO2 Fugitive PM10
Exhaust PM10
PM10 Total
Fugitive PM2.5
Exhaust PM2.5
PM2.5 Total Bio- CO2 NBio- CO2 Total CO2 CH4 N2O CO2e
Category lb/day lb/day
Hauling 0.0158 0.2900 0.1494 8.0000e-004
0.0248 5.4300e-003
0.0303 7.0600e-003
5.0000e-003
0.0121 80.8196 80.8196 5.1000e-004
80.8304
Vendor 0.0385 0.6455 0.3907 1.7600e-003
0.0542 0.0119 0.0661 0.0154 0.0109 0.0264 177.4035 177.4035 1.1400e-003
177.4275
Worker 0.0288 0.0557 0.5714 1.3400e-003
0.1140 9.1000e-004
0.1149 0.0302 8.4000e-004
0.0311 112.6357 112.6357 6.0500e-003
112.7627
Total 0.0830 0.9911 1.1115 3.9000e-003
0.1930 0.0182 0.2113 0.0527 0.0168 0.0695 370.8588 370.8588 7.7000e-003
371.0206
Mitigated Construction Off-Site
CalEEMod Version: CalEEMod.2013.2.2 Date: 9/24/2015 2:07 PMPage 8 of 11
6.1 Mitigation Measures Area
5.0 Energy Detail
6.0 Area Detail
ROG NOx CO SO2 Fugitive PM10
Exhaust PM10
PM10 Total
Fugitive PM2.5
Exhaust PM2.5
PM2.5 Total Bio- CO2 NBio- CO2 Total CO2 CH4 N2O CO2e
Category lb/day lb/day
Mitigated 0.0000 0.0000 0.0000 0.0000 0.0000 0.0000 0.0000
Unmitigated 0.0000 0.0000 0.0000 0.0000 0.0000 0.0000 0.0000
5.1 Mitigation Measures Energy
4.4 Fleet Mix
LDA LDT1 LDT2 MDV LHD1 LHD2 MHD HHD OBUS UBUS MCY SBUS MH
0.514315 0.060290 0.180146 0.139458 0.042007 0.006636 0.015782 0.029894 0.001929 0.002512 0.004343 0.000595 0.002093
Historical Energy Use: N
CalEEMod Version: CalEEMod.2013.2.2 Date: 9/24/2015 2:07 PMPage 9 of 11

7.1 Mitigation Measures Water
7.0 Water Detail
6.2 Area by SubCategory
ROG NOx CO SO2 Fugitive PM10
Exhaust PM10
PM10 Total
Fugitive PM2.5
Exhaust PM2.5
PM2.5 Total Bio- CO2 NBio- CO2 Total CO2 CH4 N2O CO2e
SubCategory lb/day lb/day
Consumer Products
0.0000 0.0000 0.0000 0.0000 0.0000 0.0000 0.0000
Architectural Coating
0.0000 0.0000 0.0000 0.0000 0.0000 0.0000 0.0000
Total 0.0000 0.0000 0.0000 0.0000 0.0000 0.0000 0.0000
Unmitigated
ROG NOx CO SO2 Fugitive PM10
Exhaust PM10
PM10 Total
Fugitive PM2.5
Exhaust PM2.5
PM2.5 Total Bio- CO2 NBio- CO2 Total CO2 CH4 N2O CO2e
SubCategory lb/day lb/day
Architectural Coating
0.0000 0.0000 0.0000 0.0000 0.0000 0.0000 0.0000
Consumer Products
0.0000 0.0000 0.0000 0.0000 0.0000 0.0000 0.0000
Total 0.0000 0.0000 0.0000 0.0000 0.0000 0.0000 0.0000
Mitigated
CalEEMod Version: CalEEMod.2013.2.2 Date: 9/24/2015 2:07 PMPage 10 of 11

8.1 Mitigation Measures Waste
8.0 Waste Detail
10.0 Vegetation
9.0 Operational Offroad
Equipment Type Number Hours/Day Days/Year Horse Power Load Factor Fuel Type
CalEEMod Version: CalEEMod.2013.2.2 Date: 9/24/2015 2:07 PMPage 11 of 11