Embed Size (px)
Citation preview
This PDF is a selection from an out-of-print volume from the NationalBureau of Economic Research
Volume Title: Problems in the International Comparison of EconomicAccounts
Volume Author/Editor: The Conference on Research in Income and Wealth
Volume Publisher: Princeton University Press
Volume ISBN: 0-870-14176-7
Volume URL: http://www.nber.org/books/unkn57-2
Publication Date: 1957
Chapter Title: Measuring Comparative Purchasing Power
Chapter Author: Dorothy Brady, Abner Hurwitz
Chapter URL: http://www.nber.org/chapters/c2686
Chapter pages in book: (p. 301 - 348)
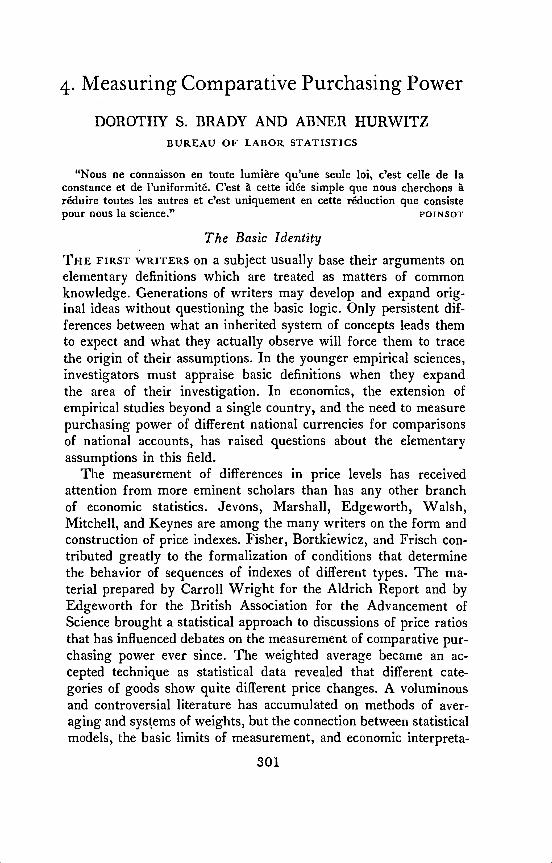
4. Measuring Comparative Purchasing Power
DOROTHY S. BRADY AND ABNER HURWITZBUREAU OF LABOR STATISTICS
"Nous ne connaisson en toute lumière qu'une seule loi, c'est celle de Iaconstance et de l'uniformité. C'est a cette idée simple que nous cherchons aréduire toutes les autres et c'est uniquement en cette reduction que consistepour nous la science." POINSOT
The Basic IdentityTHE FIRST WRITERS on a subject usually base their arguments onelementary definitions which are treated as matters of commonknowledge. Generations of writers may develop and expand orig-inal ideas without questioning the basic logic. Only persistent dif-ferences between what an inherited system of concepts leads themto expect and what they actually observe will force them to tracethe origin of their assumptions. In the younger empirical sciences,investigators must appraise basic definitions when they expandthe area of their investigation. In economics, the extension ofempirical studies beyond a single country, and the need to measurepurchasing power of different national currencies for comparisonsof national accounts, has raised questions about the elementaryassumptions in this field.
The measurement of differences in price levels has receivedattention from more eminent scholars than has any other branchof economic statistics. Jevons, Marshall, Edgeworth, Walsh,Mitchell, and Keynes are among the many writers on the form andconstruction of price indexes. Fisher, Bortkiewicz, and Frisch con-tributed greatly to the formalization of conditions that determinethe behavior of sequences of indexes of different types. The ma-terial prepared by Carroll Wright for the Aldrich Report and byEdgeworth for the British Association for the Advancement ofScience brought a statistical approach to discussions of price ratiosthat has influenced debates on the measurement of comparative pur-chasing power ever since. The weighted average became an ac-cepted technique as statistical data revealed that different cate-gories of goods show quite different price changes. A voluminousand controversial literature has accumulated on methods of aver-aging and systems of weights, but the connection between statisticalmodels, the basic limits of measurement, and economic interpreta-
301

COMPARATiVE PURCHASiNG POWERtions of the phenomena of price variation is rarely mentioned andnever examined completely. Price indexes compiled today do notdiffer essentially from those constructed in the early part of thecentury. Reports of the British Board of Trade in the years im-mediately preceding World War I offer as much insight into themeaning of price comparisons in different places as is providedby more current literature.'
Most methods of measuring differences in the price level requireobservations on prices of the same commodities and services intwo or more situations. Although identification and equating of anumber of objects (or activities) is fundamental, this first stephas never been completely examined by statisticians and economistsconcerned with observing and interpreting the phenomena of pricechange and price variation. A loaf of bread, an Arrow shirt, aChevrolet car have been treated as unchanged when transportedfrom one setting to another in a price index.
Even proposed methods such as the KonUs "true" cost of livingindex, the double expenditure index of Frisch, Staehle's minimumabsolute difference, and the Divisia continuous indexes requireprices of identical goods and services in two situations. Precisionin identification is left to the practical statistician, for these moreesoteric procedures which attempt to select equivalent but notidentical systems of weights are not easy to apply in the directcomparisons of situations where a complete matching of goodsand services is practically impossible.
The strict identification of commodities for purposes of pricecomparison must have seemed obvious common sense even in thelast decade of the nineteenth century. The most casual inspectionof the list of goods for which prices were collected in those yearscreates a picture of the consumer who bought foods and othercommodities for processing in the home. The increasing complexityof fabrication in the goods that are sold in the markets of the worldhas added considerably to the difficulties of defining the equivalenceof commodities for price comparison purposes.
International comparisons have revived the original purpose ofprice indexes, but the diversity and complexity of goods in themarket today do not permit the simple association between changesin prices and changes in the value of money that originated withJevons.
1 Cost of Living in American Towns and Cost of Living in Belgian Towns,both London, Board of Trade, Darling, 1911.
302
COMPARATIVE PURCHASiNG POWER
The inequalities of MatchingThe wide possible range of choice in matching commodities or
services for price comparisons is seldom known even to the operat-ing statisticians who make the decisions. The price of a commodityor service may be affected by many physical and psychologicalproperties or by special conveniences and services attached to itssale. The matching of commodities or services in two or moresituations, dates, or places, must be based on a selection and specifi-cation of a small set of variables from the total that could be usedto describe the commodity or service. Identical matching of prod-ucts is almost always impossible, and the practical problem be-comes a matter of defining approximations to identity.
The magnitude of observed price differences depends on thedegree of specification. The least detailed specification, such asthe name of the commodity and the principal material used in itsconstruction, leads, in general, to the largest differences in pricesfor the same commodity and the greatest range in the relativeprices of different commodities from place to place or from timeto time. In similar markets, and over short time spans, prices forcommodities described by detailed specification tend to be similar,and the relative prices for commodities of the same general categoryvary within narrow limits. 'While there have been no experimentalstudies designed to measure the effect of the matching rules, com-parison of index series using different rules for identifying the"same" product in two situations confirms these inferences. Whenthe economic environments are dissimilar, price indexes definitelydepend on the degree of specification used in the matching.
In general, sales of commodities of a particular category areinversely correlated with their prices. The effect of the matchingrules can be examined most easily when this relation between theprices and the quantities sold resembles a demand function withunit elasticity. In this case the money value of sales is the samefor all commodities within the category. If p1 and q1 represent theprices and quantities in one situation, and p2 and q0 in anothersituation, the expressions
(1) p1q1=K1and(2) p2q2=K2
303
COMPARATIVE PURCHASING POWERdescribe this simple relation between prices and quantities. If thenumber n of commodities in the two situations is the same, theaggregate sales are
p1q1 = nK1and
p2q2 =The Laspeyres index,
(P2/P1)
is, because of the equality in the value weights expressed by (1), asimple average of price ratios
nThe same is true of the Paasche index. The simple average of priceratios obviously changes with the rule of matching. The lowestaverage value and the lowest dispersion result from matching inorder along the scale of price or quantity. Random matching pro-duces a higher average and a greater dispersion, and a completelyinverse ordering of the pairs leads to the highest average and thegreatest dispersion.
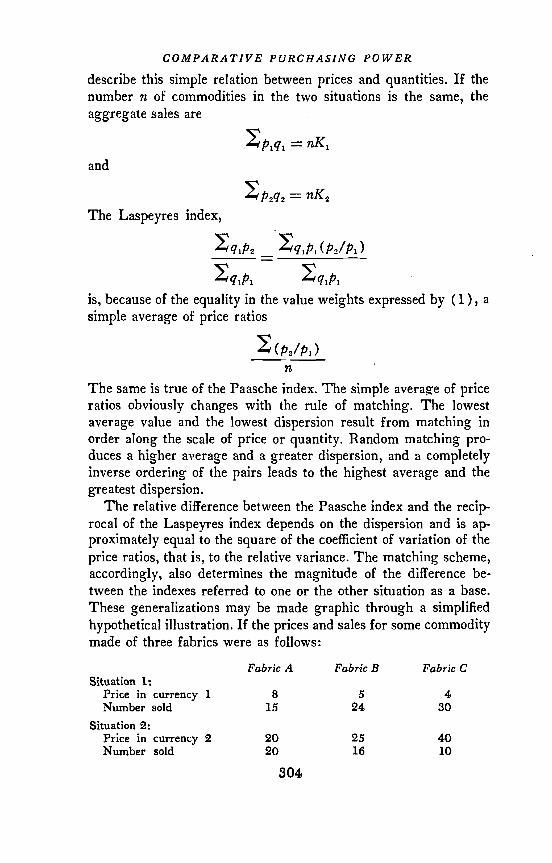
The relative difference between the Paasche index and the recip-rocal of the Laspeyres index depends on the dispersion and is ap-proximately equal to the square of the coefficient of variation of theprice ratios, that is, to the relative variance. The matching scheme,accordingly, also determines the magnitude of the difference be-tween the indexes referred to one or the other situation as a base.These generalizations may be made graphic through a simplifiedhypothetical illustration. If the prices and sales for some commoditymade of three fabrics were as follows:
Fabric A Fabric B Fabric CSituation 1:
Price in currency 1 8 5 4Number sold 15 24 30
Situation 2:Price in currency 2 20 25 40Number sold 20 16 10
304
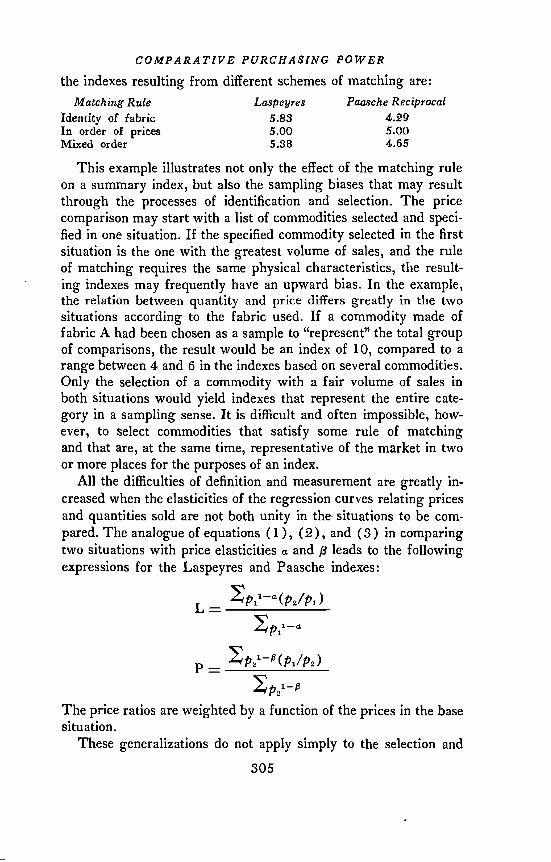
COMPARATIVE PURCHASING POWERthe indexes resulting from different schemes of matching are:
Matching Rule Laspeyres Paasche Reciprocalidentity of fabric 5.83 4.29In order of prices 5.00 5.00Mixed order 5.38 4.65
This example illustrates not only the effect of the matching ruleon a summary index, but also the sampling biases that may resultthrough the processes of identification and selection. The pricecomparison may start with a list of commodities selected and speci-fied in one situation. If the specified commodity selected in the firstsituation is the one with the greatest volume of sales, and the ruleof matching requires the same physical characteristics, the result-ing indexes may frequently have an upward bias. In the example,the relation between quantity and price differs greatly in the twosituations according to the fabric used. If a commodity made offabric A had been chosen as a sample to "represent" the total groupof comparisons, the result would be an index of 10, compared to arange between 4 and 6 in the indexes based on several commodities.Only the selection of a commodity with a fair volume of sales inboth situations would yield indexes that represent the entire cate-gory in a sampling sense. It is difficult and often impossible, how-ever, to select commodities that satisfy some rule of matchingand that are, at the same time, representative of the market in twoor more places for the purposes of an index.
All the difficulties of definition and measurement are greatly in-creased when the elasticities of the regression curves relating pricesand quantities sold are not both unity in the situations to be com-pared. The analogue of equations (1), (2), and (3) in comparingtwo situations with price elasticities a and p leads to the followingexpressions for the Laspeyres and Paasche indexes:
L=
P=
The price ratios are weighted by a function of the prices in the basesituation.
These generalizations do not apply simply to the selection and305

COMPARATIVE PURCHASING POWERmatching of commodities in a narrow commodity grouping. Theyapply to the total list of goods and services covered in a comparison.Charts presented in An International Comparison of National Prod-ucts and the Purchasing Power of Currencies by Gilbert andKravis2 showing the relation between the quantity ratios and priceratios for several European countries compared to the UnitedStates, suggest that the quantities and prices of all goods and serv-ices are inversely proportional to their prices in the United States,the United Kingdom, and possibly in France. In the case of Ger-many and Italy the regression curves apparently are much steeper.Accordingly, indexes prepared by different investigators using dif-ferent rules in procedures would not vary as much from the resultsof the Gilbert and Kravis calculations in the case of the UnitedKingdom and France as they would in the case of Germany andItaly.
Explanatory ModelsSummary measures of purchasing power can be constructed
from price statistics in many ways, but very few have been sub-mitted to empirical tests. Most price indexes have the form of sim-pie weighted averages, and the weights used have a simple substan-tive meaning. Exploration of techniques and methods has seldomgone beyond the preparation of a table showing how the calculatedaverages vary according to the weight system used. Although otherprocedures for measuring factors responsible for price differencesmay never displace the weighted average for practical purposes, in-formation required for their estimation would add greatly to empir-ical and theoretical knowledge of price behavior. The conversion ofnational accounts to a common price base may not immediately sug-gest such a factor analysis but attempts to make international com-parisons will in time force the development of new procedures.These in turn will influence the methods now followed in elimina-ting the effect of price change from the accounts for different datesin the same country.
Most of the thinking about the measurement of the price levelhas been devoted to the preparation of indexes recording changesover time. The necessary sequence followed in calculating a timeseries of price indexes has channeled development of procedures
2 Milton Gilbert and Irving B. Kravis, An International Comparison ofNational Products and the Purchasing Power of Currencies, Paris, OEEC,1954.
COMPARATIVE PURCHASING POWERinto the groove called, by Gilbert and Kravis, the "binary" com-parison. Comparison of the price levels in different places at thesame time does not impose any such practical restriction on theinvestigator. Indexes for a number of countries can be preparedsimultaneously and in such a way that many of the ambiguities ofthe binary comparison disappear. Just as in many problems ingeometry the move from two to three or more dimensions reducesthe number of indeterminate solutions, an increase in the scale ofprice comparisons might limit the number of answers to the samequestion.
The indexes required for a comparison of three or more situa-tions can be treated as factors that "explain" specific price differ-ence, and that can be combined in a statistical formula that permitstheir empirical determination. In international comparisons, thefactors that explain the differences among countries and the differ-ences among commodities can be described as country indexes anditem indexes. These factors can be assumed to be simply additive—the most common assumption in the design of experiments—orsimply multiplicative—the most common assumption in studies ofprices. The estimation of the factors in the additive case could bemodeled on procedures established in the analysis of variance. Aparticularly simple procedure for estimation of two factors in themultiplicative case has been developed by Smith and Themodel specifies that a price (or price ratio) p is, approximately,the product of a country index C and an item index 1. That is,(1)where e represents the difference between the observed price p andthe expected price CI for a particular commodity or service. Theprocedure devised by Smith and Jablon prescribes successive ap-proximations to the average indexes suggested by the solutions ofthis equation for C and 1. Since in most comparisons the use ofappropriate weights is indicated, the procedures of aggregating andaveraging proceed from the identity(2) qp+qe=qCIwhen q is the quantity of the particular commodity or service. WThenC is regarded as known, the solutions of this equation for 1, addedin the customary way, give an estimate of the average price of a
8 The structure and concepts of this procedure are described in a master'sthesis by John 0. Coleman, 'An Inquiry into the Problem of InternationalComparisons of Food Costs," The American University, June 1953.
307
COMPARATIVE PURCHASING POWERparticular commodity over all countries. When I is regarded asknown, adding the solutions of equation (2) gives an estimate ofthe price level in a particular country compared to the average forall the countries included in the calculation.
The average solution of equation (2) for I is simply the sum ofthe prices for a particular commodity, deflated for variations in thepurchasing power of currency and divided by the total quantity,that is, an average price as customarily defined. The average solu-tion of equation (2) for C is an index of the customary form inwhich the quantities relate to the particular country and the baseprices are the averages for all countries.
The first approximations to the country indexes are selected inany way. Then the succession of average solutions of equation (2)can be terminated when succeeding approximations no longer differsignificantly. The simple procedure for the estimation of countryindexes and item indexes is not limited to a single system of weightsor to a common list of items in all countries. The inclusion ofvariations in lists of items and other factors that represent theactualities in all situations may even lead to greater precision inthe estimation of these indexes. The procedure recommends itselfby the fact that it leads to a unique result (or none at all) forcomparisons of more than two situations.
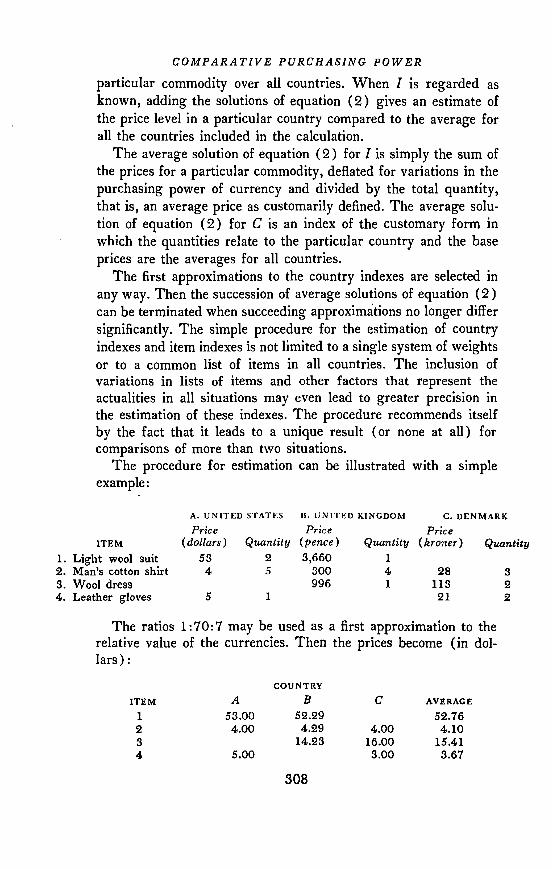
The procedure for estimation can be illustrated with a simpleexample:
A. UNITED STATES B. UNiTED KINGDOM C. DENMARKPrice Price Price
ITEM (dollars) Quantity (pence) Quantity (kroner) Quantity1. Light wool suit 53 2 3,660 12. Man's cotton shirt 4 5 300 4 28 33. Wool dress 996 1 113 24. Leather gloves 5 1 21 2
The ratios 1:70:7 may be used as a first approximation to therelative value of the currencies. Then the prices become (in dol-lars):
COUNTRYITEM A B C AVERAGE
1 53.00 52.29 52.762 4.00 4.29 4.00 4.103 14.23 16.00 15.414 5.00 3.00 3.67
308

COMPARATIVE PURCHASING POWERThese average prices as base prices, and the country's weights,
yield as a second approximation to the comparative purchasingpowers indexes, in percentages, for country A, 101.01; country B,98.95; and country C, 99.09. Deflating the prices by these indexesand repeating the operations leads to the following estimates:
COUNTRYITEM A B C AVERAGE
1 52.30 52.86 52.492 3.95 4.34 4.08 4.113 14.39 16.30 15.664 4.93 3.06 3.68
Index 101.39 98.92 98.02 1.00
These index ratios provide a correction for the first estimate ofcomparative purchasing power.
This method for determining indexes simultaneously, like anyother price comparison, depends on the matching scheme and therules followed in the selection of the commodities and services tobe included in the calculation. A greater diversity of goods andservices can be utilized in the determination than is possible inindexes requiring a fixed base, and the matching of identical goodsand services can be limited to those with attributes that have thesame meaning in two or more countries.
Indexes calculated in this way, like all averages, are valid esti-mates for the universe represented by the sample of price observa-tions. The indexes would not necessarily remain the same if thegeographic coverage in the calculation were expanded or con-tracted. At the present state of knowledge of international varia-tions in price level and price structure, the addition of anothercountry in such a comparison cannot be regarded simply as enlarg-ing the "sample" of countries.
The joint determination of indexes for a number of countriesoffers an additional advantage over the binary comparisons in pro-viding a systematic estimate of unexplained variation from therelationship assumed in the model. If, for some country, the abso-lute value (or the square) of the difference between p, the observedprice, and the product Cl of the country index and the item index islarge, the accuracy of the determination of the index for that coun-try is open to question.
The extension of this type of model to three or more factors defin-ing sources of variation, although clearly feasible in the operational
309
COMPARATIVE PURCHASING POWERsense, should not proceed before intensive examination of conceptsand definitions. Experience has shown that fruitful refinements ofconcepts in empirical studies progress, in general, only as basicdata are accumulated and analyzed. Calculation of country indexesfor groups of goods and services is an obvious extension of thisfactor analysis. The statistical designs of all price indexes and esti-mates of comparative purchasing power among communities recog-nize variations in prices associated with classes of commodities. Yetthe analytic advantages of a determination of indexes by the tradi-tional categories for different places or different dates have neverbeen convincingly displayed.
Sources of Price DifferencesIn the development of price comparisons, as in many other types
of statistics, the stratification that is efficient for statistical estima-tion tends to be presented and accepted as a classification intendedfor interpretive study. The classification of consumer goods andservices for consumer price indexes has followed a conventionestablished by the first International Statistical Congress a centuryago. The rough correspondence between the classification of com-modities and types of retail business has quite naturally favoredthe continuation of the conventional classification scheme—food,clothing, etc., and accumulation of longer and longer data seriesdoes not augur any significant change. Although the standardgrouping of goods and services roughly along functional lines maybe adequate for comparisons of consumer behavior in differentplaces or at different dates, its superiority for price analysis hasfrequently been questioned in recent years. The need for othergroupings has been indicated by such recombinations as "all dur-able goods" or "all personal services."
There is real danger that the deflating of national accounts willbe molded by the classification scheme now used to record con-sumption expenditures and capital outlays before the concepts un-derlying the procedures have been tested sufikiently. By influenc-ing the formal sampling design for an index or deflator, the classi-fication scheme could bias the whole process of measurement. Thefact that estimators must usually work with small samples of com-modities is at the very core of the problem of constructing an indexof relative purchasing power in two or more different situations.Furthermore, the properties of the universe to be represented by asample are, in a statistical sense, unknown. There will probably
310
COMPARATIVE PURCHASING POWERnever be a census of prices to use as a frame of reference in design-ing a sample for the measurement of differences in their generallevel. In the selection of a sample of commodities and services foran index, each item must represent a highly variable and ever-changing group, and the selection must be guided by generalknowledge of the market and of the economics of price behavior.
In the actual collection of price statistics, the chances of select-ing the most common, uniform, or standardized commodity to rep-resent a group are so great that the validity of the sample of goodsand services depends on the basic stratification. Long before theemergence of "sampling with probability proportionate to size"makers of index numbers began to select commodities ("blocks" or"primary sampling units" in the sampler'6 terminology) by meth-ods that favor those with greatest volume of sales. If the distribu-tion of sales within categories governs the selection, commoditiesof low relative importance within each category will scarcely everappear in the sample. Such commodities may be important in theaggregate across all categories and subject to wide price variationsfrom place to place or from time to time. In these circumstancesthe conventional index design is bound to yield biased estimates ofcomparative purchasing power, whatever formula or system ofweights is employed.
There are good reasons, a priori, for expecting the price level invarious countries to differ significantly among commodities andservices grouped according to the production process. Fourastieconcluded that in France one cannot avoid connecting technicalprogress with general price movements:Comment ne pas penser flu progrès technique pour expliquer l'éventail quise manifeste ainsi dans le mouvement général des prix. La baisse des prixdes texti[es débute avec la creation des premieres manufactures par Colbert;la baisse des épices est liée au progrès des voyages maritimes, au develop-pement des éstablissements d'outre-mer; la baisse des prix des métaux estliée aux progres dans l'extraction et le traitement des minerals. Le progrèstechnique agricole, non nul, mais très faible jusqu'en 1789, puisque la charruea Soc de fer n'était encoure pratiquement pas employee en France au mo-ment de Ia Revolution, s'est developpé sensiblement après 1810, tandis quel'exploitation du bois ne bénéficiait jusqu'à nos jours que de l'amélioration destransports.4
Gilbert and Kravis reached a similar conclusion that in Europeancountries the relatively high prices are associated with products
Jean Fourastie, Mach inisme et Bien-Etre, Paris, Editions de Minuit,1951.
311
COMPARATIVE PURCHASiNG POWERrequiring much capital and the relatively low prices with productsrequiring extensive labor
A classification by degree of industrialization of the productionprocess cuts across the conventional groupings used in price indexesand national accounts of consumer expenditures. A list of goodsand services selected to represent such a classification might differsubstantially from the samples chosen to represent the customarygroups. Unfortunately, the collections of price statistics now avail-able do not permit a definitive test of the influence of the classifica-tion scheme on the sampling operation. Nevertheless, more analysisof the distributions of prices or price ratios in current bodies ofdata could contribute greatly to an understanding of this problem.
A study of industrial prices in progress in the Bureau of LaborStatistics, the summary of the relation of quantity and price ratiosin the Gilbert and Kravis study, and results of an experiment bythe Royal Bank of Canada from a report in preparation, all suggestthat the distributions of price ratios are J-shaped. According to thetheory of sampling, the means of samples from such distributionsfollow the gamma function and are very skewed for small samples.Among samples of one distribution, from a universe with a givenvariance, two-thirds might underestimate the true mean; in samplesof two, the corresponding proportion is six-tenths. The form ofthese distributions might be altered radically with other schemesof classification and appropriate changes in the blocking that guidesthe sample selection for the index. A classification that would tendaway from combinations of shoes and ships and sealing wax with-in groups toward more uniformity of dimension in the groupingand blocking would be less vulnerable to the hazards of the smallsample.
One or two homely examples can illustrate the whole problem.The products sold in variety stores, hardware stores, drug stores,and their counterparts in other countries have the lowest aggregatesales, item by item, within the customary groupings for classifica-tion. Within such classes as household goods, clothing and house-hold textiles, health, and education, the commodities of this typedo not form blocks large enough to merit the selection of repre-sentatives for the purposes of an index. Yet in the aggregate thistype of product should have considerable influence on price com-parisons. The classification of foods offers a number of instructiveexamples of the operation of the grouping, blocking, and matching
5 Op.cit.
312

COMPARATIVE PURCHASING POWERprocess. In countries with dietary patterns that are fairly similarto the American, there appears to be a tendency to allocate the samefraction of the food dollar to two groups of foods: outlays on meats,poultry, and fish claim between 25 and 30 per cent, and expendi-tures on desserts and beverages around 10 or 12 per cent. Thestandard classification includes the meat grouping, but sweets andmany beverages are scattered through the cereal, dairy products,fruits, and sugar groups. Most price comparisons limit the repre-sentatives of this large group to the most uniform and standardizeditems. The varied foods from the bakeries and confectionaries,large and small, are seriously underrepresented in all price indexes.
In view of all the operational problems that are involved inmatching and grouping for measurement of comparative purchas-ing power, it is important to evaluate methods that are not sodependent on judgments of the investigators and that can neverbe challenged without independent replication of the whole study.
Equivalent Groups of Commodities and ServicesThe literature on price indexes is filled with arguments about
the weighting systems, but the controversial issues have centeredon the choice of weights considered representative of each situation,or of a simple combination of the situations in a comparison. Thefact that each situation could be represented by a whole battery ofweight diagrams describing the entire range of consumption pat-terns from poverty to riches has been considered by very few inves-tigators, and the fact that the average quantities or expendituresover this range within one situation are dependent on the incomedistribution has received practically no attention. The chief pur-pose of converting national accounts to real terms is to effect aseparation of the price level and the income level in comparisonsover time or over space. The need to compare significantly differenteconomic situations will eventually raise the question of a third fac-tor in the analysis—the income distribution.
Matching of groups of consumer goods and services for themeasurement of comparative purchasing power almost automaticallyinvolves consideration of the variations in consumption patternassociated with economic level. To match by groups of commoditiesrequires observation on more than one "market basket" in eachsituation, and the differences in market baskets that are correlatedwith economic resources are certainly susceptible of some kind ofequating. Engel, Wright, and more recently Frisch, Staehle, and
313
COMPARATIVE PURCHASING POWERWold have tried to establish comparisons of consumption by in-come level to yield information on the comparative cost of living.When Engel wrote and Wright extended his ideas, "Consumptionwas practically a predetermined, constant factor in the economicscheme—a simple process of grasping for whatever food, clothingand shelter could be produced and making them last as long aspossible. The process went on decade after decade without sub-stantial change. No wonder economists found little to say aboutit."6 Yet in comparing American communities with European,Wright, and after him the British Board of Trade, discoveredan inexplicable paradox in the simple equating of food and food,housing and housing, and fuel and fuel in different situations.
Engel, Wright, and the British Board of Trade tried to equatethrough the percentage of total expenditures spent on the primarynecessity, food. and Staehle's procedures attempt to matchthe physical volume of consumption at various economic levels intwo or more situations by price and quantity index methods. Thereis certainly merit in the notion of equating the same physical vol-ume of consumer goods and services in two or more situations togauge the relative cost of living, but the elaborate repricing of thewhole pattern of consumption required by both Frisch's and.Staehle's procedures severely limits the class of comparisons towhat Frisch called "structurally equal markets." Aside from all theconceptual problems, which are those of the price or quantity indexconventionally defined, the absence of data is the main obstacle tothe utilization of such procedures. As the diversity of productsmultiplies and their complexity increases, a complete record ofspecifications, quantities, and prices becomes less and less realisticfor family accounts as well as for national accounts.
Frisch, himself, was led by the absence of data required for priceor quantity indexes to an exploration of other methods for definingequivalent sets of consumer goods and services.
However, I could not get the problem off my mind, and struggling furtherwith it, a new idea gradually took form. Was it possible to determine thelacking price indexes from the budget data themselves? At first sight, theidea seems absurd, since the budget material only contains expenditure dataand no information about prices at all. On closer examination, however, theidea proved sound, both theoretically and in
6 William H. Lough, High-Level Consumption, McGraw-Hill, 1935, p. 1.Ragnar Frisch, New Methods of Measuring Marginal Utility, Tubingen,
J. Mohr, 1932, p. 6.314
COMPARATiVE PURCHASING POWERThe power of this concept has not been realized even after two
decades of accumulating observations that might permit its exami-nation and testing. Perhaps the reason that such ideas are lost liesin the confounding of problems of concept and of estimation thatall too easily dominates the empirical scientist. Frisch discusses theprocedure as follows:
We shall now consider the situation which arises when there are no dataavailable regarding the prices p and P. In this case the food quantity curvesare not known, but the food expenditure curves are. The purpose of thediscussion in the present Section is to show that the shapes of the givenfood expenditure curves contain information which makes it possible to drawconclusions regarding the prices p and P, and thus derive the data necessaryto determine the money utility curve. For reasons which will presently be-come obvious, this method will be called the translation method of measuringutility.8It shows that he was forced to devote his attention almost entirelyto the mechanics of the problem. In this study he did not considerthe comparison of situations differing with respect to real incomeor culturally determined preference patterns. Even a method heproposed does not avoid the need for identifying sets ofsituations that differ only with respect to relative prices. In orderto provide independent estimates of variations in purchasing power,procedures for matching bundles of goods and services must befree, in concept and in practice, from the need for imputing identityto particular commodities. Some characteristics of groups of com-modities and services not dependent on the properties of the specif-ic goods of which they are composed must be used to define equiv-alence in two or more situations. Frisch's methods and a proposalby Friedman'0 suggest that some quantity describing the progres-sion of consumption patterns in two settings can provide the basicmeasuring rod.
Equating by the degree to which basic needs are satisfied is reallya tautology at the core of most comparisons—of national income,national product, productive capacity, or consumption levels. Thesimilarities in consumption patterns by income level have led manyinvestigators, both before and after Engel, to the belief that theelimination of price and currency differences would produce even
8 Ibid., p. 42.° Ragnar Frisch, "Methods of Measuring the Relative Cost of Living,"
mimeographed, 1937.10 Milton Friedman, "A Method of Comparing Incomes of Families Dif-
fering in Composition," Studies in Income and Wealth, Volume—Fifteen,National Bureau of Economic Research, 1952.
315
COMPARATIVE PURChASING POWERmore similarity from place to place or from time to time in theconsumer's utilization of income. Lough and actually deflateby price indexes and exchange rates in the attempt to show uni-formity in the distributions of consumer expenditures arrayed alonga scale of real incomes.
The use of deflation assumes that correlations and comparisonsbetween deflated quantities are valid and relatively invariant, andthe practice is so widespread that this fundamental assumption hasseldom been questioned. Frisch's method of deriving the price ratiosthrough a procedure that results in a coincidence of the correlationsbetween expenditures and income is just the converse of deflating.If the conditions that permit deflating are satisfied, the same as-sumptions justify interpreting the difference between two regres-sions as due to variations in the price level. If the assumptions arewarranted, it is possible under certain circumstances to carry outan empirical determination of the price ratios.
The correlations or regressions are just a ranking of differentbills of consumer goods along a scale of income. They are differ-entiated by some quantity that measures the degree of change overthe range of incomes. Engel's law refers to one such quantity, thewell-known ratio of food expenditures to total expenditures by in-come level. The percentages spent on a particular category of con-sumption goods at successive income levels can obviously be uti-lized to define equivalence between two situations. Such a definitionstates simply that the fraction of income devoted to a particularpurpose establishes the identity between consumption levels in twoor more places or at two or more dates. In general, equating by theEngel ratio yields a single determination of the relative purchasingpower applicable both to the particular category of consumptionand to total expenditures or total income.
There have been numerous investigations of family living ex-penditures in the postwar period. 'While they are not strictly com-parable in population coverage and in the time span represented,they are so much more uniform in method than prewar studies thatanalysis of the comparisons can certainly contribute to our under-standing of the problem. For the purposes of this paper many detailsof comparability are ignored for the sake of vivid illustration. Illus-trative data for France, the United States, and India are describedin the last section.
11 Cohn Clark, The Conditions of Economic Progress, London, Macmillan,1951.
316
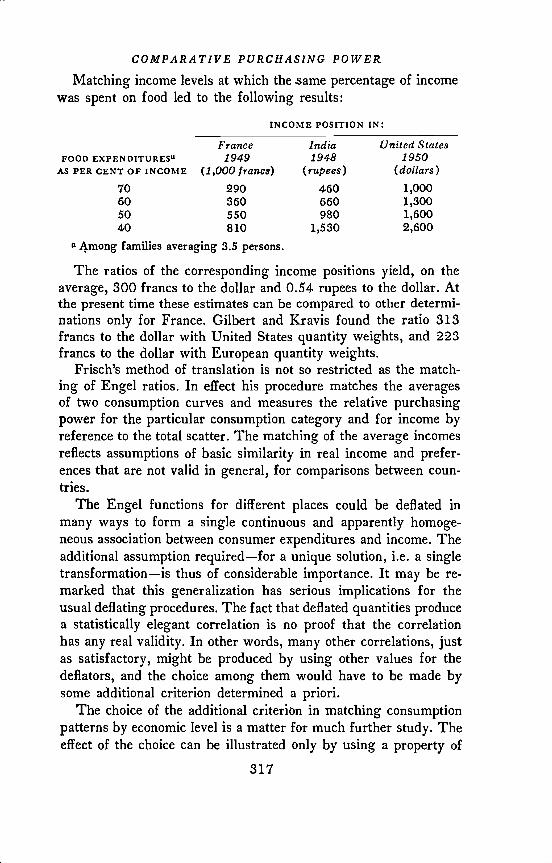
COMPARATIVE PURCHASING POWERMatching income levels at which the same percentage of income
was spent on food led to the following results:
INCOME POSITION IN:
France india United StatesFOOD EXpENDITURESa 1949 1948 1950
AS PER CENT OF INCOME (1,000 francs) (rupees) (dollars)70 290 460 1,00060 360 660 1,30050 550 980 1,60040 810 1,530 2,600
4mong families averaging 3.5 persons.
The ratios of the corresponding income positions yield, on theaverage, 300 francs to the dollar and 0.54 rupees to the dollar. Atthe present time these estimates can be compared to other determi-nations only for France. Gilbert and Kravis found the ratio 313francs to the dollar with United States quantity weights, and 223francs to the dollar with European quantity weights.
Frisch's method of translation is not so restricted as the match-ing of Engel ratios. In effect his procedure matches the averagesof two consumption curves and measures the relative purchasingpower for the particular consumption category and for income byreference to the total scatter. The matching of the average incomesreflects assumptions of basic similarity in real income and prefer-ences that are not valid in general, for comparisons between coun-tries.
The Engel functions for different places could be deflated inmany ways to form a single continuous and apparently homoge-neous association between consumer expenditures and income. Theadditional assumption required—for a unique solution, i.e. a singletransformation—is thus of considerable importance. It may be re-marked that this generalization has serious implications for theusual deflating procedures. The fact that deflated quantities producea statistically elegant correlation is no proof that the correlationhas any real validity. In other words, many other correlations, justas satisfactory, might be produced by using other values for thedeflators, and the choice among them would have to be made bysome additional criterion determined a priori.
The choice of the additional criterion in matching consumptionpatterns by economic level is a matter for much further study. Theeffect of the choice can be illustrated only by using a property of
317
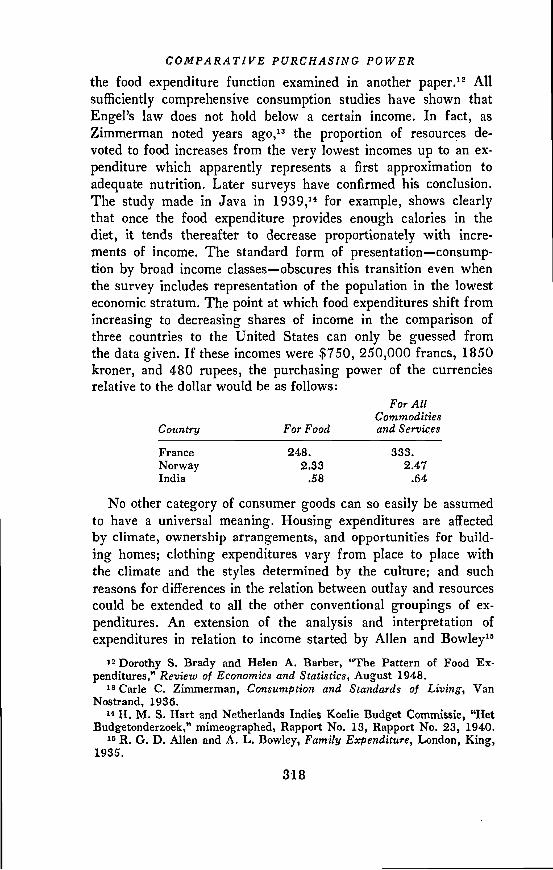
COMPARATIVE PURCHASING POWERthe food expenditure function examined in another paper.12 Allsufficiently comprehensive consumption studies have shown thatEngel's law does not hold below a certain income. In fact, asZimmerman noted years ago,'3 the proportion of resources de-voted to food increases from the very lowest incomes up to an ex-penditure which apparently represents a first approximation toadequate nutrition. Later surveys have confirmed his conclusion.The study made in Java in 1939,14 for example, shows clearlythat once the food expenditure provides enough calories in thediet, it tends thereafter to decrease proportionately with incre-ments of income. The standard form of presentation—consump-tion by broad income classes—obscures this transition even whenthe survey includes representation of the population in the lowesteconomic stratum. The point at which food expenditures shift fromincreasing to decreasing shares of income in the comparison ofthree countries to the United States can only be guessed fromthe data given. If these incomes were $750, 250,000 francs, 1850kroner, and 480 rupees, the purchasing power of the currenciesrelative to the dollar would be as follows:
For AllCommodities
Country For Food and Services
France 248. 333.Norway 2.33 2.47India .58 .64
No other category of consumer goods can so easily be assumedto have a universal meaning. Housing expenditures are affectedby climate, ownership arrangements, and opportunities for build-ing homes; clothing expenditures vary from place to place withthe climate and the styles determined by the culture; and suchreasons for differences in the relation between outlay and resourcescould be extended to all the other conventional groupings of ex-penditures. An extension of the analysis and interpretation ofexpenditures in relation to income started by Allen and Bowley'5
12 Dorothy S. Brady and Helen A. Barber, "The Pattern of Food Ex-penditures," Review of Economics and Statistics, August 1948.
13 Cane C. Zimmerman, Consumption and Standards of Living, VanNostrand, 1936.
H. M. S. Hart and Netherlands Indies Koelie Budget Commissie, "HetBudgetonderzoek," mimeographed, Rapport No. 13, Rapport No. 23, 1940.
R. G. D. Allen and A. L. Bowley, Family Expenditure, London, King,1935.
318

COMPARATIVE PURCHASiNG POWERwas used by Miss Snyder'6 to classify expenditures on specificgoods and services by the income elasticity to provide a basis forthe estimation of relative purchasing power in two dissimilarsituations.
If goods and services are classified according to whether theincome elasticity is no greater than one or exceeds one, the ap-portionment of expenditures between these two groups can be usedto estimate comparative purchasing power in different economicenvironments. This regrouping of expenditures can be carried outonly when the survey data for specific goods and services are tabu-lated and published. The data available permit an estimate of thisdivision of expenditures for two countries, Norway and the UnitedStates. The translation by the Engel ratio for all necessities ofthe expenditure curve for Norway to coincide with the curve forthe United States requires a conversion ratio between 2.00 and2.50 kroner to the dollar, a somewhat higher value than wouldresult from the matching of the Engel ratio for food.
Matching Population GroupsThe equating of groups of commodities and services by means
of consumption functions is basically a matching of populationgroups arrayed by some measure of economic resources, such asincome. In comparing communities that differ greatly in the dis-tribution of the population by income and occupation, only theextremes of poverty and wealth offer an equivalence that is easyto defend on logical grounds. Though the rich and the poor areto be found in all large communities, unfortunately there havebeen few representative surveys of the population with very lowincomes, and the data for the very well to do are virtually non-existent. It is possible to make a few comparisons of the ruralpoor but not of other low-income groups or of the very wealthyclasses. The equating of agricultural poverty is certainly appro-priate to a comparison of two countries by matching groups atcorresponding positions on the economic scale.
A recent study of lower castes in shows striking cor-respondence with the consumption pattern of sharecroppers in
16 "A Method of Measuring Comparable Living Costs in Communitieswith Differing Characteristics," prepared by Eleanor M. Snyder, mimeo-graphed, Bureau of Labor Statistics, October 1953.
17 Shiva Kumar Chaturvedi, "Family Budgets of Some Lower Castes inDistrict Farrukhabad," processed, University of Allahabad, 1949.
319
COMPARATIVE PURCHASING POWERGeorgi.a and Mississippi in If the surveys wereequally representative of populations at the lowest extreme of theeconomic scale, the conversion ratio could be estimated by match-ing the mean income and the food expenditure of the families withincomes near the mean. In this case such an equating leads toa conversion of 0.90 rupees to the dollar for food expenditures and0.94 rupees to the dollar for the total.
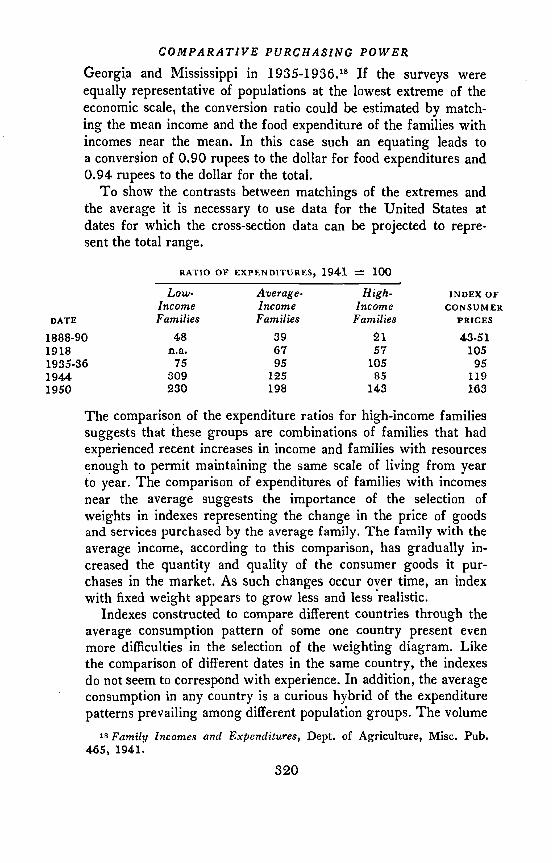
To show the contrasts between matchings of the extremes andthe average it is necessary to use data for the United States atdates for which the cross-section data can be projected to repre-sent the total range.
RATIO OF EXPENDITURES, 1941 100
Low- Aierage- High- INDEX OFincome income income CONSUMER
DATE Families Families Families PRICES
1888-90 48 39 21 43-51
1918 n.a. 67 57 1051935-36 75 95 105 95
1944 309 125 85 119
1950 230 198 143 163
The comparison of the expenditure ratios for high-income familiessuggests that these groups are combinations of families that hadexperienced retent increases in income and families with resourcesenough to permit maintaining the same scale of living from yearto year. The comparison of expenditures of families with incomesnear the average suggests the importance of the selection ofweights in indexes representing the change in the price of goodsand services purchased by the average family. The family with theaverage income, according to this comparison, has gradually in-creased the quantity and quality of the consumer goods it pur-chases in the market. As such changes occur oyer time, an indexwith fixed weight appears to grow less and less realistic.
Indexes constructed to compare different countries through theaverage consumption pattern of some one country present evenmore difficulties in the selection of the weighting diagram. Likethe comparison of different dates in the same country, the indexesdo not seem to correspond with experience. In addition, the averageconsumption in any country is a curious hybrid of the expenditurepatterns prevailing among different population groups. The volume
18 Family incomes and Expenditures, Dept. of Agriculture, Misc. Pub.
465, 1941.
320
COMPARATIVE PURCHASING POWERof particular goods and services included in the average is sig-nificantly influenced by the distribution of income, because expendi-tures on most goods and services follow a nonlinear relation toincome. The average consumption underweights the commoditiesfor which income elasticities are low and overweights those forwhich they are high. The more unequal the income distribution,the more weight is given to the goods and services purchased bythe upper-income groups. If the consumption of upper-incomegroups is more comparable from time to time, or from place toplace, as is suggested by the example above, this peculiarity of theaverage may be a definite advantage. The binary comparisons, suchas those made by Gilbert and Kravis, will not vary so widely withthe weighting diagram as when the weights follow the consumptionpattern of some more narrowly defined population group.
"Reality is not what is logical but what it suits our purpose totreat as real."bD The reality of indexes of purchasing power derivesfrom their successful use in cooperative agreements, and thereforemethods used in comparing the purchasing power of populationsliving at different times or in different places must be chosen withreference to the need they serve. The inferences drawn by Gilbertand Kravis can not all be justified by reference to indexes that putundue emphasis on the consumption pattern of the upper incomegroups. The practical needs for international comparison, accord-ing to Stone and Hansen,2° have reference to taxation schemes.This purpose differs essentially from the circumstances that ledto the compilation of consumer price indexes in most countries;the measurement of the cost of the same level of living for refer-ence in wage agreements. The deflated national income or productfor a single country may eventually be used to guide still othertypes of decision.
Appendix A. Distribution of Price RatiosPrices of comparable goods and services in two places exhibit
two types of correlation. The regressions may be fairly linear andcome close to the origin, or they may be nonlinear, like demandcurves. In either case there is a wide scatter which may be attrib-uted in part to errors in matching, identification, and the determina-
10 Frank H. Knight, The Ethics of Competition, Harper, 1935.20 Richard Stone and Kurt Hansen, "Inter-Country Comparisons of the
National Accounts," Income and Wealth, Cambridge, Eng., Bowes andBowes, Series III, 1953.
321
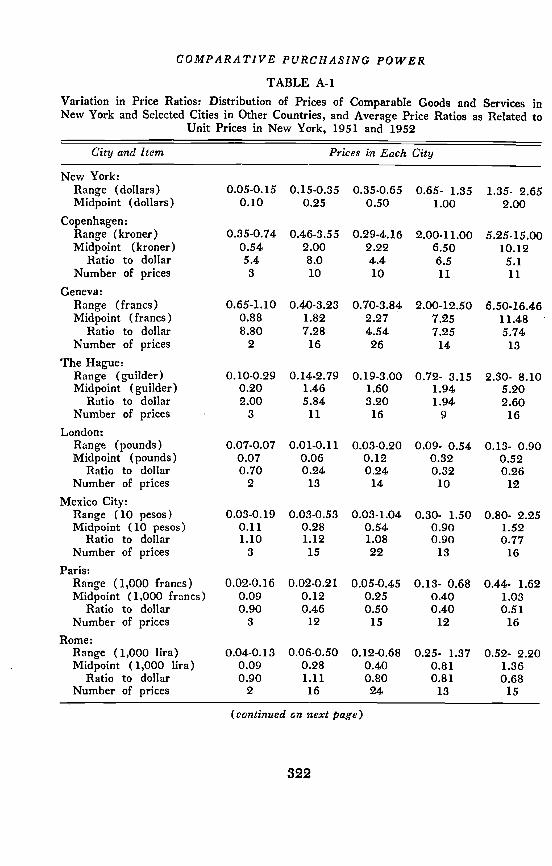
COMPARATIVE PURCHASiNG POWERTABLE A-i
Variation in Price Ratios: Distribution of Prices of Comparable Goods and Services inNew York and Selected Cities in Other Countries, and Average Price Ratios as Related to
Unit Prices in New York, 1951 and 1952
City and Item Prices in Each City
New York:Range (dollars) 0.05-0.15 0.15-0.35 0.35-0.65 0.65- 1.25 1.35- 2.65Midpoint (dollars) 0.10 0.25 0.50 1.00 2.00
Copenhagen:Range (kroner) 0.35-0.74 0.46-3.55 0.29-4.16 2.00-11.00 5.25-15.00Midpoint (kroner) 0.54 2.00 2.22 6.50 10.12
Ratio to dollar 5.4 8.0 4.4 6.5 5.].Number of prices 3 10 10 11 11
Geneva:Range (francs) 0.65-1.10 0.40-3.23 0.70-3.84 2.00-12.50 6.50-16.46Midpoint (francs) 0.88 1.82 2.27 7.25 11.48
Ratio to dollar 8.80 7.28 4.54 7.25 5.74Number of prices 2 16 26 14 13
The Hague:Range (guilder) 0.10-0.29 0.14-2.79 0.19-3.00 0.72- 3.15 2.30- 8.10Midpoint (guilder) 0.20 1.46 1.60 1.94 5.20
Ratio to dollar 2.00 5.84 3.20 1.94 2.60Number of prices 3 11 16 9 16
London:Range (pounds) 0.07-0.07 0.01-0.11 0.03.0.20 0.09- 0.54 0.13- 0.90Midpoint (pounds) 0.07 0.06 0.12 0.32 0.52
Ratio to dollar 0.70 0.24 0.24 0.32 0.26Number of prices 2 13 14 10 12
Mexico City:Range (10 pesos) 0.03-0.19 0.03-0.53 0.03-1.04 0.30- 1.50 0.80- 2.25Midpoint (10 pesos) 0.11 0.28 0.54 0.90 1.52
Ratio to dollar 1.10 1.12 1.08 0.90 0.77Number of prices 3 15 22 13 16
Paris:Range (1,000 francs) 0.02-0.16 0.02-0.21 0.05-0.45 0.13- 0.68 0.44- 1.62Midpoint (1,000 francs) 0.09 0.12 0.25 0.40 1.03
Ratio to dollar 0.90 0.46 0.50 0.40 0.51Number of prices 3 12 15 12 16
Rome:Range (1,000 lira) 0.04-0.13 0.06-0.50 0.12-0.68 0.25- 1.37 0.52- 2.20Midpoint (1,000 lira) 0.09 0.28 0.40 0.81 1.35
Ratio to dollar 0.90 1.11 0.80 0.81 0.58Number of prices 2 16 24 13 15
(continued on next page)
322
COMPARATIVE PURCHASING POWERTABLE A-i (continued)
City and Item Prices in Each City
New York:Range (dollars) 2.65- 7.35 7.35-12.65 12.65- 37.35 37.35- 62.65Midpoint (dollars) 5.00 10.00 25.00 50.00
Copenhagen:Range (kroner) 8.00-53.00 27.27-47.00 58.00-113.00 177.00-255.00Midpoint (kroner) 30.50 37.14 85.50 216.00
Ratio to dollar 6.1 3.7 3.4 4.3Number of prices 13 5 6 4
Geneva:Range (francs) 9.17-36.55 29.15-54.37 49.83-123.70 164.55-272.60Midpoint (francs) 22.86 41.76 86.76 218.58
Ratio to dollar 4.57 4.18 3.47 4.36Number of prices 12 5 7 6
The Hague:Range (guilder) 2.66-33.50 18.45-37.25 30.00- 67.40 105.00-160.42Midpoint (guilder) 18.08 27.85 48.70 132.71
Ratio to dollar 3.12 2.79 1.95 2.65Number of prices 13 5 7 4
London:Range (pounds) 0.23- 1.87 1.44- 2.17 2.76- 5.87 5.28- 15.16Midpoint (pounds) 1.05 1.80 4.32 10.22
Ratio to dollar 0.21 0.18 0.17 0.20Number of prices 11 5 6 5
Mexico City:Range (10 pesos) 0.48- 7.80 3.0340.70 11.64- 31.25 29.50- 56.67Midpoint (10 pesos) 4.14 6.87 21.44 43.08
Ratio to dollar 0.83 0.69 0.86 0.84Number of prices 12 5 7 5
Paris:Range (1,000 francs) 0.72- 4.53 2.86- 6.12 5.94- 17.66 15.55- 28.07Midpoint (1,000 francs) 2.62 4.49 11.80 21.81
Ratio to dollar 0.53 0.45 0.47 0.44Number of prices 13 5 7 4
Rome:Range (1,000 lira) 1.40- 4.57 2.92- 5.05 5.26- 14.33 18.32- 23.43Midpoint (1,000 lira) 2.99 3.98 9.80 20.87
Ratio to dollar 0.60 0.40 0.39 0.42Number of prices 13 5 7 6
323
COMPARATiVE PURCHASiNG POWERTABLE A-2
Price Correlations: Average Prices for Comparable Goods and Services in New York andRome, by Price Classes in the Two
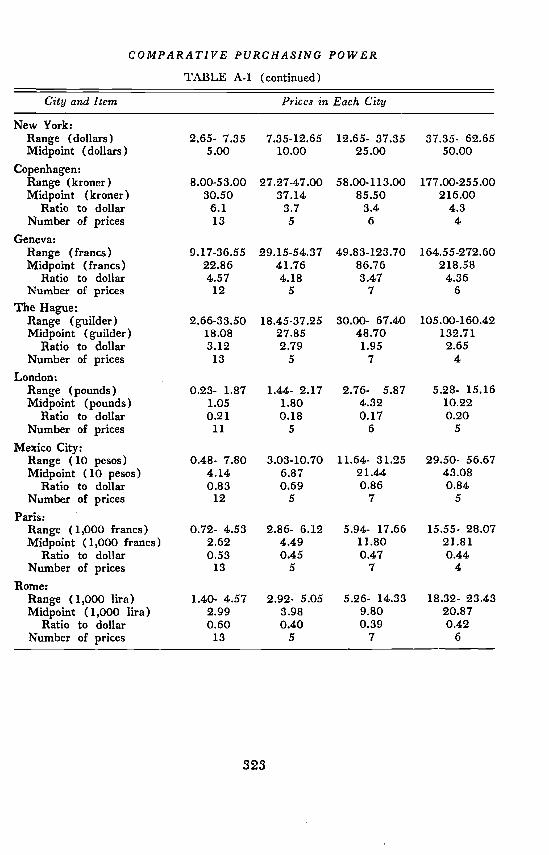
comparable commodities in severalof prices in New York whichas midpoints. The midpoints
Cities
compared to the midpoints in New York provide the basis forestimating average price ratios for commodities and services ar-rayed by price per unit.
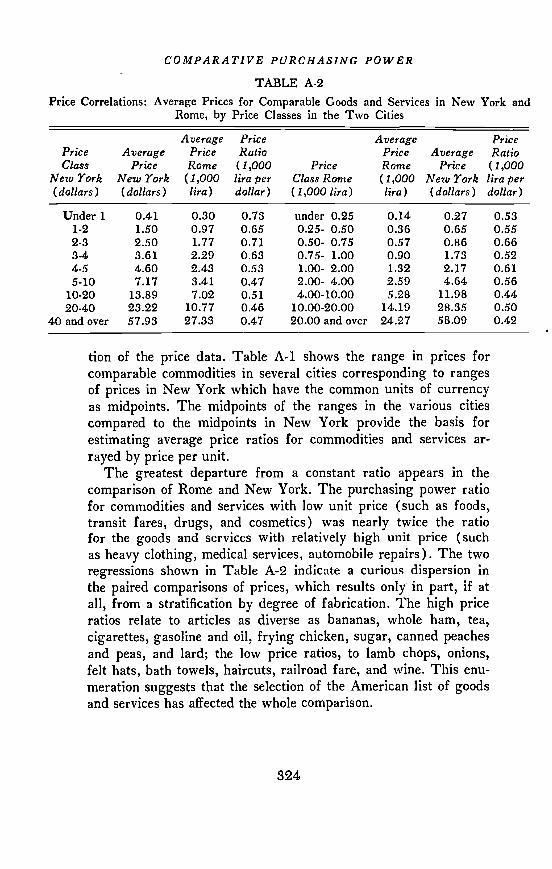
The greatest departure from a constant ratio appears in thecomparison of Rome and New York. The purchasing power ratiofor commodities and services with low unit price (such as foods,transit fares, drugs, and cosmetics) was nearly twice the ratiofor the goods and services with relatively high unit price (suchas heavy clothing, medical services, automobile repairs). The tworegressions shown in Table A-2 indicate a curious dispersion inthe paired comparisons of prices, which results only in part, if atall, from a stratification by degree of fabrication. The high priceratios relate to articles as diverse as bananas, whole ham, tea,cigarettes, gasoline and oil, frying chicken, sugar, canned peachesand peas, and lard; the low price ratios, to lamb chops, onions,felt hats, bath towels, haircuts, railroad fare, and wine. This enu-meration suggests that the selection of the American list of goodsand services has affected the whole comparison.
a
Average Price Average PricePrice Average Price Ratio Price Average RatioClass Price Rome (1,000 Price Rome Price (1,000
New York New York (1,000 lira per Class Rome (1,000 New York lira per(dollars) (dollars) lira) dollar) (1,000 lira) lira) (dollars) dollar)
Under 1 0.41 0.30 0.73 under 0.25 0.14 0.27 0.531-2 1.50 0.97 0.65 0.25- 0.50 0.36 0.65 0.552-3 2.50 1.77 0.71 0.50- 0.75 0.57 0.86 0.663-4 3.61 2.29 0.63 0.75- 1.00 0.90 1.73 0.524-5 4.60 2.43 0.53 1.00- 2.00 1.32 2.17 0.615-10 7.17 3.41 0.47 2.00- 4.00 2.59 4.64 0.56
10-20 13.89 7.02 0.51 4.00-10.00 5.28 11.98 0.4420-40 23.22 10.77 0.46 10.00-20.00 14.19 28.35 0.50
40 and over 57.93 27.33 0.47 20.00 and over 24.27 58.09 0.42
tion of the price data. Table A-i shows the range incities corresponding
have the commonof the ranges in
prices forto ranges
units of currencythe various cities
324
COMPARATIVE PURCHASING POWER
Appendix B. Note on International Price Comparisons'Jean Fourastie
Studies connected with productivity indicate the fundamentalimportance of this factor in relation to the purchasing power ofwages and the disparities in prices among nations.
For example, a pair of work shoes is worth about twenty-fivehours' wages of an unskilled laborer in Paris, while it is worthfour in the United States. On the other hand, a ticket to a neigh-borhood cinema, or a haircut by a barber, is worth about anhour's wages in both places. Thus a pair of work shoes is equalto more than twenty haircuts in France, while in the United Statesthe pair of shoes is worth no more than four haircuts.
Such disparities are obviously explained by the fact that laborproductivity in the ordinary shoe industry is about five times higherin the United States than in France, while it is about equal forbarbers.
At present we have few of the data on wages and usual pricesin different countries necessary to determine precisely and toillustrate these facts. For this reason, a questionnaire was sent to100 persons residing in foreign cities who, it seemed probable,would be willing to reply.
This extremely simple questionnaire deals only with very com-mon goods and services whose prices are easy to ascertain by directobservation. We attached a note briefly explaining the purposeof the inquiry, and, to indicate the precise quality of the goodslisted, a filled-out questionnaire for Paris (see below).
The replies we received made it possible to calculate for twenty-nine countries the prices in hours of work of the fourteen com-modities or services that appeared in the questionnaire. For threecountries where the standard of living is fairly low and labor ispaid by the day for a poorly defined length of time, it was pos-sible to calculate only in days of work.
The unit used to convert the commodity prices into their wageequivalents is the hourly or daily wage for unskilled male labor,augmented by the social charges paid by the employer in orderto take social benefits into account as far as possible.
The results of the inquiry were grouped in four tables:21 Translated by Ellen V. Seiler.2 Tables 1 and 2 are included in this Appendix.
325

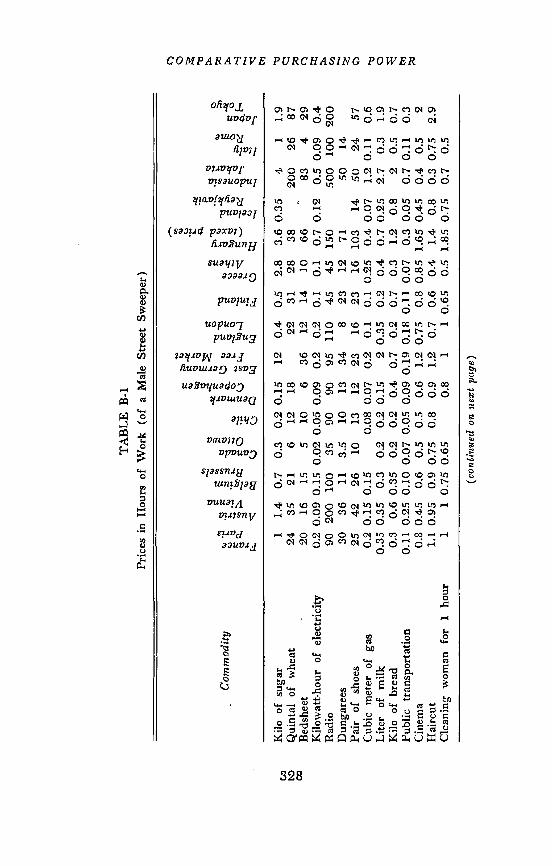
COMPARATiVE PURCHASING POWER1. The prices in hours of work of the fourteen commodities
or services for twenty-nine countries. (To this table wasappended a table of the excesses of the highest over thelowest prices (a) for all the countries together and (b) forthe twenty countries whose prices were nearest each other, inorder to eliminate the extreme cases.
2. A classification of the twenty-nine countries according tothe dearness of each of the commodities, with the least ex-pensive country ranked first.
3. The prices in days of work for the three countries wherelaborers are paid by the day.
4. The wages and the social charges in the national currenciesused to calculate wage equivalents of the prices.
The data we received were not entirely comparable, and noteshould be taken of the following points:
The prices of sugar, wheat, bread and milk often include taxes.Furthermore, e.g. in Japan, these commodities are some-times rationed. It was not possible to indicate precisely whichcountries practice taxation or rationing because the replies didnot always give the necessary information.
The price of a bedsheet means of a cotton sheet in Denmark,the United States, Hungary, New Zealand, and Sweden.
The price given for dungarees does not refer to the same articlein all the countries. Sometimes it refers to overalls, some-times simply to trousers.
The price for gas is for 1 cubic meter of piped gas except forSyria, where it is for a cubic meter of bottled gas.
The roughness of the figures used makes it impossible to drawprecise conclusions from the results. Nevertheless, an examinationof the first table brings out considerable variations in wage equiva-lents of prices. In fact, these equivalents vary progressively from1 to 5 for the services of a cleaning woman for an hour, whichis in itself surprising, to 1 to 80 for a kilogram of sugar.
These variations are very pronounced for industrial products,that is, economic products of technically advanced industries. Theyare smaller for services whose production techniques vary littlefrom country to country. Thus sugar is twenty times more expen-sive in Indonesia than in the United States, while a ticket to thecinema is virtually the same price.
328

COMPARATIVE PURCHASING POWERThe same differences in behavior between prices of industrial
products and prices of services are found when the countries areranked. Indonesia, for example, is one of the most expensive coun-tries for industrial and agricultural products and one of the cheap-est for the cinema and haircuts. On the other hand, the UnitedStates, which ranks low in price for commodities, occupies seven-teenth place for a haircut and only eighth for the cinema.
Prices in Francs of Fourteen Goods and Services, France,October 1950
Commodity Price ObservationsHour of unskilled masculine labor: Parisian region in September
Direct wage 80 1950Social charge 30
1101 kilo of sugar (retail) 105 Taxed price1 quintal of wheat 2,600 Price paid to farmers (taxed)1 sheet (single bed) 2,300 1.9 x 3 meters (good-quality)1 kilowatt-hour of electricity (light rate) 19.10 In Paris, full price (first pe-
riod)Radio for local stations (popular model) 10,000 2 wavelengths
5 tubesCloth dungarees (men's) 3,000 In ParisPair of work shoes (men's) 3,000 In Paris (leather-soled)1 cubic meter of gas (kitchen rate) 20 In Paris, full price (first pe-
riod)1 liter of milk (retail) 39 Taxed price in Paris1 kilo of bread (retail) 36 Taxed price in ParisPublic transportation (single fare) 15 Subway ticket, second classTicket to neighborhood cinema 90 Medium price in ParisHaircut (men's) 120 In Paris, including tip (medi-
um-quality barber)Services of cleaning woman for 1 hour:
Direct wage 80 In Paris in September 1950Social charge
327
TAB
LE B
-i
Com
mod
ity•
-.L
-0
fi0
— I0
Kilo
of s
ugar
11.
40.
70.
30.
2 0.
1512
0.4
0.5
2.8
3.6 0.35
41
1.9
Qui
ntal
of w
heat
Bed
shee
t24
3521
620
1615
512
1810
6
2236
12
3128
1410
3820
026
6683
487 29
Kilo
wat
t-hou
r of e
lect
ricity
0.2
0.09
0.1
5 0.
020.
05 0
.09
0.2
0.2
0.1
0.1
0.7
0.12
0.5
0.09
0.4
Rad
io90 200 100
35
90
90
95
110
45
45
150
500 100
200
Dungarees
30
36
11
3.5
10
13
34
823
12
71
50
14
Pair of shoes
25
42
26
10
13
12
23
16
23
16
103
14
50
24
57
Cubic meter of gas
0.2 0.15 0.15
0.08 0.07
0.2
0.1
0.1 0.25
0.4 0.07
1.2 0.11
0.6
Lite
r of m
ilk0.
35 0
.35
0.3
0.2
0.2
0.15
2 0.
350.
20.
40.
7 0.
252.
70.
31.
9K
ilo o
f bre
ad0.
30.
6 0.
350.
20.
20.
40.
70.
20.
70.
31.
20.
82
0.5
0.7
Publ
ic tr
ansp
orta
tion
0.11
0.2
5 0.
10 0
.07
0.05
0.0
90.
19 0
.18
0.11
0.0
70.
3 0.
050.
7 0.
110.
3C
inem
a0.
8 0.
450.
60.
50.
50.
61.
2 0.
750.
8 0.
851.
65 0
.45
0.4
0.5
2H
airc
ut1.
1 0.
950.
9 0.
750.
80.
91.
20.
70.
60.
41.
40.
80.
3 0.
752.
9C
lean
ing
wom
an fo
r1
hour
11
0.75
0.6
50.
81
10.
650.
51.
85 0
.75
0.7
0.5
Pric
es in
Hou
rs o
f Wor
k (o
f a M
ale
Stre
et S
wee
per)
0 0
(contliuted on next page)

c-,J 0 C') I.- C) 0
TAB
LE B
-i(c
ontin
ued)
Com
mod
ity
'.J L) o
0
0
Kilo
of s
ugar
0.5
0.65
0.3
0.7
1.45
2.85
0.35
0.4
22
4.75
0.2
0.5
1.2
Qui
ntal
of w
heat
1921
575
127
1124
5035
698
1932
Bed
shee
t15
117
1330
5610
1525
3064
55
10K
ilow
att-h
our o
f ele
ctric
ity0.
20.
20.
040.
10.
60.
40.
04 0
.15
0.3
0.2
0.7
0.04
0.2
0.35
Rad
io13
085
100
125
500
380
7070
375
260
330
2010
075
Dun
gare
es12
712
4525
5610
1542
4353
424
14Pa
ir of
shoe
s20
2513
2750
4811
1850
4680
412
16C
ubic
met
er o
f gas
0.05
0.15
0.11
0.45
0.3
0.05
0.1
50.
20.
40.
070.
30.
2Li
ter o
f milk
0.2
0.2
0.15
0.9
0.9
1.1
0.15
0.2
0.8
0.5
2.1
0.2
0.2
0.4
Kilo
of b
read
0.3
0.3
0.3
1.3
1.4
1.6
0.4
0.3
0.7
0.7
0.9
0.25
0.4
0.65
Publ
ic tr
ansp
orta
tion
0.12
0.25
0.07
0.2
0.12
0.16
0.10
0.1
10.
130.
10.
50.
090.
10.
3C
inem
a0.
80.
450.
61.
52.
11.
60.
9 0.
651.
70.
752.
60.
61
1H
airc
ut0.
70.
850.
51.
81.
71.
30.
91
1.7
1.2
31
10.
8C
lean
ing
wom
an fo
r1
hour
i0.
91.
20.
450.
60.
60.
80.
70.
80.
61.
70.
82
0.8

TAB
LE B
-2C
lass
ifica
tion
of th
e C
ount
ries A
ccor
d ing
to th
e D
earn
ess
of th
e C
omm
oditi
es a
ndSe
rvic
esa
Cle
anin
gK
ilow
att-
Cub
icPu
blic
Wom
anK
ilo o
f Qui
ntal
of
Bed
-ho
ur o
fD
un-
Pair
Met
erLi
ter
Kilo
of
Tran
s-fo
rC
ount
rySu
gar
Whe
atsh
eet
Elec
trici
ty R
adio
gare
esof
Sho
esof
Gas
of M
ilkB
read
porta
tion
Cin
ema
Hai
rcut
1 H
our
Fran
ce16
1219
159
1820
1515
512
15
20
19
Austria
1918
186
2120
2112
1516
232
1619
Bel
gium
14
915
13
13
718
12
13
11
88
13
11
Canada
42
21
21
24
13
57
7C
hile
25
75
911
6.
64
11
59
Den
mar
k1
65
69
54
31
12
68
13
13
East Germany
29
24
15
12
19
14
15
27
18
21
22
2119
England
811
12
15
18
49
715
120
13
519
Finland
10
16
14
93
15
14
74
18
12
15
47
Greece
24
15
79
38
919
18.
24
318
22
Hungary
26
20
27
28
20
27
29
22
21
26
25
25
24
26
Iceland
612
83
12
15
12
911
Indonesia
27
26
28
26
27
24
25
26
28
29
29
11
9Italy
16
14
16
13
12
16
10
13
18
12
57
2Japan
20
24
21
24
21
27
25
26
525
27
28
Low Countries
12
715
15
13
813
14
516
15
519
Luxembourg
13
911
15
83
17
12
45
232
12
18
New Zealand
41
62
13
86
10
15
38
324
Phifippines
14
13
919
23
19
23
25
22
23
27
1Portugal
20
23
22
27
27
17
24
24
23
27
16
28
25
4Spain
25
25
25
24
26
26
23
20
25
.28
19
24
23
4Sweden
64
72
56
31
112
819
13
13
Switzerland
812
15
13
514
12
74
512
1217
9Syria
22
21
20
22
25
21
25
22
18
18
26
25
13
Trieste
22
18
22
15
23
22
22
15
20
18
813
21
4Turkey
28
22
26
28
24
25
28
22
27
23
28
29
29
25
United States
23
22
12
13
44
68
17
13
Uruguay
107
215
13
16
420
412
820
17
27
West
Ger
man
y18
177
237
129
1518
1725
209
13a
Leas
t exp
ensi
ve c
ount
ry ra
nked
firs
t.

COMPARATIVE PURCHASING POWER
Appendix C. Transformation of Consumption FunctionsIf expenditures in relation to income can be represented by a
logarithmic line and if the slope of this line is the same in twoplaces, the consumption functions may be expressed as follows:
(1) y1_—K1x1a
(2) y2_—K2x2a
where y, and y2 = expenditures on a particular group of goodsand services
x1 and x2 = incomeparameter a = income elasticity
K1 and K2 = measure of the level of curves
If the purchasing power of money in the second place relative tothe first place is p for the commodity group and P for all commodi-ties and services, the ratio of K2 to K is equal to the ratio of patoP.
If p and P are equal, the ratio of K2 to K is pa_i. If the meas-ures of comparative purchasing power are not equal, an additionalcondition is required to determine the separate values.
The data in Tables C-i, C-2, and C-S were used to determinethe purchasing power ratios described on pages 317 and 318. Inthe case of food expenditures, the income elasticity 0.5 char-acteristic of American communities was accepted for other coun-tries. The values of the parameter K were as follows:
Level K of Food ExpendituresUnited States, 1950 (dollars) 21.4Norway, 1948 (kroner) 30.4France, 1952 (1,000 francs) 0.5India, 1944 (rupees) 15.7Georgia-Mississippi sharecroppers, 1935-1936
(dollars) 13.5Lower castes in Farrukhabad, 1949 (rupees) 12.5
The comparison of purchasing power through matching thegroups with the same relative expenditure on food was madegraphically.
331

COMPARATIVE PURCHASING POWERTABLE C-i
Income and Expenditures of Non-Farm Families, United States 1950, Norway 1948,France 1952, and India 1944
AVERAGE EXPENDITURES
Food
AdjustedIN COME AVERAGE to Average
CLASS INCOME Actual Family of 3.5 Housing Clothing All Other
United Statesa (dollars)2,000- 3,000 2,553 951 1,040 457 280 1,013
3,000- 4,000 3,537 1,181 1,217 563 400 1,426
4,000- 5,000 4,630 1,396 1,410 644 545 1,8415,000- 6,000 5,595 1,602 1,587 740 668 2,347
6,000- 7,500 6,671 1,838 1,789 834 785 2,6727,500-10,000 8,320 2,142 2,103 994 999 2,974
Norwalib (kroner)Under 1,800C 4,462 1,661 1,661 447 470 1,2311,800- 2,529 7,041 2,765 2,765 783 981 2,4062,530- 3,559 8,271 2,925 2,925 883 1,193 3,2113,650- 4,999 9,934 3,134 3,134 1,019 1,531 4,502
Franced (1,000 francs)200- 300 265 176 216 24 29 75300- 400 330 145 170 86 36 67400- 500 425 250 235 107 51 84500- 600 551 282 279 54 78 83600- 700 627 289 277 103 76 9].700- 800 731 352 343 74 113 116800- 900 841 341 319 103 103 114900- 1,000 943 382 366 105 105 93
Indiae (rupees)360- 480 408 295 310 85 56 54480- 600 530 329 341 94 58 59600-. 720 646 396 396 102 66 74720- 840 756 425 412 106 65 94840- 960 887 484 463 114 77 95
960- 1,080 1,007 547 494 136 77 132
1,080- 1,200 1,118 608 560 131 77 155
"Preliminary tabulations of Consumer Expenditure Survey, Bureau of Labor Statistics,1950.
b "Husholdningsregnskaper, mai 1947-april 1948," Norges Offisielle Statistikk, XI.23,Oslo, 1950.
Income per consumption unit.d "Enquête sur les budgets familiaux par carnets de comptes annuels a Marseilles (octobre
1951-septembre 1952)," Bulletin de l'institut National d'Hygiene, Vol. 9, No. 2, April-June 1954.
S. R. Deshpancle, Report on an Enquiry into Family Budgets of industrial Workers inDelhi City, Government of India, Dept. of Labour.
332

COMPARATIVE PURCHASiNG POWERTABLE C-2
Income and Expenditures of Low-Income Rural Families, United States 1935-1936 andIndia 1948
AVERAGE EXPENDITURESFood
AllStandardizedINCOME CLASS AVERAGE INCOME Actual for Family Size Housing Other
United Statesa (dollars)Under 250 186 129 129 7 64250- 500 354 245 241 9 88500- 750 572 376 364 13 143750-1,000 812 519 468 18 218
Under 200
Indiab (rupees)176 134 158 6 8
200- 300 257 189 192 9 20300- 400 354 273 245 12 23400- 500 448 317 272 12 17500- 600 553 362 306 12 39600- 700 646 446 356 18 51
700 and over 868 451 320 42 67
a Family Incomes and Expenditures, Dept. of Agriculture, Misc. Pub. 465, 1941, Tables33, 35, and 37.
b Shiva Kumar Chaturvedi, "Family Budgets of Some Lower Castes in District Far-rukhabad," Dissertation, University of Allahabad, 1949.
TABLE C-3Income and Necessary Expenditures, United States 1950 and Norway 1948
INCOME CLASS
EXPENDITURES ON NECESSITIES
AVERAGE INCOME Actual Ratio to income
United Statesa (dollars)2,000- 3,000
3,000- 4,0004,000- 5,0005,000- 6,000
7,5007,500-10,000
2,553 1,800
3,537 2,1864,630 2,4215,595 2,4676,671 2,3358,320 2,038
Norwayb (kroner)
70.5
61.8
52.3
44.135.024.5
Under 1,800c1,800- 2,5292,530- 3,5593,560- 4,999
4,462 2,9047,041 4,4978,271 4,7729,934 4,993
65.163.957.750.3
a Estimated from a preliminary tabulation of Consumer Expenditure Sur-vey, Bureau of Labor Statistics, 1950.
b Estimated from data on expenditures of four-person families published in"Husholclningsregnskaper, mai 1947-april 1948," Norges Offisielle Statistikk,XI.23, Oslo, 1950.
C Income per consumption unit.
333

COMPARATIVE PURCHASING POWER
Appendix D. Joint Determination of "World" Price andCountry indexes
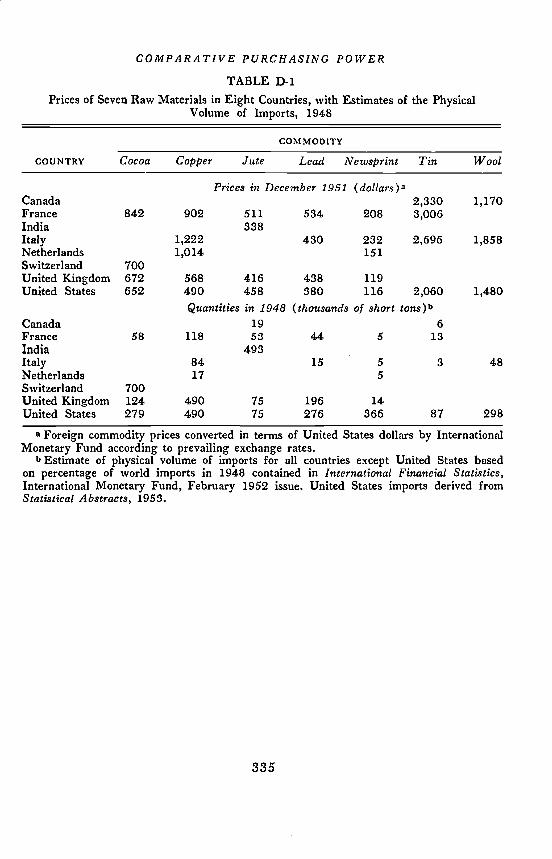
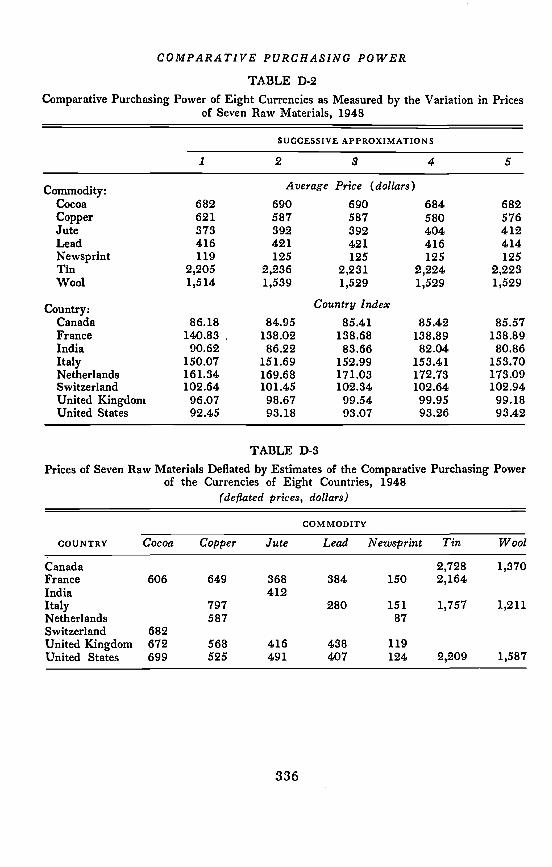
The prices of raw materials in international markets offer aninteresting illustration of the measurement of comparative pur-chasing power of different national currencies. Table D-1 presentsdata on prices and quantities and Table D-2 shows the results ofsuccessive approximations in the fitting of the function p. = JCto the prices.
Deflating the prices in Table D-1 by the country indexes, thefifth approximation, as shown in Table D-3, reduces the dispersionof prices for five of the seven commodities as follows:
Commodity Range of Prices Range of Deflated PricesCocoa $190 $ 93Copper 732 272Jute 273 123Lead 154 158Newsprint 116 64
Tin 946 971Wool 688 376
In general, the variation in the commodity prices, converted toUnited States dollars by exchange rates, is explained quite wellby the country indexes. The relative differences between the "ob-served" and the "estimated" prices shown below for France aregenerally under 15 per cent.
World Price MultipliedCommodity Price in France by Index for FranceCocoa $ 842 $ 948Copper 902 801Jute 511 573Lead 534 575Newsprint 208 174
Tin 3,006 3,090
334
COMPARATiVE PURCHASiNG POWERTABLE D-1
Prices of Seven Raw Materials in Eight Countries, with Estimates of the PhysicalVolume of Imports, 1948
COUNTRY
OD ITY
Cocoa Copper Jute Lead Newsprint Tin Wool
Prices in December 1951 (dollars)aCanada 2,330 1,170France 842 902 511 534 208 3,006India 338italy 1,222 430 232 2,696 1,858Netherlands 1,014 151Switzerland 700United Kingdom 672 568 416 438 119United States 652 490 458 380 116 2,060
Quantities in 1948 (thousands of short1,480
Canada 19 6
France 58 118 53 44 5 13India 493
84 15 5 3Italy 48Netherlands 17 5Switzerland 700United Kingdom 124 490 75 196 14United States 279 490 75 276 366 87 298
a Foreign commodity prices converted in terms of United States dollars by InternationalMonetary Fund according to prevailing exchange rates.
b Estimate of physical volume of imports for all countries except United States basedon percentage of world imports in 1948 contained in International Financial Statistics,International Monetary Fund, February 1952 issue. United States imports derived fromStatistical Abstracts, 1953.
335
COMPARATIVE PURCHASiNG POWERTABLE D-2
Comparative Purchasing Power of Eight Currencies as Measured by the Variation in Pricesof Seven Raw Materials, 1948
SUCCESSIVE APPROXIMATIONS
1 2 3 4 5
Commodity: Average Price (dollars)Cocoa 682 690 690 684 682Copper 621 587 587 580 576Jute 373 392 392 404 412Lead 416 421 421 416 414Newsprint 119 125 125 125 125Tin 2,205 2,236 2,231 2,224 2,223Wool 1,514 1,539 1,529 1,529 1,529
Country: Country IndexCanada 86.18 84.95 85.41 85.42 85.57France 140.83 138.02 138.68 138.89 138.89India 90.62 86.22 83.66 82.04 80.86Italy 150.07 151.69 152.99 153.41 153.70Netherlands 161.34 169.68 171.03 172.73 173.09Switzerland 102.64 101.45 102.34 102.64 102.94United Kingdom 96.07 98.67 99.54 99.95 99.18United States 92.45 93.18 93.07 93.26 93.42
TABLE D-3Prices of Seven Raw Materials Deflated by Estimates of the Comparative Purchasing Power
of the Currencies of Eight Countries, 1948(deflated prices, dollars)
COMMODITY
COUNTRY Cocoa Copper Jute Lead Newsprint Tin Wool
Canada 2,728 1,370
France 606 649 368 384 150 2,164
India 412Italy 797 280 151 1,757 1,211
Netherlands 587 87Switzerland 682United Kingdom 672 568 416 438 119United States 699 525 491 407 124 2,209 1,587
336
COMPARATiVE PURCHASiNG POWER
COMMENTDONALD C. MACGREGOR, University of Toronto
At the outset it is well to recognize the limitations within whichDr. Brady and Dr. Hurwitz have worked. In conformity withtheir title, they have confined themselves to the design of con-sumers' price indexes and to certain problems in converting fromone national currency and another. They do not deal directly withanything so broad or tendentious as comparisons of standards ofliving nor with establishing or comparing any of the variousminima for nutrition, health, or decency. In seeking better com-parisons of purchasing power, the authors imply, however, thatsome comparisons at least are admissible. To most readers thisis probably a satisfactory position, but it stops just short of dis-tinguishing those comparisons which can be accepted from thosewhich cannot. For this we may be grateful, since there is enoughto occupy us within the terms assigned, but important problems inwhat might be called the logic of comparison still call for attentionespecially in defining the inadmissible.
The paper deals mainly with a number of efforts to break awayfrom what may be called the standard basket method of weightingretail price indexes. With a view to securing more reliable com-parisons between one time and another, and one country or regionand another, the difficulties and errors in matching (i.e. of choos-ing comparable items and weights) are first presented. From thenumber of authors cited, it is clear that the problem has attractedwide and at times distinguished attention in recent years. 'Whethersignificant results have yet been achieved is the main question sug-gested by the paper, and the answer seems to be in doubt.
The standard basket method has the merit of being simple, andif the basket or bill of goods is sufficiently representative, it mayalso be impersonal, but to devise a single basket which yieldswholly satisfactory comparisons between countries is almost im-possible. Thus an urban basket representative of Abyssinia wouldmake nonsense in New York State, while even for nearby countriessuch as France and England, the United States and Canada, oradjacent provinces such as Ontario and Quebec, differences inweights and possibly in components are necessary. Again, his-torical comparisons within one country even between years asclose as 1925 and 1950 call for similar differences if bias is to beavoided.
337

COMPARATIVE PURCHASING POWERThe authors hold that the standard basket method has survived
in the retail field, notwithstanding these defects, mainly on thestrength of its previous record in the simpler field of wholesaleprices. In the latter field, where the method has been used withsuccess for almost a century, it has served mainly to portraychanges in the value of money, over rather short periods and withinindividual countries, when spent on standard commodities in whole-sale markets. This is one of a number of valuable historical insightspresented in the paper.
In the more complex field of retail prices, index numbers areoften used for more specific purposes than hitherto, as in labordisputes or for international or long-term historical comparisons.For these purposes the authors hold that the standard basket is sounreliable that it should be abandoned. In place of formal identitythey would substitute what might be called realistic equivalence.
The paper should, I believe, recognize more clearly the extentto which a method of equivalence has in fact been introduced inthe course of successive revisions, for today's American basketprobably differs as much from the American basket of 1900 asfrom that in use today in some European or South American coun-tries. In revising the United States index many small mistakes havedoubtless been made in choosing and weighting the modern coun-terparts of earlier articles of consumption. The mistakes need notall be in the same direction, however, and I would put more faithin the self-compensating character of random errors than the au-thors seem willing to do. Systematic error, in the form of anupward bias arising from inappropriate weights, is another matter,but I take it that it can be kept within bounds by successive re-visions. For simultaneous international comparisons, however, thesystematic error cannot be allowed for in this way and is a majorproblem to which we will return.
As the discussion of errors in matching proceeds, the authorsassume more familiarity with their specialized language than mostreaders are likely to possess, and this in a field where not muchjargon is necessary. It is not customary to remark on stylistic limita-tions of this kind, but I feel constrained to do so because a need-lessly cryptic and technical style, though it may save words, maywaste a good deal of the reader's time. Both the problem and thestudies brought under review are important enough to merit some-thing more lucid than "federal prose."
On the choice of items for an index, the authors believe that338
COMPARATiVE PURCHASiNG POWERfailure to select comparable products often arises from neglect ofthe less tangible factors, especially when complex durable productsare involved. All the variables implied in the term "product varia-tion" should be held constant, such as merchandising services, theterms of sale, and arrangements for upkeep, but in practice this is acounsel of perfection even in revision of the components for asingle country.
If, instead, the most nearly comparable items are not evensuperficially similar (e.g. northern vs. Arabian clothing), the dif-ficulties reach another level no matter how precise the description.Here the authors' proposed method of equivalent groups, as op-posed to identical or closely comparable items and weights, offersdistinct advantages.
The authors go on to show that an important qualification (onemight almost say a paradox) then arises in the following circum-stance: if the price elasticity of demand for the whole of a selectedgroup of items is unity, the choice of suitable weights for the in-dividual components of such a group turns out to be of almost noimportance. A simple algebraic proof shows that when there is unitelasticity of demand for the group of q's, the Laspeyre index,
which is that commonly employed, reduces to
which is a simple or unweighted average of price ratios.This is a nice demonstration, new to me, of why in certain cases
weighting schemes have so little influence on the level of priceindexes. The argument might also prove useful if it could be shownto be equally valid when inverted; thus if differences in weightingschemes prove to have an appreciable effect on the indexes, it mightbe inferred that the price elasticity of demand for the group de-parts considerably from unity. In fields where the data are insuf-ficient for a direct attack on price elasticity of demand, this methoddeserves attention.
The next section, on explanatory models, illustrates the dif-ficulty of reviewing what is essentially an office document whenneither the materials under discussion (in the form of a number
339
COMPARATIVE PURCHASING POWERof tables and manipulations) nor the papers which discuss themare before the reviewer or his audience. The paper argues thatspatial comparisons impose fewer restrictions on the mathematicalinvestigator than historical or temporal ones. It envisages the con-struction, for international comparisons, of estimating equationswhose performance can presumably be tested. But tested against,what? Against individual observed prices only, it seems. Theproblem of constructing a representative index for a number ofitems seems to stand where it was, except that something may belearned about the appropriate rates for converting currencies bystudying the performance of estimating equations from differentcountries. As James Tobin is familiar with work in this field, I willleave the matter to him and limit myself to the naive observationthat the mechanical procedure outlined in the example (for theUnited States, United Kingdom and Denmark), despite the ad-vantage of flexibility as to components, seems on the surface to beinfluenced too much by the initial assumption as to exchange rates,which is the hardest thing to establish.
The next section, on "sources of price differences" (p. 310),might well be entitled "defects of prevailing practice: a note oncoverage and classification." It is argued that the compilers of priceindexes, by recording especially the items with a large turnover(as a short-cut to representing a large proportion of business)have not given sufficient attention to price changes in the greatmiscellany of minor products. It should be possible to establishthe truth of the assertion quantitatively and the matter appeals tome as deserving study. Evidence may be quoted from recent fiscalhistory to show the importance of items once considered trivialwhich now receive the attentions of the exciseman, items such ascameras, fountain pens, cigarette lighters and a host of otherarticles. How to make a scientific sample of this ill-defined, miscel-laneous universe I do not know. Large and unpredictable samplingerrors might be expected, but I am attracted by the possibility ofan experiment in random sampling, partly because sampling is lesslikely to solidify into routine prematurely.
This brings us to the authors' remark that there will probablynever be a census of prices. Amen, and God forbid. But I am pre-pared to say something on the other side, and argue the case forbroader and more intensive surveys of prices than presently availa-ble ones, especially if the results can be published at length. Suchsurveys would in the long run prove more useful than much of
340
COMPARATIVE PURCHASING POWERthe routine work on weekly and monthly indexes now being done.Here one may cite the continuing value of the large inquiries con-ducted before the war of 1914, not only in the United States butby the British Board of Trade and by the Board of Inquiry intothe Cost of Living in Canada (1915).
Next, I can appreciate the authors' fear that a too rigid system ofdeflators will hamper revision of the national accounts in view ofthe inertia of large organizations with heavy commitments andlimited staff. The present heavy demands on deflators seem quiteout of proportion to their reliability, while the resulting series,purporting to be in constant dollars, are put to more important usethan ever before.
Equhaient Groups. This section refers to comparisons betweensamples of family expenditure data. Employing a method whichmight be described as mathematical behaviourism, equivalence isinferred between groups of data which display similarity in purelymathematical terms. The simplest criterion of equivalence is equal-ity of one or more of Ernst Engel's ratios of spending to income.Consider two buyers whose preferences and incomes differ, butwhose weekly food baskets absorb the same proportion of theirincomes. Such an equality in the food-income ratio may or may notindicate equivalence in other respects. If we study two samples ofAmerican families which display the same food-income ratio, onesample drawn in 1919 and the other in 1950, it will probably befound that the two groups differ considerably as to their hours oflabor and manner of life, and the same might be said of a simul-taneous comparison between buyers in the United States and somepoorer country.
If such differences be ignored, a common food-income ratiomight justify the statement that the budget of a skilled carpenter'sfamily in Chicago bears a marked similarity to that of (say) adoctor's family in Brussels. This does not carry us all the way,however, for to reach a more meaningful comparison we still haveto deal with the spread between the Brussels doctor and theBrussels carpenter, and this may be harder.
In the newer samples of family expenditure, which span abroader range of income and hence yield rough functional rela-tions between spending and income, the study moves from the do-main of arithmetic to that of calculus. More criteria of equivalencemay now be sought, such as similarity in the values of the firstor higher derivatives, in elasticity of the functions, in points of in-
341
COMPARATIVE PURCHASING POWERflection, in zero values of certain components of outlay, e.g. saving,and in certain maxima or minima.
Although these similarities may be discovered by routine meth-ods, they are not easy to interpret. One may isolate wage earnersand farmers whose savings have an average value of zero, in thebelief that the associated levels of income are somehow equivalent,and from this it might be concluded that x dollars of income on afarm equal x plus m dollars in a town. Enough was known aboutsaving habits in farm and city a generation ago, however, to showthat this form of analytical equivalence may not correspond tomeaningful economic equivalence.' The fact that farmers com-mence saving at a lower level of money income than an urban pop-ulation is not a short cut to equating levels of living but rather anindication of deep-seated differences in the conditions of earning anincome. In short, resorting to a sort of naive mathematical behav-iourism may prove of limited value. Not one but a number of as-pects should be the same or nearly so if equivalence is to be estab-lished, and the family budget may not yield all the informationrequired. Put in the broadest terms, it seems to be a good principlethat reliable conclusions on the equivalence of complex situationscannot safely be drawn from equality of one or two variables orrelationships.
I regret that I am unable to give proper weight to the contribu-tions of Frisch, which have not been available to me except as theyare mentioned in Henry Schultz's survey.2 It appears that Frisch'scriteria of equivalence are more complex and exacting than others,anticipating the criticism of the preceding paragraph.
The concluding paragraphs on the character of modern Engel'scurves for food will attract wide interest. "Engel's law does nothold below a certain income." "The proportion of resources de-voted to food increases . . . up to an expenditure which appar-ently represents a first approximation to adequate nutrition." Rec-ognition of such a point, which is the point of inflection, is inmarked contrast to the generalization of Allen and Bowley, in theirvolume on Family Expenditure, that the relation was linear. An im-portant application of the point of inflection was developed by Dr.Brady in 1948, for placing successive American budget studies ona comparable Another application, about which she has been
Cf. Maurice Leven, Harold G. Moulton, and Clark Warburton, Amer-ica's Capacity to Consume, Brookings Institution, 1934, Chap. 8.
2 Journal of Political Economy, February 1933, pp. 95-116.S Re-view of Economics and Stati$tics, August 1948, pp. 198-206.
342
COMPARATIVE PURCHASING POWERtoo modest, will be found in the well-known city worker's familybudget.4
Imbedded in this section lies the clearest statement of the mainthesis, to which I now return, as follows: "procedures for matchingbundles of goods and services must be free, in concept and in prac-tice, from the need for imputing identity to particular commodi-ties (p. 315) ." This is a pretty forthright declaration of independ-ence, at any rate for the construction of national indexes designedmainly for domestic purposes. It is essentially a demand for broaderpowers of administrative discretion, powers which imply both ad-vantages and pitfalls. In the right hands, greater freedom in choos-ing the new standard basket for periodic revisions of the indexshould produce a more realistic bill of goods and might reduce theupward bias resulting from unchanged components and weights.In the wrong bands, however, it could convert retail indexes to afine art of something or other and might bring pressure groups,including those within government, embarrassingly close to theelbow of the statistician.
An index of an almost fixed basket has well-known limitationsbut, like the rule of law in a field where the law accommodates it-self only very gradually to changed conditions, it has the merit ofbeing impersonal and relatively unvarying, though admittedly im-perfect. The errors in such an index share its virtues and defects;because they are on the whole impersonal, widely recognized, andnot capricious they can be allowed for, and need not detract muchfrom the prestige of the index. These are platitudes, and I make noapology for repeating them because they are an important ingre-dient in design of social measurements. I hope the authors willagree that the freedom which they seek should be granted onlyafter proper provision has been made to ensure fairness, publicity,and review and, further, that it should be used sparingly.
JAMES T0BIN, Yale UniversityThe paper by Dorothy S. Brady and Abner Hurwitz is both very
difficult and very stimulating for a reader who has previously de-voted little study to the subject. The duties of a discussant compelhim to pay most attention to the parts of the paper that gave him
Monthly Labor Review, February 1948, pp. Workers' Budgetsin the United States: City Families and Single Persons, 1946 and 1947,Bull. 927, 1948; Family Budget of City Worker, October 1950, Bull. 1021,1951; all Bureau of Labor Statistics.
343
COMPARATIVE PURCHASING POWERthe most difficulties, and I am afraid that my remarks may indi-cate a less favorable appraisal of the paper than I intend and thanthe paper as a whole merits. The problem the authors are tacklingwith considerable ingenuity and courage is in principle insoluble,and it is not surprising that their suggested solutions encountercriticism.
Price index Numbers. The paper contains a great deal of wis-dom, the product of careful reflection on long experience, concern-ing the construction of price index numbers relating two situationsdiffering in time or in place. The authors show that alternativeschemes of matching commodities between the two situations canlead to widely different values of the index.1 They also point outthe bias in index numbers which may result from choosing for eachcomponent category of the index the prices which are most repre-sentative in terms of volume of sales. Low-sales-volume items arenever included in the sample of prices, but they may show system-atic differences in price behavior from the large-volume items.
Factor Models of Price Differences. The use of models borrowedfrom statistical analysis of variance to explain price differencesamong countries and to estimate country price indexes is certainlyan ingenious idea. We may expect to hear a great deal more of itin the future. Comment here is somewhat impeded by the unavail-ability at this time of the work of Smith and Jablon, on whichBrady and Hurwitz base their account. The great advantage of themethod is that it does not require a list of commodities common toall countries. This kind of model has also, as the authors point out,the advantage that unique indexes for a whole set of countries canbe computed simultaneously. The conventional index number meth-od requires a set of possibly inconsistent binary comparisons. Theaccompanying disadvantage of the suggested new technique is thatthe value of the index between any pair of countries is not independ-ent of the set in which the pair are embedded.
The authors' main specific example is the multiplicative two-fac-tor model, which says that, except for a random error, the price Pof commodity j in country i may be expressed as Pin,. is a factorrepresenting the price level in the country; for any one country i,
1 Economists will be able to follow the argument better if they remem-ber that what the authors call a "demand curve" is not a schedule of theamounts that would be taken of an identical commodity at alternative prices,but instead a scatter of points representing prices quoted and quantitiestaken for a variety of qualities of a commodity.
344

COMPARATIVE PURCHASING POWERit is the same for all commodities. is a factor representing theaverage world price of a commodity; for any one commodity), it isthe same for all countries. I have the following comments andquestions concerning this model:
1. If the model held exactly, without random error, then allprice relatives between any pair of countries would be the same.All index number formulas would lead to the same result—therewould indeed be no "index number problem."
2. Can departures from perfect fit to the model be viewed asrandom? Surely, the index number problem arises from systematicnonrandom departures from proportionality. The authors them-selves argue that national differences in the structure of prices, notjust in price levels, are inherent in differences in climate, resources,location, and technology. A statistical model that takes account ofcountry-commodity interactions is a minimal requirement for amodel, not an optional refinement.
3. WThatever model is hypothesized, the estimates that resultfrom its application should be accompanied by significance testsof the hypotheses.
4. In the examples given in the paper, each commodity pricein each country is weighted by the quantity of that commoditypurchased in that country. This procedure carries the danger thata large country may so dominate the calculation of the 11, that themodel gives approximately a fixed-weight index with the largecountry's quantities as weights.
Other Measures of Equivalent Purchasing Power. In the lasthalf of the paper, a number of other ingenious suggestions for find-ing purchasing power equivalents are set forth. These techniqueshave in common the convenient property of avoiding altogetherthe need for price observations. They depend instead on ascertain-ing the levels of income in the two countries at which householdswould behave in some equivalent way, and on identifying equiva-lence of this specific kind of behavior with equivalence of economicwell-being. The authors' suggestions are:
1. Incomes at which households spend the same percentage oftheir incomes on food are equivalent.
2. The income level in one country at which the percentagespent on food reaches a maximum is equivalent to the income levelin another country at which the percentage spent on food reachesa maximum.
3. Incomes at which households spend the same percentage of345
COMPARATiVE PURCHASING POWERtheir incomes on necessities are equivalent. Here necessities mayvary from country to country; for each country, they are commodi-ties which have in that country an income elasticity less than one.
4. The income levels of comparable social and occupationalgroups who have roughly similar consumption patterns may beconsidered equivalent. The author's example equates Georgia-Mis-sissippi share-croppers in 1935-1936 to contemporary lower castesin India.
The first of these suggestions is the one the authors propose ingreatest detail, and consequently the one that deserves the greatestdiscussion. Even for this method they provide little rationale. Whyshould two families be regarded as equally well off just becausethey spend the same percentage of their incomes on food? Thephysical quantity of the food, its nutritional content, the associatedretail and restaurant services, the quality of the various items—allmay be very different. Evidently, the implicit principle is that foodis a regrettable necessity, and that freedom to dispose of incomein other ways is a sign of well-being. The relation of food expendi-ture to subjective satisfactions is a cultural variable to which anation's climate, traditions, and culinary skill are related. Is aFrench gourmet to be considered poverty-stricken because hechooses to spend his money on good food and drink instead of tele-vision and gasoline?
These doubts about the principle would be less serious if theincome elasticity of food demand were in fact a universal cross-cultural constant. If it were, then it would also make no differenceat what percentage of income we chose to match income levels.That is, the ratio of the United States income of which X per centgoes for food to the France income of which X per cent goes for foodwould be the same whatever value we take for X—70 per cent, 20per cent, or any other percentage. Given such constancy, this ratiobetween the United States and France incomes would cry out forinterpretation, although the conclusion that this equivalence meansequivalence of standard of living would still require further justi-fication.
The data in Appendix Table C-i permit computation of incomeelasticities for the three countries and Norway, although in theabsence of data on number of cases in each income class, it is notpossible to compute optimal estimates. Weighting each incomeclass equally, I compute an income elasticity of 0.59 for the UnitedStates, 0.82 for Norway, 0.52 for France, 0.57 for India. On this
346
COMPARATIVE PURCHASING POWERbasis the number of kroner to the dollar varies, over the four pointspresented by the authors on page 317, from 0.27 to 1.52; thenumber of francs from 336 to 417, the number of rupees from0.67 to 0.73.
A thorough discussion of this method of estimating equivalencesamong currencies would have to consider many other details: thenature of the correction for size of family and its applicability toall nations, the exact definition of income used in each budgetstudy, comparability of treatment of taxes and income in kind,comparability of definition of food, and so on.
Relative Income and Absolute Measure of Purchasing Power.Method 4 listed above proposes the matching of the income levelsof those population groups in different countries who occupy simi-lar positions in the internal distributions of economic and socialstatus. This method comes dangerously close to begging the ques-tion. The authors state in their conclusion that the need for inter-national comparisons of purchasing power arises from internationalquasi-taxation schemes. Both the rich and the poor are always withus. What the international agencies need to know is how muchpoorer, on some absolute scale, the poor of India are than the poorof the United States.
Mrs. Brady was a few years ago co-author of a brilliant articlecontending that the division of income between consumption andsaving depends on relative income rather than absolute income.2To the extent that consumption patterns—the percentages devotedto various broad categories of consumption—depend on relativeincome and status rather than absolute income, the above criticismof method 4 applies also to methods that rely on finding incomelevels at which comparable consumption patterns occur. In short,so far as these methods give unique answers at all, they may tendto give the answer that average real incomes are everywhere thesame.
2 Dorothy S. Brady and Rose D. Friedman, "Savings and the IncomeDistribution," Studies in income and Wealth, Volume Ten, National Bureauof Economic Research, 1947, pp. 247-265.
347