Embed Size (px)
Citation preview
LBNL-47086, Accepted by Journal of the Air & Waste Management Association, 04/01
Measuring Concentrations of Volatile Organic Compounds in Vinyl Flooring Steven S. Cox1, Alfred T. Hodgson2, and John C. Little1
1Virginia Polytechnic Institute & State University, Blacksburg, Virginia 2E.O. Lawrence Berkeley National Laboratory, Berkeley, California
ABSTRACT The initial solid-phase concentration of volatile organic compounds (VOCs) is a key
parameter influencing the emission characteristics of many indoor materials. Solid-phase
measurements are typically made using solvent extraction or thermal headspace analysis.
The high temperatures and chemical solvents associated with these methods can modify
the physical structure of polymeric materials and consequently affect mass transfer
characteristics. To measure solid-phase concentrations under conditions resembling
those in which the material would be installed in an indoor environment, a new technique
for measuring VOC concentrations in vinyl flooring (VF) and similar materials was
developed. A 0.09 m2 section of new VF was punched randomly to produce
approximately 200 0.78-cm2 disks. The disks were milled to a powder at -140o C to
simultaneously homogenize the material and reduce the diffusion path length without loss
of VOCs. VOCs were extracted from the VF particles at room temperature by fluidized
bed desorption (FBD) and by direct thermal desorption (DTD) at elevated temperatures.
The VOCs in the extraction gas from FBD and DTD were collected on sorbent tubes and
analyzed by gas chromatography/mass spectrometry. Seven VOCs emitted by VF were
quantified. Concentration measurements by FBD ranged from 5.1 µg g-1 VF for
n-hexadecane to 130 µg g-1 VF for phenol. Concentrations measured by DTD were
higher than concentrations measured by FBD. Differences between FBD and DTD
results may be explained using free-volume/dual-mobility sorption theory, but further
research is necessary to more completely characterize the complex nature of a diffusant
in a polymer matrix.
2
IMPLICATIONS Knowledge of the initial concentrations of volatile organic compounds (VOCs) in a solid
material such as vinyl flooring (VF) is crucial for assessing the emission characteristics
of the material and its potential to contaminate indoor air. Solid-phase concentration
measurement methods such as thermal headspace analysis and solvent extraction may
affect the physical structure and consequently the emissions characteristics of polymeric
materials. The fluidized bed desorption technique developed in this study does not
employ solvents or high temperature for VOC extraction and improves the representative
sampling of larger pieces of materials. With this technique, VOC content can be
determined under conditions similar to those to which the material would be exposed
when installed in an indoor environment. This concentration can be used as a parameter
in mechanistic models to estimate VOC emission rates. The direct thermal desorption
technique may prove useful as a simple procedure for directly comparing the overall
potential of similar materials to contaminate indoor air over long periods of time.
INTRODUCTION Vinyl flooring (VF) is manufactured in a variety of styles and compositions and is widely
installed in residential and commercial buildings in either sheet or tile form. VF is
primarily composed of a mixture of polyvinyl chloride (PVC), inert filler (usually
calcium carbonate, CaCO3), and organic plasticizers such as dioctylphthalate (DOP).
Other additives such as stabilizers, lubricants, antioxidants, and colorants are used to aid
in processing and improve product functionality and appearance. VF may also be
manufactured as a multi-layer system with a bottom backing (usually glass fiber) and a
top coating of transparent PVC or polyurethane.1 In the United States during 1998, 214
million kilograms of PVC were used in the production of VF.2
VF has been shown to emit a number of volatile organic compounds (VOCs).3, 4
VOCs can migrate from the interior to exposed surfaces by diffusion and then partition
into the surrounding air. Most of the VOCs that are emitted by VF are probably present
as contaminants in the various raw materials or as residues from the manufacturing
process.
3
Characterizing VF as a source of indoor VOCs requires assessing both the rate at
which VOCs are emitted and the total amount of VOCs that can potentially be emitted.
Initial concentration (C0) is a parameter of a model to predict emission rates of VOCs
from diffusion controlled materials.5, 6, 7, 8 Traditional methods for measuring
concentrations of VOCs in solid materials have used solvents or heat to extract target
compounds. However, free-volume theory has been used to describe how the structure of
a polymer can be affected by temperature and the presence of chemical solvents. As
summarized by Sperling9, free-volume refers to the voids in polymeric materials that
must be present in order for diffusion to occur. Amorphous polymeric materials such as
the PVC in VF consist of high weight molecular chains (30,000 to 1,000,000 g mol-1)
held together by entanglement and van der Waals’ forces. Free-volume is the sum of the
void spaces that exist between the imperfectly arranged polymer chains. The amount of
void space depends on the conformational arrangement of the polymer chains. At lower
temperatures chain motion is primarily vibrational and conformational arrangement of the
polymer chains, and consequently free volume, is largely independent of temperature.
However, at temperatures above the glass transition temperature (Tg), polymer molecules
possess sufficient energy so that coordinated chain movement becomes possible,
resulting in a relatively large net increase in free-volume. Tg can be characterized as the
temperature at which an inflection point in the free-volume-temperature curve occurs.
Polymers at temperatures below Tg are referred to as “glassy” and at temperatures above
Tg as “rubbery”. Due to the additional free-volume, the rate of diffusion through the
polymer is higher when the material is above Tg than when below Tg. Small non-
polymeric molecules present in a polymer can reduce Tg. These small molecules can
separate polymer chains making chain movement easier. This effect is termed
plasticization. The Tg of un-plasticized PVC is ~80o C; when plasticized, the Tg of PVC
is ~20o C and can be lower.9
Although several models have been proposed to describe sorption in polymers,
the dual-mode theory is frequently cited. This conceptual model describes solution and
diffusion of small, non-polymeric molecules in amorphous polymers. According to
Vieth,10 if a polymer is cooled from the rubbery state to the glassy state, a distribution of
microvoids is frozen into the structure. Because free segmental chain movement is
4
restricted in the glassy state, the microvoids in a glassy polymer immobilize a portion of
diffusant molecules by entrapment. The resulting system consists of polymer chains,
small mobile molecules, and small molecules immobilized by the polymer chains.10
Paul and Koros extended earlier research to construct a dual-mobility model of
mass transport in glassy polymers.11 Here, the diffusants trapped in frozen microvoids
are not completely immobilized, but have partial mobility. The overall diffusional flux is
the sum of the flux of the diffusants partially immobilized in the polymer microvoids and
the flux of the mobile diffusants. The flux rate is determined by the concentration
gradient and the diffusion coefficient of each of the two diffusant populations in the
glassy polymer system.12 The ratio of the diffusion coefficients (Dmobile/Dpartially immobilized)
is inversely proportional to the diameter of the diffusing molecule. For a relatively small
diffusant such as methane, this ratio has been measured to be 8.7 for a polycarbonate
system.13
The preceding analysis describes how the physical structure and consequently the
mass transport properties of polymeric materials such as VF can be affected by heat and
the presence of solutes. For this reason new techniques to measure VOC concentrations
in VF and similar materials were developed.
As described, the total VOC concentration may be apportioned into mobile and
partially immobilized fractions. The partially immobilized portion of the total VOC
concentration is not readily emittable, but can be emitted over a long time period. For a
single compound, C0 is therefore defined as the readily emittable mass of the compound
per unit mass of the material (e.g., µg g-1) subject to a particular set of environmental
conditions.
During concentration measurement, it is desirable to minimize the time required
to extract the target compounds from the solid-phase. Extraction time depends on the
rate of mass transport from the solid-phase to the extraction fluid. For many materials the
rate of mass transport is limited by the solid-phase diffusion rate. The time required for a
VOC to diffuse through the solid-phase is proportional to the square of the diffusion path
length and the reciprocal of the diffusion coefficient.14 Therefore, extraction time can be
reduced by decreasing the diffusion path length or by increasing the diffusion coefficient
by heating the material.
5
In this study, a new sample preparation technique, cryogenic milling (CM) is
applied to VF. A sample is obtained from a VF sheet by punching small disks from a
large area of the material. The sample is then pulverized into small particles in a ball mill
under a liquid nitrogen bath at temperatures of -140o C. CM homogenizes the sample,
decreases the diffusion path length, and increases the surface area of VF material. The
low temperature significantly reduces VOC vapor pressure, minimizing VOC loss, and
facilitates the milling process by making the VF more brittle.
Extraction of VOCs from the milled particles is accomplished at room
temperature by fluidized bed desorption (FBD). For comparative purposes, direct
thermal desorption (DTD) was also used to extract VOCs from the VF particles. In both
extraction techniques, the VOCs are collected on a sorbent and then analyzed using a
thermal desorption gas chromatography/mass spectrometry system.
MATERIALS AND METHODS The VF material used in this study was a monolayer sheet vinyl (1.8-m wide)
manufactured for the medical facilities market. In addition to PVC, the VF contained
approximately 50% (by weight) CaCO3 as well as plasticizers, pigments, and
stabilizers.15 The nominal thickness was 2 mm; the density was approximately
1.5 g cm-3. The VF was manufactured four months prior to this investigation. A
specimen of the material was tightly rolled into a 0.6-m long × 10-cm diameter cylinder,
wrapped in Kraft paper, and shipped from the warehouse to our laboratory. Upon receipt,
six 0.3-m × 0.3-m (0.09-m2) squares were cut from the center of the specimen, stacked,
wrapped in multiple layers of aluminum foil, and stored at -5o C. Squares were removed
as needed for experimental work. Experiments were completed within two months of
receipt of the specimen.
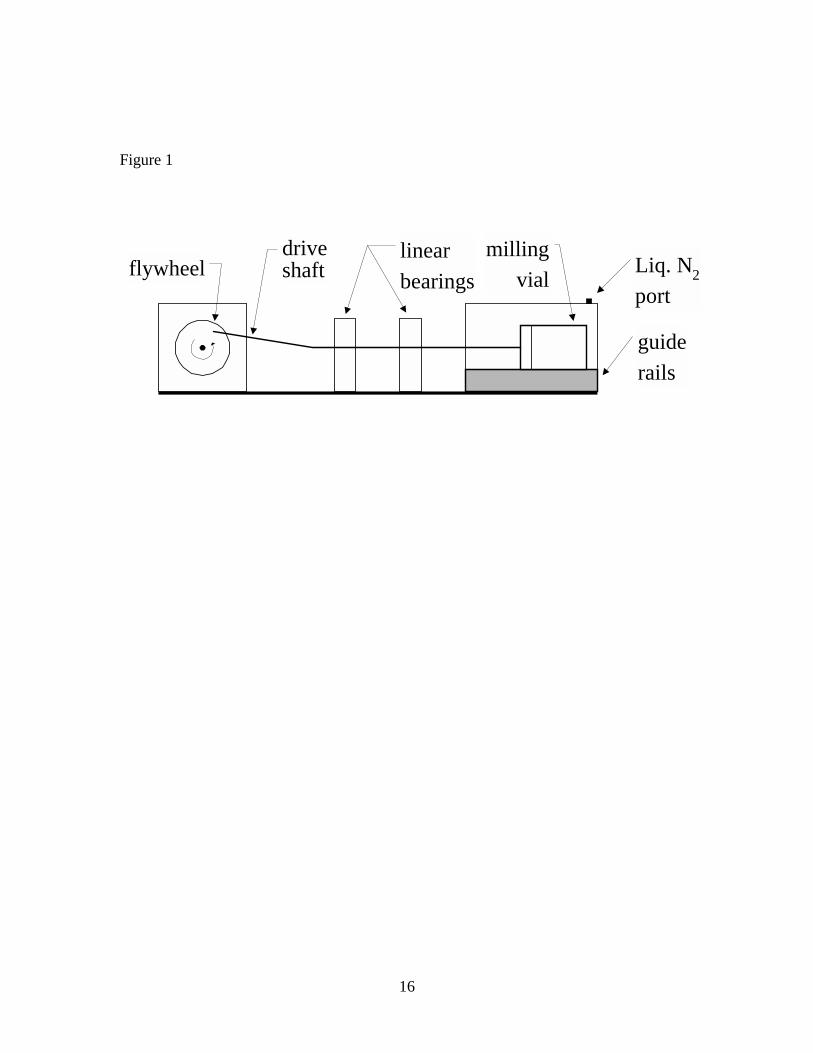
The VF was pulverized using a cryogenic ball mill (Figure 1).16 A 0.09-m2 VF
square was randomly sampled using a hollow arch punch to cut approximately 200 one-
cm diameter disks (~50 g) from the square. The disks and two 20-mm diameter stainless
steel balls were transferred to a stainless steel vial in the milling chamber of the ball mill.
The milling chamber was flooded with liquid nitrogen for approximately five minutes
before milling began. Upon commencement of milling, the surface temperature of the
6
milling vial was -140o C. The ball mill was operated at 480 revolutions per minute for 45
minutes while the milling chamber was continuously flooded with liquid nitrogen. After
CM, the powdered VF material was transferred to 4.5-ml, zero-headspace glass vials and
stored at -15o C.
Scanning electron microscopy (SEM) was used to obtain images of the VF before
and after CM. A cross-section sample of the original VF was prepared for SEM using a
microtome. A sputter coater (Model S150B, Edwards) was used to apply a ~100 Å gold
layer to the surface of both samples. Surface images were obtained using a scanning
electron microscope (ISI, Model SX-40) operating at 20KV.
The size distribution of the cryogenically milled particles was determined using a
laser diffraction particle-size distribution analyzer (Model LA-500, Horiba, Ltd.). Ethyl
alcohol was used as the particle dispersant.
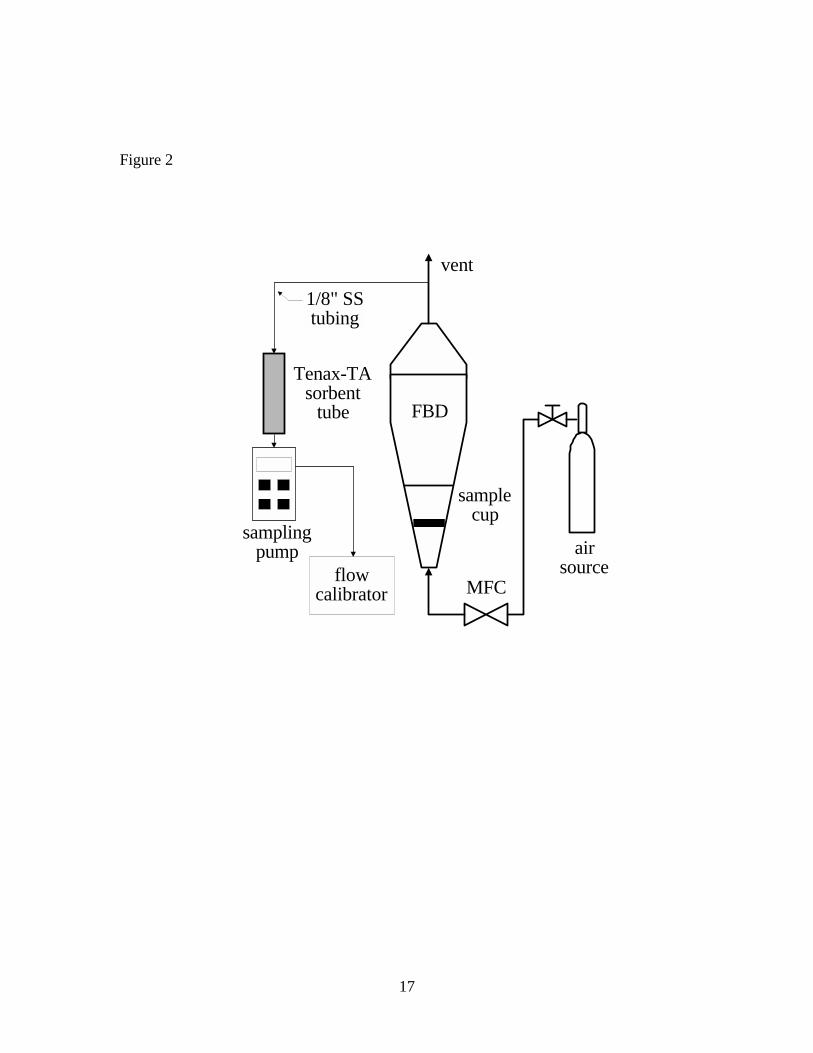
VOCs in VF particles were extracted at room temperature using a FBD apparatus
shown in Figure 2. A known mass (~1 g) of VF particles was transferred to a FBD vessel
(2.6-L) constructed of borosilicate glass. Clean air regulated by a mass-flow controller
(MFC) at ~6 L min-1 was passed through the vessel to fluidize the VF particles. VOCs
were collected by pumping a fraction (~15 mL min-1) of the effluent fluidization air
through a sorbent tube (described below). Four samples were successively collected over
each seven-hour FBD test during periods from 0-60 (blank, no VF particles in the FBD
apparatus), 60-120, 120-240, and 240-420 min. Duplicate tests were conducted.
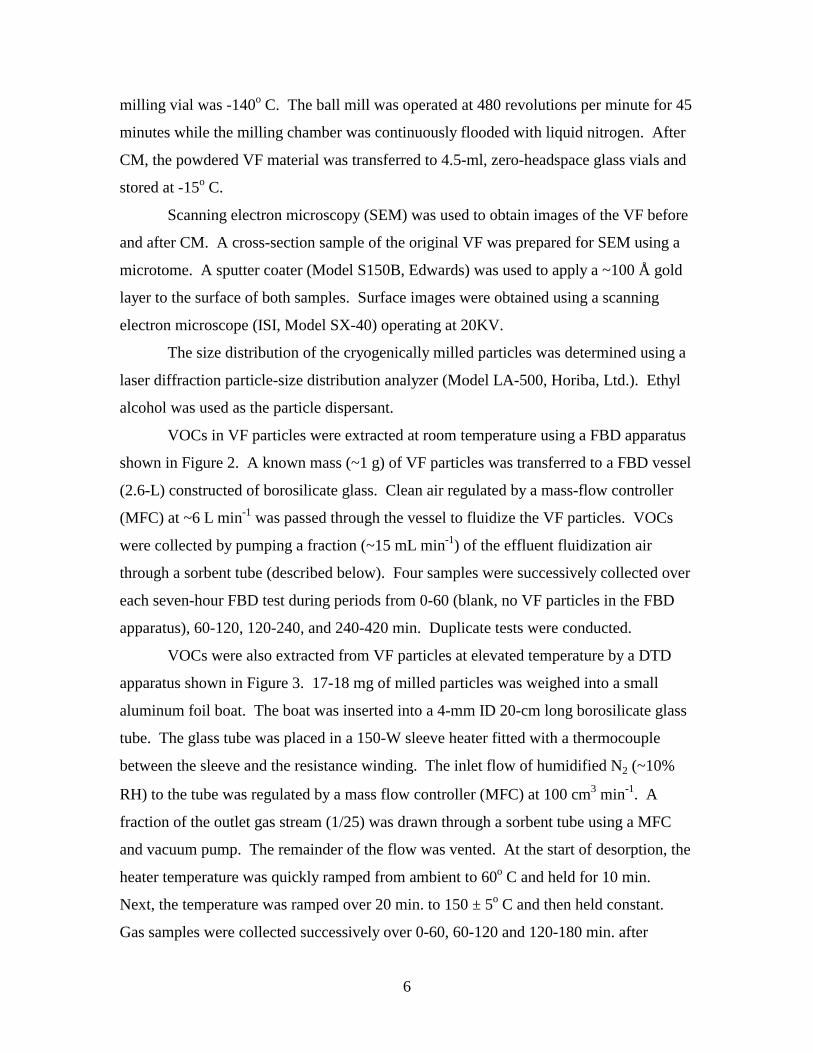
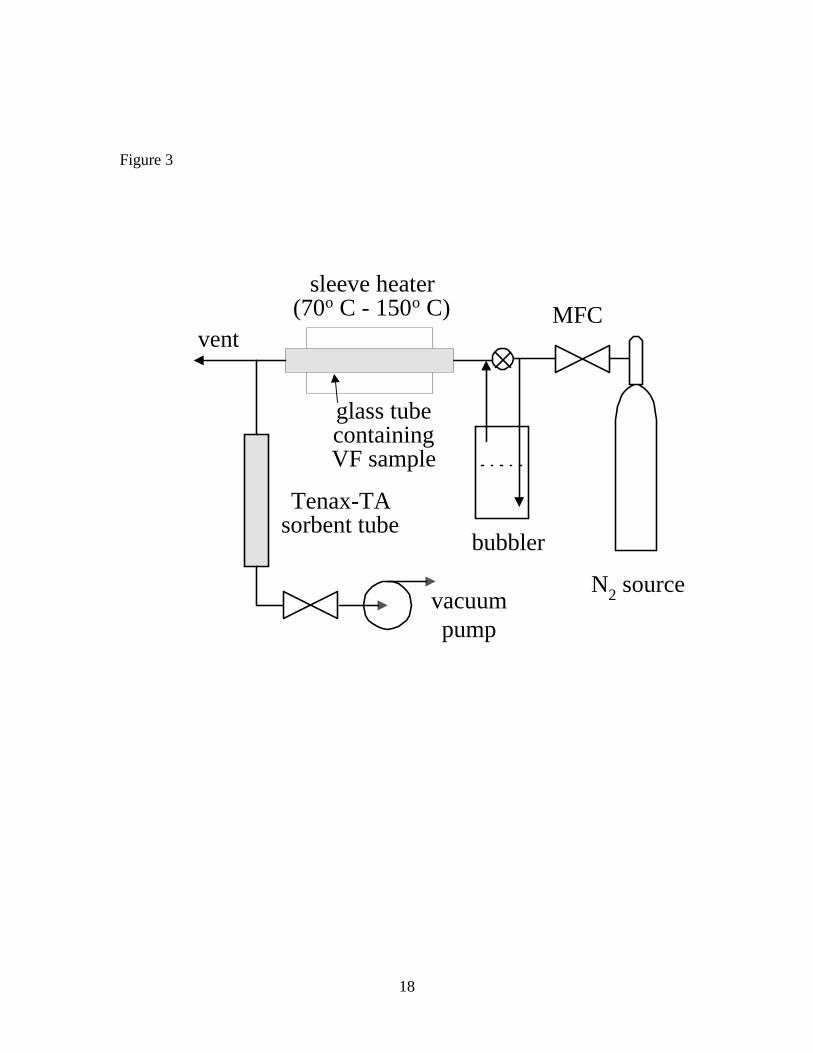
VOCs were also extracted from VF particles at elevated temperature by a DTD
apparatus shown in Figure 3. 17-18 mg of milled particles was weighed into a small
aluminum foil boat. The boat was inserted into a 4-mm ID 20-cm long borosilicate glass
tube. The glass tube was placed in a 150-W sleeve heater fitted with a thermocouple
between the sleeve and the resistance winding. The inlet flow of humidified N2 (~10%
RH) to the tube was regulated by a mass flow controller (MFC) at 100 cm3 min-1. A
fraction of the outlet gas stream (1/25) was drawn through a sorbent tube using a MFC
and vacuum pump. The remainder of the flow was vented. At the start of desorption, the
heater temperature was quickly ramped from ambient to 60o C and held for 10 min.
Next, the temperature was ramped over 20 min. to 150 ± 5o C and then held constant.
Gas samples were collected successively over 0-60, 60-120 and 120-180 min. after
7
initiating a test. Blank tests and three replicate tests were conducted. A detailed DTD
temperature study was subsequently conducted. Batches of 10-12 mg of milled particles
were individually heated in the same apparatus from ambient temperature to final
temperatures of 70, 90, 110, 130 and 150o C at a rate of 10o C min-1. A PID
(proportional/integral/derivative) controller regulated the ramp and soak temperatures.
Samples for VOCs were collected from the outlet gas stream every 30 min. up to a total
time of 150 min.
VOC concentrations in un-milled VF were also measured. A microtome was used
to cut thin strips or slivers (~200-µm thick) sequentially from the top to the bottom of a
VF specimen (~4-mm wide × 25-mm long). The slivers were weighed (15-30 mg) and
individually transferred to 2-ml glass vials for storage at -15o C. VOC concentrations in
the VF slivers were determined by DTD at 150o C following the same procedures
described for the particles.
VOCs were collected on sorbent tubes containing Tenax-TA (P/N 16251;
Chrompack, Bergen op Zoom, The Netherlands). VOCs were quantitatively analyzed by
gas chromatography/mass spectrometry (GC/MS) following U.S. Environmental
Protection Agency (EPA) Method TO-1.17 Sorbent tubes were thermally desorbed with a
cryogenic inletting system (Model CP-4020 TCT; Chrompack).
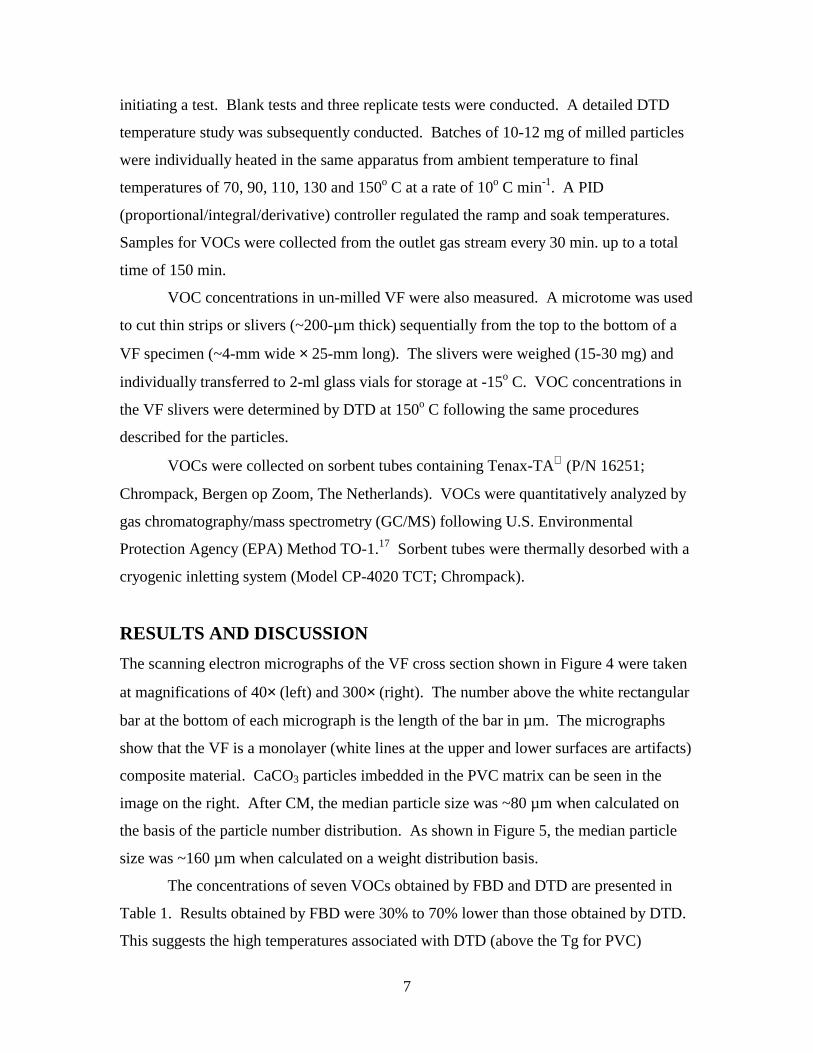
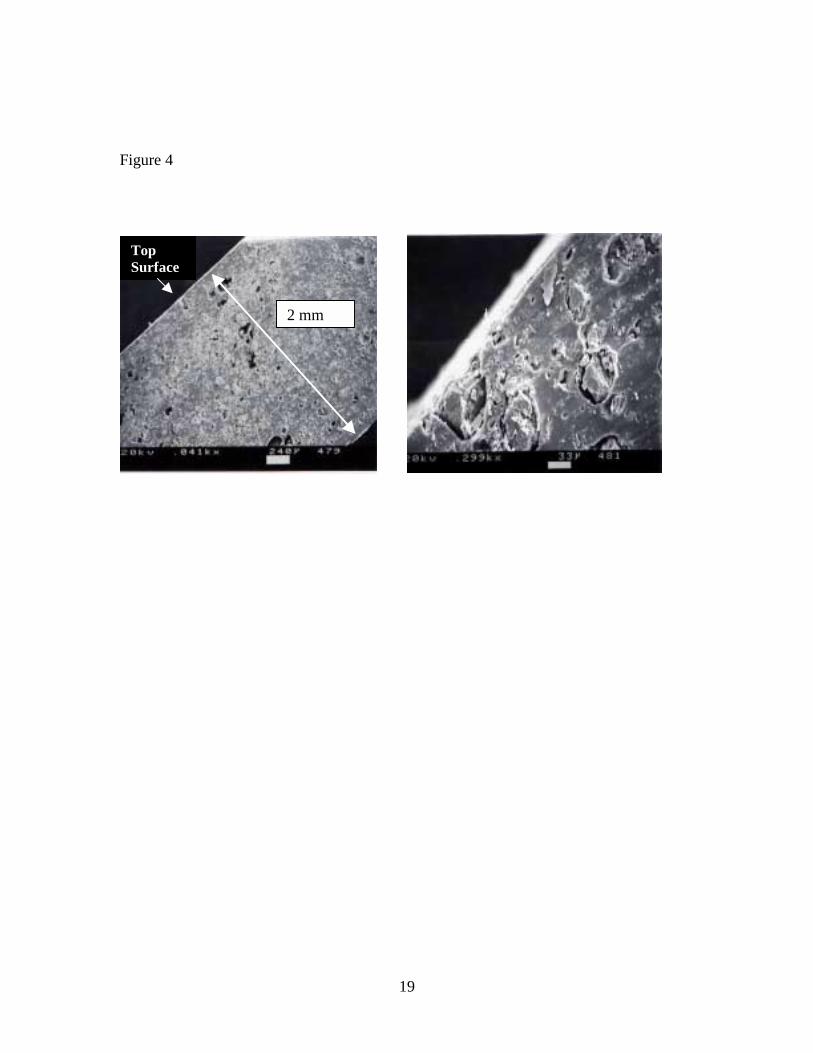
RESULTS AND DISCUSSION The scanning electron micrographs of the VF cross section shown in Figure 4 were taken
at magnifications of 40× (left) and 300× (right). The number above the white rectangular
bar at the bottom of each micrograph is the length of the bar in µm. The micrographs
show that the VF is a monolayer (white lines at the upper and lower surfaces are artifacts)
composite material. CaCO3 particles imbedded in the PVC matrix can be seen in the
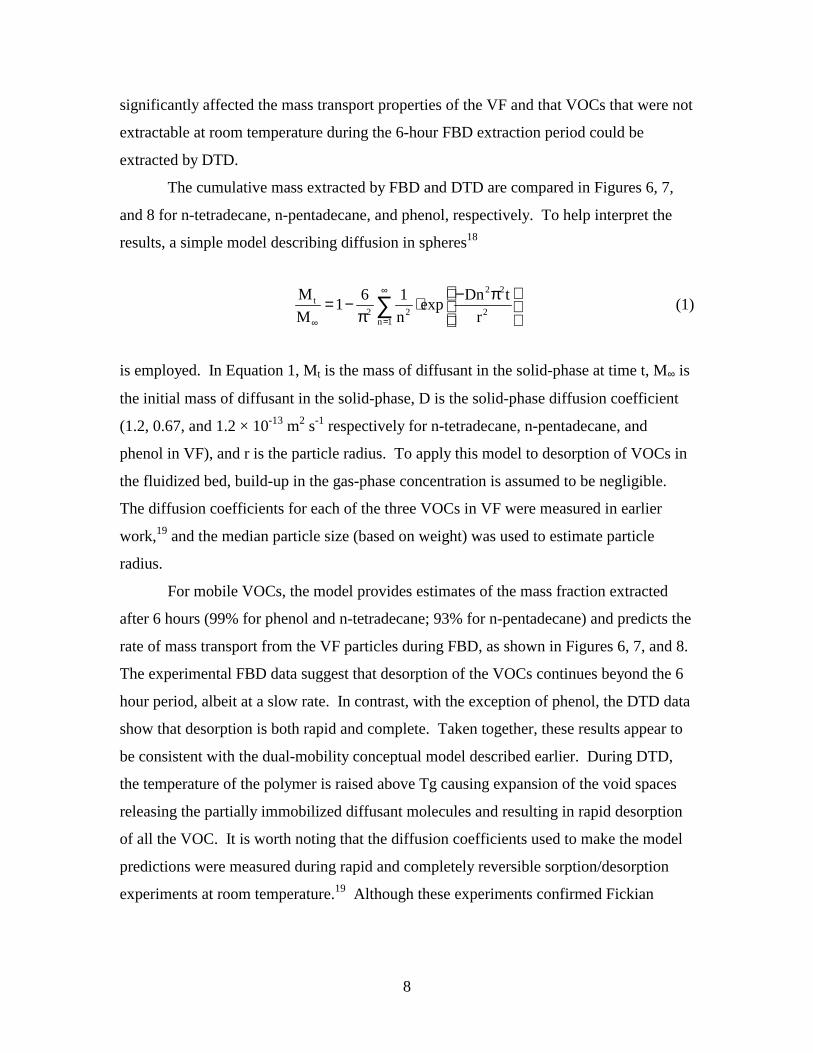
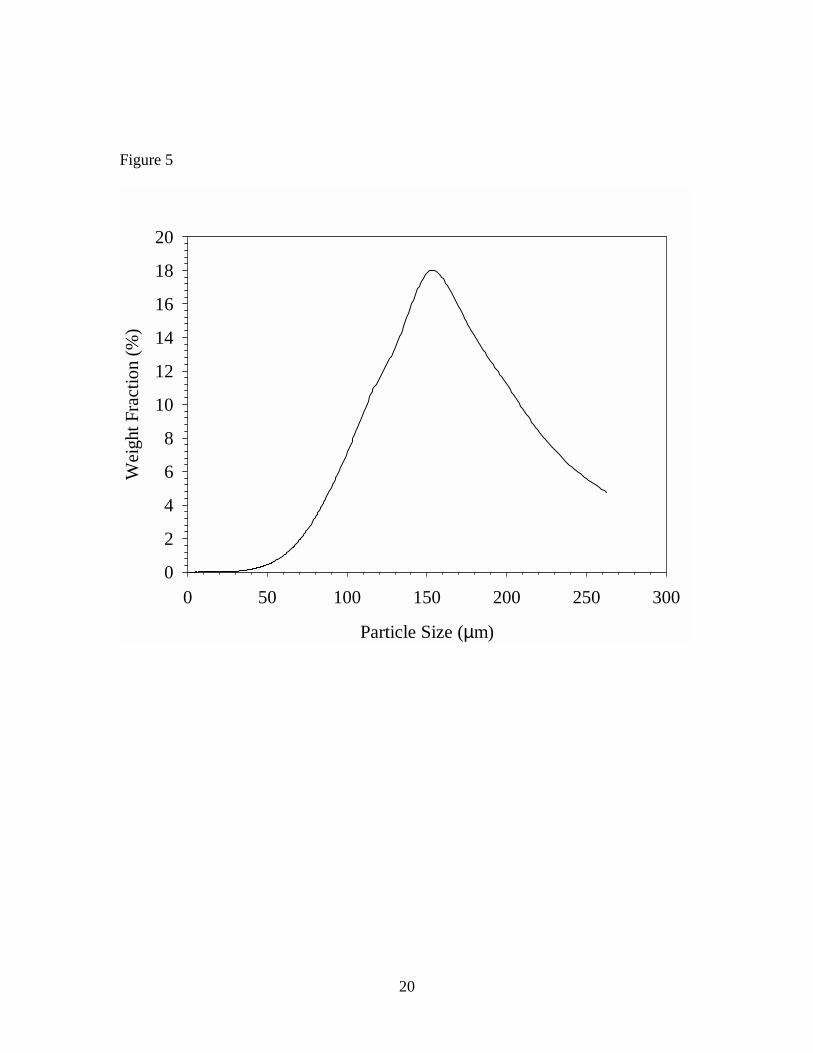
image on the right. After CM, the median particle size was ~80 µm when calculated on
the basis of the particle number distribution. As shown in Figure 5, the median particle
size was ~160 µm when calculated on a weight distribution basis.
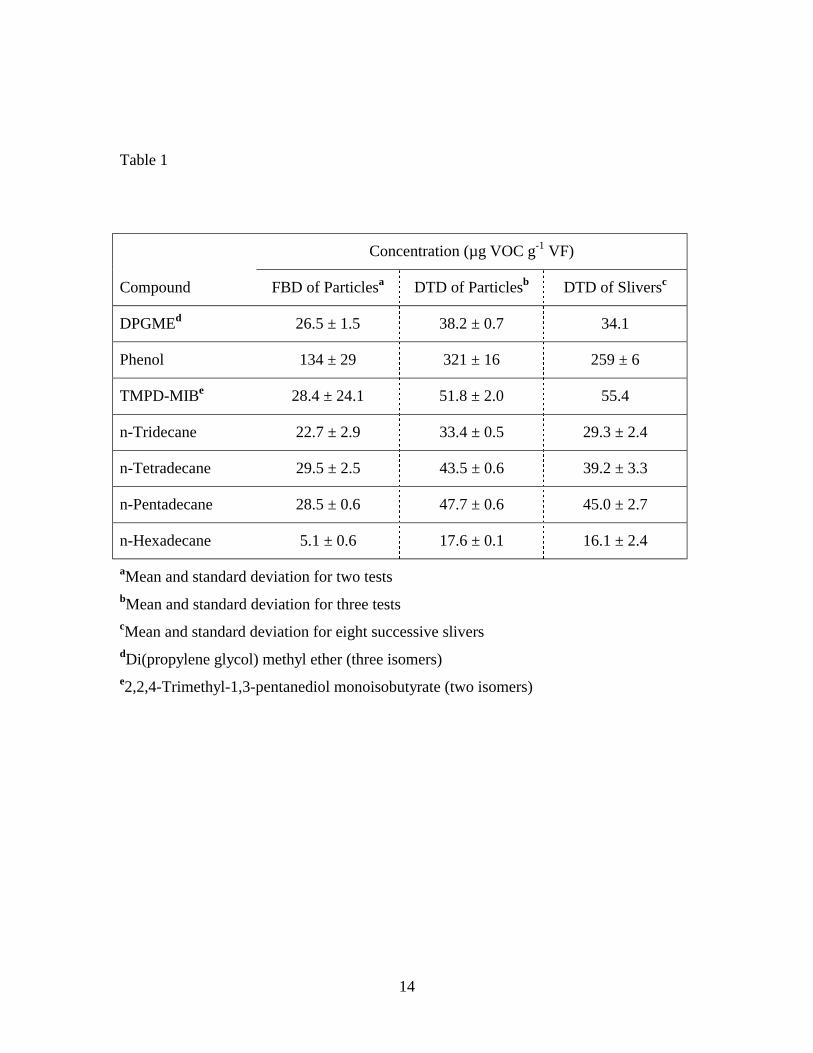
The concentrations of seven VOCs obtained by FBD and DTD are presented in
Table 1. Results obtained by FBD were 30% to 70% lower than those obtained by DTD.
This suggests the high temperatures associated with DTD (above the Tg for PVC)
8
significantly affected the mass transport properties of the VF and that VOCs that were not
extractable at room temperature during the 6-hour FBD extraction period could be
extracted by DTD.
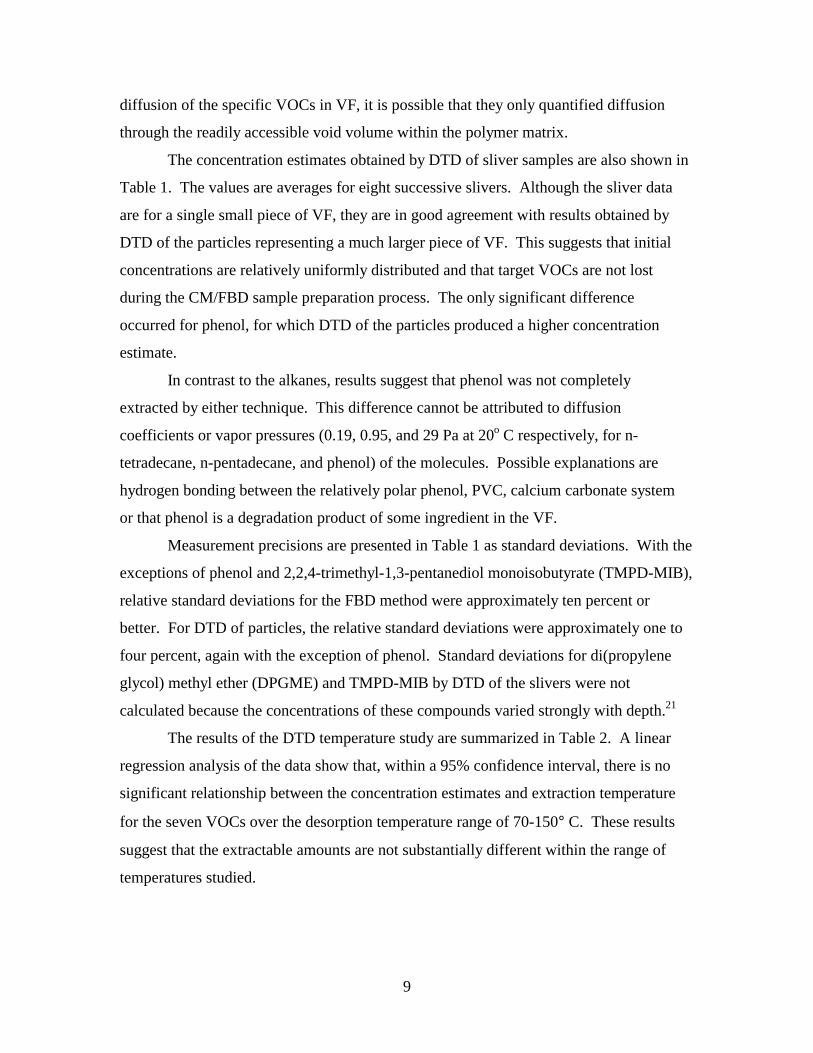
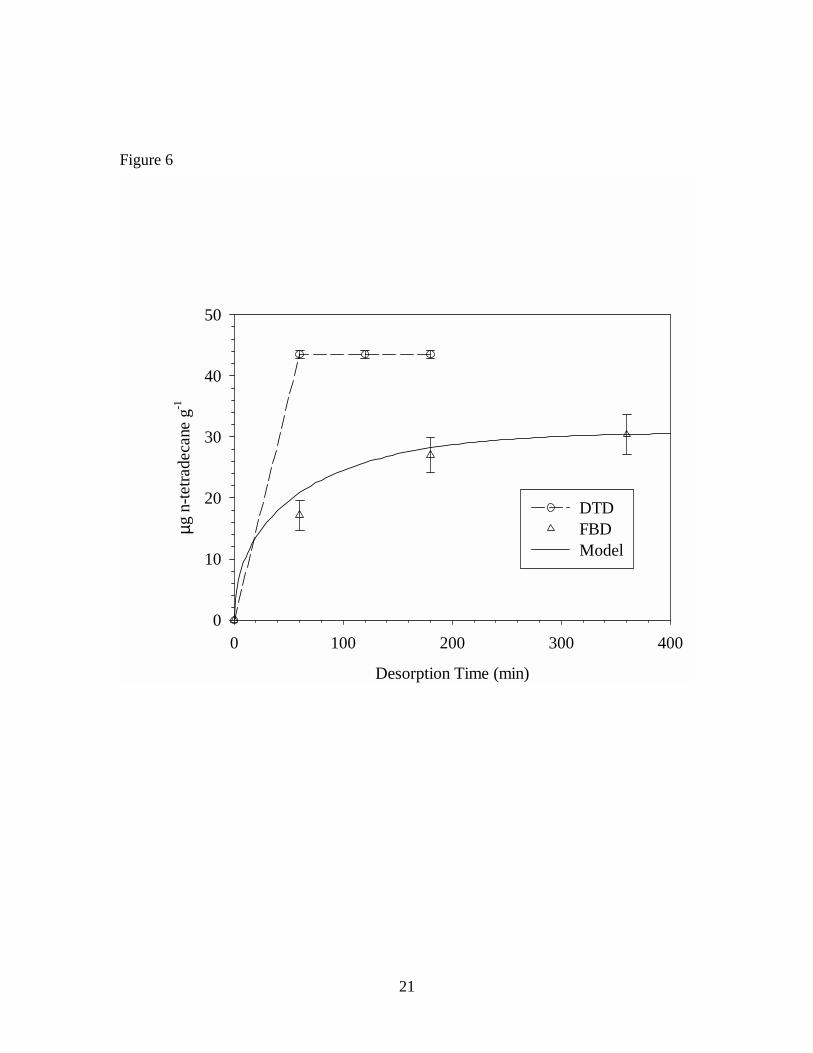
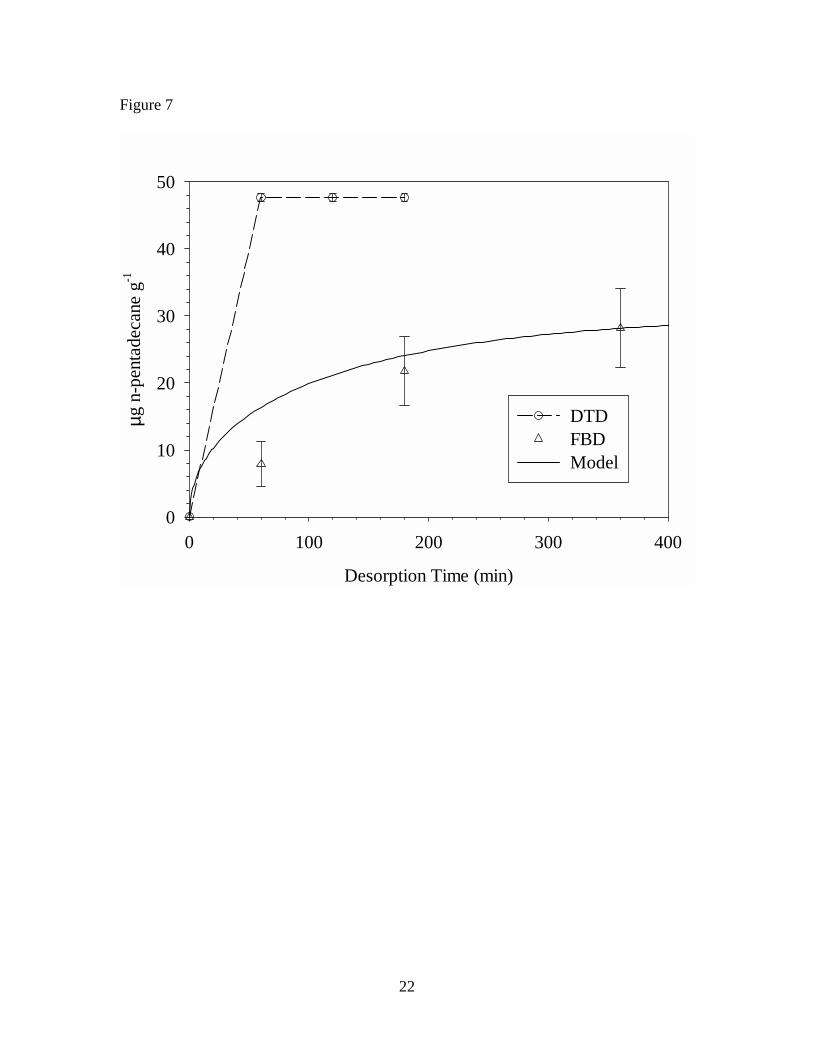
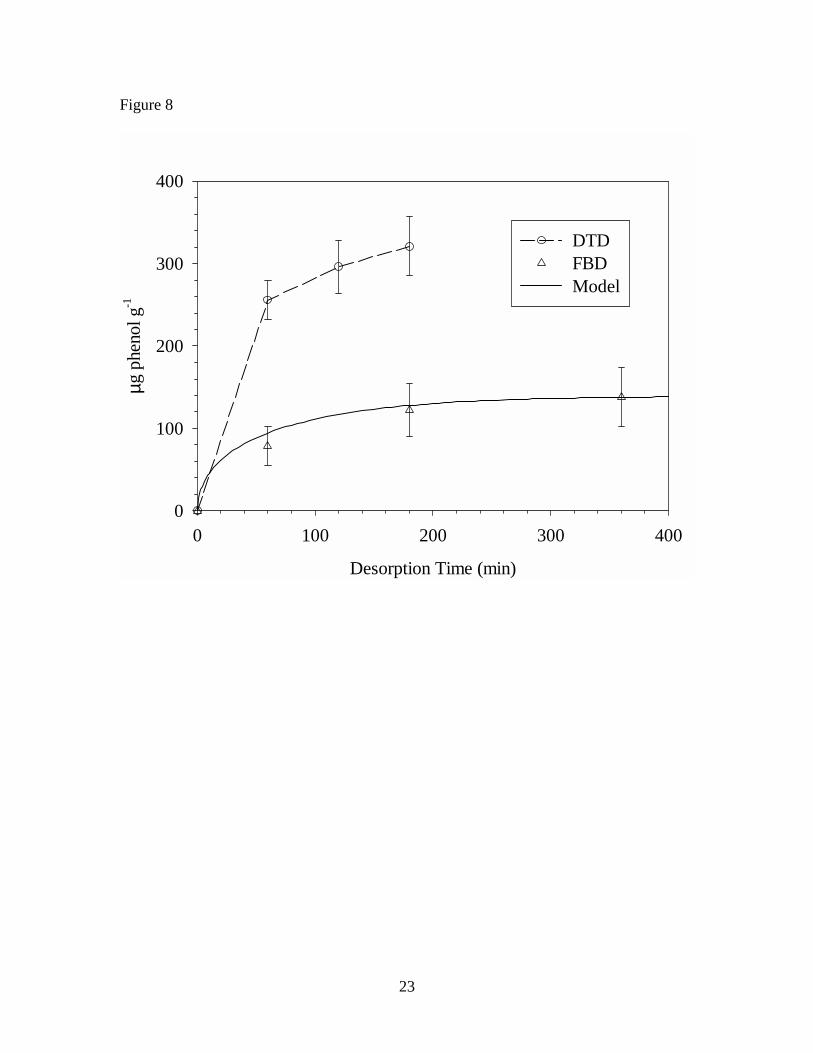
The cumulative mass extracted by FBD and DTD are compared in Figures 6, 7,
and 8 for n-tetradecane, n-pentadecane, and phenol, respectively. To help interpret the
results, a simple model describing diffusion in spheres18
2 2
t2 2 2
n 1
M 6 1 Dn t1 expM n r
∞
=∞
− π= − ⋅ π ∑ (1)
is employed. In Equation 1, Mt is the mass of diffusant in the solid-phase at time t, M∞ is
the initial mass of diffusant in the solid-phase, D is the solid-phase diffusion coefficient
(1.2, 0.67, and 1.2 × 10⁻¹³ m2 s-1 respectively for n-tetradecane, n-pentadecane, and
phenol in VF), and r is the particle radius. To apply this model to desorption of VOCs in
the fluidized bed, build-up in the gas-phase concentration is assumed to be negligible.
The diffusion coefficients for each of the three VOCs in VF were measured in earlier
work,19 and the median particle size (based on weight) was used to estimate particle
radius.
For mobile VOCs, the model provides estimates of the mass fraction extracted
after 6 hours (99% for phenol and n-tetradecane; 93% for n-pentadecane) and predicts the
rate of mass transport from the VF particles during FBD, as shown in Figures 6, 7, and 8.
The experimental FBD data suggest that desorption of the VOCs continues beyond the 6
hour period, albeit at a slow rate. In contrast, with the exception of phenol, the DTD data
show that desorption is both rapid and complete. Taken together, these results appear to
be consistent with the dual-mobility conceptual model described earlier. During DTD,
the temperature of the polymer is raised above Tg causing expansion of the void spaces
releasing the partially immobilized diffusant molecules and resulting in rapid desorption
of all the VOC. It is worth noting that the diffusion coefficients used to make the model
predictions were measured during rapid and completely reversible sorption/desorption
experiments at room temperature.19 Although these experiments confirmed Fickian
9
diffusion of the specific VOCs in VF, it is possible that they only quantified diffusion
through the readily accessible void volume within the polymer matrix.
The concentration estimates obtained by DTD of sliver samples are also shown in
Table 1. The values are averages for eight successive slivers. Although the sliver data
are for a single small piece of VF, they are in good agreement with results obtained by
DTD of the particles representing a much larger piece of VF. This suggests that initial
concentrations are relatively uniformly distributed and that target VOCs are not lost
during the CM/FBD sample preparation process. The only significant difference
occurred for phenol, for which DTD of the particles produced a higher concentration
estimate.
In contrast to the alkanes, results suggest that phenol was not completely
extracted by either technique. This difference cannot be attributed to diffusion
coefficients or vapor pressures (0.19, 0.95, and 29 Pa at 20o C respectively, for n-
tetradecane, n-pentadecane, and phenol) of the molecules. Possible explanations are
hydrogen bonding between the relatively polar phenol, PVC, calcium carbonate system
or that phenol is a degradation product of some ingredient in the VF.
Measurement precisions are presented in Table 1 as standard deviations. With the
exceptions of phenol and 2,2,4-trimethyl-1,3-pentanediol monoisobutyrate (TMPD-MIB),
relative standard deviations for the FBD method were approximately ten percent or
better. For DTD of particles, the relative standard deviations were approximately one to
four percent, again with the exception of phenol. Standard deviations for di(propylene
glycol) methyl ether (DPGME) and TMPD-MIB by DTD of the slivers were not
calculated because the concentrations of these compounds varied strongly with depth.21
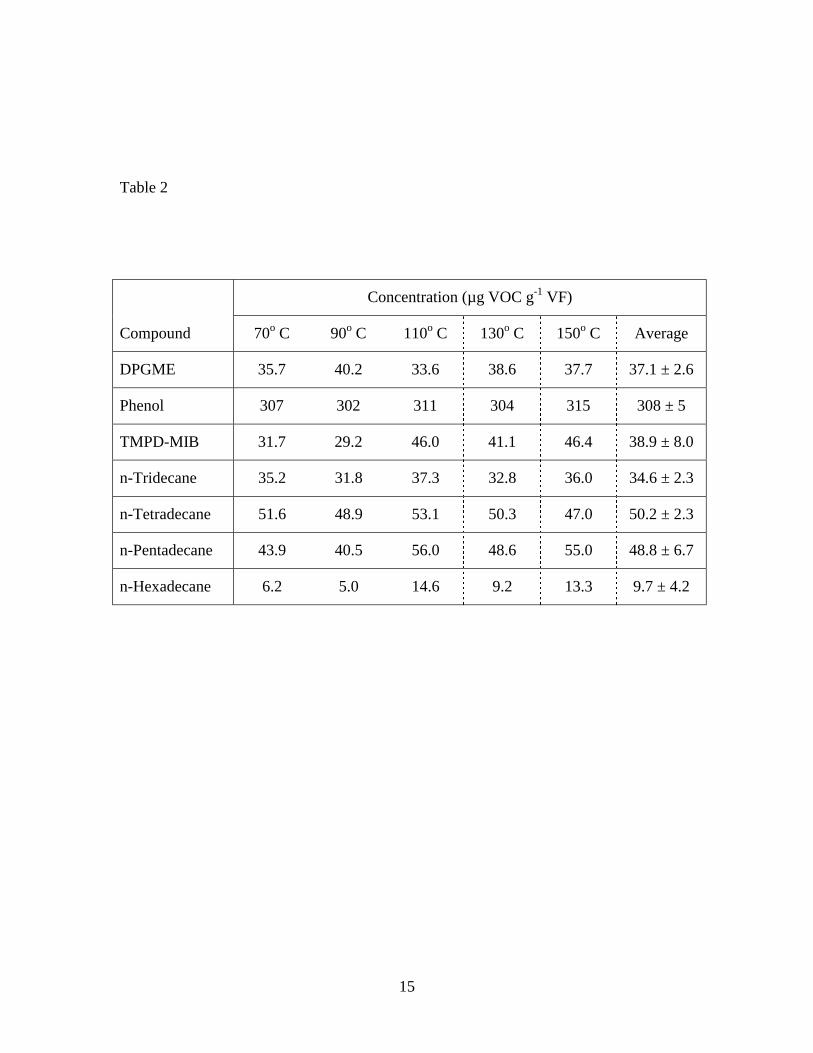
The results of the DTD temperature study are summarized in Table 2. A linear
regression analysis of the data show that, within a 95% confidence interval, there is no
significant relationship between the concentration estimates and extraction temperature
for the seven VOCs over the desorption temperature range of 70-150° C. These results
suggest that the extractable amounts are not substantially different within the range of
temperatures studied.
10
CONCLUSIONS This study has demonstrated that CM is a valuable technique for preparing VF for
concentration measurement. The benefits of CM include reduced potential for VOC loss
during sample preparation, reduced VOC extraction time due to shorter diffusion path
lengths, and improved representative sampling of the material.
The benefit of FBD is extraction of target compounds under conditions similar to
those in which the material would be installed in the indoor environment. This avoids the
problems associated with C0 measurement methods that potentially alter the mass
transport properties of polymeric materials and minimizes the chance of thermal
degradation of organic compounds and artifact formation.
The results of FBD and DTD concentration measurement are consistent with the
dual-mobility conceptual model of diffusion in polymers. Below the glass transition
temperature, one fraction of the diffusant population is considered mobile while the other
is considered partially immobilized. In accordance with this theory, concentration
determined by FBD approximates the mobile portion of VOCs, while concentration
determined by DTD represents the total VOC initially present in the VF. Further
research is clearly needed to more completely characterize the nature of these diffusant
fractions.
The primary purpose of this study was to determine C0 of a VOC in bulk VF for
use in a mechanistic model for predicting the rate at which the compound is emitted from
VF.21 While somewhat speculative, it now appears that FBD provides a measure of the
readily emittable fraction of the VOC while DTD quantifies the potential amount that can
be emitted over a long period of time. Although additional work is needed, it appears
that emission characterizations based on both of these solid-phase concentration
measurements may prove more useful and possibly less costly than commonly employed
chamber techniques.22
ACKNOWLEDGEMENTS Financial support for the work at Virginia Tech was provided by the National Science
Foundation (NSF) through an NSF CAREER Award (Grant No. 9624488). Work at
Lawrence Berkeley National Laboratory was sponsored by the U.S. Department of
11
Energy, Assistant Secretary for Energy Efficiency and Renewable Energy, Office of
Building Technology, State and Community Programs under Contract No. DE-AC03-
76F00098.
REFERENCES
1. Coaker, A.W.; Wypart, R.W. Vinyl Chloride Resins: Suspension, Emulsion, Microsuspension, and Bulk (Mass), In Handbook of PVC Formulating; Wickson, E.J., Ed.; John Wiley & Sons: New York, 1993; 15-113.
2. Resins Report, Modern Plastics, 1999, 76, 43-80
3. Clausen, P.A.; Lauersen, B.; Wolkoff, P.; Rasmusen, E.; Nielsen, P.A. Emission of Volatile Organic Compounds from a Vinyl Floor Covering, In ASTM STP 1205; Nagda, N.L., Ed.; American Society for Testing and Materials: Philadelphia, 1993; 3-13.
4. Lundren, B.; Jonsson, B.; Ek-Olausson, B.A. Material Emissions of Chemicals – PVC Flooring Materials, Indoor Air, 1999, 9; 202-208.
5. Zhao, D.Y., Cox, S.S., and Little, J.C. Source/Sink Characterization of Diffusion Controlled Building Materials, In Proceedings of The 8th International Conference on Indoor Air Quality and Climate - Indoor Air ‘99, Edinburgh, Scotland, 1999, 1; 408-413.
6. Little, J.C.; Hodgson, A.T. A Strategy for Characterizing Homogeneous, Diffusion Controlled Indoor Sources and Sinks, In ASTM STP 1287, Bruce A. Tichnenor Ed.; American Society for Testing and Materials: Philadelphia, 1996; 294-304.
7. Cox, S.S.; Little, J.C.; Hodgson, A.T. A New Method to Predict Emission Rates of Volatile Compounds from Vinyl Flooring, In Proceedings of Healthy Buildings 2000, Helsinki, Finland, 2000, 4; 169-174.
8. Little, J. C., Hodgson, A. T. and Gadgil, A. J. Modeling emissions of volatile organic compounds from new carpets, Atmospheric Environment, 1994, 28; 227-234.
9. Sperling, L. Introduction to Physical Polymer Science, 2nd Edition; John Wiley & Sons: New York, 1992.
10. Vieth, W. Diffusion in and Through Polymers; Hanser Publishers: Munich, 1991; p. 29.
11. Vieth, W. Diffusion in and Through Polymers; Hanser Publishers: Munich, 1991; p. 38.
12. Paul D. and Koros W. Effect of partially immobilizing sorption on permeability and the diffusion time lag, Journal of Polymer Science, Polymer Physics Edition, 1976, 14; 675-685.
12
13. Koros, W., Chan, A., and Paul, D. Sorption and transport of various gases in polycarbonate, Journal of Membrane Science, 1977, 2; 165-190.
14. Schwarzenbach, R.; Gschwend, P.M.; Imboden, D.M. Environmental Organic Chemistry; John Wiley & Sons: New York, 1993; p. 200.
15. Tshudy, J.A. Personal communication, 1998.
16. Shultz, J.P.; Martin, J.P.; Kander, R.G.; Suchicital, C.T.A. Processing-Structure-Property Relationships of Polymer-Polymer Composites Formed by Cryogenic Mechanical Alloying for Selective Laser Sintering Applications, In Proceedings of the Solid Freeform and Additive Fabrication-2000 MRS Symposium, San Francisco, CA, 2000, 625; 75-80.
17. U.S. Environmental Protection Agency. Method TO-1, Revision 1.0: Method For The Determination Of Volatile Organic Compounds in Ambient Air Using Tenax® Adsorption and Gas Chromatography/Mass Spectrometry (GC/MS); Center for Environmental Research Information, Office of Research and Development, 1984.
18. Crank, J. The Mathematics of Diffusion; Oxford University Press: Oxford, England, 1975; p. 91.
19. Cox, S.S.; Zhao, D.Y.; Little, J.C. Measuring Partition and Diffusion Coefficients of Volatile Organic Compounds in Vinyl Flooring, Accepted for publication in Atmospheric Environment, 2001.
20. Cox, S.S., Hodgson, A.T. and Little, J.C. A New Method to Measure the Concentration of Volatile Organic Compounds in Vinyl Flooring, In Proceedings of the Engineering Solutions to Indoor Air Quality Problems Symposium, Raleigh, North Carolina, 2000; 65-75.
21. Cox, S.S., Little, J.C. and Hodgson, A.T. Predicting the Emission Rate of Volatile Organic Compounds from Vinyl Flooring, Submitted for publication in Environmental Science and Technology, 2001.
22. ASTM. D 5116-97, Standard Guide for Small-Scale Environmental Chamber Determinations of Organic Emissions From Indoor Materials/Products; American Society for Testing and Materials, West Conshohocken, PA, 1997.
About the Authors
Steven Cox is a Ph.D. candidate in the Department of Civil and Environmental
Engineering at Virginia Polytechnic Institute and State University, 418 Durham Hall,
Blacksburg, VA 24061-0246. Alfred Hodgson is a staff scientist at Lawrence Berkeley
National Laboratory, 1 Cyclotron Road, Berkeley, CA 94720. John Little (corresponding
author) is an Associate Professor of Civil and Environmental Engineering at Virginia
Polytechnic Institute and State University, ([email protected]).
13
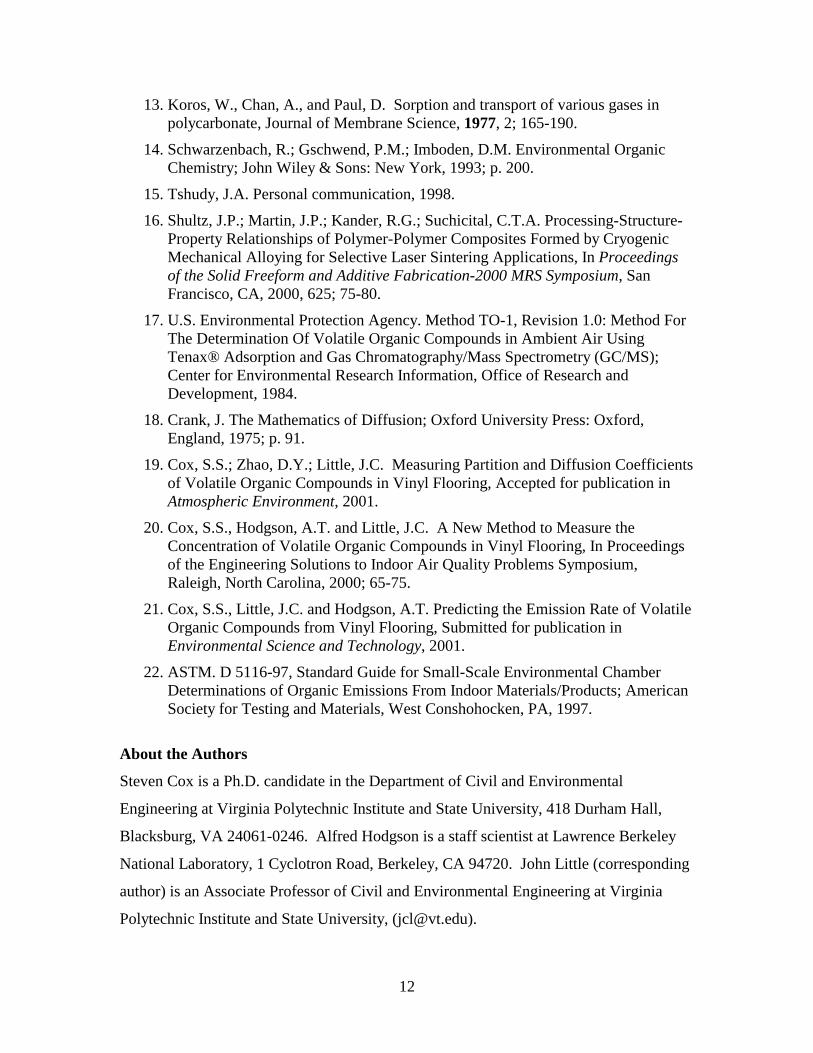
Table 1. Concentrations of seven VOCs in vinyl flooring determined by FBD and DTD of particles, and DTD of sliver samples Table 2. Concentrations of seven VOCs in vinyl flooring determined by DTD of particles at 70o C – 150o C Figure 1. Diagram of cryogenic ball mill Figure 2. Diagram of fluidized bed desorption (FBD) apparatus Figure 3. Diagram of direct thermal desorption (DTD) apparatus Figure 4. Scanning electron micrographs of vinyl flooring cross section taken at 40× (left) and 300× (right) Figure 5. Particle size distribution of cryogenically milled vinyl flooring Figure 6. Cumulative extraction of n-tetradecane from vinyl flooring particles by DTD and FBD Figure 7. Cumulative extraction of n-pentadecane from vinyl flooring particles by DTD and FBD Figure 8. Cumulative extraction of phenol from vinyl flooring particles by DTD and FBD
14
Table 1
Concentration (µg VOC g-1 VF)
Compound FBD of Particlesa DTD of Particlesb DTD of Sliversc
DPGMEd 26.5 ± 1.5 38.2 ± 0.7 34.1
Phenol 134 ± 29 321 ± 16 259 ± 6
TMPD-MIBe 28.4 ± 24.1 51.8 ± 2.0 55.4
n-Tridecane 22.7 ± 2.9 33.4 ± 0.5 29.3 ± 2.4
n-Tetradecane 29.5 ± 2.5 43.5 ± 0.6 39.2 ± 3.3
n-Pentadecane 28.5 ± 0.6 47.7 ± 0.6 45.0 ± 2.7
n-Hexadecane 5.1 ± 0.6 17.6 ± 0.1 16.1 ± 2.4
aMean and standard deviation for two tests bMean and standard deviation for three tests cMean and standard deviation for eight successive slivers dDi(propylene glycol) methyl ether (three isomers) e2,2,4-Trimethyl-1,3-pentanediol monoisobutyrate (two isomers)
15
Table 2
Concentration (µg VOC g-1 VF)
Compound 70o C 90o C 110o C 130o C 150o C Average
DPGME 35.7 40.2 33.6 38.6 37.7 37.1 ± 2.6
Phenol 307 302 311 304 315 308 ± 5
TMPD-MIB 31.7 29.2 46.0 41.1 46.4 38.9 ± 8.0
n-Tridecane 35.2 31.8 37.3 32.8 36.0 34.6 ± 2.3
n-Tetradecane 51.6 48.9 53.1 50.3 47.0 50.2 ± 2.3
n-Pentadecane 43.9 40.5 56.0 48.6 55.0 48.8 ± 6.7
n-Hexadecane 6.2 5.0 14.6 9.2 13.3 9.7 ± 4.2
16
Figure 1
flywheeldriveshaft
linearbearings
guiderails
Liq. N2port
millingvial
17
Figure 2
MFC
airsource
SampleParticles
Disengaging
Space
Tenax-TAsorbent
tube
samplingpump
samplecup
1/8" SS tubing
flowcalibrator
FBD
vent
18
Figure 3
MFC
N2 source
Tenax-TAsorbent tube
sleeve heater(70o C - 150o C)
vent
vacuumpump
bubbler
glass tubecontainingVF sample
19
Figure 4
Top Surface
2 mm
20
Figure 5
Particle Size (µm)
0 50 100 150 200 250 300
Wei
ght F
ract
ion
(%)
0
2
4
6
8
10
12
14
16
18
20
21
Figure 6
Desorption Time (min)
0 100 200 300 400
µg n
-tetra
deca
ne g
-1
0
10
20
30
40
50
DTDFBDModel
22
Figure 7
Desorption Time (min)
0 100 200 300 400
µg n
-pen
tade
cane
g-1
0
10
20
30
40
50
DTDFBDModel
23
Figure 8
Desorption Time (min)
0 100 200 300 400
µg p
heno
l g-1
0
100
200
300
400
DTDFBDModel