Embed Size (px)
Citation preview

MEASURES OF CENTRALITY
Last lecture summary• Mode• Distribution
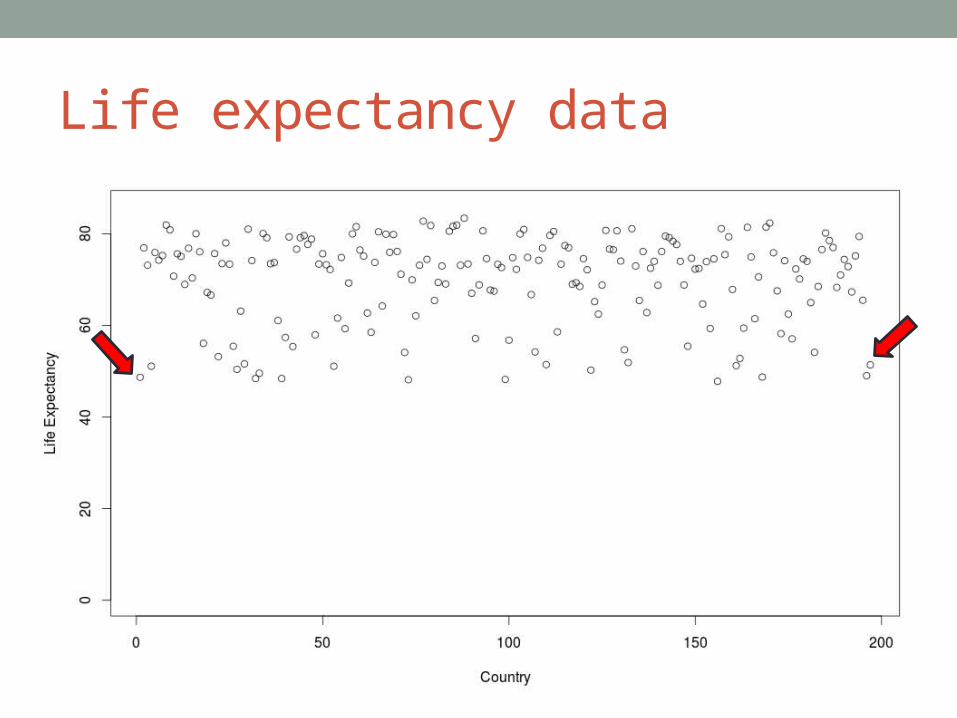
Life expectancy data
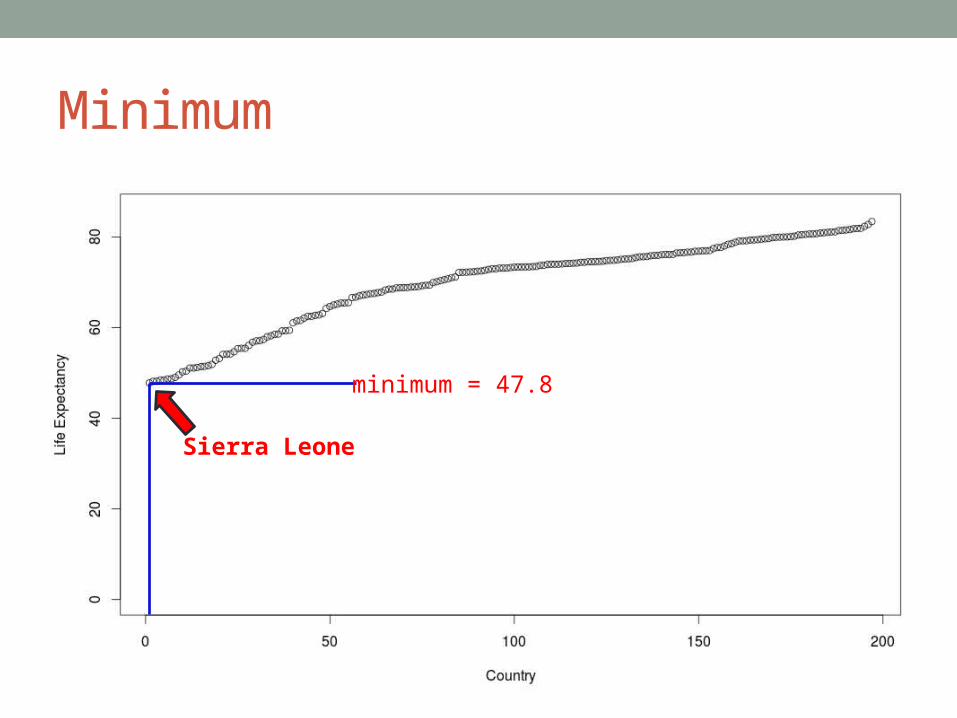
Minimum
Sierra Leone
minimum = 47.8
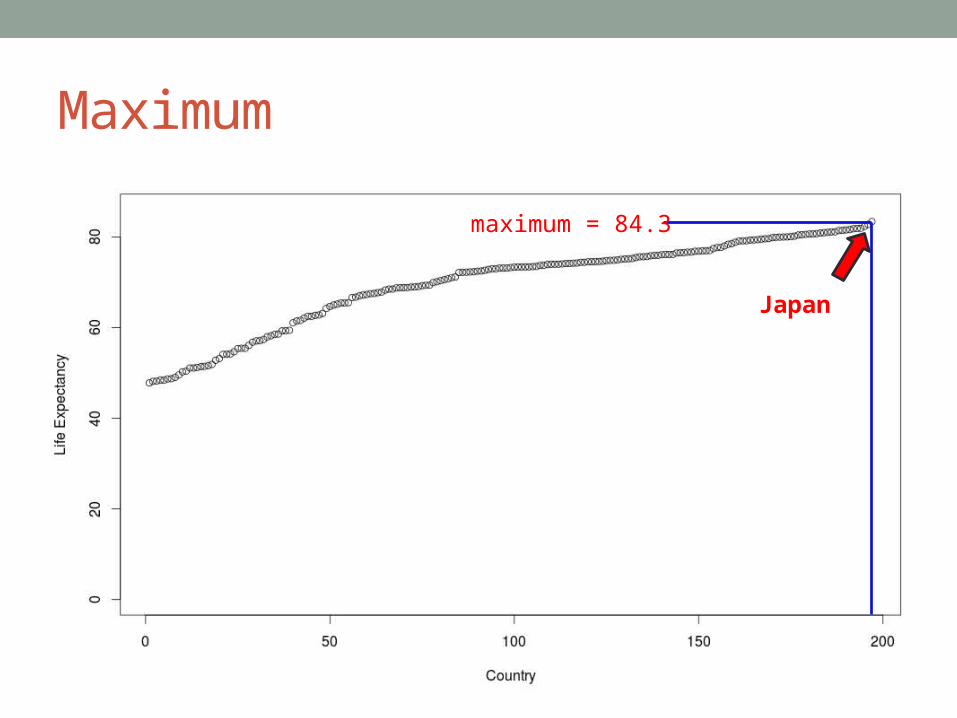
Maximum
Japan
maximum = 84.3

Life expectancy data
all countries

Life expectancy data
1 197
Egypt
99
73.2half larger
half smaller

Life expectancy data
Minimum = 47.8
Maximum = 83.4
Median = 73.2

Q1
1 197
Sao Tomé & Príncipe
50 (¼ way)
1st quartile = 64.7

Q1
¾ larger¼ smaller
1st quartile = 64.7

Q3
1 197
NetherlandAntilles
148 (¾ way)
3rd quartile = 76.7

Q3
3rd quartile = 76.7
¾ smaller ¼ larger

Life expectancy data
Minimum = 47.8
Maximum = 83.4
Median = 73.2
1st quartile = 64.7
3rd quartile = 76.7
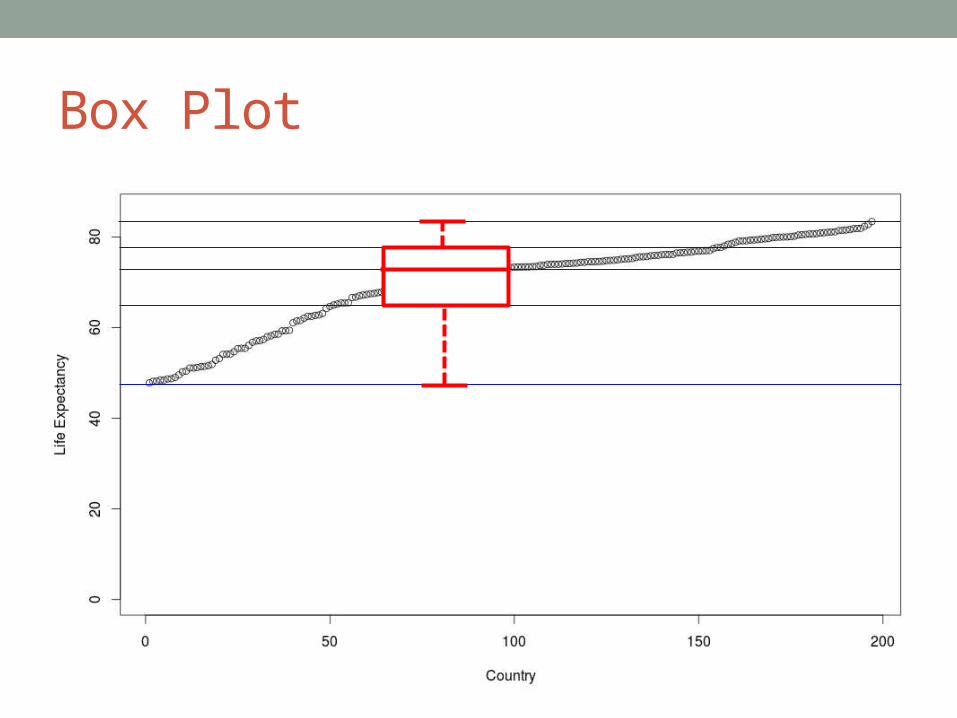
Box Plot
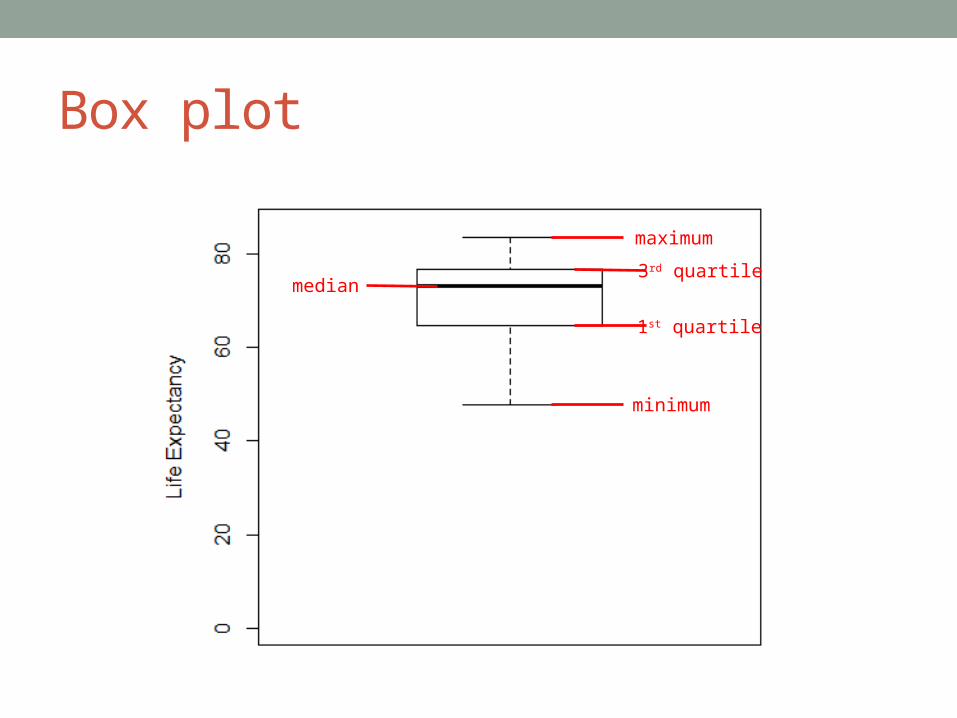
Box plot
1st quartile
3rd quartilemedian
minimum
maximum
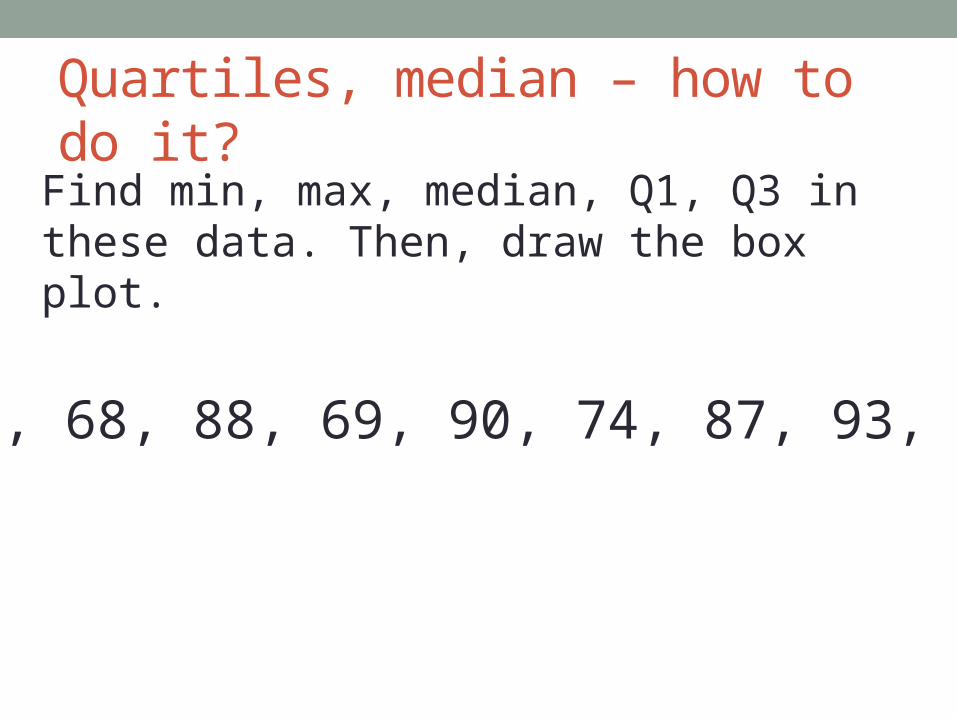
Quartiles, median – how to do it?
79, 68, 88, 69, 90, 74, 87, 93, 76
Find min, max, median, Q1, Q3 in these data. Then, draw the box plot.


Another example
Min. 1st Qu. Median 3rd Qu. Max.
68.00 75.00 81.00 88.50 93.00
78, 93, 68, 84, 90, 74

Percentiles
věk [roky]http://www.rustovyhormon.cz/on-line-rustove-grafy

Skeleton data• Estimate age at death from skeletal remains• Common problem in forensic anthropology• Based on wear and deterioration of certain bones• Measurements on 400 skeletons• Two estimation methods
• Di Gangi et al., aspects of the first rib• Suchey-Brooks, most common, pubic bone
http://www.bestcoloringpagesforkids.com/wp-content/uploads/2013/07/Skeleton-Coloring-Page.gif

• 400 skeletons, the estimated and the actual age of death
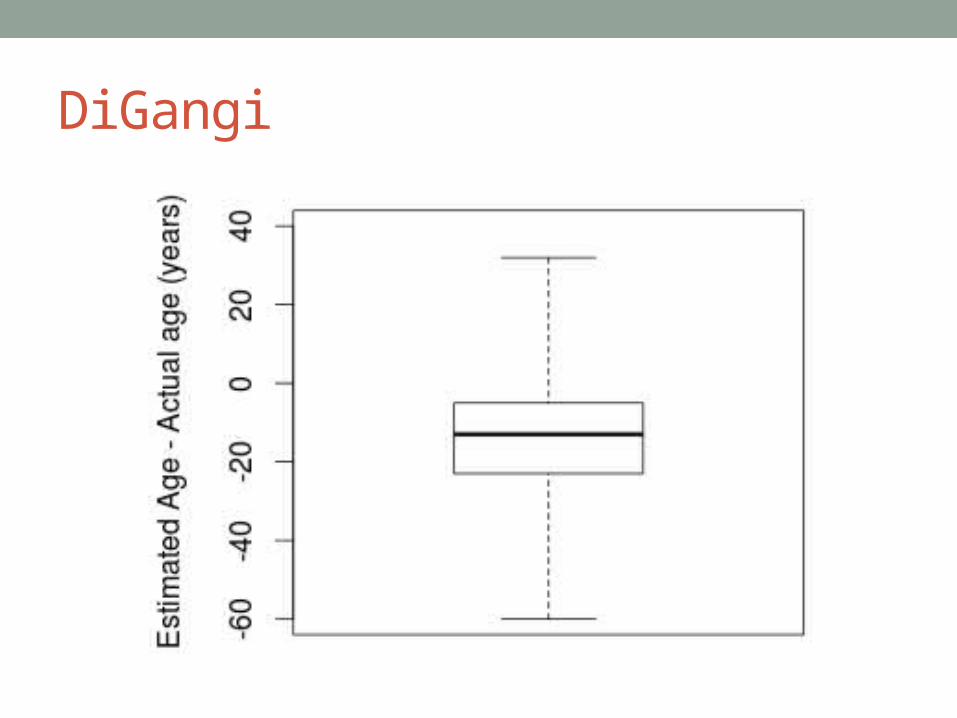
DiGangi

Modified boxplot Min. Q1 Median Q3 Max. -60.00 -23.00 -13.00 -5.00 32.00
Mean• Mathematical notation:
• … Greek letter capital sigma• means SUM in mathematics
• Another measure of the center of the data: mean (average)
• Data values:

Median = -13Mean = -14.2
Mean is not a robust statistic.
Median is a robust statistic.
Robust statistic

Median = -13Mean = -14.2
10% trimmed mean … eliminate upper and lower 10% of data (i.e. 40 points).
10% trimmed mean = mean of 320 middle data values = -13.8
Trimmed mean is more robust.
Trimmed mean

Salary o 25 players of the American football (NY red Bulls) in 2012.
33 750
33 750
33 750
33 750
44 000
44 000
44 000
44 000
45 566
65 000
95 000
103 500
112 495
138 188
141 666
181 500
185 000
190 000
194 375
195 000
205 000
292 500
301 999
4 600 000
5 600 000
median = 112 495
mean = 518 311
8% trimmed mean = 128 109

MEASURES OF VARIABILITY
Navození atmosféry

QUESTION
Mean1 Mean2Mode1 Mode2Median1 Median2
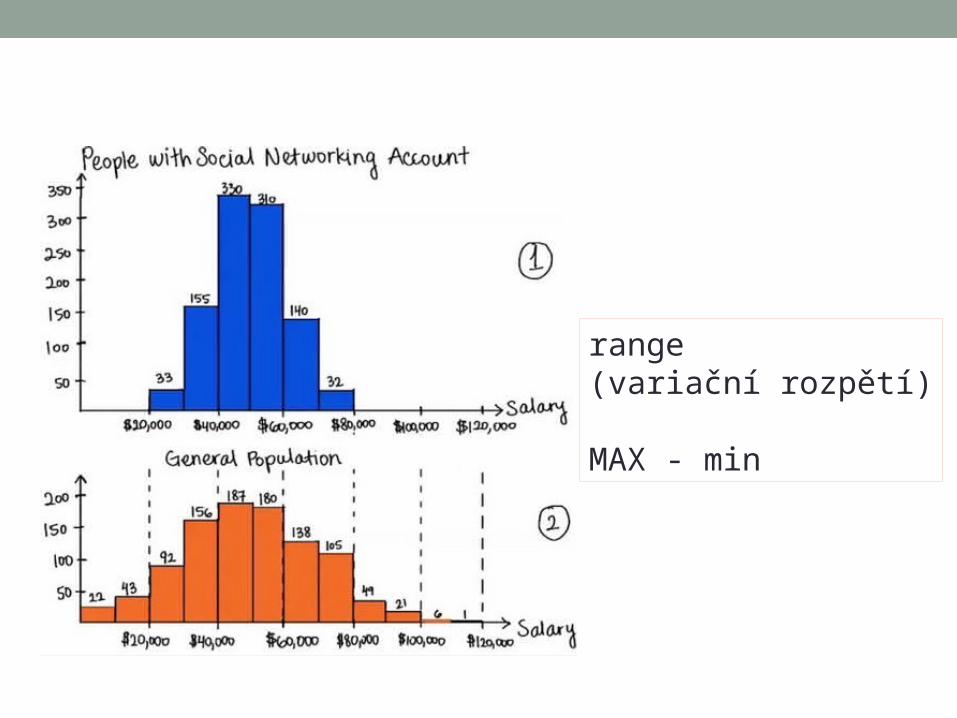
range(variační rozpětí)
MAX - min
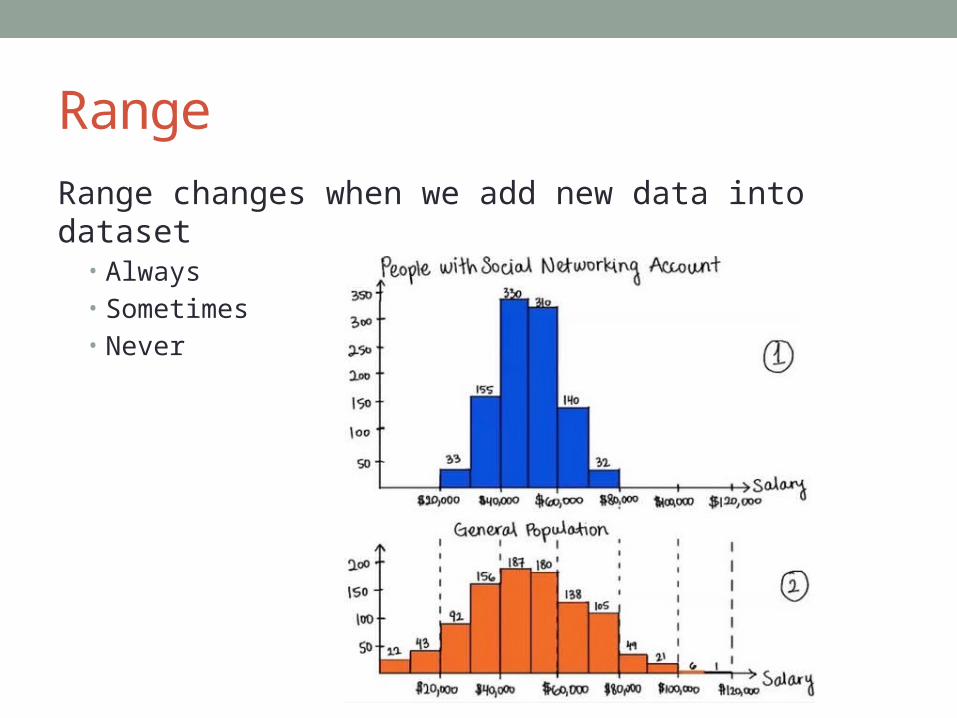
Range
Range changes when we add new data into dataset• Always• Sometimes• Never

Adding Mark Zuckerberg

Cut off data
IQR, mezikvartilové rozpětí
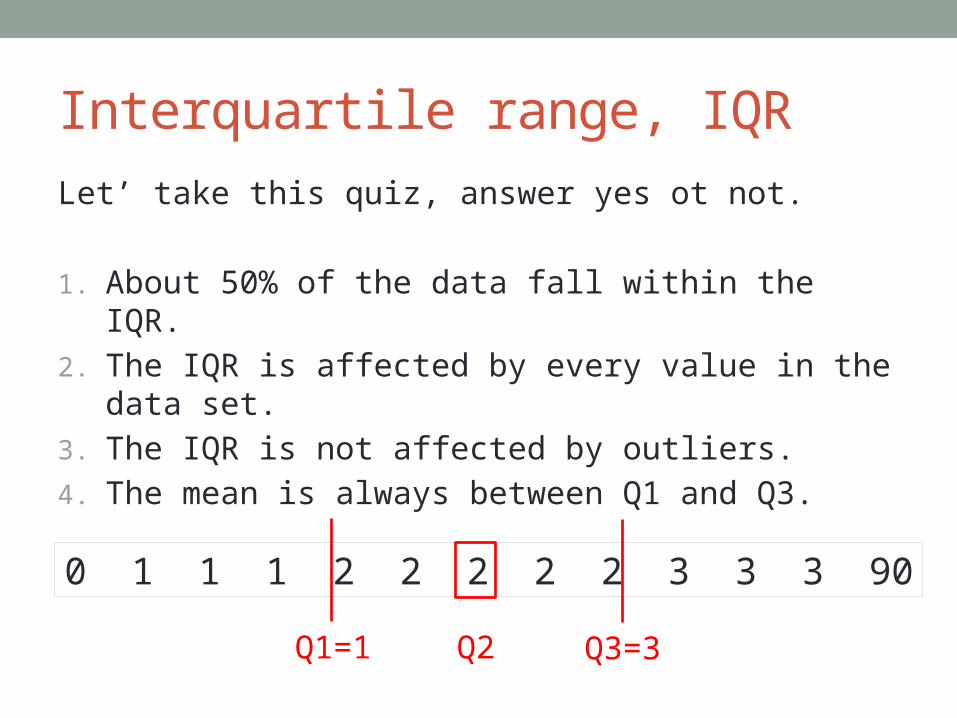
Interquartile range, IQR
Let’ take this quiz, answer yes ot not.
1. About 50% of the data fall within the IQR.
2. The IQR is affected by every value in the data set.
3. The IQR is not affected by outliers.
4. The mean is always between Q1 and Q3.
0 1 1 1 2 2 2 2 2 3 3 3 90
Q2Q1=1 Q3=3

Define outlierOR
Sample
$38,946
$43,420
$49,191
$50,430
$50,557
$52,580
$53,595
$54,135
$60,181
$10,000,000
What values are outliers for this data set?
1. $60,0002. $80,0003. $100,0004. $200,000

Problem with IQR
normal
bimodal
uniform

Options for measuring variability• Find the average distance between all pairs of data
values.• Find the average distance between each data value and
either the max or the min.• Find the average distance between each data value and
the mean.
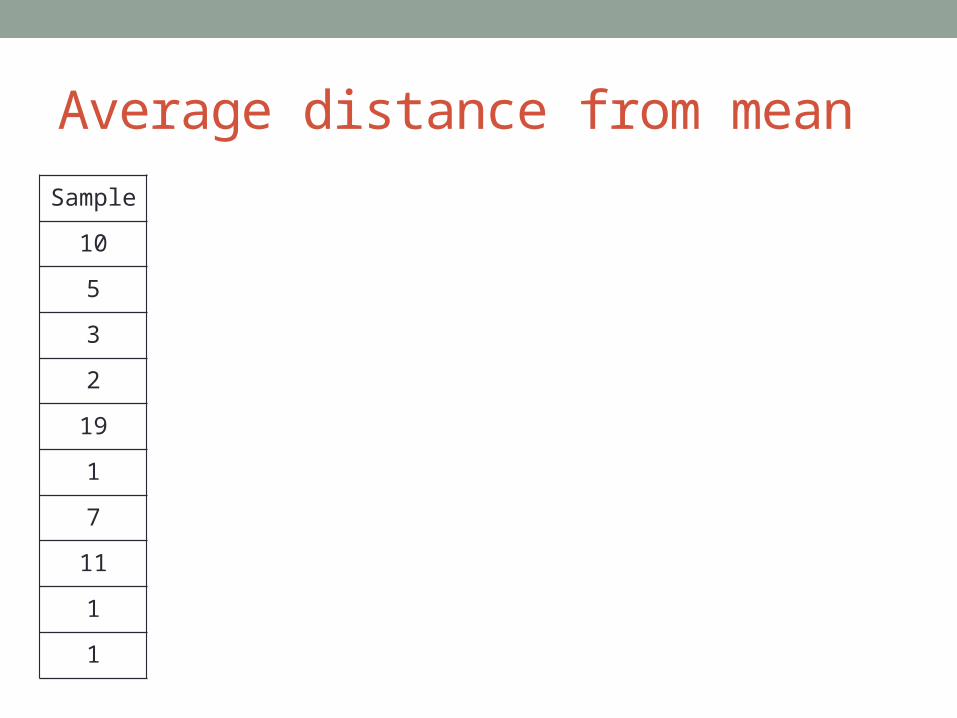
Average distance from meanSample
10
5
3
2
19
1
7
11
1
1
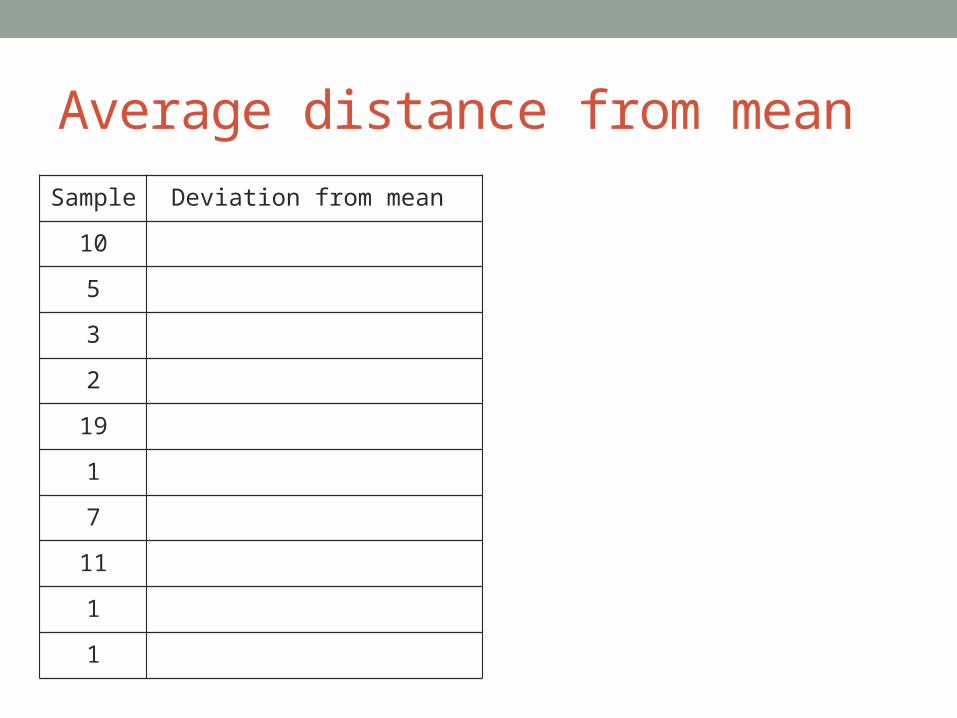
Average distance from meanSample Deviation from mean
10
5
3
2
19
1
7
11
1
1
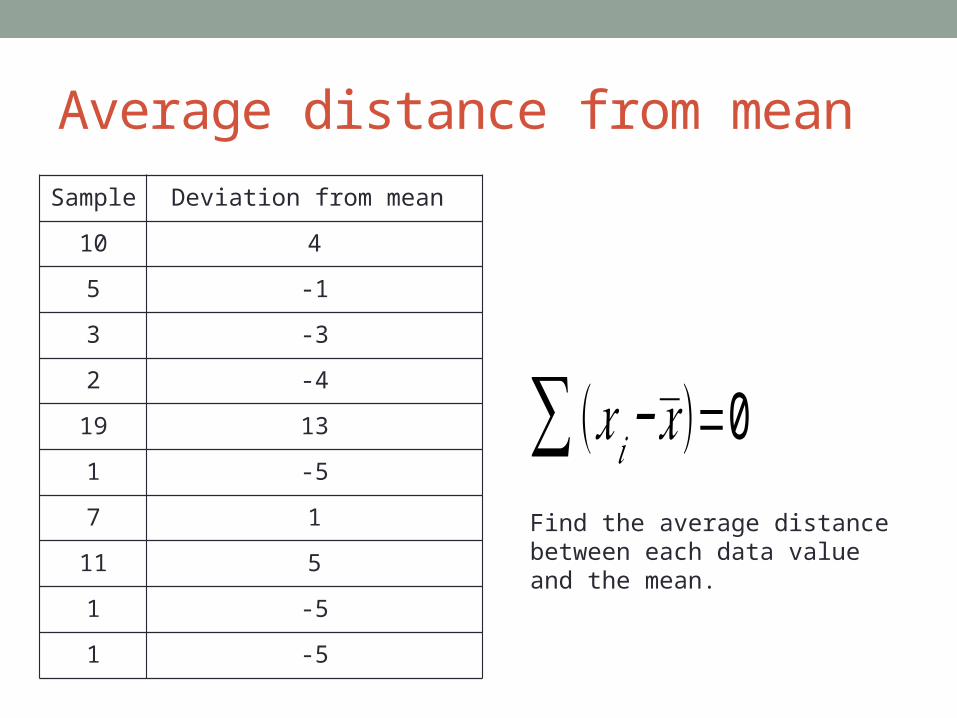
Average distance from meanSample Deviation from mean
10 4
5 -1
3 -3
2 -4
19 13
1 -5
7 1
11 5
1 -5
1 -5
∑ (𝑥 𝑖−𝑥 )=0Find the average distance between each data value and the mean.
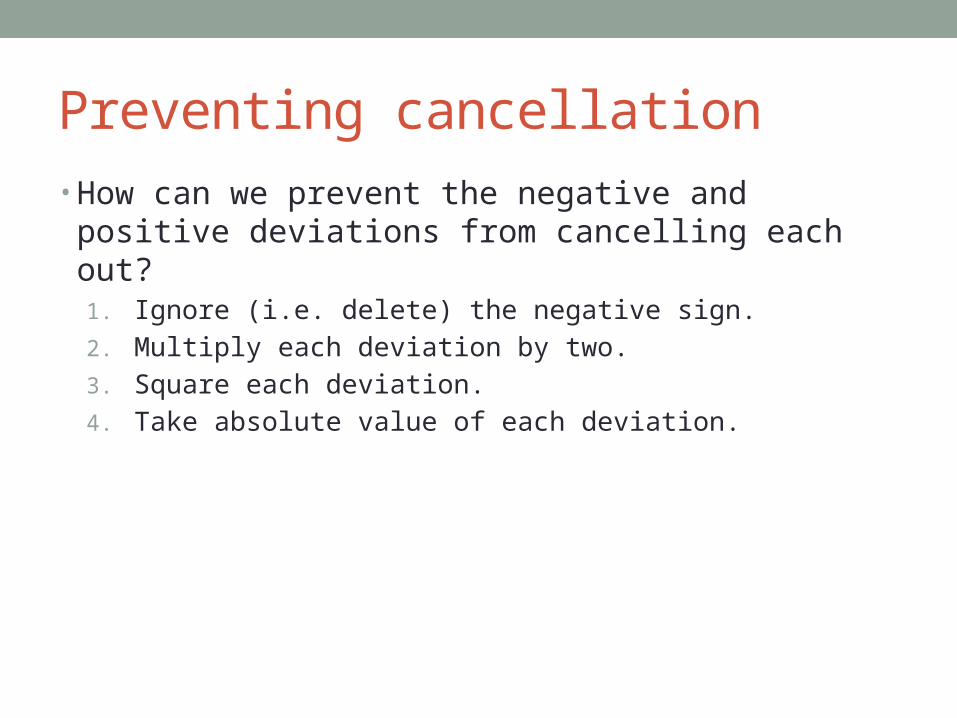
Preventing cancellation• How can we prevent the negative and positive deviations
from cancelling each out?1. Ignore (i.e. delete) the negative sign.
2. Multiply each deviation by two.
3. Square each deviation.
4. Take absolute value of each deviation.
![Fully Dynamic Betweenness Centrality Maintenance on ... · work analysis software such as SNAP [26], WebGraph [9], Gephi, NodeXL, and NetworkX. Betweenness centrality measures the](https://img.pdfslide.us/doc/110x75/5f8999eb65d3911b1622e646/fully-dynamic-betweenness-centrality-maintenance-on-work-analysis-software-such.jpg)

![Identifying Critical Autonomous Systems in the Internet...customer-cone size, alpha centrality and betweenness centrality [12]. One ma-jor observation is that the centrality measures](https://img.pdfslide.us/doc/110x75/612e2e121ecc51586942a65f/identifying-critical-autonomous-systems-in-the-internet-customer-cone-size.jpg)