Embed Size (px)
Citation preview
Topic:Statisticsofcentraltendency,dispersionandinferential&relationaltechniques3.4.2.4Statisticalskills
© Tutor2u Limited 2016 www.tutor2u.net
Whatyouneedtoknow:Measuresofcentraltendency:mean,modeandmedianMeasuresofdispersion:range,inter-quartilerangeandstandarddeviationInferentialandrelationalstatisticaltechniquestoincludeSpearman’srankcorrelationandChi-squaretestandtheapplicationofsignificancetests
Measuresofcentrality
Themean,medianandmodeareknownasmeasuresofcentrality:anaimtoidentifythemidpointinadatasetthroughstatisticalmeans.Eachdoesthisinaslightlydifferentwayandmaygiveadifferentanswerifthedatasetisaskewed(asymmetrical)distribution(seediagrambelow).
Mean:ThesumofallthedatadividedbythenumberofdatavaluesExample:8+7+3+9+11+4=42÷6=Meanof7.0
Median:ThemiddatapointinadataseriesorganisedinsequenceExample:257811141821222529(fivedatavalueseitherside)
Mode:ThemostfrequentlyoccurringdatavalueinaseriesExample:2244479999121213(‘9’occursfourtimes,soisthe‘mode’)
Whyaredifferentmethodsused?Thechoiceofmeasureofcentralitydependsonthetaskbeingcarriedout.Whilethemeandailytemperatureduringaparticularmonthmayindicatetheaverageforeaseofcomparisonwithothermonths,themodewouldindicatethemostfrequentlyexperienceddailytemperaturethroughoutthemonth,whichmightbemoreusefulinformationforfarmers.Whenstudyingmeasuresofwealthinacountry’spopulation,usingthemedianismorelikelytorepresentthemajorityofpeopleratherthanthemean–whichmaybehigherthanmostpeopleexperienceifasmallproportionofpeopleearnanexceedinglyhighincome.
InmeasuresofdispersionthemedianisusedwhencalculatingInterquartileRange,whilethemeanisusedwhencalculatingStandardDeviation.
SAM
PLE
Topic:Statisticsofcentraltendency,dispersionandinferential&relationaltechniques3.4.2.4Statisticalskills
© Tutor2u Limited 2016 www.tutor2u.net
MeasuresofdispersionThereareanumberofwaystodescribethedegreeofspreadofdata.Therange,andinterquartilerangearemeasuresof‘spread’inacollectionofdata.Theyarethemoststraightforwardofthe‘measuresofdispersion’.Tworiversmayhavethesame‘mean’depth,butonevariesconsiderablyovertheyearfromverylowtoveryhighlevels,whiletheotherhaslittlevariation.Thesemeasureshelpdescribethedegreeofdatavariance.RangeThesimplestdescriptionofvariationisastraightforwardmeasureofthedifferencebetweenthelargestandsmallestdatavalues(thedifferencebetweenthe‘highest’and‘lowest’levelofwaterinariver,forexample).Theproblemwithusingrangeisthattherecanbesomehighlyunusualresultsatthetwoextremes,knownasoutliers.Themajorityofreadingsmaybeclosetothemean,butthenaveryunusualeventmaycausethespreadtobemuchgreater.If,forinstanceaone-in-a-hundred-yearfloodraisesariverlevelsohighthatitsetsanewrecord,the‘range’wouldhavetoincludethisastheupperdatameasure.Butthesubsequentrangeofriverlevelwouldnotaccuratelydescribetheusualconditionsofflowlevelintheriver.Forthisreasonwemoreoftenuseameasurethatexcludespossibleoutliersatthetwoextremesandlookatthefiftypercentofresultseithersideofthemedian.ThisstatisticistheInterquartileRange.InterquartilerangeWhenweneedtodescribedatacollectedfromanareatocomparewithdatafromanotherarea,wemayusesomesortof‘average’tosummariseit.Wemayuse,forexample,the‘mean’pebblesizewehavemeasuredonabeachtocomparewiththemeanofanotherbeach.Butifwefindthetwomeansaresamethiscangiveaninaccurateinterpretationifwethenassumethepebblesonthetwobeachesaresimilar;the‘spread’ofpebblesononebeach,fromverysmalltoverylargemay,infact,bequitedifferentfromanotherbeachwherethepebblesizesareallveryclosetothemean.WhatistheInterquartileRange?Thisstatisticalmeasureusestheconceptofthe‘median’ratherthanthemean–themiddle-rankingvalueinarangeofdatarankedfromlargesttosmallest.Itthenfindsthemedianoftheupperhalf(UpperQuartile)andsubtractsthemedianofthelowerhalf(LowerQuartile)toproducethedifferencebetweenthequarterandthree-quartersvalue–knownastheInterquartileRange.Thisgivesanindicationofthe‘spread’ofthedataeithersideofthemedian.HowistheInterquartileRangecalculated?
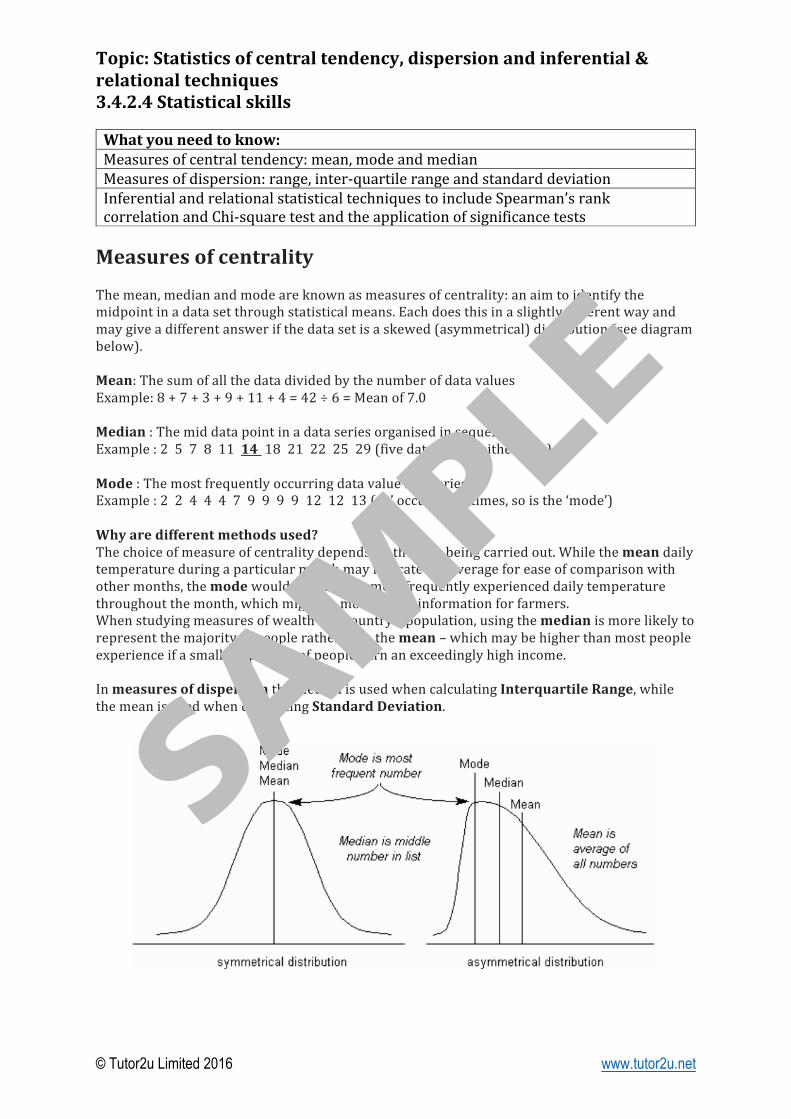
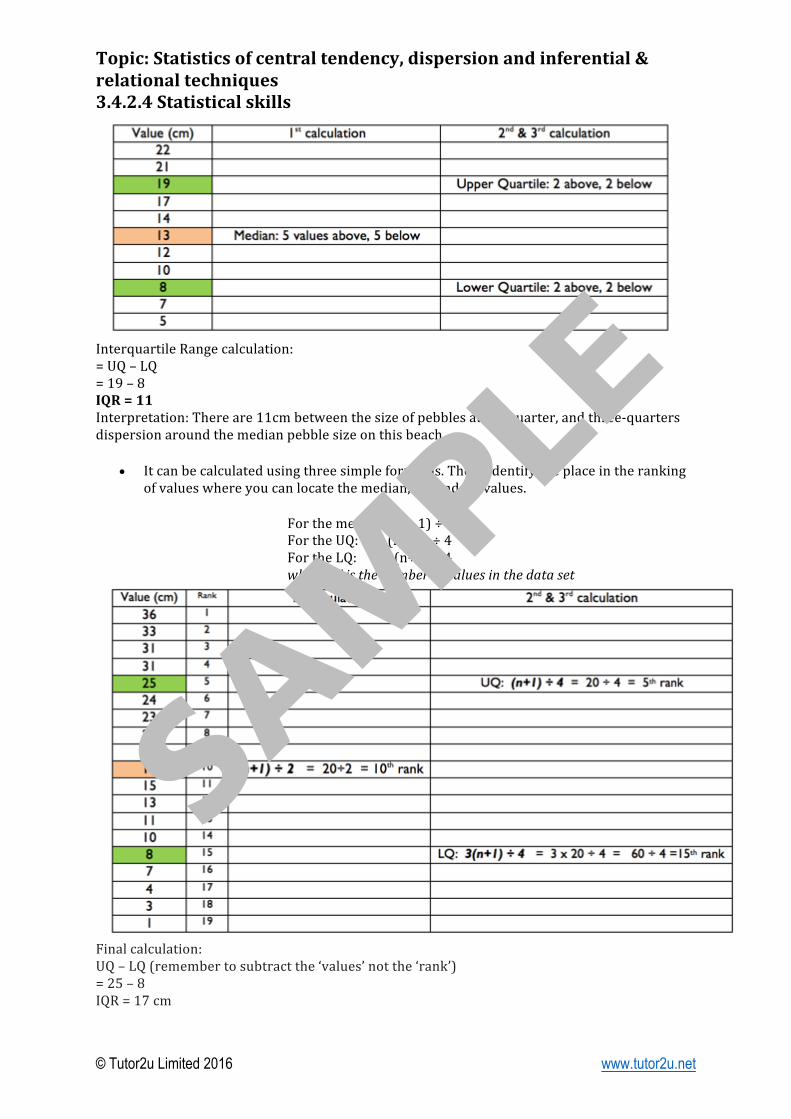
• Itcanbecalculatedmanuallybycountingoutthe‘half-way’point(median),andthenthe‘halfwaypointoftheupperhalf(UQ)andthehalfwaypointofthelowerhalf(LQ)andsubtractingtheLQvaluefromtheUQvalue:
Inthissimplifiedillustration,imaginewemeasured11pebblestakenfromabeachincm:
SAM
PLE
Topic:Statisticsofcentraltendency,dispersionandinferential&relationaltechniques3.4.2.4Statisticalskills
© Tutor2u Limited 2016 www.tutor2u.net
InterquartileRangecalculation:=UQ–LQ=19–8IQR=11Interpretation:Thereare11cmbetweenthesizeofpebblesatthequarter,andthree-quartersdispersionaroundthemedianpebblesizeonthisbeach.
• Itcanbecalculatedusingthreesimpleformulas.Theseidentifytheplaceintherankingofvalueswhereyoucanlocatethemedian,UQandLQvalues.
Forthemedian:(n+1)÷2FortheUQ:(n+1)÷4FortheLQ:3(n+1)÷4where‘n’isthenumberofvaluesinthedataset
Finalcalculation:UQ–LQ(remembertosubtractthe‘values’notthe‘rank’)=25–8IQR=17cm
SAM
PLE
Topic:Statisticsofcentraltendency,dispersionandinferential&relationaltechniques3.4.2.4Statisticalskills
© Tutor2u Limited 2016 www.tutor2u.net
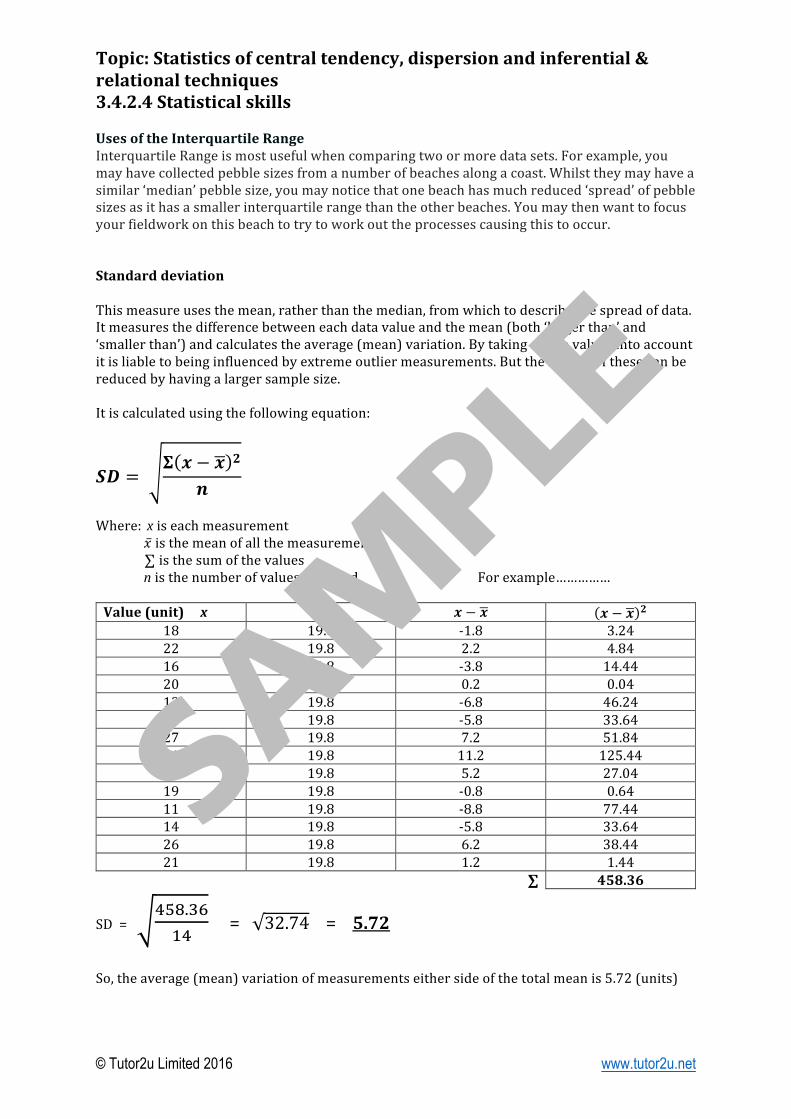
UsesoftheInterquartileRangeInterquartileRangeismostusefulwhencomparingtwoormoredatasets.Forexample,youmayhavecollectedpebblesizesfromanumberofbeachesalongacoast.Whilsttheymayhaveasimilar‘median’pebblesize,youmaynoticethatonebeachhasmuchreduced‘spread’ofpebblesizesasithasasmallerinterquartilerangethantheotherbeaches.Youmaythenwanttofocusyourfieldworkonthisbeachtotrytoworkouttheprocessescausingthistooccur.StandarddeviationThismeasureusesthemean,ratherthanthemedian,fromwhichtodescribethespreadofdata.Itmeasuresthedifferencebetweeneachdatavalueandthemean(both‘largerthan’and‘smallerthan’)andcalculatestheaverage(mean)variation.Bytakingallthevaluesintoaccountitisliabletobeinginfluencedbyextremeoutliermeasurements.Buttheimpactofthesecanbereducedbyhavingalargersamplesize.Itiscalculatedusingthefollowingequation:
𝑺𝑫 = 𝚺 𝒙 − 𝒙 𝟐
𝒏
Where:xiseachmeasurement 𝑥isthemeanofallthemeasurements ∑isthesumofthevalues nisthenumberofvaluesobtainedForexample……………Value(unit)x 𝒙 𝒙 − 𝒙 𝒙 − 𝒙 𝟐
18 19.8 -1.8 3.2422 19.8 2.2 4.8416 19.8 -3.8 14.4420 19.8 0.2 0.0413 19.8 -6.8 46.2414 19.8 -5.8 33.6427 19.8 7.2 51.8431 19.8 11.2 125.4425 19.8 5.2 27.0419 19.8 -0.8 0.6411 19.8 -8.8 77.4414 19.8 -5.8 33.6426 19.8 6.2 38.4421 19.8 1.2 1.44
∑ 458.36
SD=+,-./01+
= 32.74=5.72So,theaverage(mean)variationofmeasurementseithersideofthetotalmeanis5.72(units)
SAM
PLE
Topic:Statisticsofcentraltendency,dispersionandinferential&relationaltechniques3.4.2.4Statisticalskills
© Tutor2u Limited 2016 www.tutor2u.net
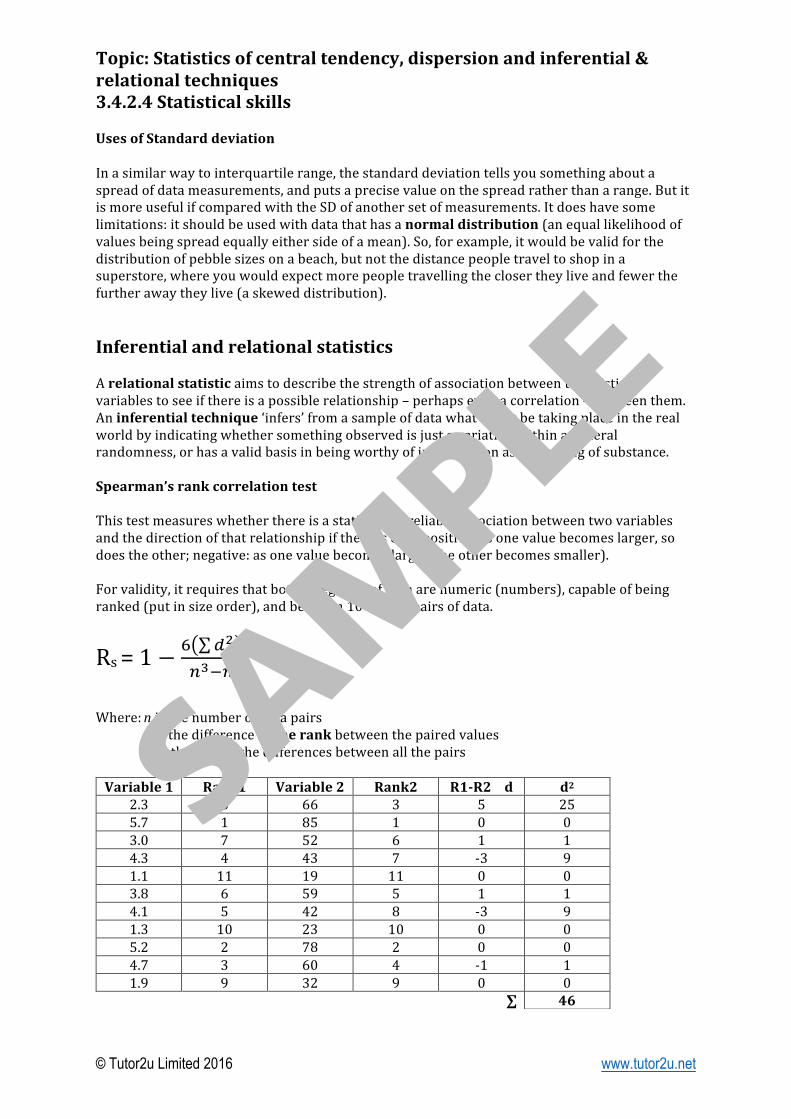
UsesofStandarddeviationInasimilarwaytointerquartilerange,thestandarddeviationtellsyousomethingaboutaspreadofdatameasurements,andputsaprecisevalueonthespreadratherthanarange.ButitismoreusefulifcomparedwiththeSDofanothersetofmeasurements.Itdoeshavesomelimitations:itshouldbeusedwithdatathathasanormaldistribution(anequallikelihoodofvaluesbeingspreadequallyeithersideofamean).So,forexample,itwouldbevalidforthedistributionofpebblesizesonabeach,butnotthedistancepeopletraveltoshopinasuperstore,whereyouwouldexpectmorepeopletravellingtheclosertheyliveandfewerthefurtherawaytheylive(askeweddistribution).InferentialandrelationalstatisticsArelationalstatisticaimstodescribethestrengthofassociationbetweentwodistinctvariablestoseeifthereisapossiblerelationship–perhapsevenacorrelation–betweenthem.Aninferentialtechnique‘infers’fromasampleofdatawhatmightbetakingplaceintherealworldbyindicatingwhethersomethingobservedisjustavariationwithinageneralrandomness,orhasavalidbasisinbeingworthyofinvestigationassomethingofsubstance.Spearman’srankcorrelationtestThistestmeasureswhetherthereisastatisticallyreliableassociationbetweentwovariablesandthedirectionofthatrelationshipifthereisone(positive:asonevaluebecomeslarger,sodoestheother;negative:asonevaluebecomeslarger,theotherbecomessmaller).Forvalidity,itrequiresthatbothcategoriesofdataarenumeric(numbers),capableofbeingranked(putinsizeorder),andbetween10and30pairsofdata.
Rs=1 −0 78
9:;9
Where:nisthenumberofdatapairs disthedifferenceintherankbetweenthepairedvalues ∑isthesumofthedifferencesbetweenallthepairsVariable1 Rank1 Variable2 Rank2 R1-R2d d2
2.3 8 66 3 5 255.7 1 85 1 0 03.0 7 52 6 1 14.3 4 43 7 -3 91.1 11 19 11 0 03.8 6 59 5 1 14.1 5 42 8 -3 91.3 10 23 10 0 05.2 2 78 2 0 04.7 3 60 4 -1 11.9 9 32 9 0 0
∑ 46
SAM
PLE
Topic:Statisticsofcentraltendency,dispersionandinferential&relationaltechniques3.4.2.4Statisticalskills
© Tutor2u Limited 2016 www.tutor2u.net
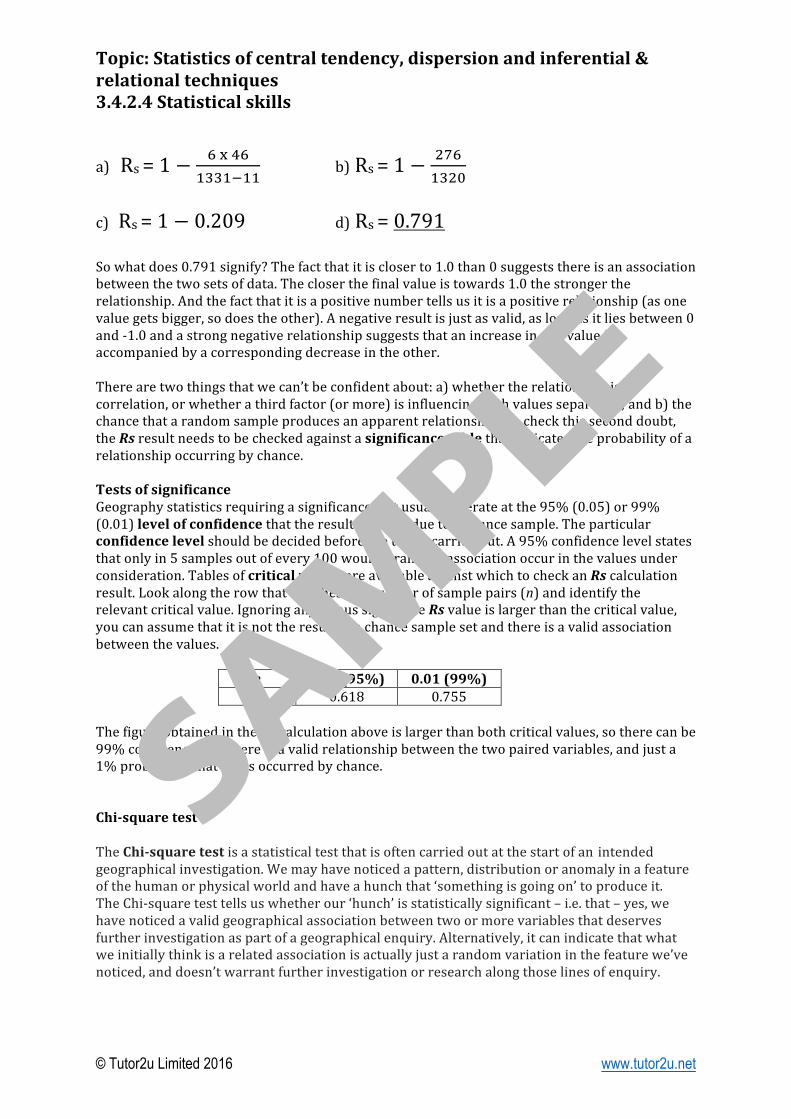
a)Rs=1 − 0<+01//1;11
b)Rs=1 − =>01/=?
c)Rs=1 − 0.209 d)Rs=0.791Sowhatdoes0.791signify?Thefactthatitiscloserto1.0than0suggeststhereisanassociationbetweenthetwosetsofdata.Thecloserthefinalvalueistowards1.0thestrongertherelationship.Andthefactthatitisapositivenumbertellsusitisapositiverelationship(asonevaluegetsbigger,sodoestheother).Anegativeresultisjustasvalid,aslongasitliesbetween0and-1.0andastrongnegativerelationshipsuggeststhatanincreaseinonevalueisaccompaniedbyacorrespondingdecreaseintheother.Therearetwothingsthatwecan’tbeconfidentabout:a)whethertherelationshipisacorrelation,orwhetherathirdfactor(ormore)isinfluencingbothvaluesseparately;andb)thechancethatarandomsampleproducesanapparentrelationship.Tocheckthisseconddoubt,theRsresultneedstobecheckedagainstasignificancetablethatindicatestheprobabilityofarelationshipoccurringbychance.TestsofsignificanceGeographystatisticsrequiringasignificancetestusuallyoperateatthe95%(0.05)or99%(0.01)levelofconfidencethattheresultsarenotduetoachancesample.Theparticularconfidencelevelshouldbedecidedbeforethetestiscarriedout.A95%confidencelevelstatesthatonlyin5samplesoutofevery100wouldarandomassociationoccurinthevaluesunderconsideration.TablesofcriticalvaluesareavailableagainstwhichtocheckanRscalculationresult.Lookalongtherowthatmatchesthenumberofsamplepairs(n)andidentifytherelevantcriticalvalue.Ignoringanyminussign,iftheRsvalueislargerthanthecriticalvalue,youcanassumethatitisnottheresultofachancesamplesetandthereisavalidassociationbetweenthevalues.
n 0.05(95%) 0.01(99%)11 0.618 0.755
ThefigureobtainedintheRscalculationaboveislargerthanbothcriticalvalues,sotherecanbe99%confidencethatthereisavalidrelationshipbetweenthetwopairedvariables,andjusta1%probabilitythatithasoccurredbychance.Chi-squaretestTheChi-squaretestisastatisticaltestthatisoftencarriedoutatthestartofan intendedgeographicalinvestigation.Wemayhavenoticedapattern,distributionoranomalyinafeatureofthehumanorphysicalworldandhaveahunchthat‘somethingisgoingon’toproduceit.TheChi-squaretesttellsuswhetherour‘hunch’isstatisticallysignificant–i.e.that–yes,wehavenoticedavalidgeographicalassociationbetweentwoormorevariablesthatdeservesfurtherinvestigationaspartofageographicalenquiry.Alternatively,itcanindicatethatwhatweinitiallythinkisarelatedassociationisactuallyjustarandomvariationinthefeaturewe’venoticed,anddoesn’twarrantfurtherinvestigationorresearchalongthoselinesofenquiry.
SAM
PLE
Topic:Statisticsofcentraltendency,dispersionandinferential&relationaltechniques3.4.2.4Statisticalskills
© Tutor2u Limited 2016 www.tutor2u.net
Theequationcompareswhathasbeenmeasured(Observed)intheoccurrenceofthefeature,againstwhatmaybeanticipated(Expected)‘if’thefeaturewasrandomlyoccurring.(Note:thereshouldbenofewerthan5observationsinanyofthecategoriestousethistechnique.)First,establishaHypothesisandthenconvertittoaNullHypothesis.(NullHypothesis:whydoweneedit?Well,intheinvestigativeprocessit’snotpossibleto‘prove’somethingwith100%certainty–weonlygettoseeandexperienceapartofthewholeworld,soitmaybethatwhatwethinkwe’ve‘proved’inoneplaceis‘disproved’inanother.Butwecan‘disprove’assumptionscompletely-byfindingacontradictoryoccurrenceofit.Wecannever‘prove’ahypothesisfully,butwecanfully‘disprove’itsconverse–thenullhypothesis.Ifourstatisticaltestsallowustodisprovethenullhypothesis,thenwecan‘accept’thatourhypothesishasvalidity.Butonlytotheextentthatwecanhaveconfidencethatoursampleislargeenoughandvalid.Thisleadsontotheconceptsof‘confidencelevels’and‘criticalvalues’).
TheChi-squareequation
𝝌𝟐 = 𝑶 − 𝑬 𝟐
𝑬
Chi-squaretestexampleonwoodlanddistributionoveraregionalarea
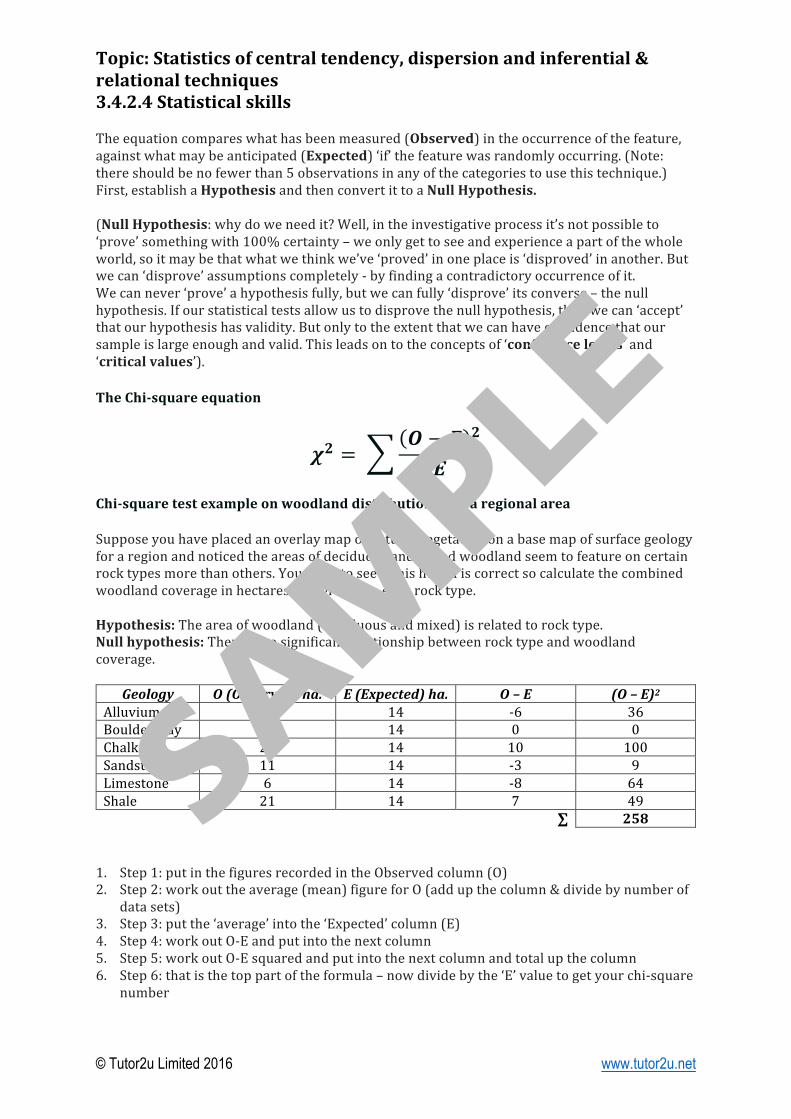
Supposeyouhaveplacedanoverlaymapofnaturalvegetationonabasemapofsurfacegeologyforaregionandnoticedtheareasofdeciduousandmixedwoodlandseemtofeatureoncertainrocktypesmorethanothers.Youwanttoseeifthishunchiscorrectsocalculatethecombinedwoodlandcoverageinhectaresthatgrowsoneachrocktype.Hypothesis:Theareaofwoodland(deciduousandmixed)isrelatedtorocktype.Nullhypothesis:Thereisnosignificantrelationshipbetweenrocktypeandwoodlandcoverage.
Geology O(Observed)ha. E(Expected)ha. O–E (O–E)2Alluvium 8 14 -6 36Boulderclay 14 14 0 0Chalk 24 14 10 100Sandstone 11 14 -3 9Limestone 6 14 -8 64Shale 21 14 7 49 ∑ 258
1. Step1:putinthefiguresrecordedintheObservedcolumn(O)2. Step2:workouttheaverage(mean)figureforO(addupthecolumn÷bynumberof
datasets)3. Step3:putthe‘average’intothe‘Expected’column(E)4. Step4:workoutO-Eandputintothenextcolumn5. Step5:workoutO-Esquaredandputintothenextcolumnandtotalupthecolumn6. Step6:thatisthetoppartoftheformula–nowdividebythe‘E’valuetogetyourchi-square
number
SAM
PLE
Topic:Statisticsofcentraltendency,dispersionandinferential&relationaltechniques3.4.2.4Statisticalskills
© Tutor2u Limited 2016 www.tutor2u.net
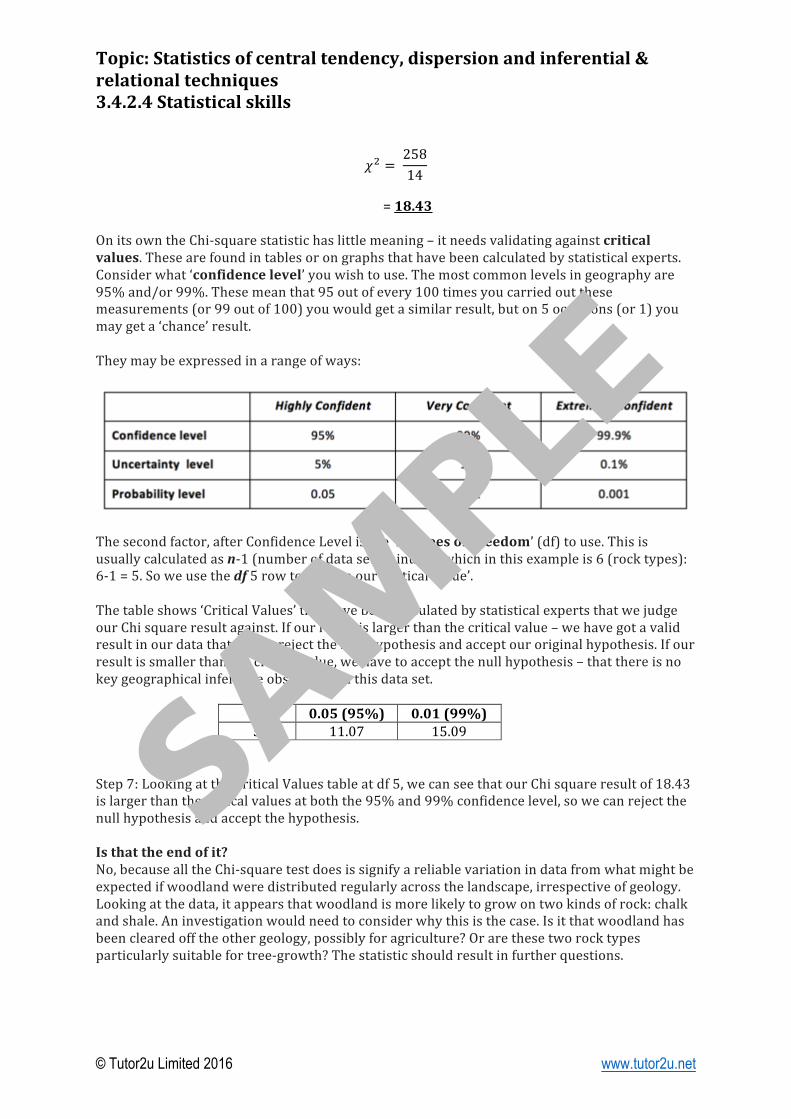
𝜒= = 25814
=18.43OnitsowntheChi-squarestatistichaslittlemeaning–itneedsvalidatingagainstcriticalvalues.Thesearefoundintablesorongraphsthathavebeencalculatedbystatisticalexperts.Considerwhat‘confidencelevel’youwishtouse.Themostcommonlevelsingeographyare95%and/or99%.Thesemeanthat95outofevery100timesyoucarriedoutthesemeasurements(or99outof100)youwouldgetasimilarresult,buton5occasions(or1)youmaygeta‘chance’result.Theymaybeexpressedinarangeofways:
Thesecondfactor,afterConfidenceLevelisthe‘DegreesofFreedom’(df)touse.Thisisusuallycalculatedasn-1(numberofdatasetsminus1)whichinthisexampleis6(rocktypes):6-1=5.Soweusethedf5rowtolookupour‘CriticalValue’.Thetableshows‘CriticalValues’thathavebeencalculatedbystatisticalexpertsthatwejudgeourChisquareresultagainst.Ifourresultislargerthanthecriticalvalue–wehavegotavalidresultinourdatathatletsusrejectthenullhypothesisandacceptouroriginalhypothesis.Ifourresultissmallerthanthecriticalvalue,wehavetoacceptthenullhypothesis–thatthereisnokeygeographicalinferenceobservableinthisdataset.
df 0.05(95%) 0.01(99%)5 11.07 15.09
Step7:LookingattheCriticalValuestableatdf5,wecanseethatourChisquareresultof18.43islargerthanthecriticalvaluesatboththe95%and99%confidencelevel,sowecanrejectthenullhypothesisandacceptthehypothesis.Isthattheendofit?No,becausealltheChi-squaretestdoesissignifyareliablevariationindatafromwhatmightbeexpectedifwoodlandweredistributedregularlyacrossthelandscape,irrespectiveofgeology.Lookingatthedata,itappearsthatwoodlandismorelikelytogrowontwokindsofrock:chalkandshale.Aninvestigationwouldneedtoconsiderwhythisisthecase.Isitthatwoodlandhasbeenclearedofftheothergeology,possiblyforagriculture?Orarethesetworocktypesparticularlysuitablefortree-growth?Thestatisticshouldresultinfurtherquestions.
SAM
PLE
Geographystatisticaltechniques
© Tutor2u Limited 2016 www.tutor2u.net
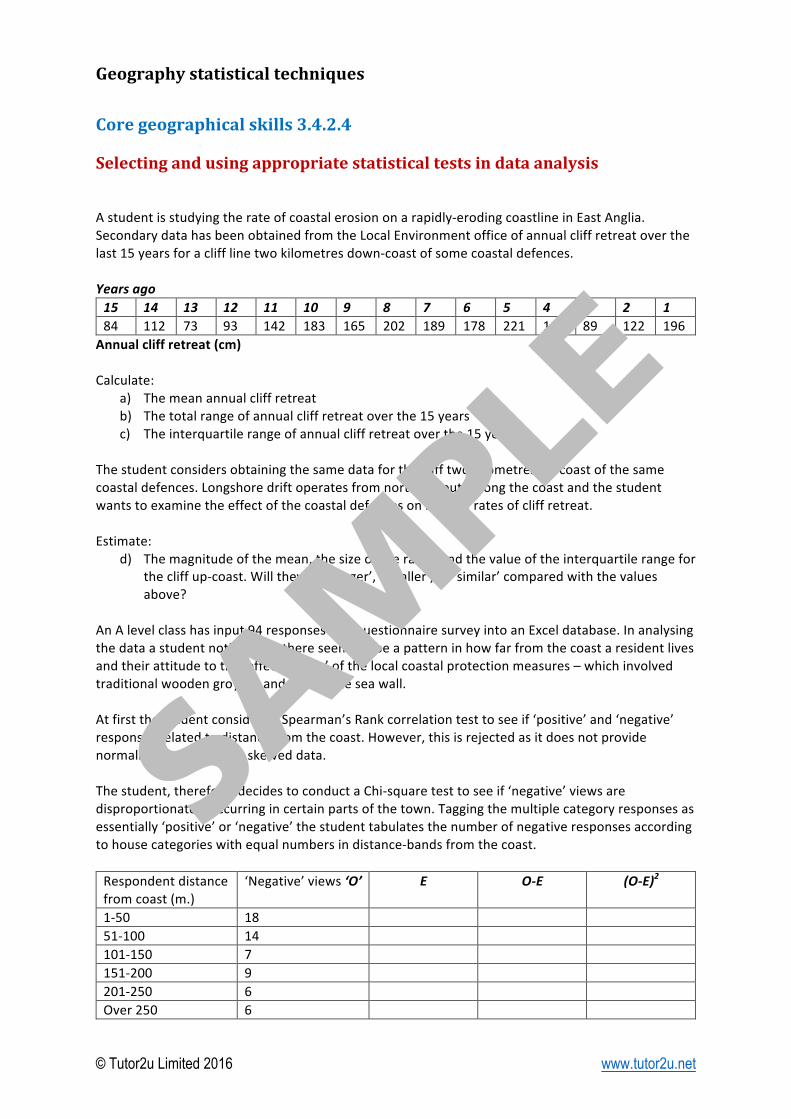
Coregeographicalskills3.4.2.4SelectingandusingappropriatestatisticaltestsindataanalysisAstudentisstudyingtherateofcoastalerosiononarapidly-erodingcoastlineinEastAnglia.SecondarydatahasbeenobtainedfromtheLocalEnvironmentofficeofannualcliffretreatoverthelast15yearsforaclifflinetwokilometresdown-coastofsomecoastaldefences.Yearsago15 14 13 12 11 10 9 8 7 6 5 4 3 2 184 112 73 93 142 183 165 202 189 178 221 143 89 122 196
Annualcliffretreat(cm)Calculate:
a) Themeanannualcliffretreatb) Thetotalrangeofannualcliffretreatoverthe15yearsc) Theinterquartilerangeofannualcliffretreatoverthe15years
Thestudentconsidersobtainingthesamedatafortheclifftwokilometresup-coastofthesamecoastaldefences.Longshoredriftoperatesfromnorthtosouthalongthecoastandthestudentwantstoexaminetheeffectofthecoastaldefencesonrelativeratesofcliffretreat.Estimate:
d) Themagnitudeofthemean,thesizeoftherangeandthevalueoftheinterquartilerangeforthecliffup-coast.Willtheywill‘larger’,‘smaller’,or‘similar’comparedwiththevaluesabove?
AnAlevelclasshasinput94responsestoaquestionnairesurveyintoanExceldatabase.Inanalysingthedataastudentnoticesthatthereseemstobeapatterninhowfarfromthecoastaresidentlivesandtheirattitudetothe‘effectiveness’ofthelocalcoastalprotectionmeasures–whichinvolvedtraditionalwoodengroynesandaconcreteseawall.AtfirstthestudentconsidersaSpearman’sRankcorrelationtesttoseeif‘positive’and‘negative’responsesrelatedtodistancefromthecoast.However,thisisrejectedasitdoesnotprovidenormallydistributed,butskeweddata.Thestudent,therefore,decidestoconductaChi-squaretesttoseeif‘negative’viewsaredisproportionatelyoccurringincertainpartsofthetown.Taggingthemultiplecategoryresponsesasessentially‘positive’or‘negative’thestudenttabulatesthenumberofnegativeresponsesaccordingtohousecategorieswithequalnumbersindistance-bandsfromthecoast.Respondentdistancefromcoast(m.)
‘Negative’views‘O’ E O-E (O-E)2
1-50 18 51-100 14 101-150 7 151-200 9 201-250 6 Over250 6
SAM
PLE
Geographystatisticaltechniques
© Tutor2u Limited 2016 www.tutor2u.net
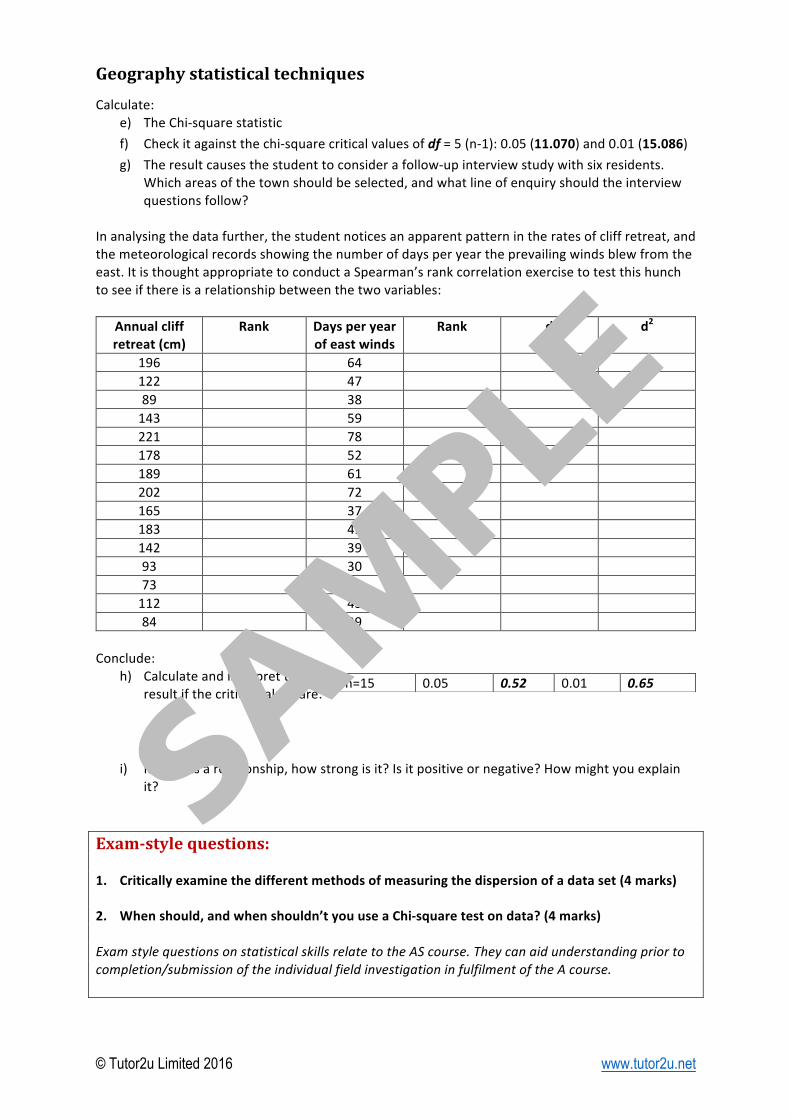
Calculate:e) TheChi-squarestatistic
f) Checkitagainstthechi-squarecriticalvaluesofdf=5(n-1):0.05(11.070)and0.01(15.086)
g) Theresultcausesthestudenttoconsiderafollow-upinterviewstudywithsixresidents.Whichareasofthetownshouldbeselected,andwhatlineofenquiryshouldtheinterviewquestionsfollow?
Inanalysingthedatafurther,thestudentnoticesanapparentpatternintheratesofcliffretreat,andthemeteorologicalrecordsshowingthenumberofdaysperyeartheprevailingwindsblewfromtheeast.ItisthoughtappropriatetoconductaSpearman’srankcorrelationexercisetotestthishunchtoseeifthereisarelationshipbetweenthetwovariables:
Annualcliffretreat(cm)
Rank Daysperyearofeastwinds
Rank d d2
196 64 122 47 89 38 143 59 221 78 178 52 189 61 202 72 165 37 183 49 142 39 93 30 73 38 112 43 84 29
Conclude:
h) CalculateandinterprettheRsresultifthecriticalvaluesare:
i) Ifthereisarelationship,howstrongisit?Isitpositiveornegative?Howmightyouexplainit?
Exam-stylequestions:1. Criticallyexaminethedifferentmethodsofmeasuringthedispersionofadataset(4marks)2. Whenshould,andwhenshouldn’tyouuseaChi-squaretestondata?(4marks)ExamstylequestionsonstatisticalskillsrelatetotheAScourse.Theycanaidunderstandingpriortocompletion/submissionoftheindividualfieldinvestigationinfulfilmentoftheAcourse.
n=15 0.05 0.52 0.01 0.65
SAM
PLE
Geographystatisticaltechniques
© Tutor2u Limited 2016 www.tutor2u.net
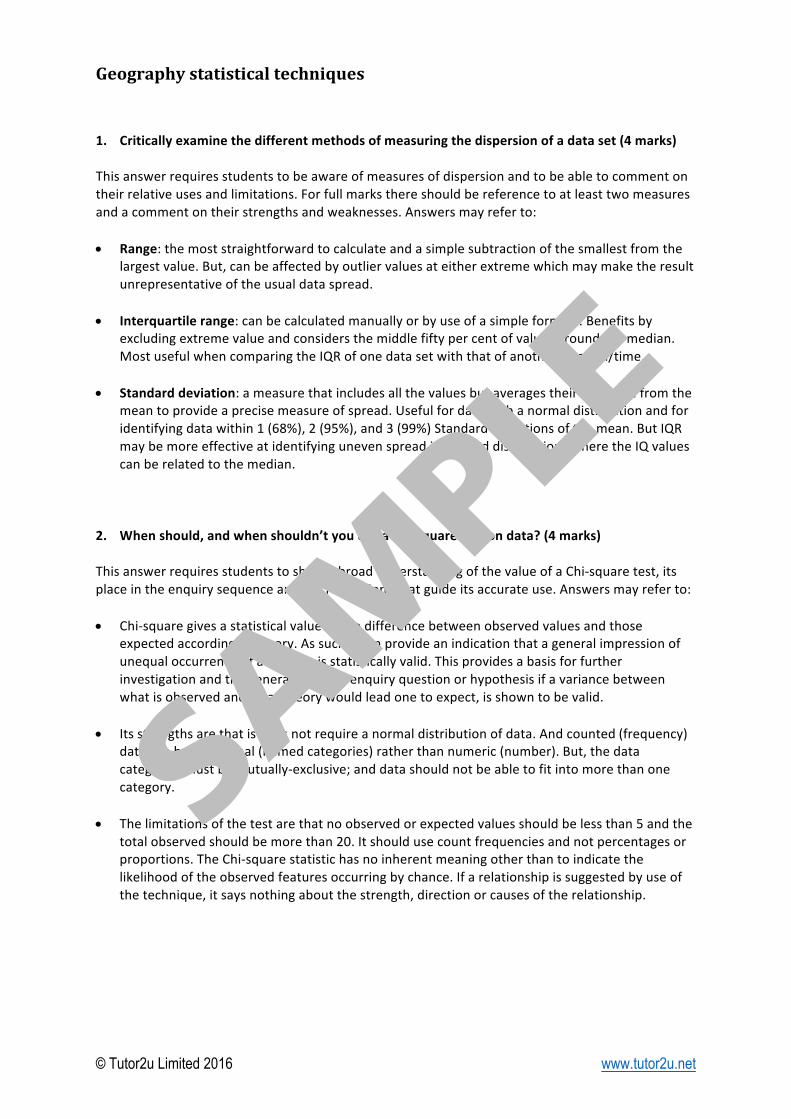
1. Criticallyexaminethedifferentmethodsofmeasuringthedispersionofadataset(4marks)Thisanswerrequiresstudentstobeawareofmeasuresofdispersionandtobeabletocommentontheirrelativeusesandlimitations.Forfullmarksthereshouldbereferencetoatleasttwomeasuresandacommentontheirstrengthsandweaknesses.Answersmayreferto:• Range:themoststraightforwardtocalculateandasimplesubtractionofthesmallestfromthe
largestvalue.But,canbeaffectedbyoutliervaluesateitherextremewhichmaymaketheresultunrepresentativeoftheusualdataspread.
• Interquartilerange:canbecalculatedmanuallyorbyuseofasimpleformula.Benefitsby
excludingextremevalueandconsidersthemiddlefiftypercentofvaluesaroundthemedian.MostusefulwhencomparingtheIQRofonedatasetwiththatofanotherlocation/time.
• Standarddeviation:ameasurethatincludesallthevaluesbutaveragestheirdeviationfromthe
meantoprovideaprecisemeasureofspread.Usefulfordatawithanormaldistributionandforidentifyingdatawithin1(68%),2(95%),and3(99%)StandardDeviationsofthemean.ButIQRmaybemoreeffectiveatidentifyingunevenspreadinskeweddistributionswheretheIQvaluescanberelatedtothemedian.
2. Whenshould,andwhenshouldn’tyouuseaChi-squaretestondata?(4marks)
ThisanswerrequiresstudentstoshowabroadunderstandingofthevalueofaChi-squaretest,itsplaceintheenquirysequenceandtherestrictionsthatguideitsaccurateuse.Answersmayreferto:• Chi-squaregivesastatisticalvaluetothedifferencebetweenobservedvaluesandthose
expectedaccordingtotheory.Assuchitcanprovideanindicationthatageneralimpressionofunequaloccurrenceofavariableisstatisticallyvalid.Thisprovidesabasisforfurtherinvestigationandthegenerationofanenquiryquestionorhypothesisifavariancebetweenwhatisobservedandwhattheorywouldleadonetoexpect,isshowntobevalid.
• Itsstrengthsarethatisdoesnotrequireanormaldistributionofdata.Andcounted(frequency)
datacanbeinnominal(namedcategories)ratherthannumeric(number).But,thedatacategoriesmustbemutually-exclusive;anddatashouldnotbeabletofitintomorethanonecategory.
• Thelimitationsofthetestarethatnoobservedorexpectedvaluesshouldbelessthan5andthe
totalobservedshouldbemorethan20.Itshouldusecountfrequenciesandnotpercentagesorproportions.TheChi-squarestatistichasnoinherentmeaningotherthantoindicatethelikelihoodoftheobservedfeaturesoccurringbychance.Ifarelationshipissuggestedbyuseofthetechnique,itsaysnothingaboutthestrength,directionorcausesoftherelationship.
SAM
PLE
Statisticaltechniques3.4.2.4
© Tutor2u Limited 2016 www.tutor2u.net
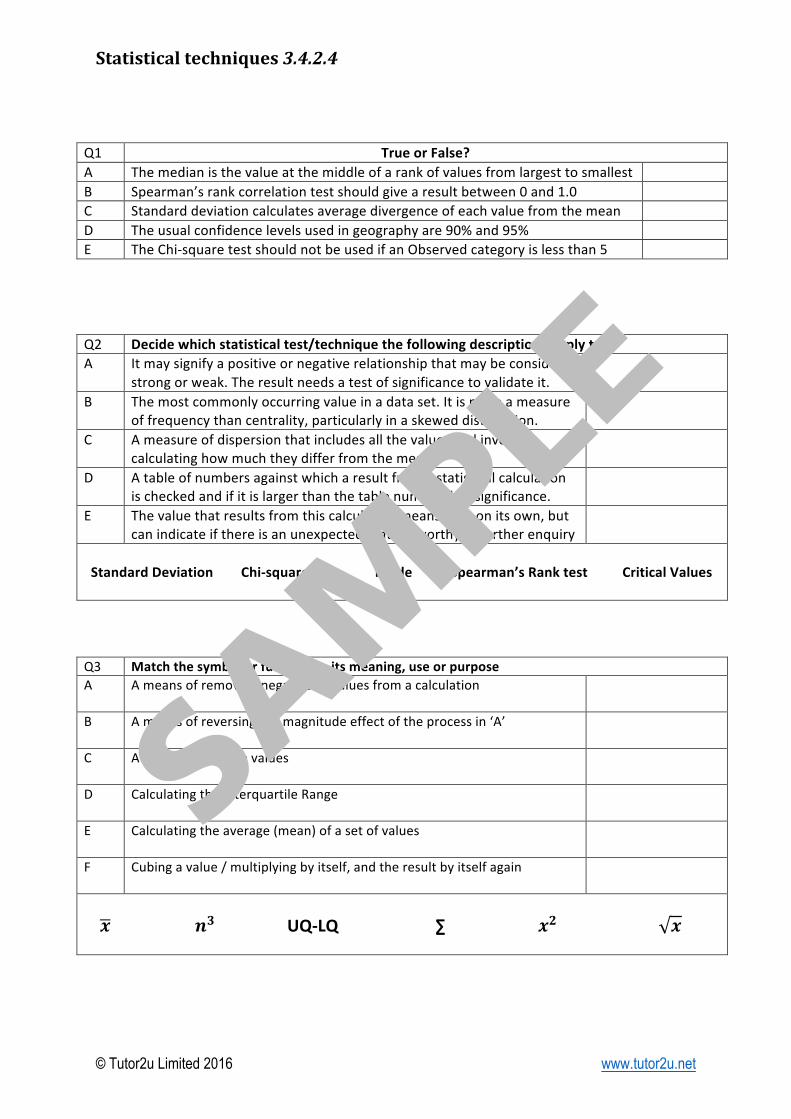
Q1 TrueorFalse?A Themedianisthevalueatthemiddleofarankofvaluesfromlargesttosmallest B Spearman’srankcorrelationtestshouldgivearesultbetween0and1.0 C Standarddeviationcalculatesaveragedivergenceofeachvaluefromthemean D Theusualconfidencelevelsusedingeographyare90%and95% E TheChi-squaretestshouldnotbeusedifanObservedcategoryislessthan5
Q2 Decidewhichstatisticaltest/techniquethefollowingdescriptionsapplytoA Itmaysignifyapositiveornegativerelationshipthatmaybeconsidered
strongorweak.Theresultneedsatestofsignificancetovalidateit.
B Themostcommonlyoccurringvalueinadataset.Itismoreameasureoffrequencythancentrality,particularlyinaskeweddistribution.
C Ameasureofdispersionthatincludesallthevaluesandinvolvescalculatinghowmuchtheydifferfromthemean.
D Atableofnumbersagainstwhicharesultfromastatisticalcalculationischeckedandifitislargerthanthetablenumber,hassignificance.
E Thevaluethatresultsfromthiscalculationmeanslittleonitsown,butcanindicateifthereisanunexpectedfeatureworthyoffurtherenquiry
StandardDeviationChi-squaretestModeSpearman’sRanktestCriticalValues
Q3 Matchthesymbolorfunctiontoitsmeaning,useorpurposeA Ameansofremovingnegative(-)valuesfromacalculation
B Ameansofreversingthemagnitudeeffectoftheprocessin‘A’
C Atotallingofallthevalues
D CalculatingtheInterquartileRange
E Calculatingtheaverage(mean)ofasetofvalues
F Cubingavalue/multiplyingbyitself,andtheresultbyitselfagain
𝒙𝒏𝟑UQ-LQ∑𝒙𝟐 𝒙
SAM
PLE
Statisticaltechniques3.4.2.4
© Tutor2u Limited 2016 www.tutor2u.net
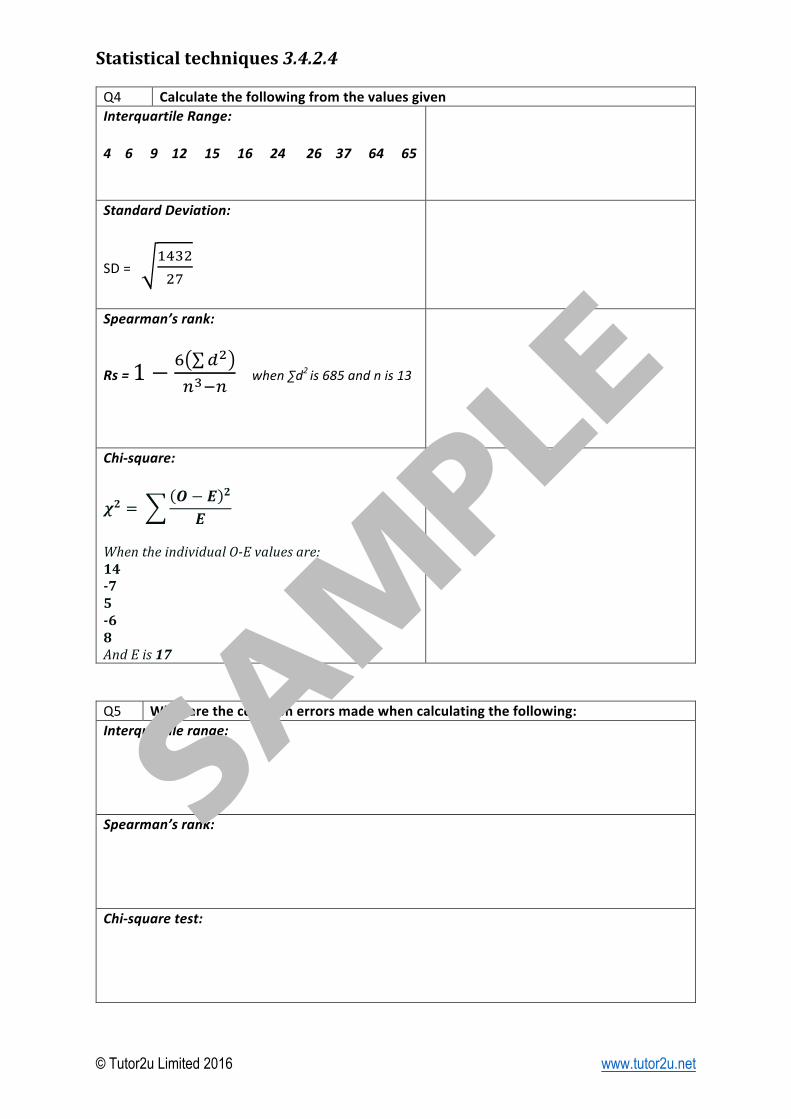
Q4 CalculatethefollowingfromthevaluesgivenInterquartileRange:4691215162426376465
StandardDeviation:
SD=%&'(()
Spearman’srank:
Rs=1 − , -.
/01/when∑d2is685andnis13
Chi-square:
𝝌𝟐 = 𝑶 − 𝑬 𝟐
𝑬 WhentheindividualO-Evaluesare:14-75-68AndEis17
Q5 Whatarethecommonerrorsmadewhencalculatingthefollowing:Interquartilerange:Spearman’srank:Chi-squaretest:
SAM
PLE
Statisticaltechniques3.4.2.4ANSWERS
© Tutor2u Limited 2016 www.tutor2u.net
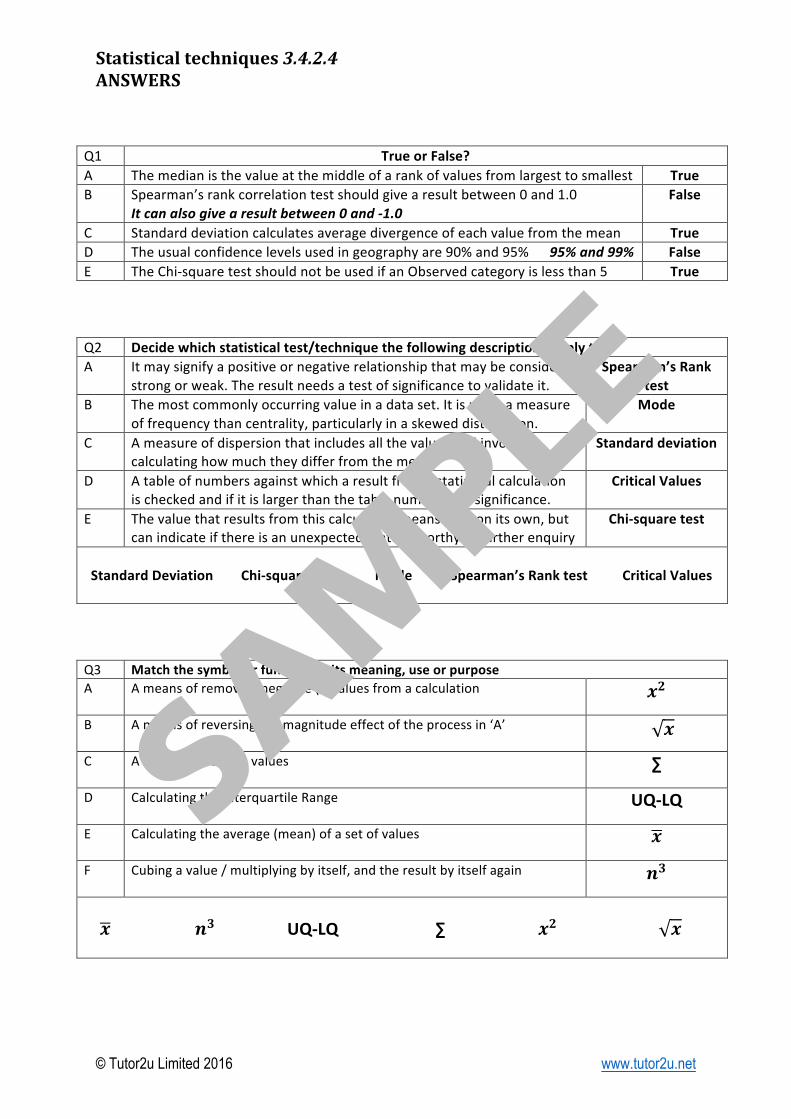
Q1 TrueorFalse?A Themedianisthevalueatthemiddleofarankofvaluesfromlargesttosmallest TrueB Spearman’srankcorrelationtestshouldgivearesultbetween0and1.0
Itcanalsogivearesultbetween0and-1.0False
C Standarddeviationcalculatesaveragedivergenceofeachvaluefromthemean TrueD Theusualconfidencelevelsusedingeographyare90%and95%95%and99% FalseE TheChi-squaretestshouldnotbeusedifanObservedcategoryislessthan5 True
Q2 Decidewhichstatisticaltest/techniquethefollowingdescriptionsapplytoA Itmaysignifyapositiveornegativerelationshipthatmaybeconsidered
strongorweak.Theresultneedsatestofsignificancetovalidateit.Spearman’sRank
testB Themostcommonlyoccurringvalueinadataset.Itismoreameasure
offrequencythancentrality,particularlyinaskeweddistribution.Mode
C Ameasureofdispersionthatincludesallthevaluesandinvolvescalculatinghowmuchtheydifferfromthemean.
Standarddeviation
D Atableofnumbersagainstwhicharesultfromastatisticalcalculationischeckedandifitislargerthanthetablenumber,hassignificance.
CriticalValues
E Thevaluethatresultsfromthiscalculationmeanslittleonitsown,butcanindicateifthereisanunexpectedfeatureworthyoffurtherenquiry
Chi-squaretest
StandardDeviationChi-squaretestModeSpearman’sRanktestCriticalValues
Q3 Matchthesymbolorfunctiontoitsmeaning,useorpurposeA Ameansofremovingnegative(-)valuesfromacalculation
𝒙𝟐
B Ameansofreversingthemagnitudeeffectoftheprocessin‘A’
𝒙C Atotallingofallthevalues
∑
D CalculatingtheInterquartileRange
UQ-LQ
E Calculatingtheaverage(mean)ofasetofvalues
𝒙
F Cubingavalue/multiplyingbyitself,andtheresultbyitselfagain
𝒏𝟑
𝒙𝒏𝟑UQ-LQ∑𝒙𝟐 𝒙
SAM
PLE
Statisticaltechniques3.4.2.4ANSWERS
© Tutor2u Limited 2016 www.tutor2u.net
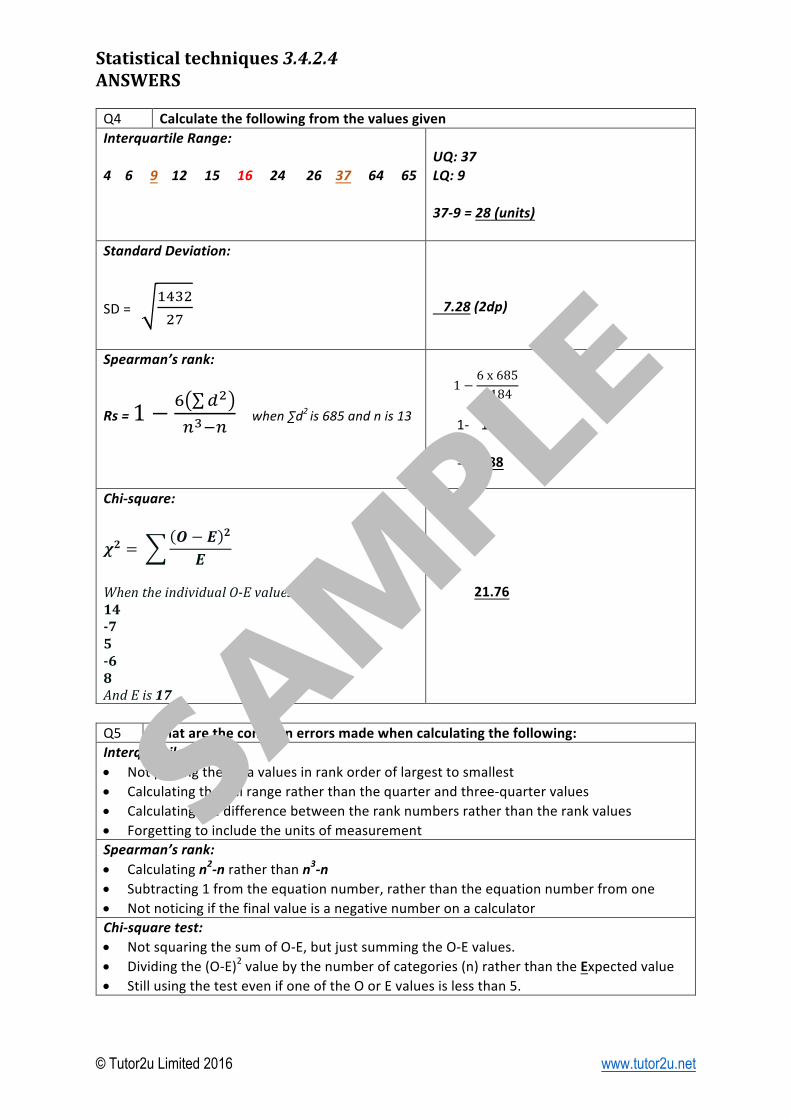
Q4 CalculatethefollowingfromthevaluesgivenInterquartileRange:4691215162426376465
UQ:37LQ:937-9=28(units)
StandardDeviation:
SD=%&'(()
7.28(2dp)
Spearman’srank:
Rs=1 − , -.
/01/when∑d2is685andnis13
1 −6x6852184
1- 1.88
=-0.88
Chi-square:
𝝌𝟐 = 𝑶 − 𝑬 𝟐
𝑬 WhentheindividualO-Evaluesare:14-75-68AndEis17
21.76
Q5 Whatarethecommonerrorsmadewhencalculatingthefollowing:Interquartilerange:• Notputtingthedatavaluesinrankorderoflargesttosmallest• Calculatingthefullrangeratherthanthequarterandthree-quartervalues• Calculatingthedifferencebetweentheranknumbersratherthantherankvalues• ForgettingtoincludetheunitsofmeasurementSpearman’srank:• Calculatingn2-nratherthann3-n• Subtracting1fromtheequationnumber,ratherthantheequationnumberfromone• NotnoticingifthefinalvalueisanegativenumberonacalculatorChi-squaretest:• NotsquaringthesumofO-E,butjustsummingtheO-Evalues.• Dividingthe(O-E)2valuebythenumberofcategories(n)ratherthantheExpectedvalue• StillusingthetestevenifoneoftheOorEvaluesislessthan5.
SAM
PLE