Embed Size (px)
Citation preview
Quality Measurement in Perioperative Care
Michael A. Gropper, MD, PhD
Professor and Vice Chairman
Department of Anesthesia and Perioperative Care
Professor of Physiology
Director, Critical Care Medicine
Investigator, Cardiovascular Research Institute
University of California San Francisco
Definition: Medical Quality
Medical quality is the degree to which health care systems, services and supplies for individuals and populations increase the likelihood for positive health outcomes
Institute of Medicine, 1990
ICU Quality Indicators
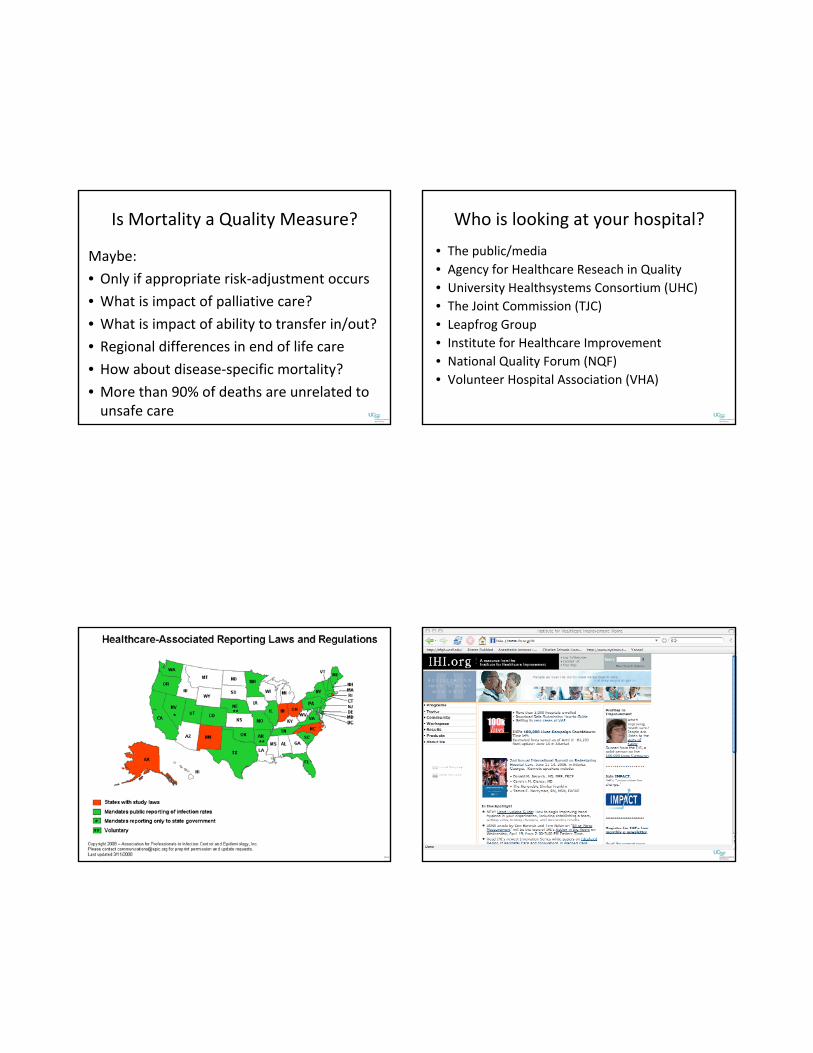
Is Mortality a Quality Measure?
Maybe:
• Only if appropriate risk‐adjustment occurs
• What is impact of palliative care?
• What is impact of ability to transfer in/out?
• Regional differences in end of life care
• How about disease‐specific mortality?
• More than 90% of deaths are unrelated to unsafe care
Who is looking at your hospital?
• The public/media• Agency for Healthcare Reseach in Quality• University Healthsystems Consortium (UHC)• The Joint Commission (TJC)• Leapfrog Group• Institute for Healthcare Improvement• National Quality Forum (NQF)• Volunteer Hospital Association (VHA)
The 100,000 Lives Campaign:
Getting Started
Institute for Healthcare Improvement
Six Changes That Save Lives• Deployment of Rapid Response Teams…at the first sign of patient decline
• Delivery of Reliable, Evidence‐Based Care for Acute Myocardial Infarction…to prevent deaths from heart attack
• Prevention of Adverse Drug Events (ADEs)…by implementing medication reconciliation
• Prevention of Central Line Infections…by implementing a series of interdependent, scientifically grounded steps called the “Central Line Bundle”
• Prevention of Surgical Site Infections…by reliably delivering the correct perioperative antibiotics at the proper time
• Prevention of Ventilator‐Associated Pneumonia…by implementing a series of interdependent, scientifically grounded steps called the “Ventilator Bundle”
Leapfrog ICU Standard“Hospitals fulfilling this standard will operate adultICUs that are managed by physicians board‐certified(or ‐eligible) in critical care medicine who:1. are present during daytime hours and provideclinical care exclusively in the ICU; and,2. at other times can return more than 95% of ICUpages within 5 minutes and, 95% of the time,arrange for a FCCS certified physician orphysician extender to reach the ICU patientwithin 5 minutes.”
Intensivist StaffingPronovost et al, JAMA 2002
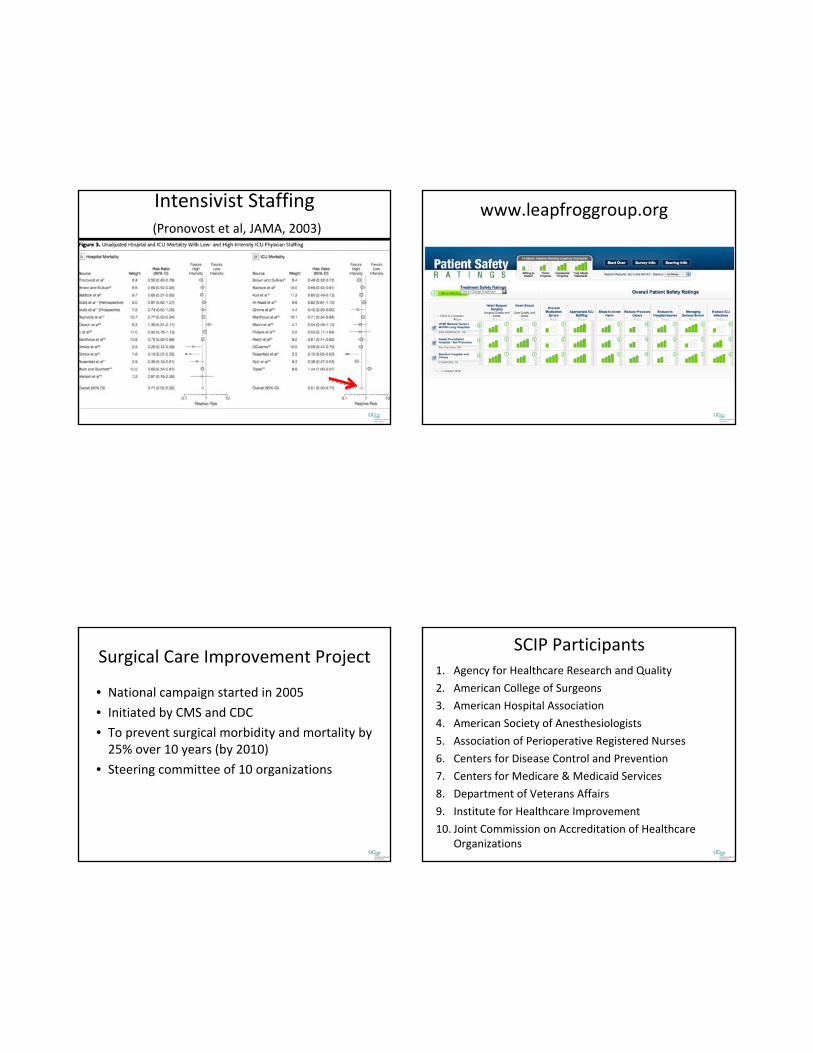
Intensivist Staffing(Pronovost et al, JAMA, 2003)
www.leapfroggroup.org
Surgical Care Improvement Project
• National campaign started in 2005
• Initiated by CMS and CDC
• To prevent surgical morbidity and mortality by 25% over 10 years (by 2010)
• Steering committee of 10 organizations
SCIP Participants1. Agency for Healthcare Research and Quality
2. American College of Surgeons
3. American Hospital Association
4. American Society of Anesthesiologists
5. Association of Perioperative Registered Nurses
6. Centers for Disease Control and Prevention
7. Centers for Medicare & Medicaid Services
8. Department of Veterans Affairs
9. Institute for Healthcare Improvement
10. Joint Commission on Accreditation of Healthcare Organizations
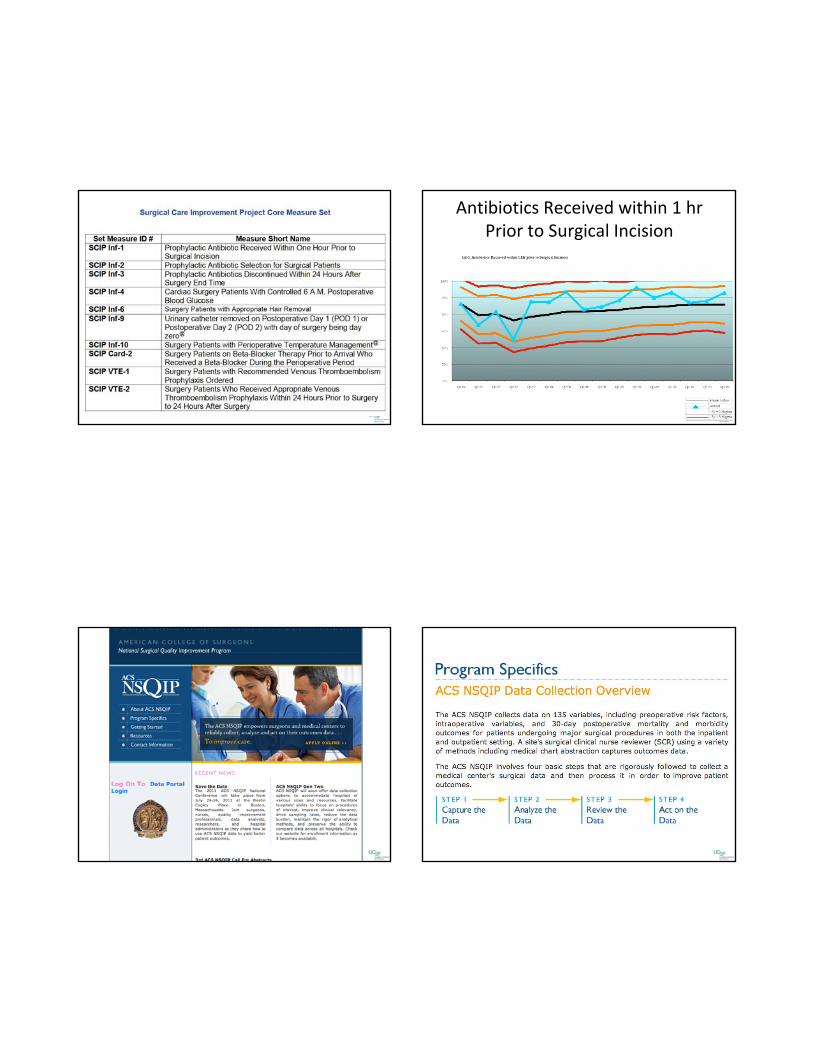
Antibiotics Received within 1 hr Prior to Surgical Incision
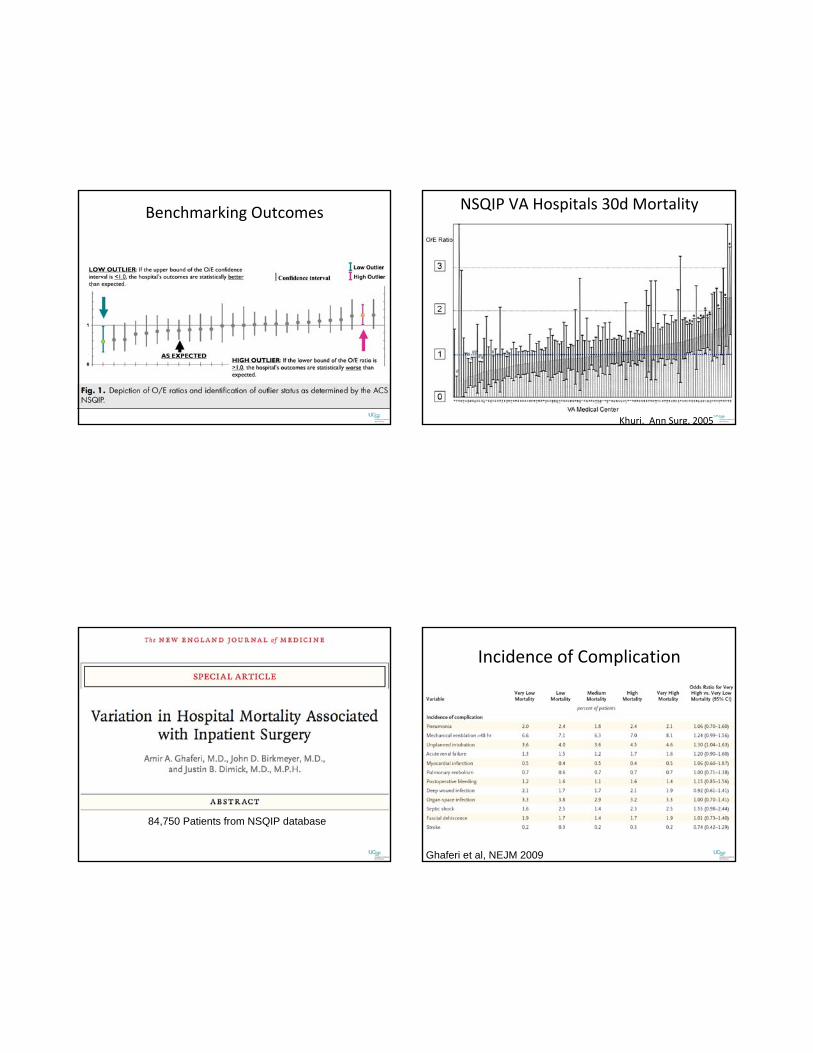
Benchmarking Outcomes NSQIP VA Hospitals 30d Mortality
Khuri. Ann Surg, 2005
84,750 Patients from NSQIP database
Incidence of Complication
Ghaferi et al, NEJM 2009
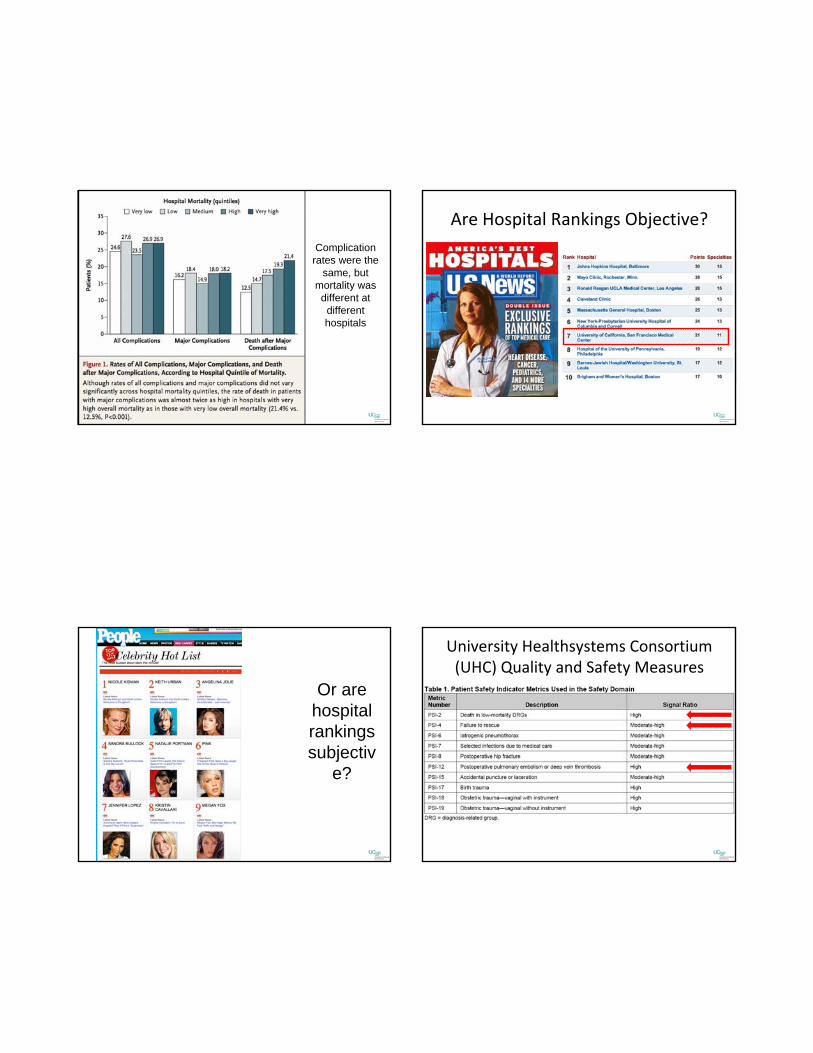
Complication rates were the
same, but mortality was
different at different hospitals
Are Hospital Rankings Objective?
Or are hospital rankings subjectiv
e?
University Healthsystems Consortium (UHC) Quality and Safety Measures
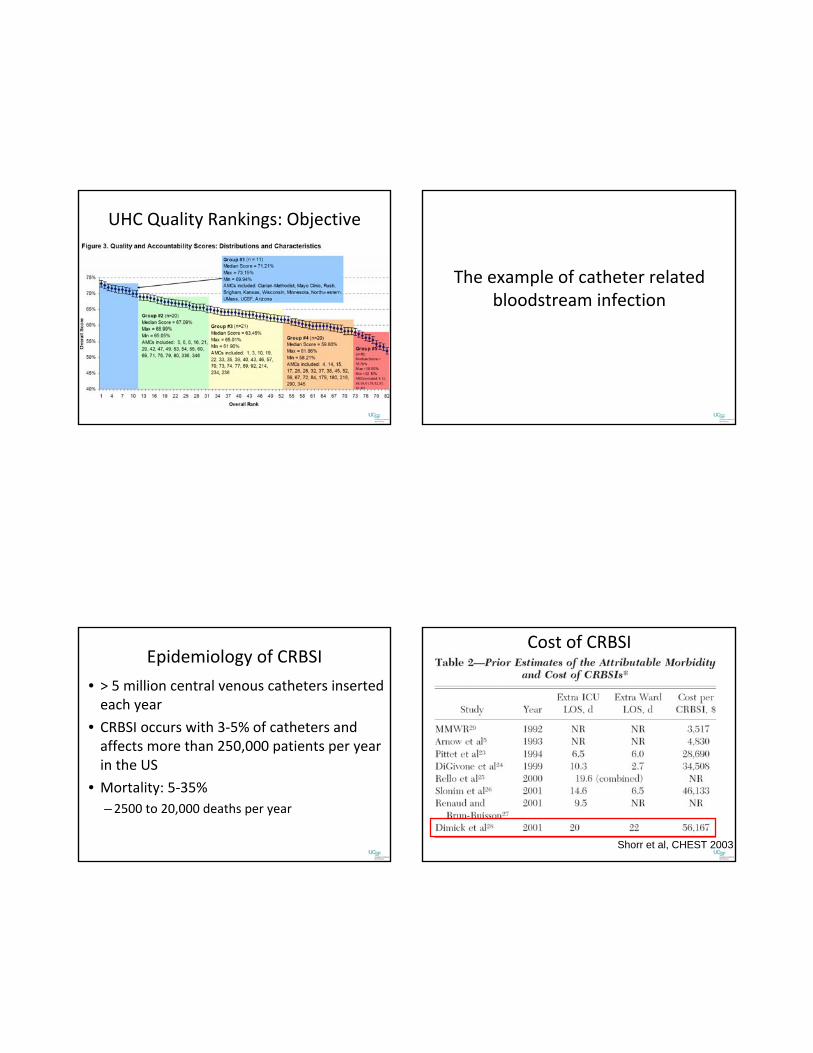
UHC Quality Rankings: Objective
The example of catheter related bloodstream infection
Epidemiology of CRBSI
• > 5 million central venous catheters inserted each year
• CRBSI occurs with 3‐5% of catheters and affects more than 250,000 patients per year in the US
• Mortality: 5‐35%–2500 to 20,000 deaths per year
Cost of CRBSI
Shorr et al, CHEST 2003
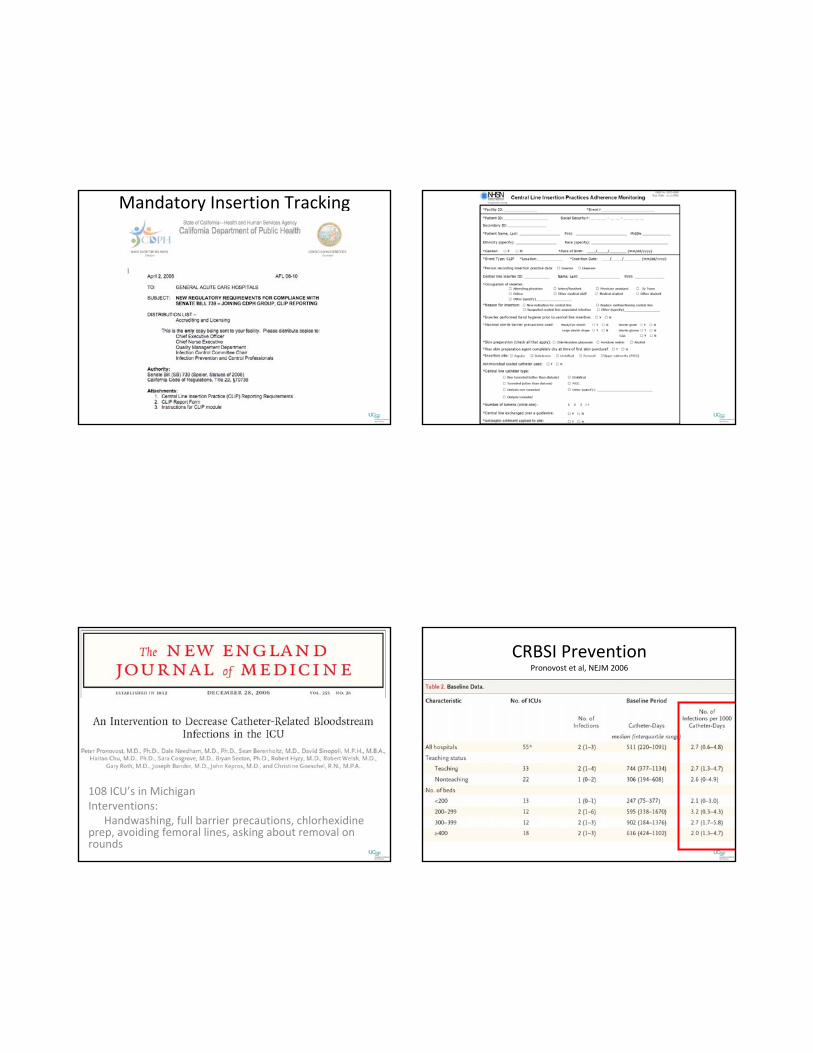
Mandatory Insertion Tracking
108 ICU’s in MichiganInterventions:
Handwashing, full barrier precautions, chlorhexidine prep, avoiding femoral lines, asking about removal on rounds
CRBSI PreventionPronovost et al, NEJM 2006
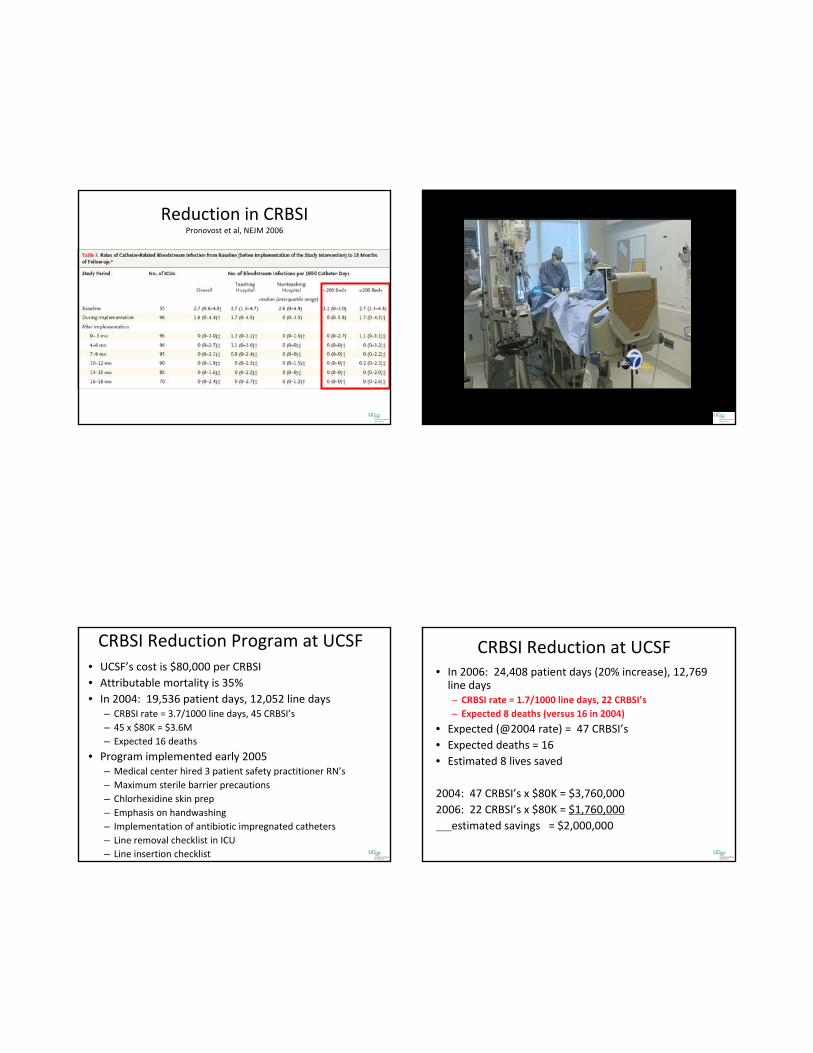
Reduction in CRBSIPronovost et al, NEJM 2006
CRBSI Reduction Program at UCSF• UCSF’s cost is $80,000 per CRBSI• Attributable mortality is 35%• In 2004: 19,536 patient days, 12,052 line days
– CRBSI rate = 3.7/1000 line days, 45 CRBSI’s– 45 x $80K = $3.6M– Expected 16 deaths
• Program implemented early 2005– Medical center hired 3 patient safety practitioner RN’s– Maximum sterile barrier precautions– Chlorhexidine skin prep– Emphasis on handwashing– Implementation of antibiotic impregnated catheters– Line removal checklist in ICU– Line insertion checklist
CRBSI Reduction at UCSF• In 2006: 24,408 patient days (20% increase), 12,769 line days– CRBSI rate = 1.7/1000 line days, 22 CRBSI’s– Expected 8 deaths (versus 16 in 2004)
• Expected (@2004 rate) = 47 CRBSI’s• Expected deaths = 16• Estimated 8 lives saved
2004: 47 CRBSI’s x $80K = $3,760,0002006: 22 CRBSI’s x $80K = $1,760,000
estimated savings = $2,000,000
Pay for Performance
• Reward quality with financial incentives large enough for structural change
• Effectuate health system changes to reduce errors and improve quality and to reduce cost and improve efficiency of care
• Encourage MD’s to broaden care beyond the office visit (population management)
• Put greater responsibility on MD’s to “get it right the first time”
Pay for Performance Affects YOU!• Under the rules adopted by the Centers for Medicare and Medicaid Services (CMS), payments will be withheld from hospitals for care associated with treating certain catheter‐associated urinary tract infections, vascular catheter‐associated infections, mediastinitis after coronary artery bypass graft (CABG) surgery, and five other medical errors unrelated to infections (bed sores, objects left in patient’sbodies, blood incompatibility, air embolism, and falls). The new rules went into effect in October 2008.
JAMA. 2010;304(18):203

Variation in Reporting CRBSI
JAMA. 2010;304(18):203
Postoperative Glycemic Control: Bittersweet…
Intensive insulin therapy
Hyperglycemia is common in critically ill patients, and has beenassociated with:
1. Neuropathy2. Skeletal muscle wasting3. Increased growth hormone concentrations4. Increased susceptibility to infection5. Prolonged mechanical ventilation6. Hyperglycemia impairs neutrophil phagocytosis
Hypothesis: Glycemic control with insulin infusion will decrease the incidence of the above complications
Mortality by Mean Glucose Value
Krinsley, JS. Mayo Clin Proc, 2003
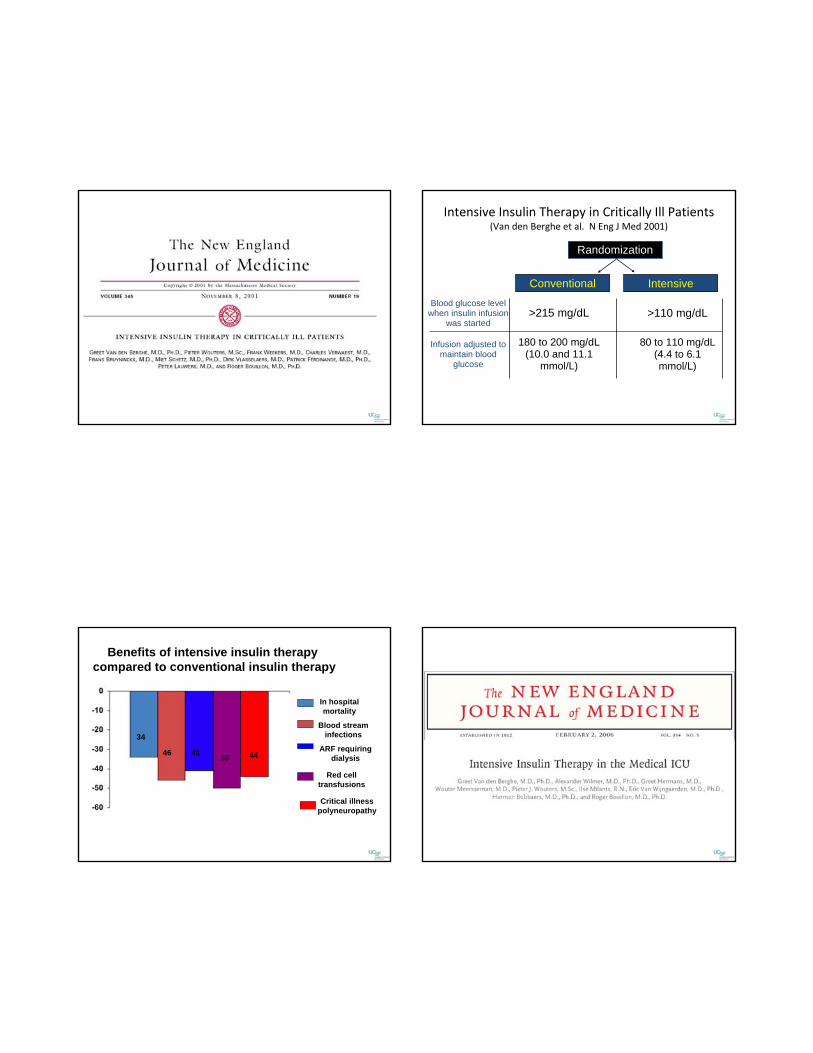
Intensive Insulin Therapy in Critically Ill Patients(Van den Berghe et al. N Eng J Med 2001)
Randomization
Conventional Intensive
>215 mg/dL
180 to 200 mg/dL (10.0 and 11.1
mmol/L)
>110 mg/dL
80 to 110 mg/dL (4.4 to 6.1 mmol/L)
Blood glucose level when insulin infusion
was started
Infusion adjusted to maintain blood
glucose
In hospitalmortality
Blood streaminfections
ARF requiringdialysis
Red celltransfusions
Critical illnesspolyneuropathy
Benefits of intensive insulin therapy compared to conventional insulin therapy
34
46 41 50 44
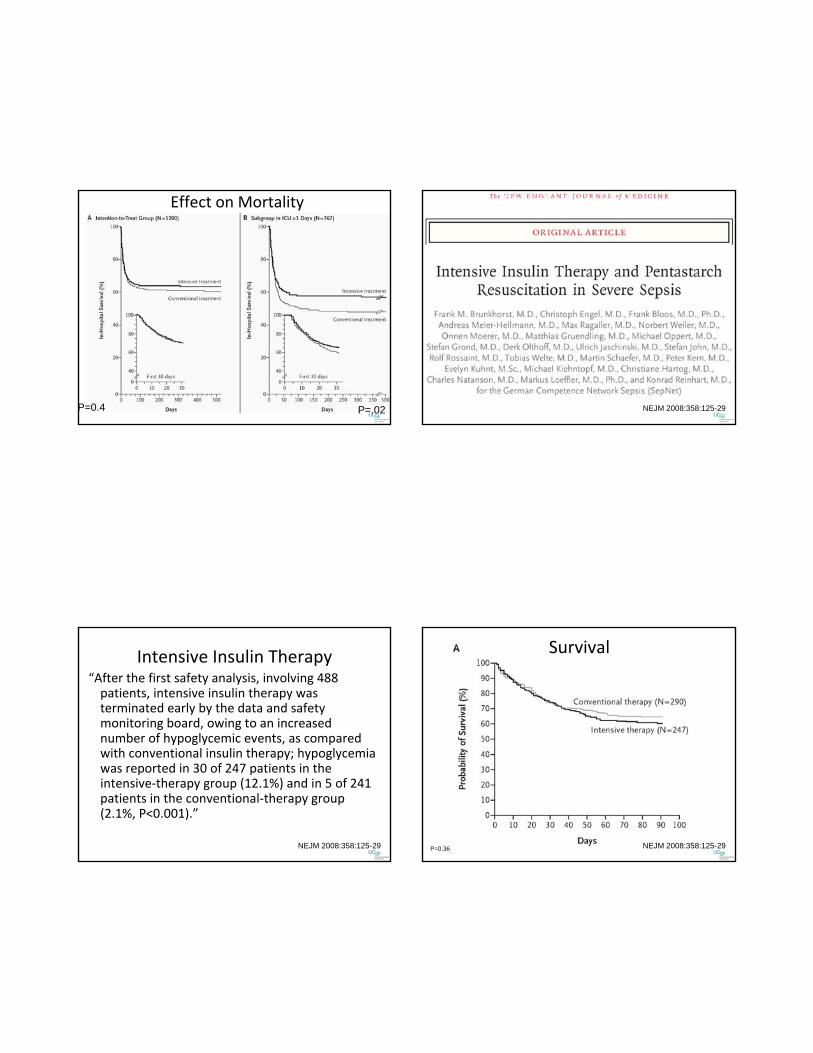
Effect on Mortality
P=0.4 P=.02
Published last week…
NEJM 2008:358:125-29
Intensive Insulin Therapy“After the first safety analysis, involving 488 patients, intensive insulin therapy was terminated early by the data and safety monitoring board, owing to an increased number of hypoglycemic events, as compared with conventional insulin therapy; hypoglycemia was reported in 30 of 247 patients in the intensive‐therapy group (12.1%) and in 5 of 241 patients in the conventional‐therapy group (2.1%, P<0.001).”
NEJM 2008:358:125-29
Survival
NEJM 2008:358:125-29P=0.36
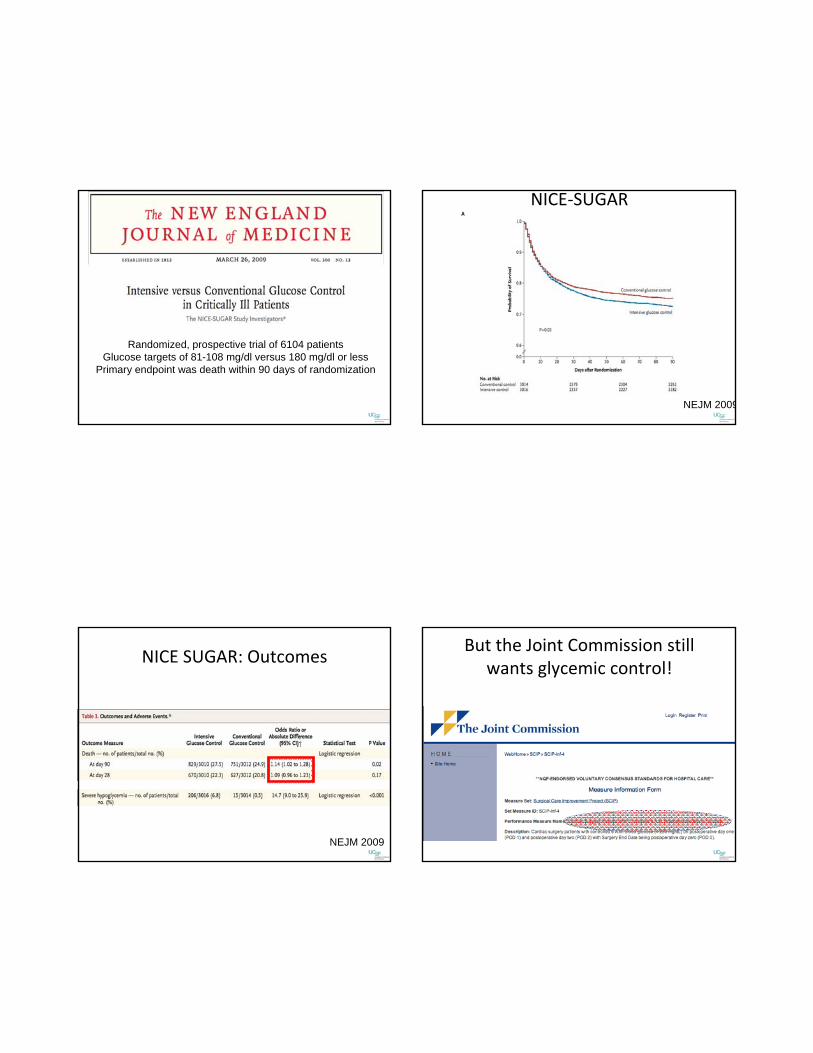
Randomized, prospective trial of 6104 patientsGlucose targets of 81-108 mg/dl versus 180 mg/dl or less
Primary endpoint was death within 90 days of randomization
NICE‐SUGAR
NEJM 2009
NICE SUGAR: Outcomes
NEJM 2009
But the Joint Commission still wants glycemic control!
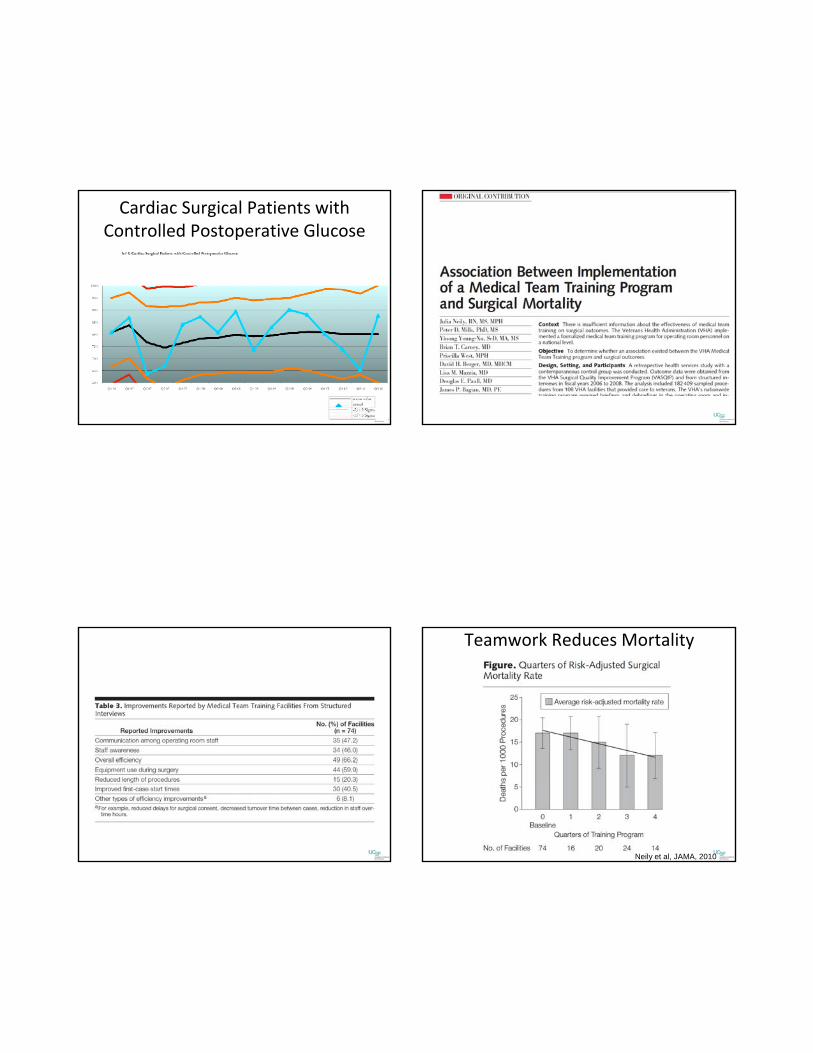
Cardiac Surgical Patients with Controlled Postoperative Glucose
Teamwork Reduces Mortality
Neily et al, JAMA, 2010
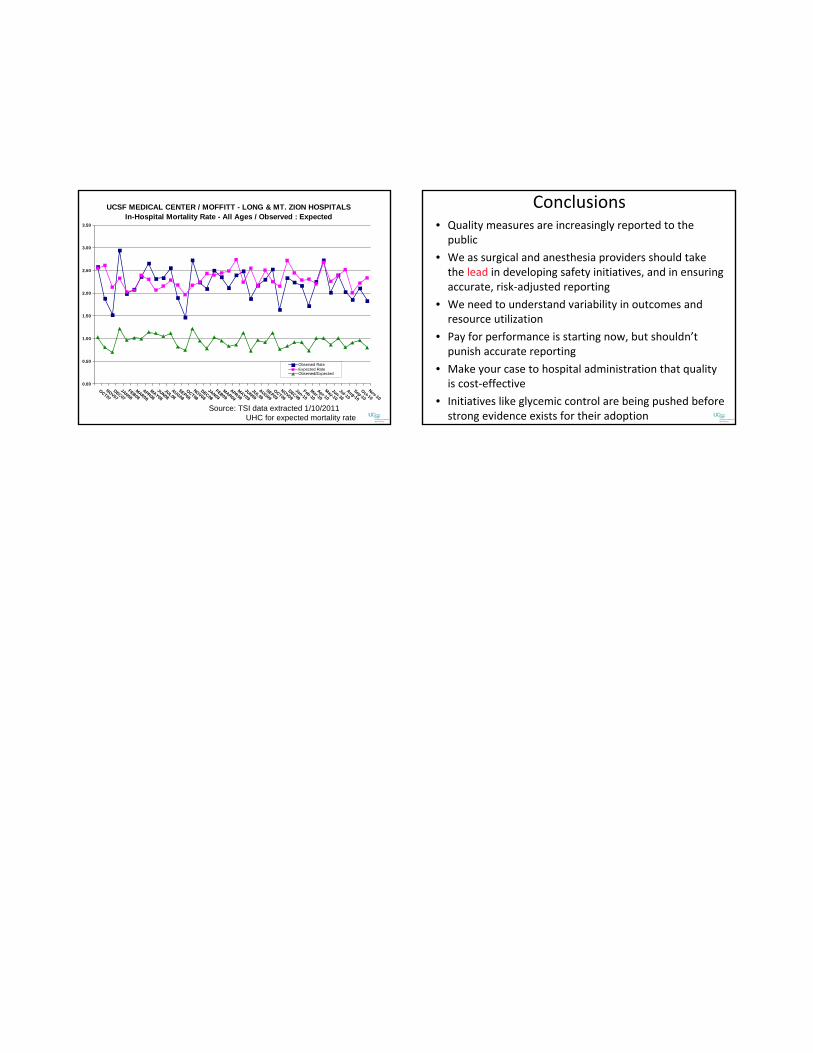
Source: TSI data extracted 1/10/2011UHC for expected mortality rate
UCSF MEDICAL CENTER / MOFFITT - LONG & MT. ZION HOSPITALSIn-Hospital Mortality Rate - All Ages / Observed : Expected
0.00
0.50
1.00
1.50
2.00
2.50
3.00
3.50
OCT07
NOV07DEC07
JAN08FEB08
MAR08
APR08MAY08
JUN08JUL08
AUG08
SEP08OCT08
NOV08DEC08
JAN09FEB09
MAR09
APR09MAY09
JUN09JUL09
AUG09
SEP09OCT09
NOV09DEC09
Jan-10Feb-10
Mar-10Apr-10
May-10
Jun-10Jul-10
Aug-10
Sep-10
Oct-10Nov-10
Observed RateExpected RateObserved/Expected
Conclusions• Quality measures are increasingly reported to the public
• We as surgical and anesthesia providers should take the lead in developing safety initiatives, and in ensuring accurate, risk‐adjusted reporting
• We need to understand variability in outcomes and resource utilization
• Pay for performance is starting now, but shouldn’t punish accurate reporting
• Make your case to hospital administration that quality is cost‐effective
• Initiatives like glycemic control are being pushed before strong evidence exists for their adoption


![Ms. Zora Elizabeth [Miller] - Sprouse - Roby. Perhaps ...hansandcassady.org/FCCS-Erin-Morgan-PDF.pdf · the "Executive Director" - of FCCS - and you. 1) My biological mother was:](https://img.pdfslide.us/doc/110x75/5e917b23378e9a25a4429c48/ms-zora-elizabeth-miller-sprouse-roby-perhaps-the-executive-director.jpg)