Embed Size (px)
Citation preview

NETWORKEFFECTIVENESS IN NEIGHBORHOOD COLLABORATIONS
Learning from the Chicago Community Networks Study
David M. GreenbergAurelia De La Rosa Aceves
Mikael Karlström Stephen Nuñez
Victoria Quiroz-Becerra Sarah Schell
Edith YangAudrey Yu
November 2017
mdrc
NE
TW
OR
K EFFEC
TIVEN
ESS IN N
EIGH
BO
RH
OO
D C
OLLA
BO
RATIO
NS Learning from
the Chicago C
omm
unity Netw
orks StudyO
CTO
BER
2017
MDRC BOARD OF DIRECTORS
Mary Jo BaneChairThornton Bradshaw Professor of
Public Policy and ManagementJohn F. Kennedy School of
Government Harvard University
Robert SolowChairman EmeritusInstitute Professor EmeritusMassachusetts Institute of
Technology
Rudolph G. PennerTreasurerSenior Fellow and Arjay and
Frances Miller Chair in Public Policy
Urban Institute_______________________________
Robert E. DenhamPartnerMunger, Tolles & Olson LLP
Ron HaskinsSenior Fellow, Economic StudiesCo-Director, Center on Children and
FamiliesBrookings Institution
James H. Johnson, Jr.William Rand Kenan Jr.
Distinguished Professor of Strategy and Entrepreneurship
Director, Urban Investment Strategies Center
University of North Carolina
Lawrence F. KatzElisabeth Allison Professor of
EconomicsHarvard University
Bridget Terry LongProfessor of Education and
EconomicsGraduate School of EducationHarvard University
Josh B. McGeeVice President of Public
AccountabilityLaura and John Arnold Foundation
Richard J. MurnaneThompson Professor of Education
and SocietyGraduate School of Education Harvard University
Jan NicholsonPresidentThe Grable Foundation
John S. Reed Retired ChairmanCitigroup
Michael RosterFormer General CounselStanford UniversityFormer Managing PartnerMorrison & Foerster, Los Angeles
Cecilia E. RouseDean, Woodrow Wilson School of
Public and International AffairsKatzman-Ernst Professor in the
Economics of EducationProfessor of Economics and
Public AffairsPrinceton University
Isabel V. SawhillSenior Fellow, Economic StudiesCo-Director, Center on Children and
FamiliesBrookings Institution
_______________________________
Gordon L. BerlinPresident, MDRC

Network Effectiveness in Neighborhood
CollaborationsLearning from the Chicago
Community Networks Study
David M. Greenberg (MDRC)Aurelia Aceves (MDRC)
Mikael Karlström (University of Chicago)Stephen Nuñez (MDRC)
Victoria Quiroz-Becerra (MDRC)Sarah Schell (MDRC)Edith Yang (MDRC)Audrey Yu (MDRC)
NOVEMBER 2017

For information about MDRC and copies of our publications, see our website: www.mdrc.org.
Copyright © 2017 by MDRC®. All rights reserved.
FUNDERSThe funding for this report was provided by The John D. and Catherine T. MacArthur Foundation.
Dissemination of MDRC publications is supported by the following funders that help finance MDRC’s public policy outreach and expanding efforts to communicate the results and implications of our work to policymakers, practitioners, and others: The Annie E. Casey Foundation, Charles and Lynn Schusterman Family Foundation, The Edna McConnell Clark Foundation, Ford Foundation, The George Gund Foundation, Daniel and Corinne Goldman, The Harry and Jeanette Weinberg Foun-dation, Inc., The JPB Foundation, The Joyce Foundation, The Kresge Foundation, Laura and John Arnold Foundation, Sandler Foundation, and The Starr Foundation.
In addition, earnings from the MDRC Endowment help sustain our dissemination efforts. Con-tributors to the MDRC Endowment include Alcoa Foundation, The Ambrose Monell Foundation, Anheuser-Busch Foundation, Bristol-Myers Squibb Foundation, Charles Stewart Mott Foundation, Ford Foundation, The George Gund Foundation, The Grable Foundation, The Lizabeth and Frank Newman Charitable Foundation, The New York Times Company Foundation, Jan Nicholson, Paul H. O’Neill Charitable Foundation, John S. Reed, Sandler Foundation, and The Stupski Family Fund, as well as other individual contributors.
The findings and conclusions in this report do not necessarily represent the official positions or poli-cies of the funders.

Overview
Federal, state, and local policies focused on neighborhood improvement have long emphasized the need for community organizations to share information, coordinate activities, and collaborate in the delivery of services. These partnerships build “com-
munity capacity,” as a way of promoting local problem solving and community well-being over the longer term. But there has been almost no formal measurement of how community organizations work together, whether differences in patterns of collaboration and leader-ship exist across neighborhoods, and how these patterns are influenced by the nature of the problems being addressed. There has also been only limited research on which patterns of neighborhood networks are most conducive to implementing effective collective work. This report uses social network analysis, drawing from a network survey, and extensive field research to ask how specific patterns of partnership promote better-implemented col-laborations that in turn can successfully inform public policy.
Key Findings
• Networks where well-connected organizations are tightly connected to each other ap-pear better situated to implement successful educational improvement and community housing initiatives. Education and housing networks with a set of well-connected core partners — each bringing their own resources and relationships to the table — appeared better able to develop community-school partnerships, commercial corridor development projects, business improvement districts, and corridor beautification activities.
• Public policy networks with well-positioned brokers can foster broad-based mobilization to inform public and elected officials. These organizations, which tended to be commu-nity organizing groups, were often the single conduit to connect elected officials and smaller community organizations. Far from acting as “gatekeepers” who excluded others in the community from participating, these organizations worked to include partners in efforts to change public policy.
• Networks that combine public policy and neighborhood organizing with service delivery appear to create some important advantages. This combination of policy and service delivery may enhance both the quality of services and their ability to attract resources and partners.
The above findings have a qualitative, observable component, making it possible for funders to identify neighborhoods with advantageous structural supports before choosing to invest in that location, and for practitioners to support certain patterns of community activity.
A second report, drawing on a second wave of the study’s survey, will explore how networks changed from 2013 to 2016, and will be released in 2018.
Chicago Community Networks | i i i

ContentsOverview iii
List of Exhibits vii
Preface ix
Acknowledgments xi
Executive Summary ES-1
Chapter
1 Introduction 1
2 Social Network Analysis and the Methodology of the Chicago Community Networks Study 5Methodology and Data Sources 7Distinguishing Features of the CCN Study 10Chicago Neighborhoods Included in the Survey 11
3 Connectivity Among Chicago Neighborhood Organizations 15The Importance of Connectivity for Policy, Public Management, and Communities 16Variation in Connectivity Across Neighborhoods and Domains of Work 18How Connectivity Mattered for Groups and Communities 21
4 Power in Networks of Chicago Neighborhood Organizations 23Defining Power and Influence 23Brokering Power 24The Importance of Centrality for Policy, Public Management, and Communities 27Groups That Occupy Positions of Power and Influence in Networks 28Power in Community Networks as a Whole 29
5 Trust and Longevity in Chicago Community Networks 43How Trust and the Duration of Partnerships Matter for Policy, Public Management, and Communities 44Duration of Partnerships and How It Varied Across Neighborhoods 45Trust and How It Varied Across Networks 46How Trust and Longevity Mattered for Organizations and Communities 48
Chicago Community Networks | v

6 The Diversity and Comprehensiveness of Chicago Neighborhood Ties 53How Diversity and Comprehensiveness Matter for Policy, Public Management,and Communities 53How Diversity and Comprehensiveness Varied Across Neighborhoods 55How Network Diversity and the Comprehensiveness of Ties Helped Preserve Affordable Housing, Improve Schools, and Promote Safety 61Harnessing Educational Improvement Together With Policy Reform Efforts 64
7 Conclusion 65
References 69
v i | Chicago Community Networks
List of Exhibits
Figure
ES.1 How Networks Contribute to Community Action ES-5
ES.2 Selected Demographic Characteristics of CCN Neighborhoods ES-6
2.1 How Networks Contribute to Community Action 6
2.2 Selected Demographic Characteristics of CCN Neighborhoods 9
3.1 Important Network Terms: Node, Tie, Density 16
3.2 Examples of High- and Low-Density Networks of Equal Size 17
3.3 Density by Domain and Neighborhood 19
4.1 Important Network Terms: Brokering and Well-Connected Centrality 24
4.2 High Brokering Centrality in Auburn Gresham: Public Spaces, Community Image, and the Arts Network 26
4.3 A Well-Connected Actor in Quad Communities: Economic and Workforce Development Network 27
4.4 Important Network Term: Centralization 30
4.5 Brokering Centralization by Domain and Neighborhood 31
4.6 Education-Related Collaborations in Chicago Southwest 36
4.7 Public Policy and Organizing-Related Collaborations in Chicago Southwest 37
4.8 Education-Related Collaborations in Quad Communities 39
4.9 Public Policy and Organizing-Related Collaborations in Quad Communities 40
5.1 Proportion of an Organization’s Ties That Are Trusting Ties 47
6.1 Key Network Term: Comprehensiveness 54
6.2 Important Network Term: Diversity 56
6.3 Organizational Type Diversity by Neighborhood: Overall Networks 57
6.4 Organizational Type Diversity by Neighborhood: Domain Networks 58
6.5 Frequency of Comprehensive Ties by Tie Level 59
Chicago Community Networks | v i i
Box
2.1 The Importance of Baseline Patterns of Connectivity 8
4.1 Hierarchy and the Role of the Local Alderman 33
5.1 A Leap of Faith Based on Trust to Reduce Youth Violence 50
v i i i | Chicago Community Networks
Preface
Community initiatives are notoriously difficult to evaluate. This is because neighbor-hoods are complex and it is hard to untangle and measure causal outcome drivers among the economic, demographic, and institutional forces that can influence, sup-
port, or undermine investments aimed at local improvement. This same complexity also makes it difficult for evaluators to develop a convincing counterfactual, or representa-tion of what might have occurred without the community intervention. Counterfactual comparisons are best established through experimental research designs that ensure that treatment and control groups are alike. But even in the rare cases where neighborhoods, towns, or cities may be part of randomized controlled trials or rigorous quasi-experimental studies, it is unusual to have sufficient numbers of participating communities to reliably determine whether places are truly comparable on average because they may differ in less observable, but still relevant, ways related to institutional factors such as service capacity or political leadership.
MDRC’s Chicago Community Networks (CCN) study uses a methodologically innovative approach, known as social network analysis, to develop an extensive understanding of these more intangible features of neighborhood life. Funded by The John D. and Catherine T. MacArthur Foundation, the CCN study is one of the most extensive attempts yet to characterize and measure the strength of networks among community organizations and show how they contribute to more successful partnerships for service delivery and politi-cal leadership.
Community initiatives — similar to our networked society as a whole — have long em-phasized the importance of relationships to accomplish their goals, and practitioners and policymakers have always been aware that the quality of relationships matters for implementing local work. But research needs to take into account not just the presence, absence, or individual quality of partnerships, but how these partnerships or lack thereof contribute to the development of a network infrastructure at the neighborhood level. In this study, core patterns of collaboration, the distribution of network power, and the depth of the relationships are shown to help drive the success of local implementation. Funders, practitioners, and policymakers should all be able to benefit from this approach, which can offer insights about the conditions that may contribute to more effective implementation of local improvement projects and community-based efforts to influence public policy.
Gordon L. Berlin President, MDRC
Chicago Community Networks | i x


Acknowledgments
The team is deeply grateful to our funder, The John D. and Catherine T. MacArthur Foundation, for its support and guidance about work in Chicago over time. Craig Howard, Director of Community and Economic Development at the foundation, has
brought his sharp insights to the work in ways that have deeply improved it. Our previous program officer, Alaina Harkness, helped shepherd and launch the Chicago Community Networks study and shaped its design and focus. We are also indebted to the Local Initiatives Support Corporation of Chicago for their help designing, testing, and implementing the instrument. In particular, Taryn Roch, Susana Vasquez, Keri Blackwell, and Chris Brown provided valuable insights into the neighborhoods we surveyed, while also encouraging survey participation among local community development groups.
The report also benefited from generous and thoughtful support and review, inside and outside MDRC. Within MDRC, Leslyn Hall’s passionate and creative support from the survey unit brought us to our high response goals, and Nandita Verma, James Riccio, Alice Tufel, and Carolyn Hill provided important insights on report drafts. Sonya Williams and Mercy Emelike helped process Wave 1 survey data. Marcia Festen and Amy Nowell contributed early qualitative research. Nikki Ortolani was the project’s indefatigable resource manager, and Gordon Berlin, MDRC’s president, brought longstanding insights about community de-velopment to his review and support of the project. Outside of MDRC, Rob Chaskin, Claudia Colton, Joseph Galaskiewicz, George Galster, H. Brinton Milward, Andrew Papachristos, Robert Sampson, Mario Small, and Chris Walker provided insights from the field and their research in various reviews. We are grateful to have worked with Michelle Kahmann at AbtSRBI, which operationalized and fielded the network survey.
Our deepest gratitude is to organizations across the nine neighborhoods who participated in our study, giving their time to provide insights about their practice and their partnerships. They were the source not just of the raw network and qualitative data, but also of invalu-able insights about networks and how they matter for community partnerships and policy action. We are particularly grateful to our partners at Austin Coming Together, Bickerdike Redevelopment Corporation, Brighton Park Neighborhood Council, Claretian Associates, Greater Auburn Gresham Development Corporation, Enlace, Logan Square Neighborhood Association, Quad Communities Development Corporation, and the Southwest Organizing Project. This research would not have been possible without them.
Finally, we are still indebted to our late colleague, Keith Provan. His intelligence, wisdom, humor, and generosity are missed by all who were fortunate enough to work with him, and he retains a deep mark on this research.
Gloria Tomlinson served as report coordinator, Christopher Boland edited the report, and Ann Kottner prepared it for publication.
The Authors
Chicago Community Networks | x i


Executive Summary
Why do some neighborhoods appear able to launch effective local improvement initiatives, while others are more hampered by fragmentation and mistrust? Why can some communities mobilize diverse constituencies to influence public policy,
while others cannot? Answers to these questions may be found in the specific patterns of collaboration that form among community organizations, and between these groups, schools, public agencies, and elected officials. Using the tool of social network analysis, this report offers preliminary insights into the conditions for more successful collective action by examining the distribution of power among local actors, the ties between more distant organizations and a core of activity, and the depth of community partnerships.
Federal, state, and local policies focused on neighborhood improvement have long empha-sized the need for community organizations to share information, coordinate activities, and collaborate to deliver services.1 Such initiatives often encourage such partnerships so as to build “community capacity,” broadly defined as the individual, organizational level, and systemic forces that work together to promote local problem solving and community well-being.2 By relying on collective approaches to implement policies and programs, funders and policymakers hope to foster enduring partnerships that can address problems that communities face over the longer term, be they related to poverty, violence, or foreclosures.
This report explores one important dimension of community capacity: networks of orga-nizations and their efforts to improve housing, schools, and safety. The study makes two primary contributions to policy and practice. First, it has long been acknowledged that neighborhoods collaborate in different ways, and that programs that operate well in one setting may not do so in another, due to different local patterns of cooperation or local leadership. But there has been almost no formal measurement of how community orga-nizations work together, whether differences in patterns of collaboration and leadership exist across neighborhoods, and how these patterns are influenced by the nature of the problems being addressed. The report provides emerging insights about these questions, so as to improve policymakers’ ability to identify neighborhoods that may be well situated to implement community improvement efforts.
Second, there have been few opportunities to explore which kinds of local infrastructures of community networks form a productive local infrastructure for implementing improve-ment projects. (Infrastructure refers to the overall levels of connectivity in a network, the levels of trust and longevity of the network’s ties, the concentration of network power, and
1. Aurelia De La Rosa Aceves and David M. Greenberg, “Addressing Challenges in Community-Based Service Coordination: Breaking Down Silos to Promote Economic Opportunity” (New York: MDRC, 2016).
2. Robert J. Chaskin, Prudence Brown, Sudhir Venkatesh, and Avis Vidal, Building Community Capacity (New York: Aldine de Gruyter, 2001).
Executive Summary | E S - 1
the depth or comprehensiveness of relationships, as described below.) Research from the fields of community sociology and public management has provided some insights as to how distinct kinds of network structures promote successful political leadership or project implementation.3 Relying on a wide array of survey and qualitative data, this report pro-vides additional insights about these issues, and develops theories as to which patterns of neighborhood networks are most conducive to implementing powerful collective work. The report uses social network analysis and draws on extensive field research to address the following questions:
• What is the structure of community partnerships formed to reduce violence, improve schools, and develop affordable housing? How do these partnerships differ across neigh-borhoods?
• Which community structures appear to promote better implemented collaborations and allow groups to successfully influence public policy? How does the distribution of power among local actors, the ties between more distant organizations and a core of active part-ners, and the depth of community partnerships support more effective collaborations?
The report complements a web-based series on the MDRC website,4 and will be followed by a report analyzing the second wave of the Chicago Community Networks (CCN) survey, conducted in 2016 to understand how networks described in this report evolved or were maintained over the course of three years.
The Chicago Community Networks (CCN) Study
The site of this research is Chicago, whose neighborhoods offer ideal settings to study com-munity collaborations. The city is well known as a place that emphasizes relationships and connections in the political and business realms and around community development ef-forts in particular. Chicago’s political culture was once summed up in a statement by a local ward leader, “[w]e don’t want nobody that nobody sent,” showing that connections — for better or worse — are critical to getting work done. With respect to community development, Chicago is a city that has pioneered a more collaborative approach among community orga-nizations to improve neighborhoods. One such program was Chicago’s New Communities Program: Over a 10-year period, The MacArthur Foundation provided more than $50 million in direct support to the Local Initiatives Support Corporation of Chicago (LISC Chicago), a
3. When speaking of “network structure,” research has explored qualities of the whole system of relationships, such as how connected or fragmented organizations tend to be on the whole, or whether the network is more or less hierarchical, as described in this report. One particularly important study that the Chicago Community Networks (CCN) study may be seen as complementing is the Project on Human Development in Chicago Neighborhoods. See Robert J. Sampson, Great American City: Chicago and the Enduring Neighborhood Effect (Chicago: University of Chicago Press, 2012).
4. Website: www.mdrc.org/chicago-community-networks-study.
E S - 2 | Chicago Community Networks

citywide community development intermediary, and its local community-based partners.5 The initiative fostered partnerships among local organizations under the theory that the whole neighborhood would be better able to advance proactive community improvement projects, as well as respond to external shocks such as budget cuts or recessions.
Funded by The MacArthur Foundation, and fielded in collaboration with LISC Chicago and its local partners, the CCN study is an extensive attempt to characterize and measure the strength of networks among community organizations and show how they contribute to more successful partnerships for service delivery and political leadership. A mixed-methods study, it contains two data sources: (1) a two-wave network survey in nine Chicago neigh-borhoods, administered to organizations conducting community development activities,6
and (2) field research, including interviews with organizations occupying positions within the core and periphery of neighborhood networks. The first network survey, conducted in 2013,7 provided quantitative data about patterns of connection among community groups and with public agencies, while the field research helped the study team interpret survey results, associate patterns of network activity with broader outcomes, and trace the processes by which these structures and outcomes were connected. The CCN study is not a formal evaluation of any individual neighborhood improvement effort, but rather it attempts to learn how local partners worked together and to share lessons from this experience with other community-based initiatives around the country that emphasize collaboration.
Social Network Analysis
This study uses social network analysis, a toolkit for the measurement and mapping of re-lationships among a set of actors in order to describe the underlying patterns, or structure, of local partnerships. This emphasis on structure is important because it has implications related to how quickly information and resources flow, how widely power and influence are distributed among organizations, how well they can collaborate, and how effectively the community can mobilize to address shocks such as deteriorating economic conditions or budget cuts. By connecting these structures to local views about the quality of collec-
5. For an overview of the New Communities Program, see David Greenberg, Nandita Verma, Keri-Nicole Dillman, and Robert Chaskin, Creating a Platform for Sustained Neighborhood Improvement: Interim Findings from Chicago’s New Communities Program (New York: MDRC, 2010).
6. The study team surveyed different kinds of organizations seen as meaningfully participating in community development activities. Groups included large and small social service agencies, community development corporations, public agencies such as police departments and schools, religious organizations, and elected officials. The instrument asked how organizations communicated, coordinated, or collaborated in their work in fields related to housing and commercial real estate development, education, economic and workforce development, public spaces and the arts, public health and safety, and public policy and organizing. Groups did not need to have a formal contractual relationship with each other to communicate, coordinate, or collaborate.
7. To understand how network structures change over time, a second wave of the survey was finalized in late 2016 and will be the subject of a 2018 deliverable.
Executive Summary | E S - 3
tive efforts — such as community-school partnerships, coalitions to revitalize commer-cial districts, or attempts to change public policy — the CCN study provides preliminary insights about how the characteristics of local networks may support successful project implementation or efforts to change policy.
In that vein, Figure ES.1 illustrates different ways that the structure of local partnerships may influence the implementation of local programs. It begins by describing how an indi-vidual organization’s ability to successfully implement a project may depend on a number of factors, starting with the quality of its own program models and resources in terms of money and staff. It then considers how the reach of this group can be extended by partner-ships with other community organizations, such as between a youth group and a school or sports club. At the next level, the position of an organization within the network may mat-ter for the group’s ability to help the neighborhood coalesce around policy change. Finally, at the level of the whole network, the figure describes how overall patterns of connection or fragmentation can influence a network’s success.
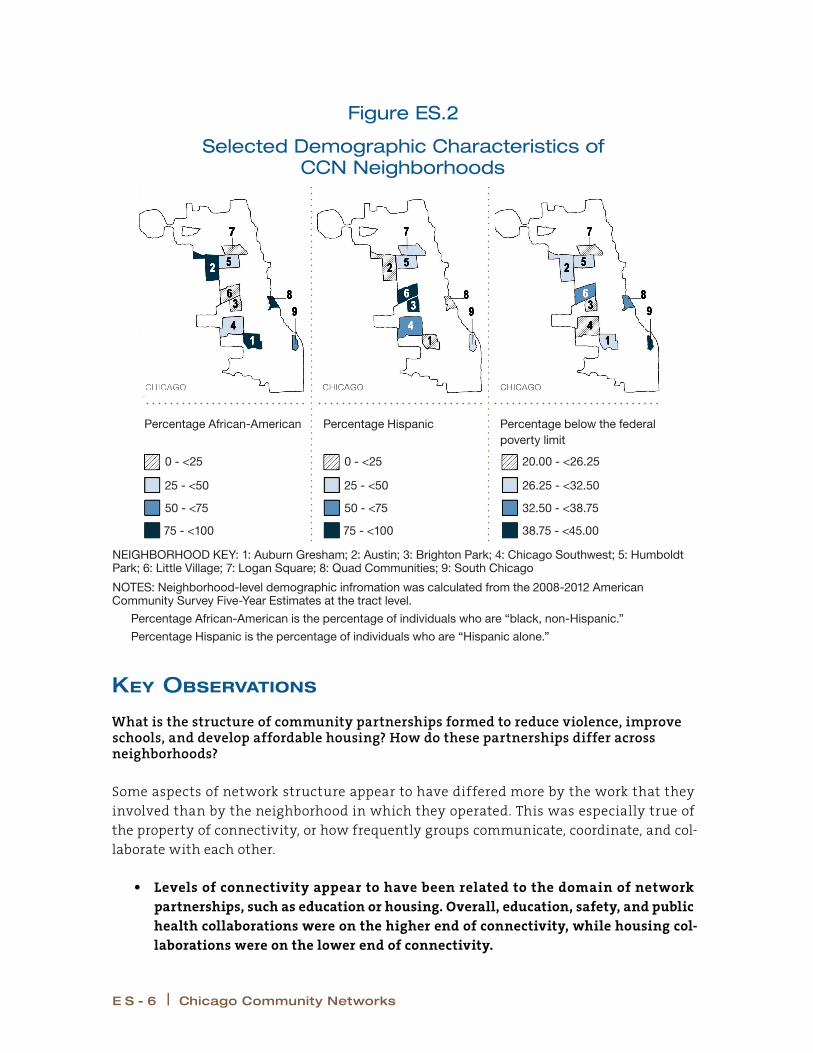
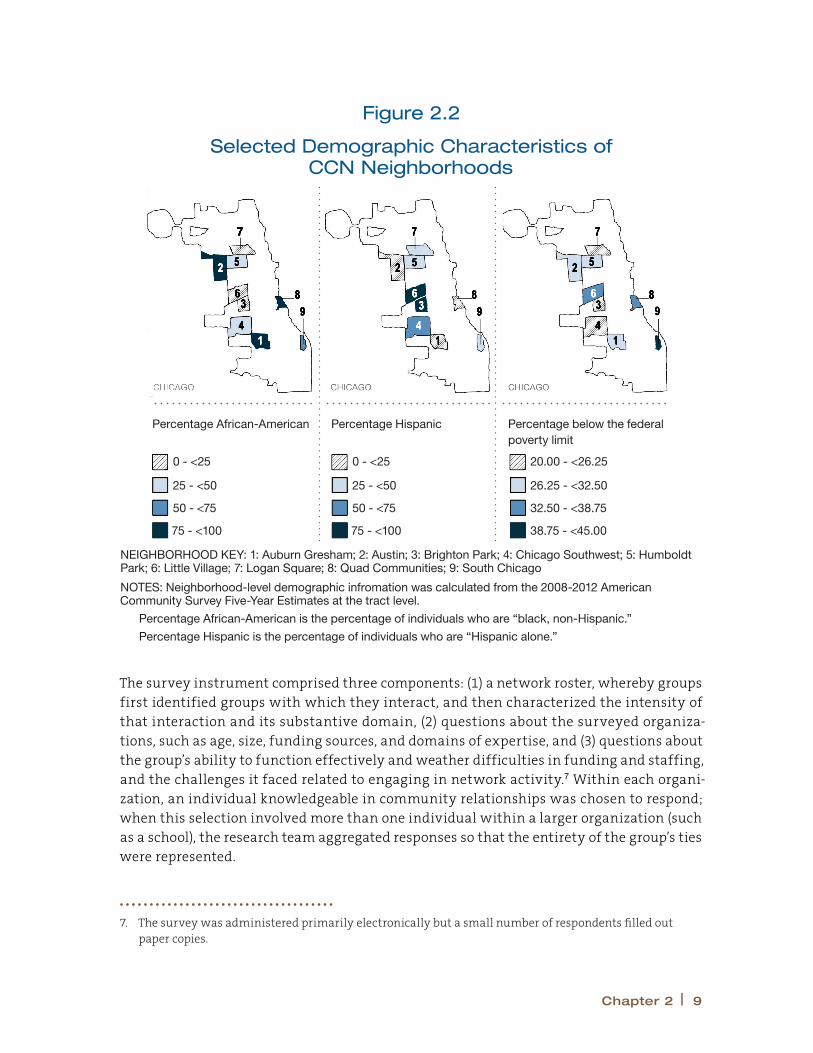
The CCN study included nine neighborhoods. As shown in Figure ES.2, in the first two pan-els, four were majority African-American neighborhoods: Auburn Gresham, Austin, Quad Communities, and South Chicago. Three had relatively high proportions of Latino residents: Brighton Park, Little Village, and Logan Square. And two had a more mixed composition of African-American and Latino residents: Chicago Southwest and Humboldt Park. As depicted in the third panel, none was high income, reflecting the study’s focus on network patterns in neighborhoods that community improvement initiatives would have likely targeted. The neighborhoods included some that had been supported for some time by MacArthur and LISC Chicago funding, and some that had not received extensive support at the time of survey fielding.
The CCN study measures not just the presence of local networks, but their specific struc-tural properties, and how they are used to improve neighborhoods and respond to local problems. These structural characteristics differ by neighborhood and by the areas of work they involve, and can help or hinder groups’ collective efforts to preserve affordable hous-ing, improve local schools, and address public safety concerns. The report examines the following aspects of a community network’s structure:
• Connectivity, or how frequently organizations communicate, coordinate, and collaborate with each other
• Trust and longevity, or the reliability of network ties, and how long they have lasted
• Power in networks, or which organizations occupy central positions in a network, whether a few groups dominate the network, or whether ties are more broadly shared among many groups
• Diversity and comprehensiveness, or whether networks include different types of organi-zations, and whether connections span multiple domains of work
E S - 4 | Chicago Community Networks
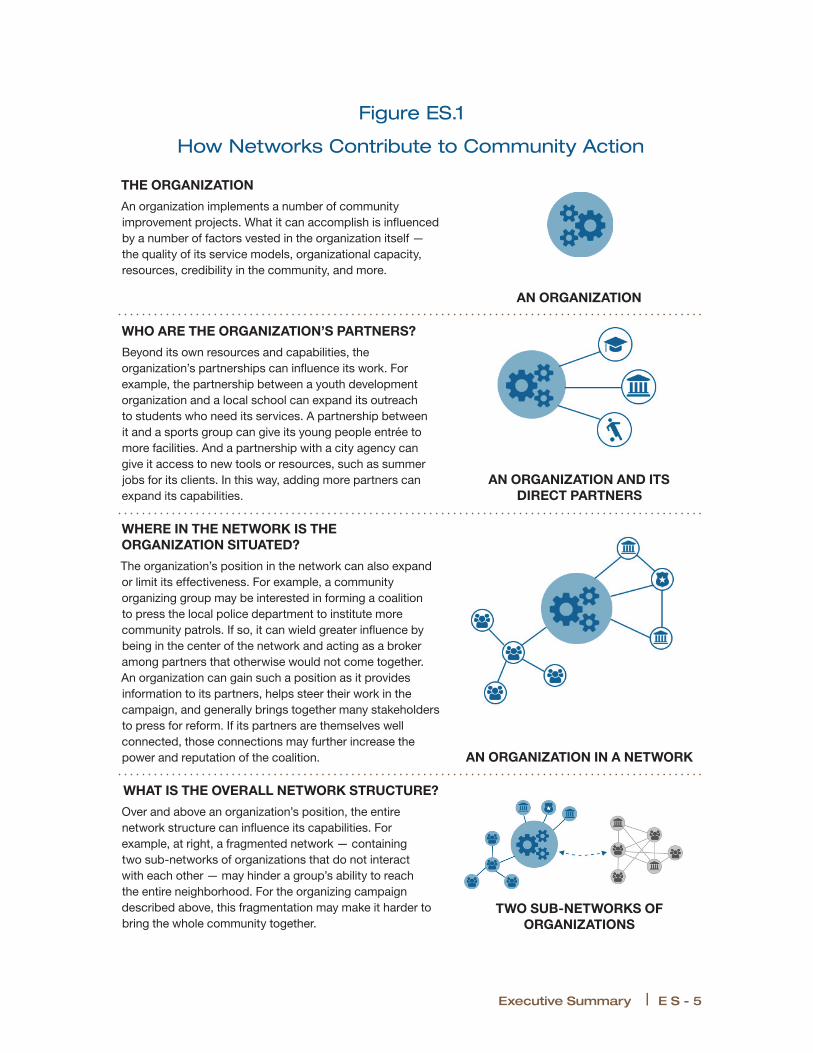
Figure ES.1
How Networks Contribute to Community Action
THE ORGANIZATION
An organization implements a number of community improvement projects. What it can accomplish is influenced by a number of factors vested in the organization itself — the quality of its service models, organizational capacity, resources, credibility in the community, and more.
AN ORGANIZATION
WHO ARE THE ORGANIZATION’S PARTNERS?
Beyond its own resources and capabilities, the organization’s partnerships can influence its work. For example, the partnership between a youth development organization and a local school can expand its outreach to students who need its services. A partnership between it and a sports group can give its young people entrée to more facilities. And a partnership with a city agency can give it access to new tools or resources, such as summer jobs for its clients. In this way, adding more partners can expand its capabilities.
AN ORGANIZATION AND ITS DIRECT PARTNERS
WHERE IN THE NETWORK IS THE ORGANIZATION SITUATED?
The organization’s position in the network can also expand or limit its effectiveness. For example, a community organizing group may be interested in forming a coalition to press the local police department to institute more community patrols. If so, it can wield greater influence by being in the center of the network and acting as a broker among partners that otherwise would not come together. An organization can gain such a position as it provides information to its partners, helps steer their work in the campaign, and generally brings together many stakeholders to press for reform. If its partners are themselves well connected, those connections may further increase the power and reputation of the coalition. AN ORGANIZATION IN A NETWORK
WHAT IS THE OVERALL NETWORK STRUCTURE?
Over and above an organization’s position, the entire network structure can influence its capabilities. For example, at right, a fragmented network — containing two sub-networks of organizations that do not interact with each other — may hinder a group’s ability to reach the entire neighborhood. For the organizing campaign described above, this fragmentation may make it harder to bring the whole community together.
TWO SUB-NETWORKS OF ORGANIZATIONS
Executive Summary | E S - 5
Key Observations
What is the structure of community partnerships formed to reduce violence, improve schools, and develop affordable housing? How do these partnerships differ across neighborhoods?
Some aspects of network structure appear to have differed more by the work that they involved than by the neighborhood in which they operated. This was especially true of the property of connectivity, or how frequently groups communicate, coordinate, and col-laborate with each other.
• Levels of connectivity appear to have been related to the domain of network partnerships, such as education or housing. Overall, education, safety, and public health collaborations were on the higher end of connectivity, while housing col-laborations were on the lower end of connectivity.
Figure ES.2
Selected Demographic Characteristics of CCN Neighborhoods
NEIGHBORHOOD KEY: 1: Auburn Gresham; 2: Austin; 3: Brighton Park; 4: Chicago Southwest; 5: Humboldt Park; 6: Little Village; 7: Logan Square; 8: Quad Communities; 9: South Chicago
NOTES: Neighborhood-level demographic infromation was calculated from the 2008-2012 American Community Survey Five-Year Estimates at the tract level.
Percentage African-American is the percentage of individuals who are “black, non-Hispanic.”
Percentage Hispanic is the percentage of individuals who are “Hispanic alone.”
Percentage African-American Percentage Hispanic Percentage below the federal poverty limit
0 - <25
25 - <50
50 - <75
75 - <100
0 - <25
25 - <50
50 - <75
75 - <100
20.00 - <26.25
26.25 - <32.50
32.50 - <38.75
38.75 - <45.00
E S - 6 | Chicago Community Networks

In the CCN study, connectivity refers to the overall levels of communication around work domains such as housing or education; the overall levels of coordination, whereby groups direct or focus their efforts in consultation with each other; or the overall levels of collabo-ration, which indicate the levels of significant and intensive community partnerships in a neighborhood. Connectivity tended to vary not by neighborhood but by the area of work involved in the network’s activity. For example, a housing network in Humboldt Park was more likely to be similar in connectivity to a housing network in Auburn Gresham than it was to the connectivity of the education network in the same neighborhood. This finding is especially striking because it tended to hold true despite there being different numbers of organizations across neighborhoods, which would normally influence levels of connectivity.
The finding that connectivity was associated more with area of work than neighborhood context may be related to the fact that housing by nature may require fewer partnerships. In contrast, educational partnerships may involve more interaction between schools and local organizations, as they work together to form youth groups that recruit from classes across buildings, operate on different campuses after school, or conduct outreach to chil-dren not attending class regularly. Since a major goal of place-based initiatives has been to encourage connectivity among community groups, this finding suggests that it is im-portant to consider how the domains of work that groups target for action form different starting contexts for these initiatives. For example, federal initiatives such as Promise Neighborhoods focus on education, while Choice Neighborhoods focuses on housing, with potentially different levels of connectivity.
In contrast with connectivity, other aspects of network structure appear to have been influ-enced by neighborhood environment — both its institutional and demographic character-istics. A network’s concentration of power, as well as the diversity and comprehensiveness of local connections, appears to have been associated with the nature of political leadership in the neighborhood. Overall levels of trust, however, appear to have been associated with the neighborhood’s racial and ethnic composition.
• While the majority of network ties were trusting across all neighborhoods, survey respondents in African-American neighborhoods reported trust in their public agency partners less frequently.
The CCN study asked local groups to report on whether they trusted their public agency partner to carry out their mission in a way that was good for the neighborhood, and across all neighborhoods. Between 70 and 80 percent of ties contained at least one member who indicated trust in the other. However, groups in African-American neighborhoods trusted their partners less frequently, a finding associated with community actors’ views of public institutions. Given longstanding views about discrimination by public agencies, and recent highly publicized episodes of police misconduct in Chicago, this finding is not surprising. Network power was more concentrated in neighborhoods where elected officials were more prominent. It was less concentrated in neighborhoods where community organizing groups were more prominent.
Executive Summary | E S - 7

In the CCN study, the concentration of power in networks refers to whether most ties are held by a small number of organizations, or whether connections are more dispersed. In contrast to connectivity, neighborhood context was also associated with the concentration of network power. That is, a housing network in Humboldt Park was more likely to have concentrations of power similar to the neighborhood’s education network than it was to a housing network in Auburn Gresham. In contrast with the way that demography was associated with overall levels of trust, the character of local political leadership appears to have been associated with the concentration of network power. Networks where elected officials were more prominent — often operating in tandem with Chicago’s ward-based political system — were more hierarchical on the whole, meaning that a fewer number of groups held more connections. Networks in neighborhoods where community organizing groups were prominent appear to have had less of a concentration of network power, mean-ing that ties were more broadly dispersed.
• Neighborhoods where community organizing groups were prominent were more likely to have a greater proportion of comprehensive ties.
Neighborhood leadership also appears to have been associated with local levels of network comprehensiveness — or, the number of work domains around which groups engaged each other, measured, for example, by whether groups worked together not only on education but also housing or workforce development. Both Logan Square and Chicago Southwest reported the highest levels of comprehensive ties, and the most central organizations in these neighborhoods were highly regarded community organizing agencies — the Logan Square Neighborhood Association (LSNA) and the Southwest Organizing Project (SWOP). These central groups — which focus on mobilizing other organizations around a host of policy issues including education, safety, and housing — may have contributed over time to a dynamic in which groups communicated, coordinated, and collaborated with each other in more than one area. Since Comprehensive Community Initiatives seek to promote connections across domains of work,8 it is important to know that neighborhoods with leadership vested in community organizing groups may sometimes possess a greater pro-portion of comprehensive ties. Funders might therefore choose either to build upon these connections or look to other places where they may be built up.
Which community structures appear to promote better-implemented community col-laborations and allow groups to successfully influence public policy?
Insights from the CCN study are a rare opportunity to understand not just that the struc-ture of local networks can influence the implementation of collective projects, but which structural elements appear more beneficial and how so.
8. Comprehensive Community Initiatives are multi-year efforts, typically located in poor, urban communities, designed to improve neighborhood conditions and residential well-being.
E S - 8 | Chicago Community Networks
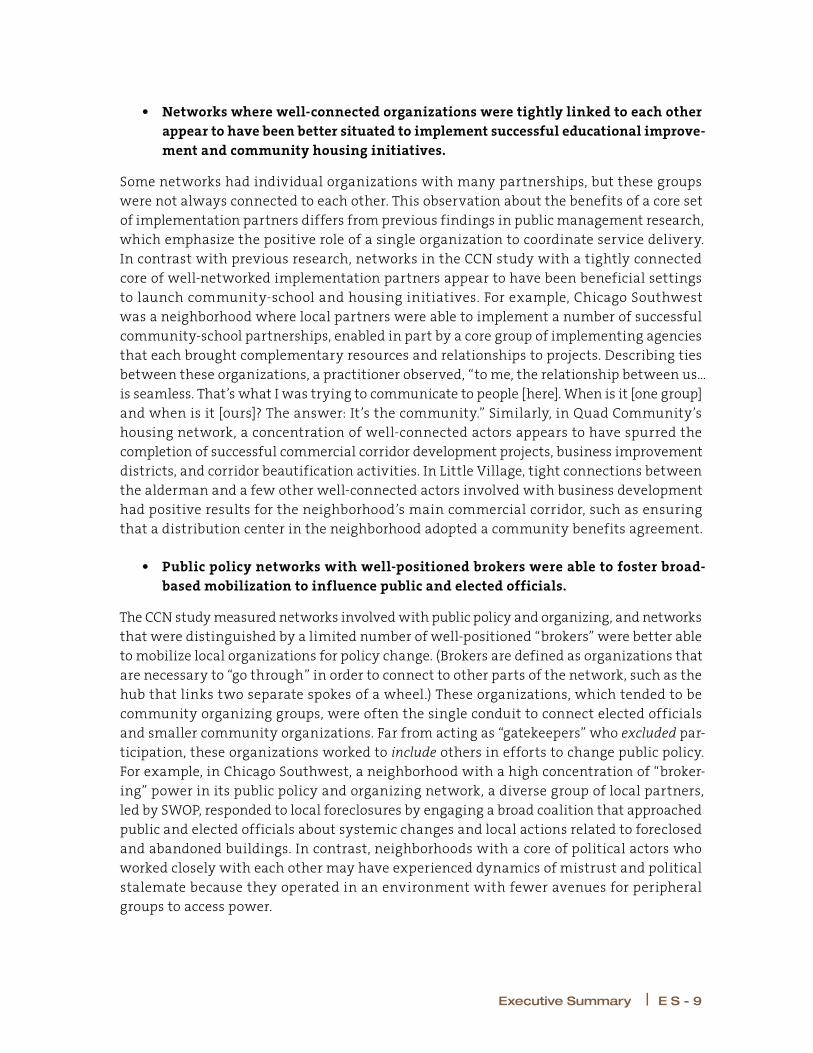
• Networks where well-connected organizations were tightly linked to each other appear to have been better situated to implement successful educational improve-ment and community housing initiatives.
Some networks had individual organizations with many partnerships, but these groups were not always connected to each other. This observation about the benefits of a core set of implementation partners differs from previous findings in public management research, which emphasize the positive role of a single organization to coordinate service delivery. In contrast with previous research, networks in the CCN study with a tightly connected core of well-networked implementation partners appear to have been beneficial settings to launch community-school and housing initiatives. For example, Chicago Southwest was a neighborhood where local partners were able to implement a number of successful community-school partnerships, enabled in part by a core group of implementing agencies that each brought complementary resources and relationships to projects. Describing ties between these organizations, a practitioner observed, “to me, the relationship between us…is seamless. That’s what I was trying to communicate to people [here]. When is it [one group] and when is it [ours]? The answer: It’s the community.” Similarly, in Quad Community’s housing network, a concentration of well-connected actors appears to have spurred the completion of successful commercial corridor development projects, business improvement districts, and corridor beautification activities. In Little Village, tight connections between the alderman and a few other well-connected actors involved with business development had positive results for the neighborhood’s main commercial corridor, such as ensuring that a distribution center in the neighborhood adopted a community benefits agreement.
• Public policy networks with well-positioned brokers were able to foster broad-based mobilization to influence public and elected officials.
The CCN study measured networks involved with public policy and organizing, and networks that were distinguished by a limited number of well-positioned “brokers” were better able to mobilize local organizations for policy change. (Brokers are defined as organizations that are necessary to “go through” in order to connect to other parts of the network, such as the hub that links two separate spokes of a wheel.) These organizations, which tended to be community organizing groups, were often the single conduit to connect elected officials and smaller community organizations. Far from acting as “gatekeepers” who excluded par-ticipation, these organizations worked to include others in efforts to change public policy. For example, in Chicago Southwest, a neighborhood with a high concentration of “broker-ing” power in its public policy and organizing network, a diverse group of local partners, led by SWOP, responded to local foreclosures by engaging a broad coalition that approached public and elected officials about systemic changes and local actions related to foreclosed and abandoned buildings. In contrast, neighborhoods with a core of political actors who worked closely with each other may have experienced dynamics of mistrust and political stalemate because they operated in an environment with fewer avenues for peripheral groups to access power.
Executive Summary | E S - 9

This observation, along with the previous one, suggests that policymakers might look to launch community improvement initiatives in neighborhoods that combine a tightly con-nected group of well-connected service partners with actors who mobilize broad segments of the community around public policy.
• Networks that combined public policy and organizing with service delivery appear to have created some important advantages for local partnerships.
Networks that spanned service delivery and a dimension of public policy and organizing may have had some advantages for both the quality of services and their ability to attract resources and partners. For example, in Logan Square, about 50 percent of ties between groups that related to education also related to public policy and organizing. The advantages of such connections can be seen in the implementation of the Parents as Mentors program, an initiative that both placed local parents in classrooms as aides and offered them a chance to become community leaders and take part in political action around education more broadly. The well-regarded program was first developed by LSNA in the 1990s, and by 2012 LSNA was operating it in nine schools. This finding reinforces the idea that an important component of comprehensive community initiatives may be engagement in both service delivery and public policy, where one lends credibility to the other and vice versa.9
Conclusion
In recent years, the fabric of community connections has been especially strained in Chicago because of continued gun violence, changes in the public schools, a state budget crisis, and mobilization against police violence. Looking forward, the CCN study will examine the stability and evolution of network structures through analyses of its second survey wave. In the meantime, the present report shows how networks are built and deployed, both to proactively improve neighborhoods and respond to these types of external shocks. Funders and local practitioners will not have access to a social network survey before launching an initiative, but at a broad level, the structural properties described in this report have a qualitative, observable component. In other words, it is possible to understand generally how communities differ before launching an initiative in that location, or how to support positive network dynamics — such as forming a well-connected core of actors for service delivery or taking an inclusive approach to brokering more disparate groups around policy change. In doing so, practitioners and policymakers will approach their tasks with a sharper understanding of neighborhood life, one appropriate to the challenges inherent in the work.
9. See Robert J. Chaskin and Mikael Karlstrom, Beyond the Neighborhood: Policy Engagement and Systems Change in the New Communities Program (New York: MDRC, 2012).
E S - 1 0 | Chicago Community Networks

ChApTer
1
Introduction
Federal, state, and local policies focused on neighborhood improvement have long em-phasized the need for community organizations to share information, coordinate their activities, and collaborate to deliver services. On the federal level, these place-based
programs have sought to create or leverage partnerships to improve housing conditions, educational outcomes, and public safety.1 On the state and local level, charitable founda-tions have fostered neighborhood collaboration, through Comprehensive Community Initiatives (CCIs),2 and through the increasingly popular Collective Impact framework, which asks local organizations to convene around a common agenda, hold groups account-able for progress, and measure results.3 While these kinds of initiatives are often focused on promoting community-wide outcomes such as safety and education, they also attempt to build “community capacity,” defined as the systems that promote collective problem solving and community well-being more broadly.4
All these initiatives, launched in different settings around the country, raise questions about the conditions and contexts that promote effective community collaborations. Policymakers and practitioners have long recognized that neighborhood contexts for collaboration are often very different, and that programs that operate well in one setting may not do so in another, due to different local patterns of cooperation or local leadership. But there has been
1. In recent years, these programs have included Choice Neighborhoods, Promise Neighborhoods, and the Byrne Criminal Justice grants. Choice Neighborhoods focuses on redeveloping distressed public housing and revitalizing the surrounding community; Promise Neighborhoods coordinates community groups and schools around data-driven improvement; and Byrne grants coordinate community action around safety.
2. CCIs are multi-year efforts, typically located in poor, urban communities, designed to improve neighborhood conditions and residential well-being. They are distinguished by their emphasis on two guiding principles: (1) comprehensiveness, an attempt to maximize positive outcomes through simultaneous focus on social, economic, and physical conditions, and (2) community building, an emphasis on the development of local leadership, social capital, and collaborative networks to strengthen capacity. Kubisch et al. (1997).
3. Collective Impact is “the commitment of a group of important actors from different sectors to a common agenda for solving a specific social problem.” Kania and Kramer (2011).
4. Chaskin, Brown, Venkatesh, and Vidal (2001).
Chapter 1 | 1
almost no formal measurement of how community organizations work together, whether differences in patterns of collaboration and leadership exist across neighborhoods, and how these patterns are influenced by the nature of the problems being addressed.5 Without this information, program designers and funders cannot best select neighborhoods to launch improvement programs.
The question of how local groups collaborate is important not just for effective program implementation, but also for other aspects of community life. Patterns of collaboration may be associated with whether different racial and ethnic groups integrate, how groups resolve contentious issues,6 and how local political power is exercised.7 For example, in Chicago, the setting for this study, the last several years have been turbulent for the city and its neighborhoods. Among other issues, continued gun violence and changes within the public schools have affected communities, even as the state’s budget crisis and mobi-lization around police violence have challenged political leadership. Because of this strain on communities and public institutions, residents have sometimes expressed mounting frustration, raising questions about how a new generation of leaders and community orga-nizations will emerge, and whether disadvantaged communities will be able to mobilize effectively to meet residents’ needs. Examining networks and how they change is one way of addressing these critical questions for community and civic life.
Funded by The John D. and Catherine T. MacArthur Foundation, and fielded in collabora-tion with the Local Initiatives Support Corporation of Chicago and its local partners, the Chicago Community Networks (CCN) study is one of the most extensive attempts yet to characterize and measure the strength of networks among community organizations and show how they contribute to more successful partnerships for service delivery and political leadership. A mixed-methods study, it contains two data sources: (1) a two-wave network survey in nine Chicago neighborhoods, administered to organizations conducting community development activities,8 and (2) field research, including interviews with or-ganizations occupying positions within the core and periphery of neighborhood networks. The first network survey, conducted in 2013, provided quantitative data about patterns of connection, while the field research helped the study team interpret survey results, associ-
5. De la Rosa Aceves and Greenberg (2016).
6. Lauman, Galaskiewicz, and Marsden (1978).
7. Lauman and Knoke (1987).
8. The CCN study surveyed different kinds of organizations seen as meaningfully participating in community development activities. Groups included large and small social service agencies, community development corporations, public agencies such as police departments and schools, religious organizations, and elected officials. The instrument asked how organizations communicated, coordinated, or collaborated in their work in fields related to housing and commercial real estate development, education, economic and workforce development, public spaces and the arts, public health and safety, and public policy and organizing. Groups did not need to have a formal contractual relationship with each other to communicate, coordinate, or collaborate.
2 | Chicago Community Networks
ate patterns of network activity with broader outcomes, and trace the processes by which these structures and outcomes were connected.
While the CCN study is not an evaluation of community improvement efforts per se, it attempts to learn from the work of funders and local partners and to speak to community-based initiatives around the country that emphasize collaboration. This report, the first of two, is intended for practitioners, funders, and researchers, and asks the following questions:
• What is the structure of community partnerships formed to reduce violence, improve schools, and develop affordable housing? How do these partnerships differ across neigh-borhoods?
• Which community structures appear to promote better-implemented collaborations, and allow groups to successfully influence public policy?
The report is organized into seven chapters. Chapter 2 provides an overview of social net-work analysis, which is a method for understanding the structural characteristics of local partnerships. It also describes the CCN study’s methodology, which incorporates a rich combination of quantitative and qualitative data. The subsequent chapters of this report describe key findings from the CCN study related to the following aspects of a community network’s structure:
• Connectivity, or how frequently groups communicate, coordinate, and collaborate with each other
• Power in networks, or which groups occupy central positions in a network, whether a few groups dominate the network, or whether ties are more broadly shared among many groups
• Trust and longevity, or the reliability of network ties, and how long they have lasted
• Diversity and comprehensiveness, or whether networks include different types of organi-zations, and whether connections span multiple domains of work
Each aspect is considered in a separate chapter that:
• Defines the aspect
• Illustrates its importance for policy, public management, and community life
• Describes how the aspect varied across Chicago neighborhoods
• Analyzes how the aspect contributed to partnerships that were formed to improve schools, revitalize the physical fabric of neighborhoods, and address public safety
The chapters describe these characteristics and their relevance for policy, public manage-ment, and neighborhood life more broadly, before turning to how these structural aspects
Chapter 1 | 3
varied across neighborhoods and how they contributed to more or less effective community collaborations. Therefore, they include both a descriptive and an analytic component.9
The report complements a web-based series on the MDRC website,10 and will be followed by a final report analyzing the second wave of the CCN survey — which was conducted in 2016 to understand how patterns described in this report changed over the course of three years. Scheduled for release in 2018, the final report will focus more heavily on changes in network structure between survey waves. Interim briefs will be published throughout 2017.
9. Few studies have provided such empirical descriptions of community networks. For some important exceptions, see the 2003 study of Bay Area community environmental networks (Ansell, 2003), and the 1984 comparative studies of Tower Town and River City (Galaskiewicz and Krohn, 1984). In Chicago, the 2009 network studies about elite action networks are an important point of reference related to the present findings as they capture relationships between prominent individuals engaged in community development efforts (Sampson and Graif, 2009). This study attempts to add to these kinds of descriptive efforts by not only measuring community networks, but describing their importance for collective work.
10. Website: www.mdrc.org/chicago-community-networks-study.
4 | Chicago Community Networks

ChApTer
2
Social Network Analysis and the Methodology
of the Chicago Community Networks Study
This report uses social network analysis (SNA), a toolkit for the measurement and map-ping of relationships among a set of actors in order to describe the underlying patterns, or structure, of local partnerships. This emphasis on structure is important because it
has implications related to how quickly information and resources flow, how widely power and influence are distributed among organizations, and how effectively the community can mobilize to address shocks such as deteriorating economic conditions or budget cuts.
Figure 2.1 illustrates different ways that the structure of local partnerships may influence the implementation of local programs. It begins by describing how an individual organiza-tion’s ability to successfully implement a project may depend on a number of factors, start-ing with the quality of its own program models and resources in terms of money and staff. It then considers how the reach of this group can be extended by partnerships with other community organizations, such as between a youth group and a school or sports club. At the next level, the position of an organization within the network may matter for the group’s ability to help the neighborhood coalesce around policy change. Finally, at the level of the whole network, the figure describes how overall patterns of connection or fragmentation can help influence a network’s success.
While there is broad agreement in the literature that community networks can contribute to the above kinds of dynamics, researchers are still grappling with the specific ways that network structures emerge and how they help form effective frameworks for collaborative community improvement projects and efforts to improve public policy.1
MDRC, The MacArthur Foundation, and the Local Initiatives Support Corporation of Chicago (LISC Chicago) developed a social network survey that captured the relational data necessary
1. Popp et al. (2014).
Chapter 2 | 5
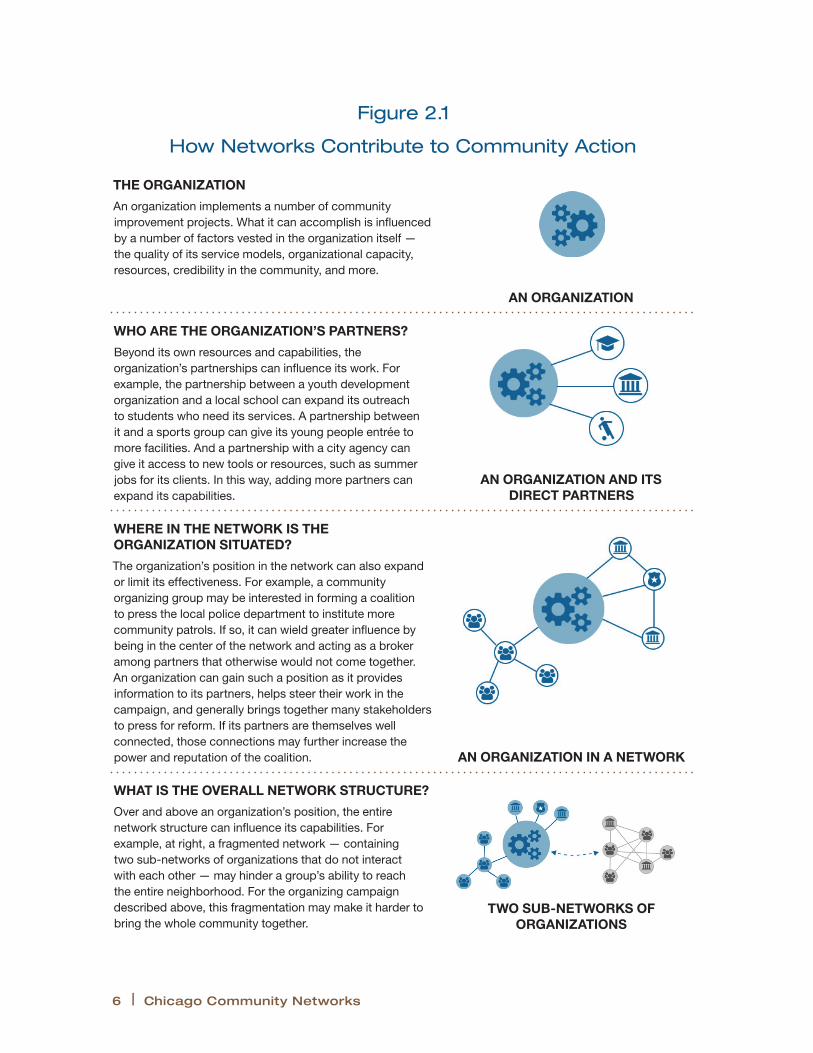
Figure 2.1
How Networks Contribute to Community Action
THE ORGANIZATION
An organization implements a number of community improvement projects. What it can accomplish is influenced by a number of factors vested in the organization itself — the quality of its service models, organizational capacity, resources, credibility in the community, and more.
AN ORGANIZATION
WHO ARE THE ORGANIZATION’S PARTNERS?
Beyond its own resources and capabilities, the organization’s partnerships can influence its work. For example, the partnership between a youth development organization and a local school can expand its outreach to students who need its services. A partnership between it and a sports group can give its young people entrée to more facilities. And a partnership with a city agency can give it access to new tools or resources, such as summer jobs for its clients. In this way, adding more partners can expand its capabilities.
AN ORGANIZATION AND ITS DIRECT PARTNERS
WHERE IN THE NETWORK IS THE ORGANIZATION SITUATED?
The organization’s position in the network can also expand or limit its effectiveness. For example, a community organizing group may be interested in forming a coalition to press the local police department to institute more community patrols. If so, it can wield greater influence by being in the center of the network and acting as a broker among partners that otherwise would not come together. An organization can gain such a position as it provides information to its partners, helps steer their work in the campaign, and generally brings together many stakeholders to press for reform. If its partners are themselves well connected, those connections may further increase the power and reputation of the coalition. AN ORGANIZATION IN A NETWORK
WHAT IS THE OVERALL NETWORK STRUCTURE?
Over and above an organization’s position, the entire network structure can influence its capabilities. For example, at right, a fragmented network — containing two sub-networks of organizations that do not interact with each other — may hinder a group’s ability to reach the entire neighborhood. For the organizing campaign described above, this fragmentation may make it harder to bring the whole community together.
TWO SUB-NETWORKS OF ORGANIZATIONS
6 | Chicago Community Networks
for SNA.2 The survey asked respondents to characterize their relationships with specific organizations drawn from a roster of known actors. The research team also surveyed the organizations themselves in order to capture the connections (or lack thereof) between them. SNA allowed the research team to describe how connected organizations were in general, which organizations occupied prominent positions within the network, and whether con-nections were broadly shared or instead concentrated among a few organizations.
These structural dimensions form the basis of this report, since they could affect how programs that involve collaboration were launched successfully at the local level. For ex-ample, as shown in Figure 2.1, the position of an organization within the overall network influences what it can accomplish, even if it performs well and works effectively with its immediate partners.3 This is because an individual organization may be tightly tied to its own partners, but the cluster formed by these connections may be isolated and may not bridge to another set of groups. As Box 2.1 desbribes, researchers have addressed these structural patterns in literature about communities and public management.4 One of this report’s objectives is to present this literature to an audience of policymakers and practitio-ners, in order to show how local groups and funders can foster contexts that are conducive to effective collaboration.
Methodology and Data Sources
The Chicago Community Networks (CCN) study is one of the most extensive attempts to measure networks among community organizations and show how they matter for service delivery and political leadership. A mixed-methods study, it contains two data sources: (1) a two-wave network survey in nine Chicago neighborhoods, administered to organizations conducting community development activities, and (2) field research, including interviews with organizations occupying positions within the core and periphery of neighborhood networks. As explained in Chapter 1, the network survey, conducted in 2013,5 provided quantitative data about patterns of connection, while the field research helped the study
2. Organizational surveys can include questions about interactions with other organizations, and may help researchers understand how and why community organizations collaborate with each other in general. However, they provide no information on the larger structure of relationships in a community.
This distinction between an individual actor’s relationships and those in the system as a whole is sometimes described as the difference between an egocentric perspective and a whole network perspective. SNA allows for the consideration of any one organization’s individual ties and a whole network perspective, whereas other approaches only allow for egocentric perspectives.
3. For example, see Burt (1992) for a discussion of individual actors who act as brokers occupying “structural holes” in systems.
4. See Provan, Veazie, Staten, and Teufel-Sone (2005) for a practitioner-oriented review of SNA as a way of thinking about strengthening inter-organizational partnerships.
5. To understand how network structures change over time, a second wave of the survey was finalized in late 2016 and will be the subject of an early 2018 deliverable.
Chapter 2 | 7
team interpret survey results, associate patterns of network activity with broader outcomes, and trace the processes by which these structures and outcomes were connected.
The site of this research is Chicago, whose neighborhoods offer ideal settings to study com-munity collaborations. The city is well known as a place that emphasizes relationships and connections in the political and business realms and around community development efforts in particular. Chicago’s political culture was once summed up in a statement by a local ward leader, “[w]e don’t want nobody that nobody sent,” showing that connec-tions — for better or worse — are critical to getting work done. With respect to community development, Chicago is a city that has pioneered a more collaborative approach among community organizations to improve neighborhoods. One such program was Chicago’s New Communities Program: Over a 10-year period, The MacArthur Foundation provided more than $50 million in direct support to LISC Chicago, a citywide community development intermediary, and its local community-based partners.6 The initiative fostered partnerships among local organizations under the theory that the whole neighborhood would be better able to respond to external shocks such as budget cuts or recessions.
The research team fielded the survey in Chicago neighborhoods that were chosen to repre-sent a breadth of demographic and organizational characteristics. (See Figure 2.2.) In each neighborhood, MDRC worked with LISC Chicago and local partners to generate a list of organizations (393 in total) that were viewed as relevant to and influential for community development, including schools, community organizations, elected officials, and govern-ment agencies. Since MDRC had been engaged in field research in Chicago related to the New Communities Program since 2007, the research team supplemented these lists with information gathered from qualitative inquiry over time. Through intensive follow-up and outreach, the study achieved high response rates (over 80 percent) among the identified organizations in every neighborhood surveyed.
6. For an overview of the New Communities Program, see Greenberg, Verma, Dillman, and Chaskin (2010).
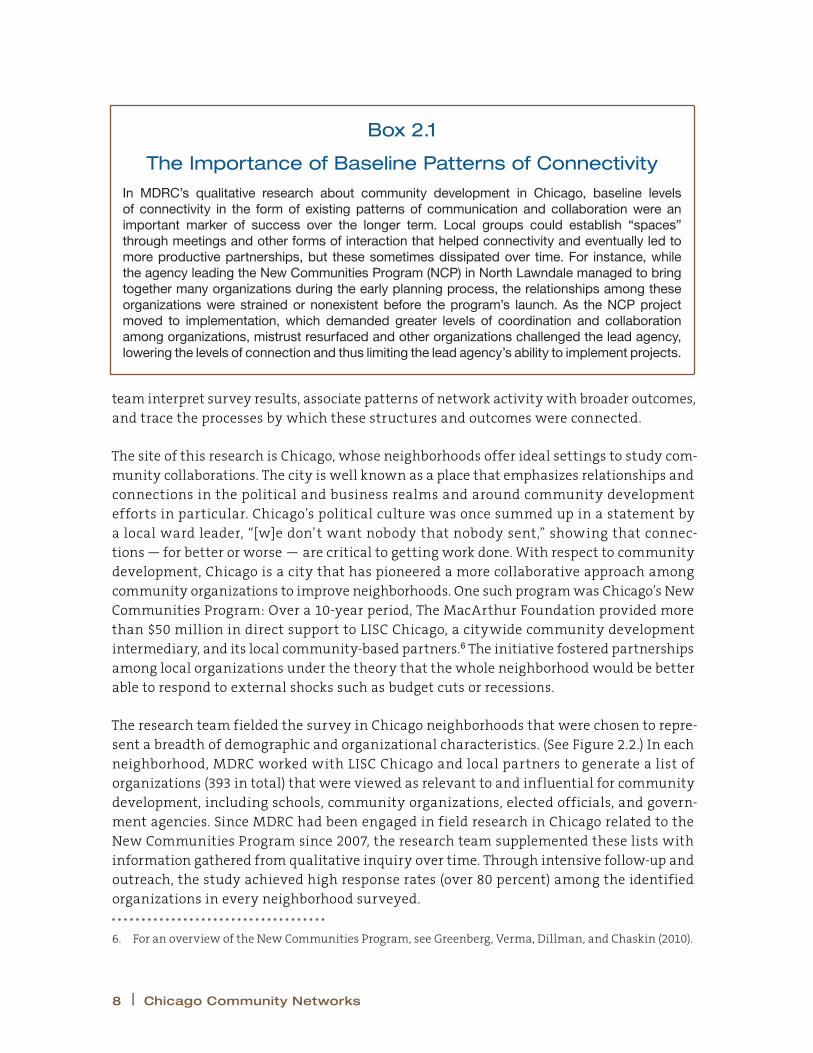
Box 2.1
The Importance of Baseline Patterns of Connectivity
In MDRC’s qualitative research about community development in Chicago, baseline levels of connectivity in the form of existing patterns of communication and collaboration were an important marker of success over the longer term. Local groups could establish “spaces” through meetings and other forms of interaction that helped connectivity and eventually led to more productive partnerships, but these sometimes dissipated over time. For instance, while the agency leading the New Communities Program (NCP) in North Lawndale managed to bring together many organizations during the early planning process, the relationships among these organizations were strained or nonexistent before the program’s launch. As the NCP project moved to implementation, which demanded greater levels of coordination and collaboration among organizations, mistrust resurfaced and other organizations challenged the lead agency, lowering the levels of connection and thus limiting the lead agency’s ability to implement projects.
8 | Chicago Community Networks
The survey instrument comprised three components: (1) a network roster, whereby groups first identified groups with which they interact, and then characterized the intensity of that interaction and its substantive domain, (2) questions about the surveyed organiza-tions, such as age, size, funding sources, and domains of expertise, and (3) questions about the group’s ability to function effectively and weather difficulties in funding and staffing, and the challenges it faced related to engaging in network activity.7 Within each organi-zation, an individual knowledgeable in community relationships was chosen to respond; when this selection involved more than one individual within a larger organization (such as a school), the research team aggregated responses so that the entirety of the group’s ties were represented.
7. The survey was administered primarily electronically but a small number of respondents filled out paper copies.
Figure 2.2
Selected Demographic Characteristics of CCN Neighborhoods
NEIGHBORHOOD KEY: 1: Auburn Gresham; 2: Austin; 3: Brighton Park; 4: Chicago Southwest; 5: Humboldt Park; 6: Little Village; 7: Logan Square; 8: Quad Communities; 9: South Chicago
NOTES: Neighborhood-level demographic infromation was calculated from the 2008-2012 American Community Survey Five-Year Estimates at the tract level.
Percentage African-American is the percentage of individuals who are “black, non-Hispanic.”
Percentage Hispanic is the percentage of individuals who are “Hispanic alone.”
Percentage African-American Percentage Hispanic Percentage below the federal poverty limit
0 - <25
25 - <50
50 - <75
75 - <100
0 - <25
25 - <50
50 - <75
75 - <100
20.00 - <26.25
26.25 - <32.50
32.50 - <38.75
38.75 - <45.00
Chapter 2 | 9

Distinguishing Features of the CCN Study
The survey used in the CCN study is distinct from other network survey instruments by its attention to the intensity, quality, and nature of local ties (connections). That is, the survey asked organizations to identify not just their relationships, but also the frequency of their interactions and the areas in which they worked together.
Intensity is defined by the level of interaction: Groups could say that they communicated with their partners — generally indicating low levels of direct interaction (such as attending a meeting, or having occasional phone calls or e-mails) where groups described their work to each other. Alternatively, they could coordinate with the partner, targeting their efforts in consultation with the other group. Finally, they could collaborate, the highest level of interaction, involving regular meetings, and partnerships that divide up responsibilities, share formal or informal resources, or work together to assess progress.
In addition to questions about intensity, the survey asked whether the partner was a trusted one, as a way of assessing the quality of ties. Respondents were asked the extent to which they agreed with the following statement: “I trust this organization to fulfill their mission in a way that’s good for the community.” Answers were on a scale from 1 to 5 and ranged from “strongly disagree” to “strongly agree.” The definition of trust that was given was worded to allow for organizations to consider intent, priorities, and capacity when making this determination.
Finally, in order to explore how relationship patterns might differ by policy domain, the survey asked whether respondents communicated, coordinated, or collaborated in each of the following six work domains: education; community well-being (including youth development and public health and safety); housing and commercial real estate; public policy and organizing; public spaces, community image, and the arts; and economic and workforce development.
The research team actively engaged local practitioners in interpreting network survey find-ings, validating survey results, and determining the appropriate analyses for the network data. The research team conducted interviews to help validate survey findings and to de-velop cases of successful and unsuccessful cooperation that shed light on the importance of networks. Since the CCN study was not describing a single kind of program — such as community mental health services8 — no consistent quantitative outcome data were available. As a result, it was necessary to link patterns within the quantitative network data to accounts from field research of the overall strengths and challenges experienced by groups as they implemented projects in partnership with each other. The research team conducted over 80 post-survey interviews, showing network maps to participants as part of the protocol. These qualitative data built on several hundred interviews previously con-ducted through MDRC’s study of the New Communities Program.
8. See Provan and Milward (1995).
1 0 | Chicago Community Networks

Studies seldom combine qualitative research and SNA.9 Thus, the CCN study represents an opportunity to acquire both theoretical and practical insights about the ways that networks contribute to or adversely affect program implementation and community mobilization around public policy. Survey responses were used to measure network patterns at local levels, while field research helped determine how these patterns developed over time and what strategies were used to leverage or change these partnership structures. This approach therefore showed not only how different contexts or structures could be advantageous for community partnerships, but also those elements that local practitioners could change or leverage to their advantage — something that is evidently important for policy and com-munity practice, and that social network studies in general have long been indicated to be an important and often missing consideration.10
Chicago Neighborhoods Included in the Survey
The CCN study included nine neighborhoods. As shown in Figure 2.2, in the first two pan-els, four were majority African-American neighborhoods: Auburn Gresham, Austin, Quad Communities, and South Chicago. Three had relatively high proportions of Latino residents: Brighton Park, Little Village, and Logan Square. And two had a more mixed composition of African-American and Latino residents: Chicago Southwest and Humboldt Park. As depicted in the third panel, none was high income, reflecting the study’s focus on network patterns in neighborhoods that community improvement initiatives would have likely targeted.
The following brief vignettes illustrate aspects of community and organizational life in each neighborhood.
Auburn Gresham is a small, predominantly African-American neighborhood on the south-west side of Chicago, consisting mostly of modest but well-kept, single family homes. It has experienced a steadily shrinking population in recent decades, particularly involving a loss of younger residents, and, until recently, a rapidly declining retail corridor along 79th Street. At the same time, Auburn Gresham has a higher rate of home ownership than surrounding disinvested communities; an attractive and solid housing stock; and a stable population of older residents, many of whom are civically active. The neighborhood has relatively few large and well-established organizations, although it has a number of smaller ones. The local alderman and a powerful local institution and its leader — the Catholic parish of St. Sabina and its activist pastor — have often played a critical role in collective efforts. There are a number of grassroots efforts and community civic activities in the neighborhood.
9. Edwards (2010).
10. Emirbayer and Goodwin (1994).
Chapter 2 | 1 1

Austin is the largest Chicago Community Area,11 located on the west side of the city. Once a predominantly white neighborhood, Austin experienced a rapid demographic shift in the 1960s, and by the 1970s had become the predominantly African-American neighborhood it is today. Historically, Austin has experienced disinvestment as wealth and capital flows moved elsewhere, although its northern section has a larger base of homeowners. While a number of organizations in the neighborhood have acted at some point as conveners, collaborative efforts have nonetheless been challenging in Austin in part due to mistrust among stakeholders.
Brighton Park is located on the southwest side of Chicago. The neighborhood features a mix of residential, manufacturing, and trucking facilities. About half of the occupied housing consists of rental units. Latinos make up the majority of the population in the neighborhood. The neighborhood has been characterized as having very few community organizations. Nonetheless, a prominent community organizing group has led significant community efforts in the areas of community safety and education.
Chicago Southwest is a large area that encompasses several Chicago Community Areas, including Chicago Lawn, southern Gage Park, and eastern West Lawn. It is among the most racially and ethnically mixed areas in Chicago and has undergone rapid demographic change over the past three decades; once a historically White, working class area, by 1990, White residents were a bare majority. By 2010, Chicago Lawn’s population had shifted to 49 percent African-American and 45 percent Latino. A community organizing group has anchored collective efforts that have included local community groups and faith-based organizations and has successfully led campaigns in the area of housing.
Humboldt Park is located on Chicago’s near northwest side, surrounding a 207-acre park of the same name. Roughly half the total population is Latino, and African-Americans repre-sent just under 40 percent of the population. The eastern part of the neighborhood is the longstanding center of Chicago’s Puerto Rican community and is anchored by a lively retail strip and a host of Puerto Rican cultural institutions and social services. Encroaching gen-trification in the eastern portion of the neighborhood since the 1990s has prompted action to preserve affordable housing for working class and low-income families. The western part of the neighborhood is primarily African-American. This area has been plagued by historic disinvestment, with few community organizations and a relatively weak commercial sec-tor. Since the early 2000s, Humboldt Park’s collective efforts have focused on bridging the gap between the two sections of the neighborhood.
Little Village is located on the west side of Chicago. The neighborhood is home to one of the largest Mexican communities in the Midwest. While a low-income neighborhood, it has not suffered the kind of disinvestment that has characterized nearby neighborhoods to the north. It has a vibrant commercial corridor along 26th Street. Little Village is home to
11. Chicago Community Areas are portions of the city whose boundaries researchers at the University of Chicago defined long ago, but that still retain some meaning in terms of neighborhood definitions.
1 2 | Chicago Community Networks
a large number of community organizations working together in different issue areas and has often been characterized as a neighborhood where trusting relationships among orga-nizations prevail. A former and the current (at the time of this study) 22nd Ward aldermen have played important roles in catalyzing and fostering collaboration in the neighborhood, particularly around issues of education and safety.
Logan Square is located in the northwest of Chicago. In 2010, the neighborhood’s popula-tion was predominantly Latino (making up about 50 percent of its population) and white (making up about 40 percent). As in other neighborhoods, Logan Square has undergone a process of gentrification in the past few decades. A longstanding agency with roots in com-munity organizing has supported the neighborhood. Though the agency focuses primarily on education, it has also supported affordable housing and workforce development initia-tives and has facilitated community-wide planning efforts.
Quad Communities is an area on the fourth aldermanic ward boundary, encompassing portions of four Chicago Community Areas along the near south side lakefront — Oakland, Kenwood, Grand Boulevard, and Douglas. The area encompasses the historic district of Bronzeville, once the epicenter of African-American-owned businesses and cultural in-stitutions. It is a high poverty, predominantly African-American area with, until recent demolition, a high concentration of public housing developments. In the past two decades, the neighborhood began to see a small influx of primarily African-American middle-class residents to the stately gray-stone buildings that predominate in the southern portions. There are a number of community organizations in the Quad Communities area, but they have not always worked together. The former 4th Ward alderman was an influential figure in the neighborhood.
South Chicago is located on the south side of Chicago, along the lakefront. The neighborhood is predominantly African-American, although it has a sizable Latino community (consist-ing of primarily Mexicans who first started settled in the area in the early 1900s). While there are a number of organizations in South Chicago, they tend to be relatively small. And while there is little history of tension among the neighborhood’s organizations in general, there has also been limited collaboration among them.
Chapter 2 | 1 3


ChApTer
3
Connectivity Among Chicago Neighborhood Organizations
The overall level of connectivity in a network system is defined as the proportion of all possible connections between groups that are in fact realized. This measure of connectivity is referred to as density. In the Chicago Community Networks (CNN)
study, density refers to the overall levels of communication around work domains such as housing or education; the overall levels of coordination, whereby groups direct or focus their efforts in consultation with each other; or the overall levels of collaboration, which indicate the levels of significant and intensive community partnerships in a neighborhood.
Density is a function of the number of ties that exist between nodes, as described in Figure 3.1. Each node in the CCN study is represented by a single organization, including commu-nity groups, government agencies, and other organizational types. Each tie represents a group communicating, coordinating, or collaborating in a specific work domain. If every organization in the network collaborated or coordinated with every other organization around housing, for example, its network density score would be 1 on a scale of 0 to 1 in the housing domain. Values closer to 1 represent greater density, while values closer to 0 indicate less density.
In the CCN study, the research team examined the density of the inter-organizational networks in the neighborhoods by looking at the ties an organization received when other survey respondents nominated them as a partner.1 For the purposes of this analysis, which focused more on action-oriented partnerships than simple information sharing, a tie was defined as the relationship at the coordination or collaboration level. The research team examined each domain of work within each neighborhood separately, in an attempt to
1. More formally, these ties are referred to as in-directed ties. In-directed ties were chosen for two reasons. First, because the networks include non-local actors (for example, Chicago city agencies) that were not surveyed and some local organizations that did not respond to the survey, a focus on “out-directed” ties would generate an estimate of density that underestimated the interactions within the network and would relegate organizations known to be prominent in neighborhood work to the peripheral. Second, analysis of tie reciprocity showed that in many networks some smaller organizations exaggerated their out-directed ties, leading to network maps that gave undue prominence to these organizations, as confirmed in MDRC’s field research.
Chapter 3 | 1 5
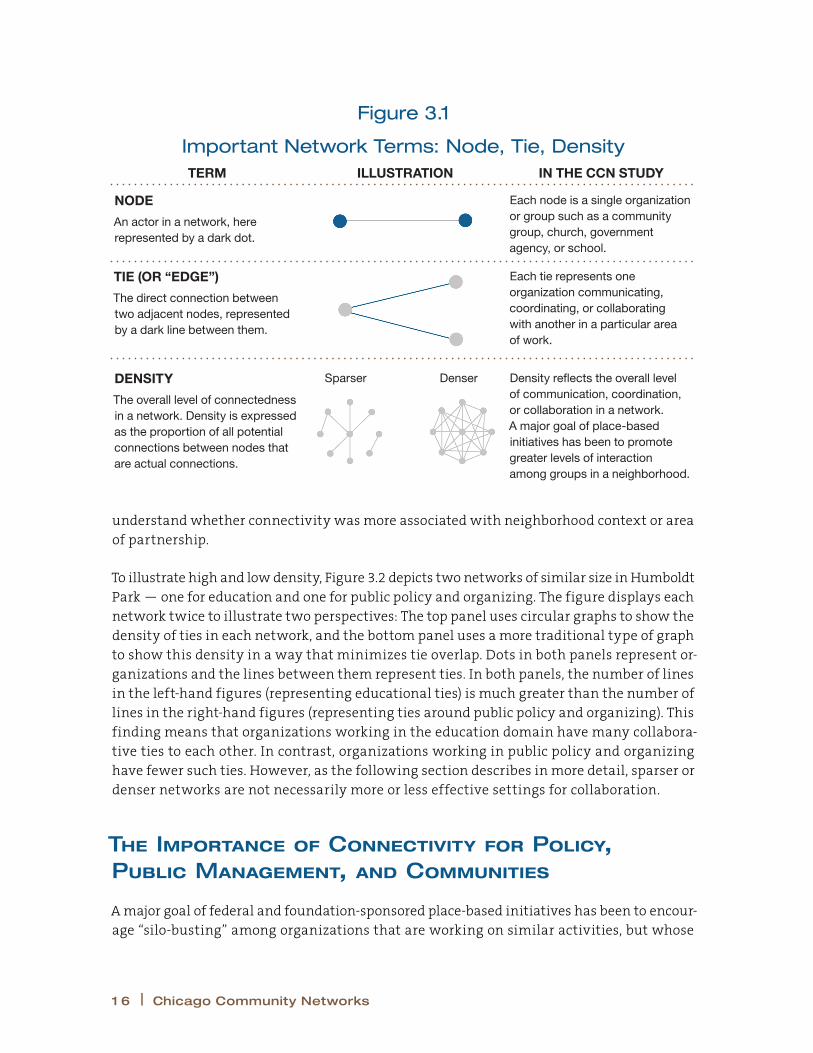
understand whether connectivity was more associated with neighborhood context or area of partnership.
To illustrate high and low density, Figure 3.2 depicts two networks of similar size in Humboldt Park — one for education and one for public policy and organizing. The figure displays each network twice to illustrate two perspectives: The top panel uses circular graphs to show the density of ties in each network, and the bottom panel uses a more traditional type of graph to show this density in a way that minimizes tie overlap. Dots in both panels represent or-ganizations and the lines between them represent ties. In both panels, the number of lines in the left-hand figures (representing educational ties) is much greater than the number of lines in the right-hand figures (representing ties around public policy and organizing). This finding means that organizations working in the education domain have many collabora-tive ties to each other. In contrast, organizations working in public policy and organizing have fewer such ties. However, as the following section describes in more detail, sparser or denser networks are not necessarily more or less effective settings for collaboration.
The Importance of Connectivity for policy, public Management, and Communities
A major goal of federal and foundation-sponsored place-based initiatives has been to encour-age “silo-busting” among organizations that are working on similar activities, but whose
Figure 3.1
Important Network Terms: Node, Tie, DensityTERM ILLUSTRATION IN THE CCN STUDY
NODE
An actor in a network, here represented by a dark dot.
Each node is a single organization or group such as a community group, church, government agency, or school.
TIE (OR “EDGE”)
The direct connection between two adjacent nodes, represented by a dark line between them.
Each tie represents one organization communicating, coordinating, or collaborating with another in a particular area of work.
DENSITY
The overall level of connectedness in a network. Density is expressed as the proportion of all potential connections between nodes that are actual connections.
Sparser Denser Density reflects the overall level of communication, coordination, or collaboration in a network. A major goal of place-based initiatives has been to promote greater levels of interaction among groups in a neighborhood.
1 6 | Chicago Community Networks
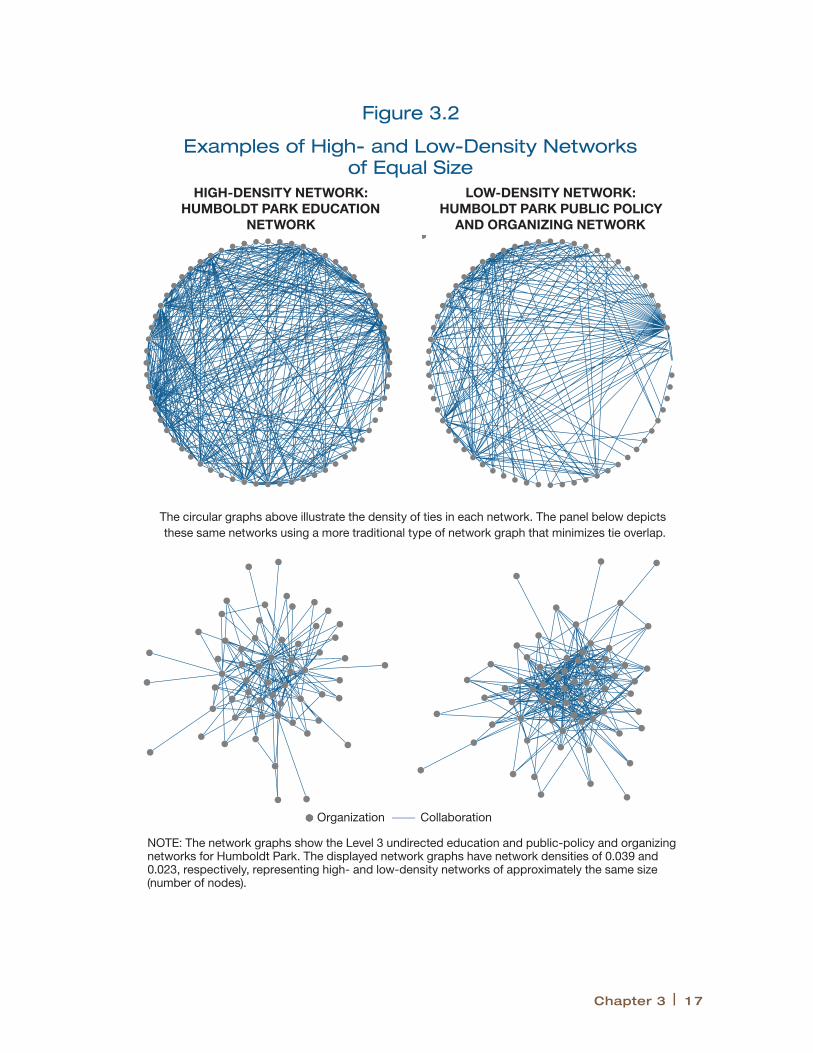
Figure 3.2
Examples of High- and Low-Density Networks of Equal Size
HIGH-DENSITY NETWORK: HUMBOLDT PARK EDUCATION
NETWORK
LOW-DENSITY NETWORK: HUMBOLDT PARK PUBLIC POLICY
AND ORGANIZING NETWORK
The circular graphs above illustrate the density of ties in each network. The panel below depicts these same networks using a more traditional type of network graph that minimizes tie overlap.
NOTE: The network graphs show the Level 3 undirected education and public-policy and organizing networks for Humboldt Park. The displayed network graphs have network densities of 0.039 and 0.023, respectively, representing high- and low-density networks of approximately the same size (number of nodes).
Organization Collaboration
Chapter 3 | 1 7

efforts may be uncoordinated because there are low levels of interaction among them. (The New Communities Program, described earlier in Box 2.1, illustrates this scenario.) For instance, the Collective Impact framework promotes shared goal-setting among local groups, a task that can be made much more difficult in the absence of overall network-level communication and coordination. In network terms, this task could be seen as fostering connectivity or density within network systems.
From a public management perspective, levels of connectivity have been associated with successful service integration — or, the coordination of multiple forms of assistance. But while some degree of connectivity is clearly necessary to facilitate service integration, some research has shown a negative association between density and service outcomes, potentially due to diminishing returns on multiple partnerships that do not add value to service delivery.2
From a neighborhood perspective, the connections between organizations matter because they play a key role in linking individuals to one another. For example, a study of day care providers showed how parents formed relationships with each other through these com-munity organizations, which had important implications for the interpersonal networks that let them get ahead economically or instead reinforced racial and class divisions.3
Variation in Connectivity Across Neighborhoods and Domains of Work
The CCN study seeks to understand both how network connectivity (or density) for a par-ticular work domain varies across neighborhoods, as well as how network density for dif-ferent work domains varied within a neighborhood. Figure 3.3 thus shows network density by domain (top panel) and by neighborhood (bottom panel).
In the top panel, each grey dot represents one of the nine neighborhoods’ density score within a particular domain of coordination or collaboration. For example, one dot represents Humboldt Park’s density score, another dot represents Brighton Park’s density score, and so on in the housing and commercial real estate domain, economic and workforce develop-ment domain, and so on. Note that the neighborhoods’ scores tend to be tightly clustered in each of the work domains. This finding suggests that the levels of connectivity in each domain are roughly similar in each neighborhood.
In the bottom panel, each grey dot represents one of the six work domains within a single neighborhood. For example, looking at Humboldt Park, the density scores (grey dots) are more widely dispersed, suggesting that the levels of connectivity in the neighborhood
2. Provan and Kenis (2008). See also Uzzi (1996) for a perspective on costs of greater ties.
3. Small (2009).
1 8 | Chicago Community Networks
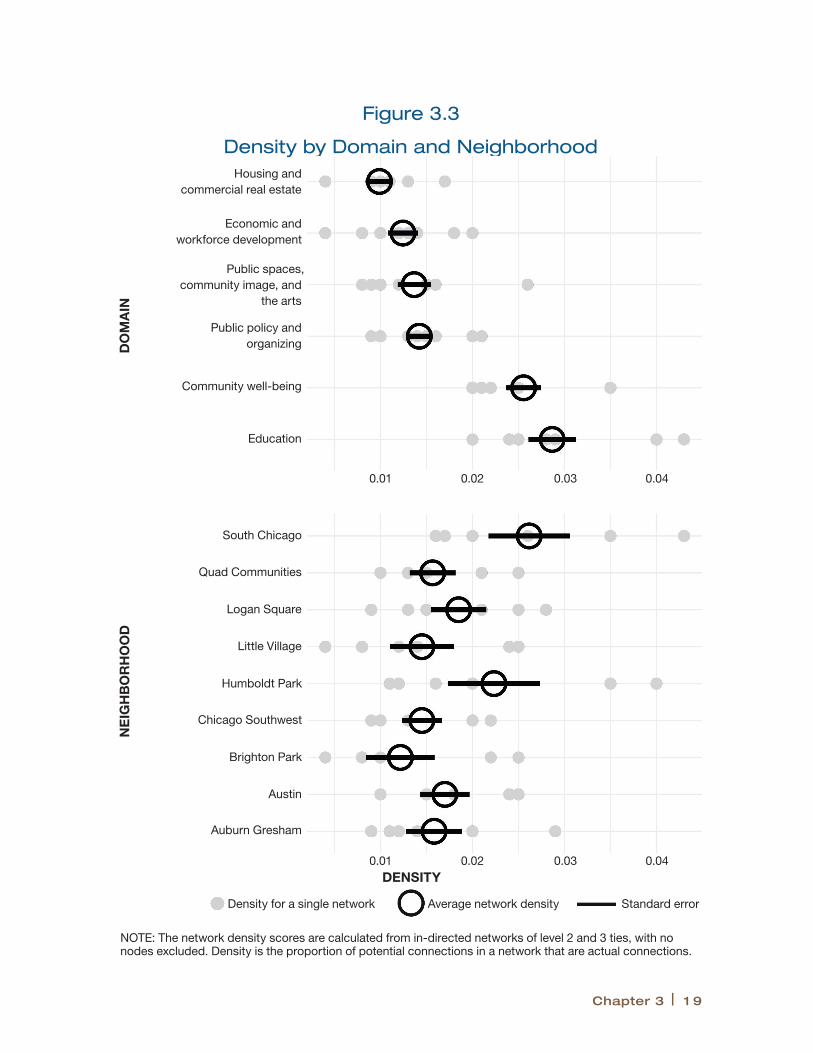
Figure 3.3
Density by Domain and Neighborhood
NOTE: The network density scores are calculated from in-directed networks of level 2 and 3 ties, with no nodes excluded. Density is the proportion of potential connections in a network that are actual connections.
NE
IGH
BO
RH
OO
D
DO
MA
IN
South Chicago
Quad Communities
Logan Square
Little Village
Humboldt Park
Chicago Southwest
Brighton Park
Austin
Auburn Gresham
Housing and commercial real estate
Economic and workforce development
Public spaces, community image, and
the arts
Public policy and organizing
Community well-being
Education
DENSITY
Density for a single network Average network density Standard error
0.01 0.02 0.03 0.04
0.01 0.02 0.03 0.04
Chapter 3 | 1 9
around housing and commercial real estate and education are quite different from each other. Overall, networks related to housing and commercial real estate are the least dense, while the education and community well-being networks are the densest.4 This pattern, in which each neighborhood contains quite different levels of partnership across different areas of work, tends to repeat across the nine neighborhoods.
As Figure 3.3 shows, levels of connectivity appear to be related to the domains of coordina-tion and collaboration, such as education or housing. It is much less related to the neighbor-hood context in which the network operates. Accordingly, a housing network in Humboldt Park is more likely to be similar in density to a housing network in Auburn Gresham than it is to the density of the education network in the same neighborhood. This general pat-tern can be shown in the contrast of the length of lines that represent the standard error among density scores between the top and bottom panels of Figure 3.3. Shorter lines (rep-resenting less variation) are found in the top panel, which shows different neighborhoods’ connectivity scores related to the six work domains. Less variation means that community well-being, housing, education, and public policy and organizing networks, for instance, are much more similar to each other across neighborhoods than they are to other kinds of networks within the same neighborhood.
The finding that the type of work defines connectivity more than neighborhood context is striking, because it holds true even as the number of organizations involved in each domain-specific network changes. That is, the density or connectivity of systems often decreases as networks become larger. This decrease tends to occur by definition, because the number of potential ties grows much more quickly than the number of ties a network member will maintain. In the CCN study, the number of organizations engaged in housing and in commercial real estate networks was, on average, lower than in the education and community well-being networks. This finding suggests that housing networks should have a higher level of connectivity than education networks because there are fewer possible connections among them. However, analysis found the opposite: Despite the larger num-ber of groups in education and well-being networks, these networks were denser overall.
Why are housing collaborations on the lower end of connectivity, and education, safety, and public health collaborations on the higher end? Housing may in fact require fewer partnerships, and more partnerships may complicate real estate deals. Affordable housing construction requires banks for financing projects; support from government agencies to provide grants, loans, zoning and construction permits; and a limited number of contrac-tors to build or renovate units, even though broader networks are sometimes necessary to ensure community support for local projects.5 In contrast, community-school partnerships
4. To test the sensitivity of these findings using different network and tie definitions, the research team ran the analysis restricting ties to level three collaboration, alone, excluding non-local organizations and ties that were indicated via free response rather than the predefined matrix of organizations included on the survey. The findings are robust to each of these specifications as well as to their combinations.
5. Keyes, Schwartz, Vidal, and Bratt (1996).
2 0 | Chicago Community Networks
may involve more interaction between and among schools and local organizations, since they may work together to form youth groups that recruit from classes across buildings, operate on different campuses after school, or to develop outreach connections for children not attending class regularly.
how Connectivity Mattered for Groups and Communities
The finding that areas of work tend to drive levels of connectivity, rather than neighborhood context, has implications for national programs that attempt to promote ties among com-munity organizations for various goals. These programs include a portfolio of initiatives, often related to different domains of action, such as housing (Choice Neighborhoods) or education (Promise Neighborhoods). While Choice Neighborhoods experienced significant achievements in promoting redevelopment of distressed public housing, its ability to coor-dinate achievements so as to reach deeper into neighborhoods has been found to be more limited in early implementation.6 In contrast, although no comprehensive evaluation of Promise Neighborhoods currently exists, case studies show that a host of local providers have often been brought together successfully under its auspices.7
In other words, if connectivity among groups is a goal in itself, as the aims of these kinds of community capacity building initiatives might suggest, it might be more challenging to foster it around efforts to improve housing than around education or other forms of so-cial services, regardless of the neighborhood in which the initiative is located. In fact, the Local Initiatives Support Corporation of Chicago made a choice, when it launched the New Communities Program (NCP) and implemented it from 2002 to 2012, to expand domains of local improvement activity beyond housing, in part because it could engage a wider array of stakeholders in the community. Education was in fact one of the major areas around which groups reported the most partnerships, projects, and investments during NCP.8
However, network density in the CCN study was not associated with the success of local partnerships, as defined by field research.9 That is, since connectivity may be a function of the kind of work that occurs, rather than the quality of that work or its neighborhood context, the research team did not observe that more successful partnerships occurred in neighborhoods where networks were more or less dense. Education, housing, and community safety networks — of which there are many examples of successful partnerships — varied
6. Pendall et al. (2015).
7. Hulsey, Esposito, Boller, and Osborn (2015).
8. See Greenberg et al. (2014).
9. In some ways, connectivity may also be a function of the general maturity of collaborative efforts in the neighborhood. In Brighton Park, which was in general the newest to collective work, there were fewer organizations and also less connectivity.
Chapter 3 | 2 1

considerably as to whether they were on the higher or lower end of density among the nine CCN study neighborhoods. Instead of the levels of connectivity, other aspects of network structure — including the quality of partnerships as measured by the levels of trust in the system, the concentration of power in relationships, and the diversity and comprehensive-ness of ties — seemed to be associated with the quality and results of collective action.
2 2 | Chicago Community Networks

ChApTer
4
Power in Networks of Chicago Neighborhood Organizations
W ithin the Chicago Community Networks (CCN) study, power relates to two dif-ferent kinds of concepts. The first concept refers to the position of an individual organization in the network, in particular whether an organization is more or
less central to the network’s activities (and therefore in a position of potential power). This concept is known as the “centrality” of an organization’s network position. The second concept refers to the concentration of power in the network as a whole, and whether ties are concentrated with a small number of organizations, or whether ties are more dispersed. This systems-focused concept is known as “centralization.” The first part of this chapter focuses on centrality while the second focuses on centralization.
Defining power and Influence
Centrality measures the relative position of influence or power an organization may occupy in a network. However, this position of influence can differ by the kind of role that an or-ganization plays in the network. One may be a type of “broker,” or an exclusive connection between groups that would otherwise not interact. One may also be part of a well-knit group of well-connected actors, forming a powerful cluster or cadre in the center of a network. In network research, the former kind of centrality is referred to as “betweenness,” and the latter is known as “eigenvector” centrality.1 For the sake of simplicity, the report will refer to “brokering” and “well-connected” network arrangements, respectively. Figure 4.1 depicts these two measures visually, and subsequent sections describe each in further detail.
1. Eigenvector centrality weights actors’ ties by the connections that they themselves have to other more distant parts of the network. It is a relative of “closeness” centrality in the network literature, which refers to the nodes to which all other nodes are closest by accounting for the number of edges (ties) necessary to reach other nodes in the network. Because networks in the CCN study are generally well connected and not fragmented, there is little variation in the measure of closeness.
Chapter 4 | 2 3

Brokering power
As described in Figure 4.1, brokering centrality is a measure of how likely an organization is to be a link in the shortest path between any two other actors. Organizations with a high brokering centrality score can act as bridges between other organizations, providing introductions and facilitating (or hindering) the flow of resources and information between them. Research suggests that actors who occupy a position with high brokering centrality display greater influence and stronger performance than otherwise similar actors, though unlocking the full potential of this position requires that actors become aware they occupy it.2 In community development literature, it has long been argued that neighborhood ac-
2. Burt (1992); Padgett and Ansell (1993).
MEASURES OF CENTRALITY QUANTIFY THE POSITION OF A GROUP
TERM ILLUSTRATION IN THE CCN STUDY
Brokering Centrality (Betweenness Centrality)
How likely a node is to be a broker or bridge between any two other nodes.
Here, node C wields influence through its position as a link between nodes A and B (which would not otherwise be connected).
Brokering is an important role in networks. For example, to mobilize a community to influence public policy, different constituencies must connect to elected officials in order to demonstrate the widespread appeal of a certain issue. A brokering organization can connect elected officials with these more disparate groups that might not otherwise interact with each other.
Well-Connected Centrality (Eigenvector Centrality)
How well connected a node and its direct connections are.
Here, nodes A and B have the same number of direct connections (dark grey dots). However, node B’s direct connections themselves have more ties. As a result, node B’s eigenvector centrality is higher.
Being tied to other well-connected groups can also be important for community action. For example, an organization charged with coordinating a foreclosure prevention initiative that needs to reach out to different segments of the community might need to be tied to other, well-positioned groups. It is more efficient to work closely with groups that themselves can bring in many other partners.
Figure 4.1
Important Network Terms: Brokering and Well-Connected Centrality
Lower
Higher
2 4 | Chicago Community Networks
tors who are able to bridge diverse community allies in organizations similar to their own as well as organizations at broader city, state, and federal levels are better positioned to carry out effective work.3
Within the CCN study, a good example of local leaders acting as brokers to outside stakehold-ers is the Greater Auburn Gresham Development Corporation (GADC), which successfully brought a new station on Metra, a commuter railroad in the Chicago metropolitan area, to the neighborhood.4 Around 2002, GADC started working on improving public transporta-tion and specifically in creating a Metra train stop in the neighborhood that would allow much quicker access to downtown Chicago. Ensuring a Metra stop at 79th Street had been a longtime focus of GADC’s executive director and several locally influential figures — Illinois State Senator Jacqueline Collins, Father Michael Pfleger of St. Sabina’s Catholic Church, and the current (at the time) and former aldermen. One of GADC’s strategies was to bring these powerful stakeholders to the table. When Metra’s executive director initially dismissed their proposal for a new Metra station, one of the supporters of the project, Senator Collins, con-nected the organization with the Illinois Department of Transportation (IDOT) in Springfield, Illinois, and leveraged an initial $10 million in appropriations for capital expenditures. In late 2010, Metra had agreed to build the new Metra stop and IDOT had committed $20 million for the project. By 2015, the Chicago City Council approved the acquisition of land to build the new station. Figure 4.2 depicts the network, highlighting the central role that GADC plays in connecting with partners that would otherwise not have been part of the effort.
Well-Connected Ties
Well-connected, or eigenvector, centrality measures how well connected an actor is to other well-connected actors. On this measure, an organization with a few well-connected partners might outrank another organization with a large number of ties to poorly con-nected partners. If ties allow an organization to draw on the resources of their partners, then ties to other well-connected organizations may be particularly valuable.5 Figure 4.1 elaborates on this distinction.
Within the CCN study, a good example of a group with ties to other well-connected actors is the Quad Communities Development Corporation (QCDC). In the study survey, QCDC ranked eighteenth in its neighborhood in terms of brokering centrality in the domain of public policy and organizing, but fifth in well-connected centrality for this same domain. The distinction suggests much closer ties to other well-connected political actors than to the more isolated elements of the community. The difference between the two measures may be due to the conditions in which QCDC was formed and the strategic alliances it has
3. Keyes (1969).
4. GADC ranks near the top of brokering centrality for housing, policy organizing, and public spaces, the categories most applicable to transit development.
5. Bonacich (1987).
Chapter 4 | 2 5

pursued. QCDC was created to serve as the lead agency for the New Communities Program (NCP) in Chicago’s fourth aldermanic ward. It operated out of the local alderman’s office and formed close alliances with other elected officials and centrally positioned political actors in the neighborhood around issues of commercial revitalization and workforce development.6 QCDC’s well-connected position may reflect these dynamics. Figure 4.3 illustrates these relationships, in which QCDC (represented by the large black dot) is closely tied to other organizations with high “well-connected” centrality (represented by the large blue dots).
6. In the context of this study, it is important to understand that The MacArthur Foundation and the Local Initiatives Support Corporation of Chicago had empowered many groups in networks to act as a lead agency, therefore increasing their power. At the same time, not every agency designated as the lead was the most powerful or influential in the network.
Figure 4.2
High Brokering Centrality in Auburn Gresham: Public Spaces, Community Image, and the Arts Network
NOTE: All displayed networks include only Level 3 (collaboration) undirected ties. Nodes are sized according to betweenness centrality, meaning larger nodes are in more dominant brokering positions in the network.
Greater Auburn Gresham Development Corporation
Organization Collaboration
2 6 | Chicago Community Networks
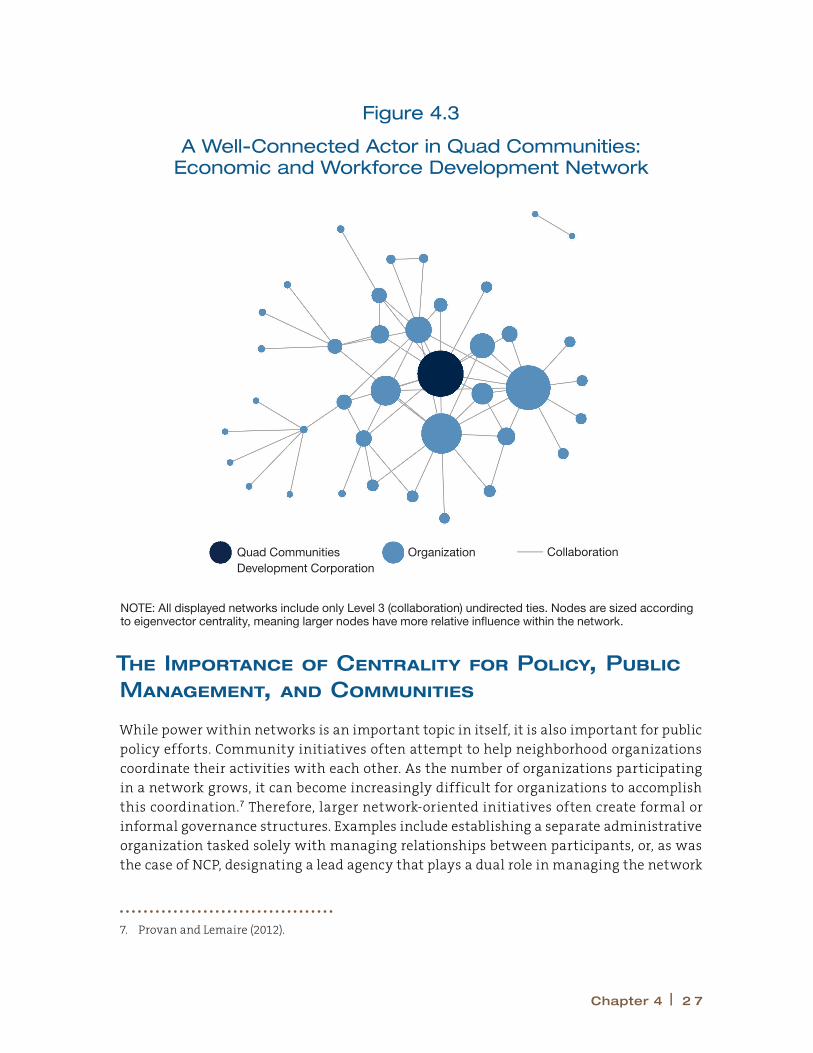
The Importance of Centrality for policy, public Management, and Communities
While power within networks is an important topic in itself, it is also important for public policy efforts. Community initiatives often attempt to help neighborhood organizations coordinate their activities with each other. As the number of organizations participating in a network grows, it can become increasingly difficult for organizations to accomplish this coordination.7 Therefore, larger network-oriented initiatives often create formal or informal governance structures. Examples include establishing a separate administrative organization tasked solely with managing relationships between participants, or, as was the case of NCP, designating a lead agency that plays a dual role in managing the network
7. Provan and Lemaire (2012).
Figure 4.3
A Well-Connected Actor in Quad Communities: Economic and Workforce Development Network
NOTE: All displayed networks include only Level 3 (collaboration) undirected ties. Nodes are sized according to eigenvector centrality, meaning larger nodes have more relative influence within the network.
Quad Communities Development Corporation
Organization Collaboration
Chapter 4 | 2 7

and carrying out its own share of the work.8 Choosing the right agency to play this role involves assessing which groups are more central and have the capacity to broker connec-tions or draw on resources from well-connected other players.
Centrality in networks has been associated with the influence that groups exercise during times of policy change. Foundational research on the development of public policy at the national level suggests that, at least in some instances, an organization’s participation and influence in major policy events is directly related to its prominence (defined here by well-connected centrality) in communication and exchange networks within a given domain.9
Groups That Occupy positions of power and Influence in Networks
This section describes the characteristics that are more likely to put an organization in a position of potential power or influence, as either a broker or a well-connected actor. (The analyses are exploratory and cannot assign causation.) The research team ran several mod-els that attempted to predict what factors were associated with a more central network position, including the age, size, type, and focus of an organization.10
Overall, organizations that were larger and that worked in multiple domains were more likely to be central according to the brokering and well-connected centrality measures. Organizations that are larger and older and that have more ties to organizations that span different areas of work were more likely to be central by the well-connected centrality measure.11
These findings appear to be in line with expectations. Larger organizations may have the capacity to create and sustain more ties, especially if they have been granted additional prestige by having been vested with funding from outside sources. Those with greater financial resources may be able to attract partners and generate trust in a way that sus-tains connection and lets them become more central in the network. Older organizations have had a longer time to build relationships and demonstrate competence. And more comprehensive (or multiplex) ties may be more stable because they do not depend on work or resources in any one domain.
8. Milward and Provan (2006); Provan and Kenis (2008).
9. Laumann and Knoke (1987).
10. The linear models used to analyze these data employ random permutation to generate test statistics because the data are not independently distributed.
11. Within domains, organizations that listed the domain as their top priority were more central.
2 8 | Chicago Community Networks

power in Community Networks as a Whole
Defining Power in Community Networks
Centrality, described directly above, relates to groups that occupy positions of potential power. Centralization, in contrast, measures how concentrated power is within the network as a whole. This report focuses on brokering centralization, or the number or concentration of brokering organizations in the neighborhood. It also concentrates on well-connected centralization, a measure of the concentration of groups that are tied to others that are also well connected. Figure 4.4 describes centralization both generally and in reference to well-connected and brokering centralization.
The Importance of Power and Influence for Policy, Public
Management, and Communities
From a policy perspective, the concentration of power and influence directly relates to questions of governance within community initiatives. That is, Comprehensive Community Initiatives and other kinds of community initiatives that involve multiple partners must make choices about leadership and coordinating roles within the collective. Some initia-tives favor collaborative governance structures, consisting of formal or informal boards of organizational representatives, in order to foster consensus building among agencies and reduce the potential for groups to feel excluded or to disengage from collective activities. Others, such as NCP in Chicago and the Collective Impact model, designate a single lead agency to coordinate the work of multiple groups. A collaborative governance structure is potentially associated with lower centralization, or a lesser concentration of influence in a single party. A governance structure led by one organization may be associated with higher centralization, or a greater concentration of influence in a single party. There is sparse policy research that can inform whether and under what conditions one arrange-ment is better than the other.
Public management literature about collaborative service delivery, however, has suggested that a greater concentration of power and influence is associated with higher network ef-ficiency and effectiveness, especially when a brokering or lead agency is able to coordinate activity on behalf of others in the network.12 The literature points to the efficiency that results from fewer groups taking leading roles as a reason for this association between concentrated network power and greater network effectiveness. At the same time, a study on community leadership in Chicago suggests that more cohesive leadership networks are sometimes associated with lower levels of trust among residents and social capital, espe-cially in more disadvantaged neighborhoods.13 These findings suggest that there may be
12. Provan and Milward (1995), Fried, Bruton, and Hisrich (1998); and Powell, White, Koput, and Owen-Smith (2005).
13. Sampson and Graif (2009).
Chapter 4 | 2 9

tradeoffs for communities when certain elites are more deeply connected to each other, as these leadership networks may represent a pattern by which action can be accomplished without the extensive involvement of other community residents or organizations.
How the Concentration of Influence Varied Across
Neighborhoods and Areas of Work
The research team measured the concentration of power and influence for each of the nine neighborhoods, and for each domain of coordination and collaboration, such as education or housing. Figure 4.5 presents these results for the concentration of brokering power in networks and work domains.
Figure 4.5 presents how brokering power is concentrated into a limited number of groups (the brokering centralization index). In the top panel, each grey dot represents the concen-tration of power within one of the nine neighborhoods as it relates to a particular domain of coordination or collaboration. For example, one dot represents Humboldt Park’s central-
MEASURES OF CENTRALIZATION DESCRIBE THE HIERARCHY OF A NETWORK — WHETHER MANY OR JUST A FEW GROUPS ARE CENTRAL
TERM ILLUSTRATION IN THE CCN STUDY
Centralization reflects the overall concentration of power in a network system: whether a single or small number of groups appears to dominate connections.
Centralized Decentralized In a centralized network, one group or a small number of groups dominate connections. In a decentralized network, no single group dominates.
Well-connected or eigenvector centralization reflects a relatively tight network of well-connected actors (here represented by the darker dots).
Brokering or betweenness centralization, in contrast, reflects a small number of organizations (here represented by the darker dots) that are the exclusive connectors to relatively peripheral groups.
Figure 4.4
Important Network Term: Centralization
3 0 | Chicago Community Networks
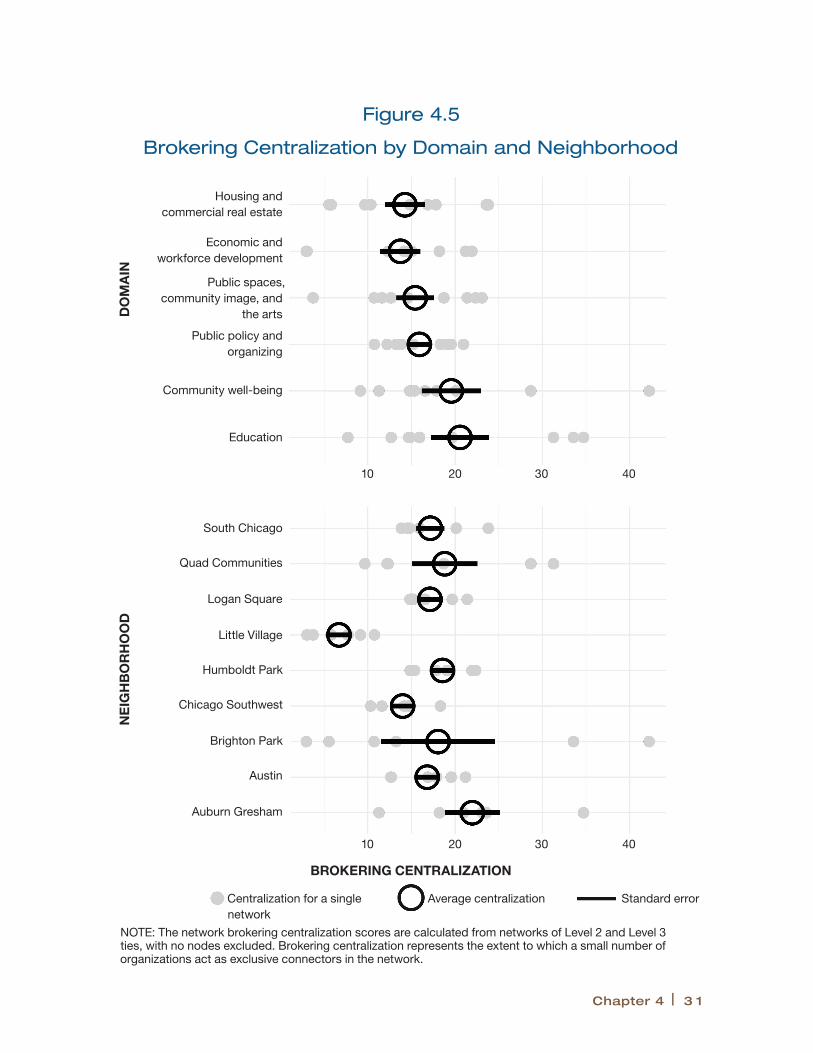
Figure 4.5
Brokering Centralization by Domain and Neighborhood
NOTE: The network brokering centralization scores are calculated from networks of Level 2 and Level 3 ties, with no nodes excluded. Brokering centralization represents the extent to which a small number of organizations act as exclusive connectors in the network.
NE
IGH
BO
RH
OO
D
DO
MA
IN
South Chicago
Quad Communities
Logan Square
Little Village
Humboldt Park
Chicago Southwest
Brighton Park
Austin
Auburn Gresham
Housing and commercial real estate
Economic and workforce development
Public spaces, community image, and
the arts
Public policy and organizing
Community well-being
Education
BROKERING CENTRALIZATION
Centralization for a single network
Average centralization Standard error
10 20 30 40
10 20 30 40
Chapter 4 | 3 1

ization score, another Brighton Park’s centralization score, and so on in the housing and commercial real estate domain, economic and workforce development domain, and so on. The scores for each of the neighborhoods were fairly spread out. This suggests, for instance, that the concentration of power in Humboldt Park’s housing network was unlikely to have been similar to that in Brighton Park’s housing network.
In the bottom panel, the grey dots represent the concentration of power within the networks related to the six work domains in a single neighborhood. For example, looking at Little Village, the concentration scores of brokering power for the networks in all work domains were very similar, and on the lower end of the spectrum. This means that there was less concentration of brokering power and power was more widely shared among different ac-tors. This finding suggests that Little Village’s neighborhood context appears related to the levels of power concentration across domains, because each domain’s centralization score is closely clustered together and on the lower end of the spectrum. Turning to Humboldt Park, scores across domains were also closely grouped together, toward the middle of the spectrum.
As Figure 4.5 shows, in contrast to density (which was illustrated in Chapter 3, Figure 3.3), neighborhood context was much more associated with a network’s concentration of power than the work domain in which it occurred. That is, neighborhoods appear to have had their own distinct patterns of hierarchy, or dynamics, by which power was more widely or narrowly shared. Accordingly, a housing network in Humboldt Park was more likely to have had similar concentrations of power to its education network, than it was to a hous-ing network in Auburn Gresham. This general pattern can be seen in the contrast between the overall spread of dots in the top and bottom panels. With some exceptions, dots were more closely clustered together in the bottom panel than in the top panel. Less variation means that community well-being, housing, education, and public policy and organizing networks, for instance, were much more similar to each other within that neighborhood than they were to other networks of the same type in other places.
While power dynamics were related to a network’s neighborhood environment, it did not appear that the racial or ethnic composition of a community drove whether it was more or less hierarchical. Rather, differences were associated with different neighborhood political cultures. Networks in neighborhoods where community organizing groups were prominent appeared to be somewhat less dominated by brokering actors, and were more likely to have a tightly networked set of core actors. Networks where elected officials were more promi-nent — often operating in tandem with Chicago’s ward-based political system — were more centralized on the whole, as Box 4.1 illustrates.
Little Village was an outlier among the neighborhoods; its housing, education, and other kinds of networks were, on average, fairly decentralized or democratic in that there was not generally a single or small set of organizations that acted as a broker to others. Box 4.1 describes the institutional dynamics that contributed to its lack of hierarchy.
3 2 | Chicago Community Networks
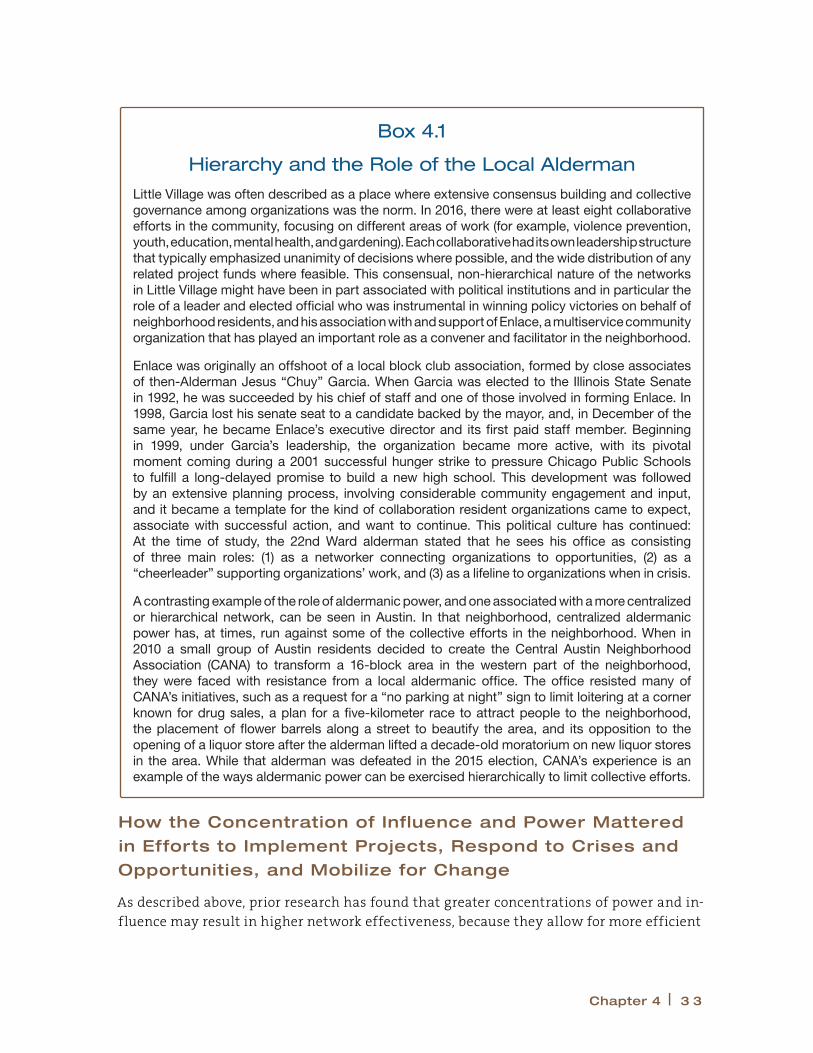
How the Concentration of Influence and Power Mattered
in Efforts to Implement Projects, Respond to Crises and
Opportunities, and Mobilize for Change
As described above, prior research has found that greater concentrations of power and in-fluence may result in higher network effectiveness, because they allow for more efficient
Box 4.1
Hierarchy and the Role of the Local Alderman
Little Village was often described as a place where extensive consensus building and collective governance among organizations was the norm. In 2016, there were at least eight collaborative efforts in the community, focusing on different areas of work (for example, violence prevention, youth, education, mental health, and gardening). Each collaborative had its own leadership structure that typically emphasized unanimity of decisions where possible, and the wide distribution of any related project funds where feasible. This consensual, non-hierarchical nature of the networks in Little Village might have been in part associated with political institutions and in particular the role of a leader and elected official who was instrumental in winning policy victories on behalf of neighborhood residents, and his association with and support of Enlace, a multiservice community organization that has played an important role as a convener and facilitator in the neighborhood.
Enlace was originally an offshoot of a local block club association, formed by close associates of then-Alderman Jesus “Chuy” Garcia. When Garcia was elected to the Illinois State Senate in 1992, he was succeeded by his chief of staff and one of those involved in forming Enlace. In 1998, Garcia lost his senate seat to a candidate backed by the mayor, and, in December of the same year, he became Enlace’s executive director and its first paid staff member. Beginning in 1999, under Garcia’s leadership, the organization became more active, with its pivotal moment coming during a 2001 successful hunger strike to pressure Chicago Public Schools to fulfill a long-delayed promise to build a new high school. This development was followed by an extensive planning process, involving considerable community engagement and input, and it became a template for the kind of collaboration resident organizations came to expect, associate with successful action, and want to continue. This political culture has continued: At the time of study, the 22nd Ward alderman stated that he sees his office as consisting of three main roles: (1) as a networker connecting organizations to opportunities, (2) as a “cheerleader” supporting organizations’ work, and (3) as a lifeline to organizations when in crisis.
A contrasting example of the role of aldermanic power, and one associated with a more centralized or hierarchical network, can be seen in Austin. In that neighborhood, centralized aldermanic power has, at times, run against some of the collective efforts in the neighborhood. When in 2010 a small group of Austin residents decided to create the Central Austin Neighborhood Association (CANA) to transform a 16-block area in the western part of the neighborhood, they were faced with resistance from a local aldermanic office. The office resisted many of CANA’s initiatives, such as a request for a “no parking at night” sign to limit loitering at a corner known for drug sales, a plan for a five-kilometer race to attract people to the neighborhood, the placement of flower barrels along a street to beautify the area, and its opposition to the opening of a liquor store after the alderman lifted a decade-old moratorium on new liquor stores in the area. While that alderman was defeated in the 2015 election, CANA’s experience is an example of the ways aldermanic power can be exercised hierarchically to limit collective efforts.
Chapter 4 | 3 3
coordination to occur than when ties are more broadly shared among more organizations. In the CCN study, a tightly networked core of implementing actors appeared beneficial to community school partnerships, housing initiatives, and public safety collaborations. That is, more effective implementing networks tended to have a well-knit concentration of well-connected organizations. However, contrary to findings from prior research, having a small number of brokering actors coordinating work appears to have been detrimental to the implementation of community projects, especially when conditions changed.
Interestingly, a reverse pattern was observed when concentrations of power related to effective mobilization to improve public policy. In this case, higher network effectiveness appears to have been achieved with a smaller number of brokering organizations that were intentional and inclusive about creating ties to more peripheral groups. In fact, a tightly networked cadre of political elites may have contributed to dynamics of mistrust and political stalemate, because they operated in an environment with fewer avenues for peripheral groups to access power.
The following section describes examples from case studies related to schools and housing that help illustrate the benefits of tightly networked implementing actors and organiza-tions who serve as political brokers.
Improving Schools in Challenging Times
The last several years have been turbulent for education in Chicago, as different models for reform have played out within Chicago Public Schools (CPS) and among communities, and in a general environment of reduced resources. Recent events included a brief teacher’s strike in 2012, the Board of Education’s vote to close 47 schools in 2013, conflict about the expansion of charter schools, and a nearly half billion dollar budget deficit in 2017.14 These overarching tensions in the policy landscape have been layered onto perennial challenges that schools and communities face in delivering adequate support and services to low-income students in particular.
Among nine neighborhoods where information was available about school improvement networks that responded to these general challenges, in all but one the more effective networks were on the higher end of well-connected centralization and the lower end of brokering centralization. This pattern was especially striking for Little Village, a neighbor-hood that had many effective community-school partnerships and extremely low central-ization generally, but had relatively high well-connected centralization around education collaborations.
To illustrate this general finding, it is worth contrasting different patterns of network activity in the education and public policy and organizing networks of Chicago Southwest and Quad Communities. Chicago Southwest is marked by generally higher levels of well-connected
14. Perez (2017).
3 4 | Chicago Community Networks

centralization in its education networks; Quad Communities is marked by generally higher levels of brokering centralization. In its public policy and organizing networks, the opposite pattern emerges: Chicago Southwest is marked by higher levels of brokering centralization, whereas Quad Communities is marked by higher well-connected centralization.
Chicago Southwest. Schools in the Chicago Southwest neighborhood have particularly benefited from both community partnerships and from community organizing to bring resources to schools and advance productive policy engagement with CPS central offices. For example, Gage High School, a local school serving about 1,800 students in the early 2000s, was on the initial list of 330 schools in Chicago that were proposed for closure. A core group of activists — students, engaged parents, and some community organizations — worked against local closings and was successful in ensuring that no schools in the area ended up on the final list. However, a letter was still mailed to parents of eighth-graders informing them that Gage High School was closing, which accelerated disenrollment and reduced the student population to about 400.
The Southwest Organizing Project (SWOP) has helped Gage High School take advantage of community-school partnerships, such as the Parent Mentor program (which brings par-ents into classrooms as educational assistants), and has coordinated additional services for students’ families, such as foreclosure prevention assistance. The project also has engaged student activists through the VOYCE (Voices of Youth in Chicago Education) program, which collaborates with groups throughout the city on policy issues affecting students, such as addressing the disciplinary code to emphasize social and restorative justice practices in lieu of expulsion, and has achieved some success in changing CPS policies.
Elementary schools have also benefited from partnerships. For example, one school works with the local Neighborhood Housing Services office and SWOP to help reoccupy foreclosed properties in the surrounding area. The school also collaborates with multiple providers that help enrich its programming and provide services, including cultural programs at Muslim and Catholic institutions, anti-bullying initiatives, and an effort to commemorate the site of an important march by Dr. Martin Luther King. Several principals at other elementary schools in the area also indicated that their schools were involved in community-school partnerships and advocacy efforts, which they felt led to better family services, better in-tegration of black and Latino students, better home-school relationships, and better safety conditions.
Individuals in this network led by SWOP (depicted in Figures 4.6 and 4.7) have described the tight connections among core implementing partners — or, the concentration of well-connected groups — as important to ensuring good results. One observer, for instance, referred to SWOP and two other organizations as “the big three.” These groups were accus-tomed to working quickly on both policy- and service-related issues, as well as individual requests to benefit students. For example, one principal remarked, “[w]e had a family with five kids in the school, gas got shut off, called SWOP, and within an hour we knew what to do and got the gas turned back on and they could move back into their apartment.” Figure
Chapter 4 | 3 5

4.6 shows a tighter network of groups, which are each well connected to each other. These nodes are represented by the nodes in the center of the diagram that are well connected both to each other and to other partners. (The high concentration of ties among this core cadre of implementers represents higher well-connected centralization.)
Commenting on the network dynamics in Chicago Southwest, one observer said that this core group of implementing partners made it easier to launch community projects because each organization had “very experienced folks,” so that even if one group was undergoing a transition or otherwise stretched, implementation could continue. In contrast, the in-dividual noted that in other neighborhoods that relied on a single coordinator (especially those where an alderman was more central), work tended to be more “one sided,” with ei-ther the alderman or an organization closely tied to the alderman serving the single voice that others followed. As a result, there were fewer opportunities for communication or for coordination, if that central coordinating group was otherwise occupied. Describing rela-tionships between core partners, another observer said, “to me, the relationship between
Figure 4.6
Education-Related Collaborations in Chicago Southwest
NOTE: All displayed networks include only Level 3 (collaboration) undirected ties. Nodes are sized according to well-connected centrality, meaning larger nodes have more relative influence within the network.
Coordinating Agency Organization Collaboration
3 6 | Chicago Community Networks
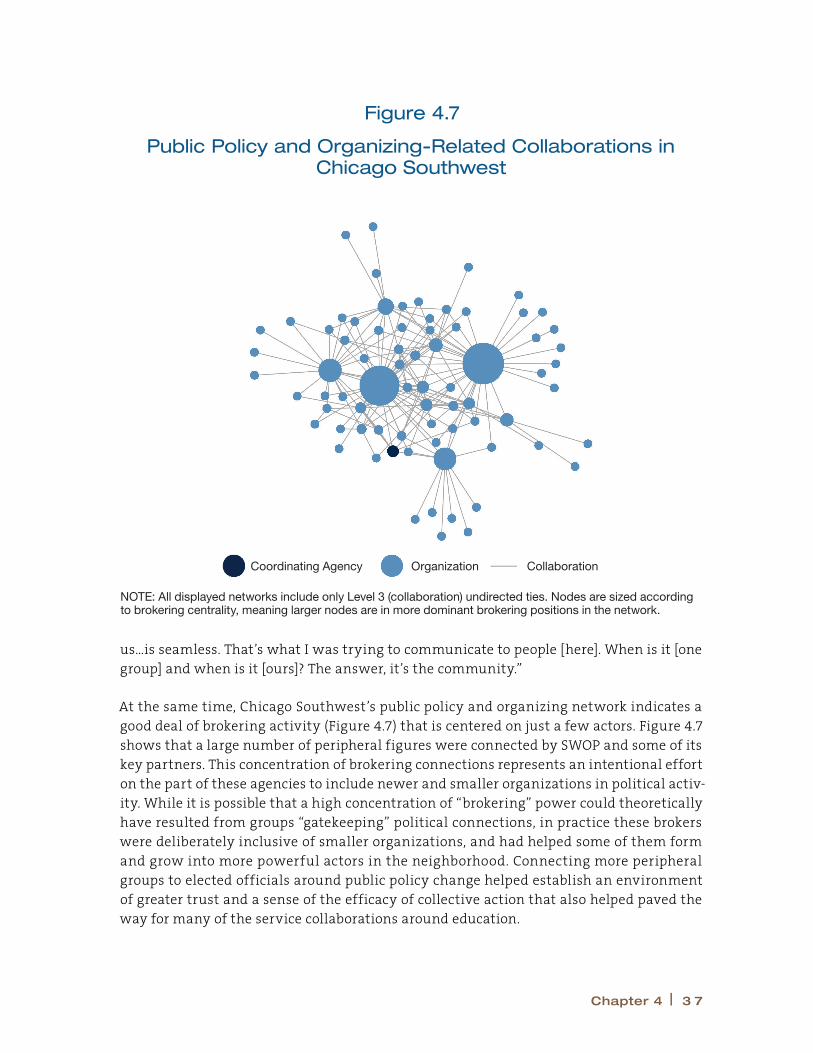
us…is seamless. That’s what I was trying to communicate to people [here]. When is it [one group] and when is it [ours]? The answer, it’s the community.”
At the same time, Chicago Southwest’s public policy and organizing network indicates a good deal of brokering activity (Figure 4.7) that is centered on just a few actors. Figure 4.7 shows that a large number of peripheral figures were connected by SWOP and some of its key partners. This concentration of brokering connections represents an intentional effort on the part of these agencies to include newer and smaller organizations in political activ-ity. While it is possible that a high concentration of “brokering” power could theoretically have resulted from groups “gatekeeping” political connections, in practice these brokers were deliberately inclusive of smaller organizations, and had helped some of them form and grow into more powerful actors in the neighborhood. Connecting more peripheral groups to elected officials around public policy change helped establish an environment of greater trust and a sense of the efficacy of collective action that also helped paved the way for many of the service collaborations around education.
Figure 4.7
Public Policy and Organizing-Related Collaborations in Chicago Southwest
NOTE: All displayed networks include only Level 3 (collaboration) undirected ties. Nodes are sized according to brokering centrality, meaning larger nodes are in more dominant brokering positions in the network.
Coordinating Agency Organization Collaboration
Chapter 4 | 3 7

Quad Communities. Similar to Gage High School in Chicago Southwest, Dyett High School in Quad Communities faced closure and CPS intended to move forward on this plan. As a result of community opposition that included a hunger strike, CPS reversed its decision and agreed to issue a request for proposals to replace Dyett with a new high school for the arts in the neighborhood. The school system received two main applications, one from a local arts and youth group, and one from a group whose plan focused on green technology. Conflict erupted between proponents of the two proposals, however, with one group disrupting public events, with Mayor Rahm Emanuel in support of its own proposal. In the face of this political controversy, CPS eventually canceled the request for proposals and ran the Dyett High School directly. As a result of this decision, CPS was forced to take over a school the system had initially wanted to close permanently, without the community control that both groups competing for the request for proposals had wanted. While protest had suc-cessfully kept the high school open — a significant accomplishment for residents wanting a neighborhood school — local networks were not able to resolve the dispute about how to implement the policy change that community organizing had won.
In explaining this outcome, local observers pointed to an absence of a community mechanism to resolve disputes, a dynamic that may be seen in Figures 4.8 and 4.9. Figure 4.8 shows that much activity around education is centered on a single actor. (See the largest blue node on the right-hand side.) The prominence of this group gave the education network in Quad Communities a relatively high concentration of brokering power or centralization. But the organization, which might have been well positioned to mediate the controversy, did not engage in it because of its intensity. In this regard, Quad Communities might have been helped during the controversy by having a lower concentration of brokering power, and a greater number of influential service partners who were well connected to each other, so as to establish common service or implementation goals for Dyett. Similarly, Figure 4.9 shows that the public policy and organizing network in Quad Communities was also not well configured to have mediated community conflict about implementing the policy change. Figure 4.9 shows a well-knit group of well-connected actors — mostly elected officials — that tended to coordinate and collaborate with each other, but had fewer connections to more peripheral groups, including educational service providers. This absence of ties to groups involved in implementing community-school projects also may have made it more difficult to connect service providers to the political actors with the power to influence the outcome of the dispute.
Revitalizing Commercial Districts
These patterns of more effective practice — a tight connection of core implementing actors, often in combination with a set of inclusive brokers in the political arena — were also ob-served in the housing domain. Housing and commercial real estate networks appear to have required less interaction among community groups than other domains, such as education, because acquiring properties and developing affordable housing was an activity in itself, resulting in less dense networks as a whole. At the same time, revitalizing commercial cor-
3 8 | Chicago Community Networks
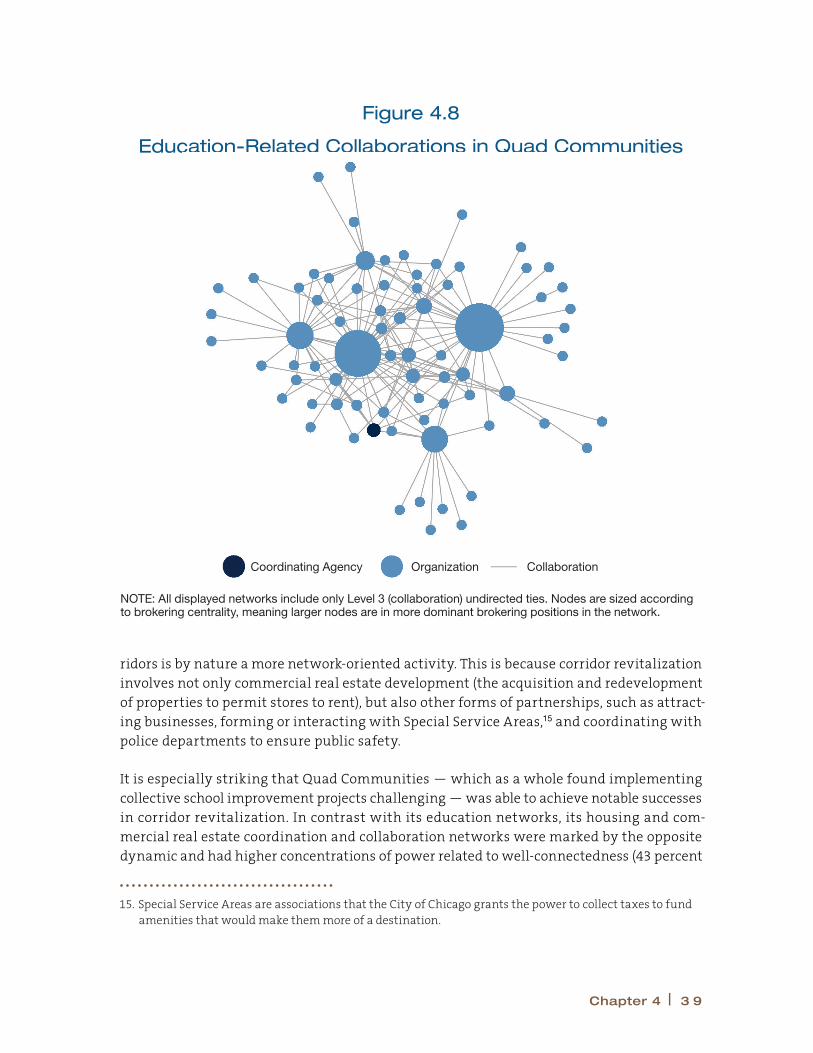
ridors is by nature a more network-oriented activity. This is because corridor revitalization involves not only commercial real estate development (the acquisition and redevelopment of properties to permit stores to rent), but also other forms of partnerships, such as attract-ing businesses, forming or interacting with Special Service Areas,15 and coordinating with police departments to ensure public safety.
It is especially striking that Quad Communities — which as a whole found implementing collective school improvement projects challenging — was able to achieve notable successes in corridor revitalization. In contrast with its education networks, its housing and com-mercial real estate coordination and collaboration networks were marked by the opposite dynamic and had higher concentrations of power related to well-connectedness (43 percent
15. Special Service Areas are associations that the City of Chicago grants the power to collect taxes to fund amenities that would make them more of a destination.
Figure 4.8
Education-Related Collaborations in Quad Communities
NOTE: All displayed networks include only Level 3 (collaboration) undirected ties. Nodes are sized according to brokering centrality, meaning larger nodes are in more dominant brokering positions in the network.
Coordinating Agency Organization Collaboration
Chapter 4 | 3 9

versus 27 percent on average) and lower concentrations of brokering power (5 percent versus a 28 percent average across networks). Successful efforts in Quad Communities related to commercial revitalization included the following:
• Efforts led by the Quad Communities Development Corporation (QCDC) to revitalize the Cottage Grove Corridor. Despite experiencing financial difficulties resulting from the 2008 financial crisis, QCDC attracted anchor tenants and developed a mixed-use build-ing known as Shops and Lofts. They also helped attract developers of a new park district recreation center and an additional retail center north of the property.
• Two well-regarded Special Service Areas, or business improvement districts, one ap-proximately 10 years old in the 4th Ward and a smaller and more recently established one in the 3rd Ward.
Figure 4.9
Public Policy and Organizing-Related Collaborations in Quad Communities
NOTE: All displayed networks include only Level 3 (collaboration) undirected ties. Nodes are sized according to well-connected centrality, meaning larger nodes have more relative influence within the network.
Coordinating Agency Organization Collaboration
4 0 | Chicago Community Networks
• Efforts to make the Bronzeville neighborhood a congressionally designated National Heritage Area, due to its historic role in Chicago’s African-American life.
• Productive collaboration among a limited number of organizations around issues such as corridor beautification, small business improvement, and events and festivals.
While turf issues and conflict did mark some efforts in Quad Communities, especially those that crossed aldermanic ward boundaries, commercial revitalization was generally more collaborative, a fact reflected in fewer exclusive brokers or conduits to local implementa-tion and closer connections among core partners.
Similarly, Little Village’s efforts around corridor revitalization ref lected the potential benefits of tighter connections among core actors. Despite the neighborhood’s generally decentralized networks, housing and commercial real estate coordination and collaboration networks were higher on well-connected centralization — slightly above the average for the nine neighborhoods in this work domain — while its level of brokering centralization remained low. In Little Village, these tight connections between the alderman and a few other core actors involved with business development had positive results for the neigh-borhood’s main commercial corridor, such as efforts to ensure that a Unilever distribution center in the neighborhood adopted a community benefits agreement that included traffic mitigation and land donations for a local school, a partnership with local organizations to advertise employment opportunities, the creation of a no-tavern zone that improved the quality of life for residents, and the establishment of a well-regarded Special Service Area.
Chapter 4 | 4 1


ChApTer
5
Trust and Longevity in Chicago Community Networks
T rust within the Chicago Community Networks (CCN) study is related to the quality or character of individual connections within networks. Just because an organization collaborated with another does not mean that each partner was satisfied with that
relationship. And even though a connection may currently exist among partners, it is not certain that it will be a durable one if trust is absent. To address these concerns, the CCN study attempted to measure relationship satisfaction in the form of trust, and the extent to which a partnership was longstanding.
In the CCN study, longevity refers to how many years any interaction with another group endured, across any work domain.1 Because individual survey respondents might not have been aware of the duration of a partnership if they were new to the organization, the sur-vey first asked respondents to indicate whether they had worked for their organization for at least three years. If they had worked for the organization for this period of time, they were asked to characterize whether their relationships with other network members had occurred during the 36 months before the survey, and if so whether they covered the last 12 months.2 If they had not, they were excluded from analyses.
In addition to questions about the intensity and content of organizational relationships, the survey also included a question on trust. Respondents were asked to characterize their trust in each of the partners with whom they indicated working, and were asked the extent to which they agreed with the following statement: “I trust this organization to fulfill their mission in a way that’s good for the community.” Respondents answered on a scale from
1. The second report will provide a formal analysis of longevity, as well as a detailed comparison of the first and second waves of survey findings. The first-wave survey included a question meant to capture how networks have changed over time.
2. The survey asked respondents whose relationships covered the prior 12 months more detailed questions about the intensity and domain of interaction. Therefore, the networks presented in depth throughout the report are a snapshot of conditions, making both the longitudinal qualitative data collection and the second wave of survey findings particularly important.
Chapter 5 | 4 3
1 to 5, ranging from “strongly disagree” to “strongly agree.” This definition of trust was worded to allow for members of organizations to consider intent, priorities, and capacity when making this determination.
how Trust and the Duration of partnerships Matter for policy, public Management, and Communities
In public policy circles, trust is acknowledged to be necessary for sustained and effective collaboration.3 The more intense and the higher stakes the interaction, the greater level of trust required between participants.4 If existing trusting relationships cannot be utilized and trust cannot be effectively established, local initiatives may be limited in what they can accomplish. In the case of Comprehensive Community Initiatives, research has shown that this dynamic may undermine programs entirely. For example, the Hewlett Foundation’s Neighborhood Improvement Initiative (NII) was a comprehensive community change pro-gram operated in three sites and over a decade. Similar to the New Communities Program, NII designated a lead agency in each participating neighborhood. In one of those sites, West Oakland, program managers experienced great difficulty finding an organization to step into the role. When a fledgling organization was finally developed, it was quickly undercut by existing organizations because of mistrust of outsiders and factionalism within the community. The organization eventually collapsed as a result of these divisions, effectively ending the intervention at this site. At another, East Palo Alto, internal strife at the lead agency and distrust between the lead agency and the funder limited the effectiveness of the intervention and led to outcomes far short of expectations.5
The presence and distribution of trust in a community may have implications for commu-nity life that go beyond the successful integration and operation of new organizations into community development networks. Robert Sampson’s work on collective efficacy suggests that it depends on social cohesion and control, which in turn depend on trust: Individuals share the same values and are willing to help each other.6 Though Sampson developed his theory with reference to informal interpersonal networks, the same logic may apply here.
Trust can be established where it is not yet present, but, as the NII case suggests, it does not inevitably follow from the establishment of a relationship, may develop slowly, and may not be easy to build.7 Trust can be based on prior interactions but may at first derive
3. Gulati, Lavie, and Madhavan (2011); Milward et al. (2009).
4. Feiock, Lee, and Park (2012).
5. Brown and Feister (2007).
6. Sampson and Graif (2009).
7. Provan et al. (2003); Huxham and Vangen (2005); Keast, Mandell, Brown, and Woolcock (2004).
4 4 | Chicago Community Networks
from reputation and from “transferability.” In other words, an organization’s trust in a new partner may (initially) be based on that partner’s association with other known, trusted partners and the “good word” of these partners.8 Over time, as a partner’s capacities and intentions become better known, specific knowledge replaces reputation and association as the basis of trust. In some cases, trust may actually decrease with experience and lead an organization to end the relationship, with implications for the stability of the network overall. For example, a 2003 study of mental health provider networks found that even as density increased, trust levels appeared to fall. The researchers argued that this may have been a consequence of members getting to know each other better, breaking off ties with organizations they did not trust, and searching for new partners.9 Therefore, in the short run, in the absence of existing trust, “efforts to build collaborative relationships may lead to some short-term testing of relationships,” and “relationships between individuals may change frequently as network members try to find network members in other organiza-tions with whom they can work effectively.”10
Duration of partnerships and how It Varied Across Neighborhoods
Overall, across all networks, most individual respondents to the survey (72 percent) indi-cated that they had worked for their organization for more than three years. The survey asked this group the question as to whether the partnership had some antecedent, beyond the 12 months before the survey and within the 36 months before the survey.
Most of the ties that these longer-tenured respondents reported occurred in the 12-month retrospective period and in the 36-month retrospective period: 65 to 75 percent of the ties persisted across networks depending on neighborhood. Because the survey asked whether respondents had interactions with their partners at any point during the 12-month and 36-month retrospective periods, it is not possible to determine whether relationships that appeared in each were continuous. For example, two organizations may have worked to-gether 36 months before the survey, ended their collaboration, and then begun working together on a new project 6 months before the survey. Regardless, it is significant that most ties reported in the first wave of survey results were between organizations that had histories of working together even if intermittently, and that this proportion was fairly constant among neighborhoods.
While some partnerships may have been enduring over that longer period of time, for many others, it was likely that former collaborative partners represented a pool from which to recruit partners for new work. As known quantities, their competence in carrying out their
8. Isett et al. (2011).
9. Provan et al. (2003).
10. Popp et al. (2014).
Chapter 5 | 4 5

work was already apparent and trust had already developed. This activation of latent ties appears in the work of groups involved with the first wave of the survey. In 2012, Telpochcalli, a small nonprofit organization in Little Village that works in the areas of education, leader-ship development, and community organizing, undertook a campaign in opposition to a Chicago Public Schools (CPS) plan to co-locate four charter schools in the neighborhood. In building its coalition, the organization sought support from various networks, organizations, and leaders with which it had worked before, including the Marshal Square Network, the Latino Policy Forum, Enlace, United Way, and current and former elected officials. While this effort focused on education, Telpochcalli had worked with some of these organizations on other issues — for example, it had worked with the Latino Policy Forum on topics related to immigration. Trust from one organization’s partners — a key factor described below — seems to have facilitated the re-establishment of ties.
Trust and how It Varied Across Networks
This report’s analysis of trust focuses on pairs of organizations, both of whose members had completed the survey, in order to understand not only the prevalence of trusting ties but also the reciprocity of trust between partners. In the five-point scale described earlier, a “trusting” relationship was defined as one that survey respondents characterized as a 4 or higher on the scale.
This analysis found that trusting relationships were fairly common in the organizations in this study, at the level of the individual tie. Across all neighborhoods, 70 to 80 percent of ties contained at least one member who indicated trust in the other.
Figure 5.1 presents another way to analyze trust, focusing on the proportion of ties among organizations where trust was indicated. For example, if an organization had three ties and one partner indicated trust in it, the organization would receive a score of 0.33 (33 percent of its ties were trusting). The distributions of the proportion of trusting ties per organiza-tion are presented in the figure by neighborhood, with the median proportion represented by a vertical line. By this measure, South Chicago was the least trusting neighborhood, along with Austin. In contrast, Logan Square, Chicago Southwest, and Humboldt Park ap-pear to have been more trusting and were among those neighborhoods with the highest trust. The box around this line represents the 25th percentile of organizations with higher or lower proportions of trusting ties that are clustered around this median proportion, and the “whisker” (or extended line) continues out an additional 25 percentile points.
In the CCN study, levels of organizational trust were associated with demographic context. In contrast, as described earlier, levels of hierarchy were associated with institutional context. While the majority of ties of the average organization in each neighborhood in the CNN were trusting, the proportions were lower in predominantly and historically African-American neighborhoods such as Auburn Gresham and Quad Communities. Trust may have been
4 6 | Chicago Community Networks
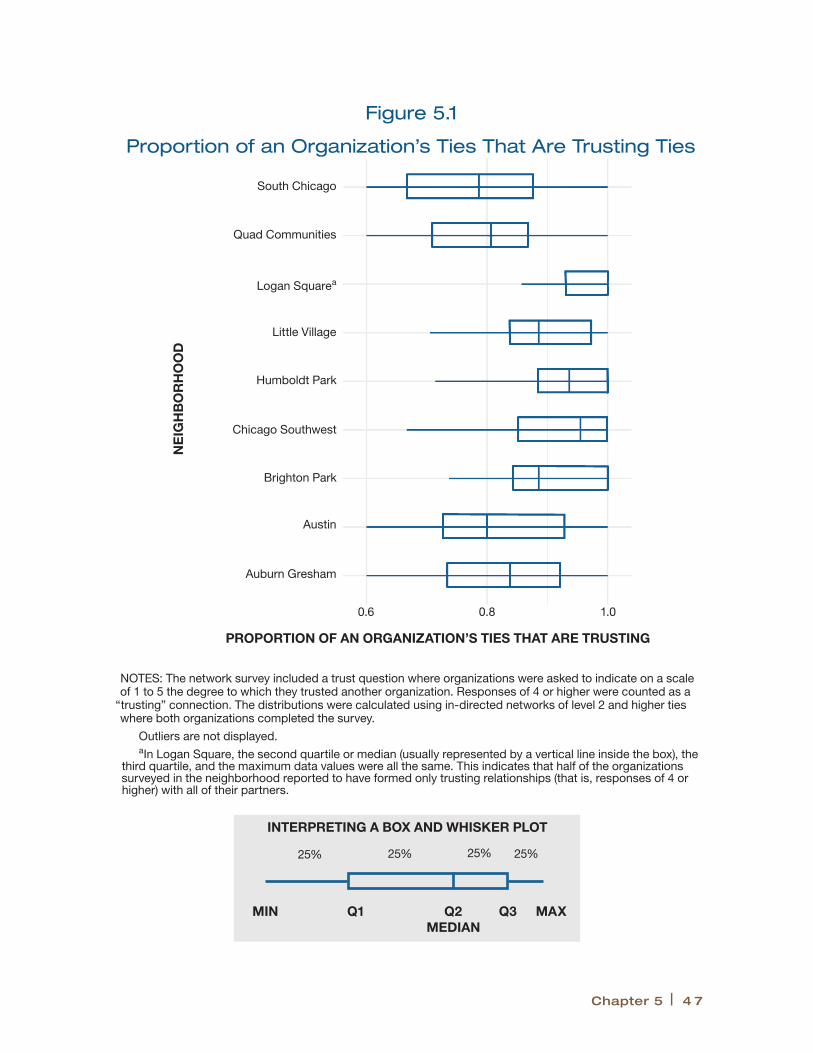
Q2 MEDIAN
MAXMIN Q1 Q3
25% 25% 25% 25%
INTERPRETING A BOX AND WHISKER PLOT
Figure 5.1
Proportion of an Organization’s Ties That Are Trusting Ties
NOTES: The network survey included a trust question where organizations were asked to indicate on a scale of 1 to 5 the degree to which they trusted another organization. Responses of 4 or higher were counted as a
“trusting” connection. The distributions were calculated using in-directed networks of level 2 and higher ties where both organizations completed the survey.
Outliers are not displayed.aIn Logan Square, the second quartile or median (usually represented by a vertical line inside the box), the
third quartile, and the maximum data values were all the same. This indicates that half of the organizations surveyed in the neighborhood reported to have formed only trusting relationships (that is, responses of 4 or higher) with all of their partners.
NE
IGH
BO
RH
OO
D
South Chicago
Quad Communities
Logan Squarea
Little Village
Humboldt Park
Chicago Southwest
Brighton Park
Austin
Auburn Gresham
PROPORTION OF AN ORGANIZATION’S TIES THAT ARE TRUSTING
0.6 0.8 1.0
Chapter 5 | 4 7
lower in these communities for institutions such as CPS and local aldermen’s offices, given the long histories of racial discrimination. Following the shooting of a teenager, Laquan McDonald, in 2014, and the perceived cover-up of the event by police and elected officials, mistrust of police departments may have been particularly salient.
Local groups often recognize the potential impact of mistrust on community collaboration and form different strategies to address it. For example, during the research team’s field-work in Austin, the neighborhood was often described as a place where it was difficult to get organizations to work together and where trust needed to be earned. While a number of neighborhood organizations and leaders have acted to convene other groups, interviews and observations show that these groups were not always the most welcoming or engaged. To respond to these challenges, Austin Coming Together (ACT) was formed in 2010 after the University of Illinois at Chicago convened a group of leaders to present the results of an assessment on opportunities for employment and community development in the neighborhood. This event led to more meetings and the eventual creation of ACT in 2011, with funding from the JP Morgan Chase Foundation. ACT hoped to serve as a convener and facilitator (as opposed to implementer of projects), to engage community organizations, and to work with them on priority areas. During its early years, the organization spent time meeting local leaders and organizations, convening and facilitating community meetings, and connecting some organizations to resources. Bringing organizations together, however, proved to be a difficult task not only because ACT was a new organization, but because it was perceived as an “outsider.” As one ACT staff member said, “so in Austin, that’s a big deal; whether you’re from Austin or not kind of determines whether people trust you or whether you have to really prove yourself and kind of earn people’s trust.” ACT staff however also noted that while organizations were willing to come together for short-term projects (such as events), it was more difficult to bring them together for long-term projects that required more commitment.
how Trust and Longevity Mattered for Organizations and Communities
One of the more significant findings related to trust in the CCN study had to do with its association with organizational capacity. To explore how trust might be associated with organizational capacity, the research team estimated regression models using measures from the survey of organizational strengths and challenges as dependent variables. The CCN survey asked respondents to rate their organization’s strengths on a five-point scale (1 = emerging strength, 5 = established strength) in nine different areas. These areas were derived from questions on the World Bank Social Capital Assessment Tool and included, among others, the ability to manage staff, prepare financial reports, resolve conflicts within the organization and with partners, and broadly carry out its mission. The research team calculated a count of the number of times the respondent selected 4 or 5 to create an overall assessment of the organization’s strengths. In general, the individual measures displayed
4 8 | Chicago Community Networks

little variance. The average score for most of these nine measures was above 4, suggesting that either respondents generally believed their organization to be strong or were unwill-ing to reveal perceived weaknesses.
Similarly, respondents rated several challenges their organization faced on a three-point scale (1 = occurs rarely or not at all, 2 = occurs sometimes, 3 = occurs often). The challenges focused on potential types of difficulties an organization might encounter when collabo-rating with other organizations, including physical distance, lack of resources, lack of time, and worry over loss of control over decisions. The research team calculated a count of the number of times a challenge occurred often (a score of 3), creating an overall indicator of the extent of the difficulties the organization experienced. As with the strength measures, the challenge measures displayed little variance. The average score for most of the individual measures was around 1.5.
In exploratory models, factors such as the organization’s age, staff size (including volunteers), type, and domains of work did not predict organizational capacity or challenges. The low variance of the measures described above may have led to this result. Even with this low variance, however, self-assessed organizational strength was positively associated with the trust of one’s partners, controlling for other factors.
It is possible that trust from partners can make for more effective collaboration and lead to enhanced implementation capacity. This phenomenon can occur as a “virtuous cycle,” whereby implementation success breeds trust, which in turn breeds further success that may attract new partners. Such a virtuous cycle was found in some of the qualitative data, specifically in the case of a small youth boxing organization and the “leap of faith” that a local church took in supporting it (described in Box 5.1), and in the case of the Greater Auburn Gresham Development Corporation (GADC) and its first venture in the education field, an area with which it had little previous experience.
GADC first became involved with education around 2006 when CPS began phasing out a local high school. In an effort to salvage the high school, GADC partnered with the Perspectives Charter School network to continue servicing high school students in the neighborhood. GADC was among the five neighborhood organizations that Atlantic Philanthropies se-lected to implement Elev8, an initiative it designed to improve the achievement and life outcomes of low-income students. The initiative targeted middle school students through extended-day learning opportunities, school-based health care, and mentoring and access to income supports for families.
When GADC was invited to participate in Elev8, the organization relied on its existing partnership with Perspectives Charter School to implement the program. This particular partnership would prove to be central to GADC’s expansion of its education-related activities. Through its partnership with Perspectives, GADC opened a health clinic at the school that offered services to students in the entire neighborhood. This clinic allowed GADC to gain a foothold in, and subsequently develop a relationship with, the local public schools. Later,
Chapter 5 | 4 9

GADC was able to launch its Litter Free program — a grassroots recycling program — in the neighborhood.
By using its existing relationship with Perspectives Charter School, GADC was able to ex-pand its work into an area where it previously had no expertise. This expansion not only brought new resources to the organization, but deepened its relationship with Perspectives, which also benefited from this relationship since it was new to the neighborhood. One staff member at Perspectives Charter School described the relationship as follows:
When we first came into the community, they were one of our first grants… We partnered with GADC, who has been with us like every step of the way… But I also think we have kind of a familial relationship that we are each other’s go to. When we get an opportunity for a grant, and we need a community partner, then that’s automatic. We go to GADC. I kind of believe it’s the same way that they come to us.
Overall, these findings suggest that higher levels of trust may result in cycles within neighborhoods that can improve the capacity of individual organizations. Other research has shown that trust is both difficult to establish and important to the persistence of ties, which suggests that organizations that are new to a network may have difficulty obtaining a central role within that network. Accordingly, it is possible that the cycle that links trust and capacity may benefit an individual organization at the expense of others. Individual organizations prefer to partner with more central actors because they benefit from that association; hence, more central actors become more trusted and are likely to be more effective. This “preferential attachment” can create a “rich get richer” effect whereby
Box 5.1
A Leap of Faith Based on Trust to Reduce Youth Violence
In 2008, the La Villita Community Church was approached by the Boxing Club, a start-up organization that was using boxing as a way of engaging youth in alternative responses to street violence. The Boxing Club had been operating in various locations and was seeking a more permanent space. La Villita Community Church rented out its space despite some reservations from its board and congregation about the club’s approach to deter youth violence. The church, however, was committed to supporting programs working with youth and thus made a leap of faith to support the Boxing Club. A year into the partnership, the lead pastor of La Villita Community Church joined the Boxing Club’s board and was instrumental in recruiting other board members at a time when the club was under financial strain. After eight years of partnership, the Boxing Club has become an important part of the congregation. Describing the partnership, the pastor said: “So we’re committed to just kind of being there for the Boxing Club in any capacity we have. The church really supports the Boxing Club. When there are events, a lot of the volunteers are from the church. They sort of consider it a ministry of the church. Although it’s not a ministry of the church, they sort of consider it like a sister organization, you know, always volunteering.”
5 0 | Chicago Community Networks

central organizations become even more central, leading to a highly centralized network.11 At the same time, networks within the CCN study with high levels of overall trust, such as Little Village, were highly decentralized, suggesting that this rich-get-richer pattern is not inevitable.
11. Albert and Barabási (2002).
Chapter 5 | 5 1

ChApTer
6
The Diversity and Comprehensiveness of Chicago
Neighborhood Ties
Network diversity — the varied kinds of strengths or contributions that a set of partners could bring to community collaborations — may influence whether part-nerships form and how successful they are. In the Chicago Communities Network
(CCN) study, diversity refers to different and complementary organizational resources or skills, such as the tie between a large community health center and a smaller neighborhood group that might facilitate outreach.1
Networks also can bring varied resources to partnerships as measured by the comprehensive-ness of connections, or “multiplexity” (described in Figure 6.1). In social network analysis, multiplexity measures the extent to which ties reflect different kinds of connections — for example, coworkers who are also friends. Within the CCN study, multiplexity relates to the number of work domains around which an organization communicates, coordinates, or collaborates — for example, organizations that engage with each other not only about education but also housing or workforce development. In theory, collaborating organiza-tions whose work spans different work domains may bring complementary advantages to these partnerships. For example, organizations whose connections involve schooling and public safety may be able to better coordinate educational supports for young people while also addressing the potential for gang involvement.
how Diversity and Comprehensiveness Matter for policy, public Management, and Communities
As it relates to public policy, comprehensiveness has become a significant guiding principle for community development across the nation. Although defined in different ways, com-
1. Network diversity may also refer to representation by different neighborhood constituencies, although this study does not use the term in this way. For example, a program aimed at neighborhood-wide youth outreach related to safety or gang involvement might need to engage community organizations located in different parts of the neighborhood or represent different racial and ethnic constituencies.
Chapter 6 | 5 3

prehensive community development generally promotes a broad range of neighborhood improvement projects, either by encouraging a single organization to engage in multiple domains of work or by coordinating varied strategies for community improvement among separate organizations.2 It is important for policy to understand whether underlying com-munity networks undergird comprehensiveness and which types of neighborhoods may best promote comprehensive strategies to community problems.
From a public management perspective, research has shown diversity within networks to be an important — but very difficult to achieve — predictor of successful partnerships. For example, a multisite network study of community health coalitions found that it was theoretically important to include both large hospitals and smaller organizations, as the latter increased the credibility of the overall network. At the same time, diversity within coalitions was actually associated with perceptions of reduced network effectiveness, as these differences appeared to have not been managed successfully.3 On the other hand, public management literature has generally shown comprehensive ties to be beneficial to sustained partnerships because these ties may indicate deeper underlying levels of con-nectedness between groups that may hold up better under strain.4 That is, if one kind of tie is severed (for example, due to loss of funding for a particular program area such as educa-tion), the relationship is more likely to persist because it involves other forms of connection.
For communities as a whole, the resilience of these inter-organizational connections is important because these more “organic” and lasting ties are the ones most likely to be sus-tained.5 This finding is also corroborated by MDRC research on community development
2. See discussion of different forms of comprehensiveness in Greenberg et al. (2014).
3. Shortell et al. (2002).
4. Provan, Fish, and Sydow (2007).
5. Human and Provan (2000).
TERM ILLUSTRATION IN THE CCN STUDY
Comprehensiveness
In the CCN study, comprehensiveness or multiplexity is defined by the number of different domains of work (for example, education or housing) in which two entities have formed a relationship.
As the CCN survey identifies six domains of work, comprehensiveness scores can range from 1 to 6. If two organizations worked together only in the education domain, their tie would be assigned a score of 1. If the two also partnered in the public policy and organizing domain, the tie would receive a comprehensiveness score of 2, and so on.
Figure 6.1
Key Network Term: Comprehensiveness
5 4 | Chicago Community Networks
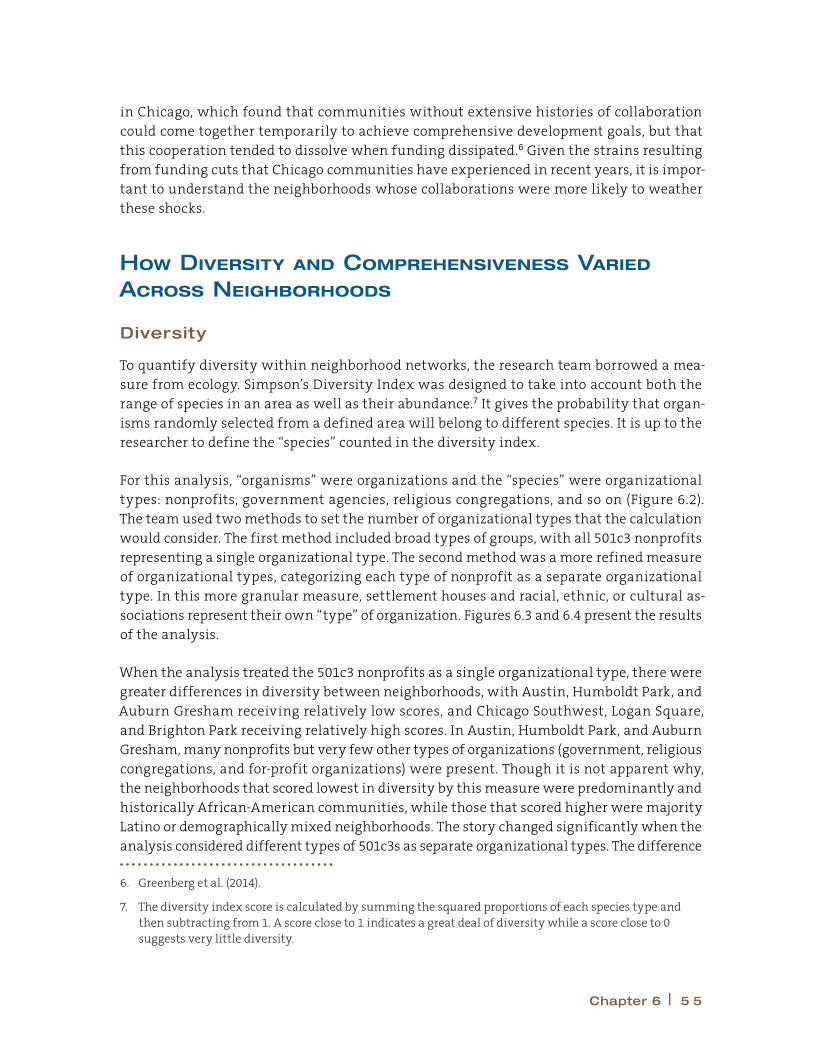
in Chicago, which found that communities without extensive histories of collaboration could come together temporarily to achieve comprehensive development goals, but that this cooperation tended to dissolve when funding dissipated.6 Given the strains resulting from funding cuts that Chicago communities have experienced in recent years, it is impor-tant to understand the neighborhoods whose collaborations were more likely to weather these shocks.
how Diversity and Comprehensiveness Varied Across Neighborhoods
Diversity
To quantify diversity within neighborhood networks, the research team borrowed a mea-sure from ecology. Simpson’s Diversity Index was designed to take into account both the range of species in an area as well as their abundance.7 It gives the probability that organ-isms randomly selected from a defined area will belong to different species. It is up to the researcher to define the “species” counted in the diversity index.
For this analysis, “organisms” were organizations and the “species” were organizational types: nonprofits, government agencies, religious congregations, and so on (Figure 6.2). The team used two methods to set the number of organizational types that the calculation would consider. The first method included broad types of groups, with all 501c3 nonprofits representing a single organizational type. The second method was a more refined measure of organizational types, categorizing each type of nonprofit as a separate organizational type. In this more granular measure, settlement houses and racial, ethnic, or cultural as-sociations represent their own “type” of organization. Figures 6.3 and 6.4 present the results of the analysis.
When the analysis treated the 501c3 nonprofits as a single organizational type, there were greater differences in diversity between neighborhoods, with Austin, Humboldt Park, and Auburn Gresham receiving relatively low scores, and Chicago Southwest, Logan Square, and Brighton Park receiving relatively high scores. In Austin, Humboldt Park, and Auburn Gresham, many nonprofits but very few other types of organizations (government, religious congregations, and for-profit organizations) were present. Though it is not apparent why, the neighborhoods that scored lowest in diversity by this measure were predominantly and historically African-American communities, while those that scored higher were majority Latino or demographically mixed neighborhoods. The story changed significantly when the analysis considered different types of 501c3s as separate organizational types. The difference
6. Greenberg et al. (2014).
7. The diversity index score is calculated by summing the squared proportions of each species type and then subtracting from 1. A score close to 1 indicates a great deal of diversity while a score close to 0 suggests very little diversity.
Chapter 6 | 5 5

between neighborhoods largely disappeared. Diversity scores were all around 0.75 to 0.8 on a scale from 0 to 1, suggesting that the neighborhood organizations were rather diverse.
Comprehensiveness
Comprehensiveness in the CCN study is defined as work that occurs across multiple do-mains with the same partner. Since the survey identifies six work domains, the research team characterized each tie using a comprehensiveness score from 1 to 6. For example, if two organizations worked together only in the education domain (in other words, they only have a tie in the education network), the team assigned that tie a comprehensiveness score of 1. If two organizations worked together in the education domain and in the politics and political organizing domain, the tie received a comprehensiveness score of 2, and so on.8
8. Comprehensiveness, defined in this manner, is sensitive to relationship intensity. (The survey defines relationship intensity on a scale from 1 to 3, where 1 is “communication” and 3 is “coordination.”) If any intensity of interaction is sufficient to count as a tie within the network (including low levels of direct interaction), then it is easier for a relationship to obtain a high comprehensiveness score; any activity can contribute. If ties are restricted (by definition) to more intense interaction (for example, coordination and collaboration as in some of the analyses presented above), relatively fewer relationships will achieve a high comprehensiveness score. For example, if an organization coordinates (Level 2) with another in the housing and commercial real estate domain and shares information (Level 1) with the same organization about its work in the community well-being domain, that relationship would be
Figure 6.2
Important Network Term: Diversity
TERM ILLUSTRATION IN THE CCN STUDYDiversity reflects the variety of different organization types (for example, government agencies, schools, nonprofit organizations, and so on) present in a particular neighborhood.
Diversity is measured on a scale from 0 (no diversity) to 1 (infinite diversity).
Neighborhood A: Low Diversity
Neighborhood B: High Diversity
Using a model developed in the field of ecology, the CCN study calculates diversity as the probability that any two organizations randomly selected from a neighborhood will belong to different organization types.a
This method considers diversity both in terms of the number of different organizational types as well as the abundance of each organizational type in a particular neighborhood.
In the example at the left, each shape and color combination represents a different organizational type. Both neighborhoods have the same number of organizational types. However, Neighborhood B, where each organizational type is similarly abundant, is considered more diverse than Neighborhood A.
NOTE: aSimpson (1949).
(continued)
5 6 | Chicago Community Networks
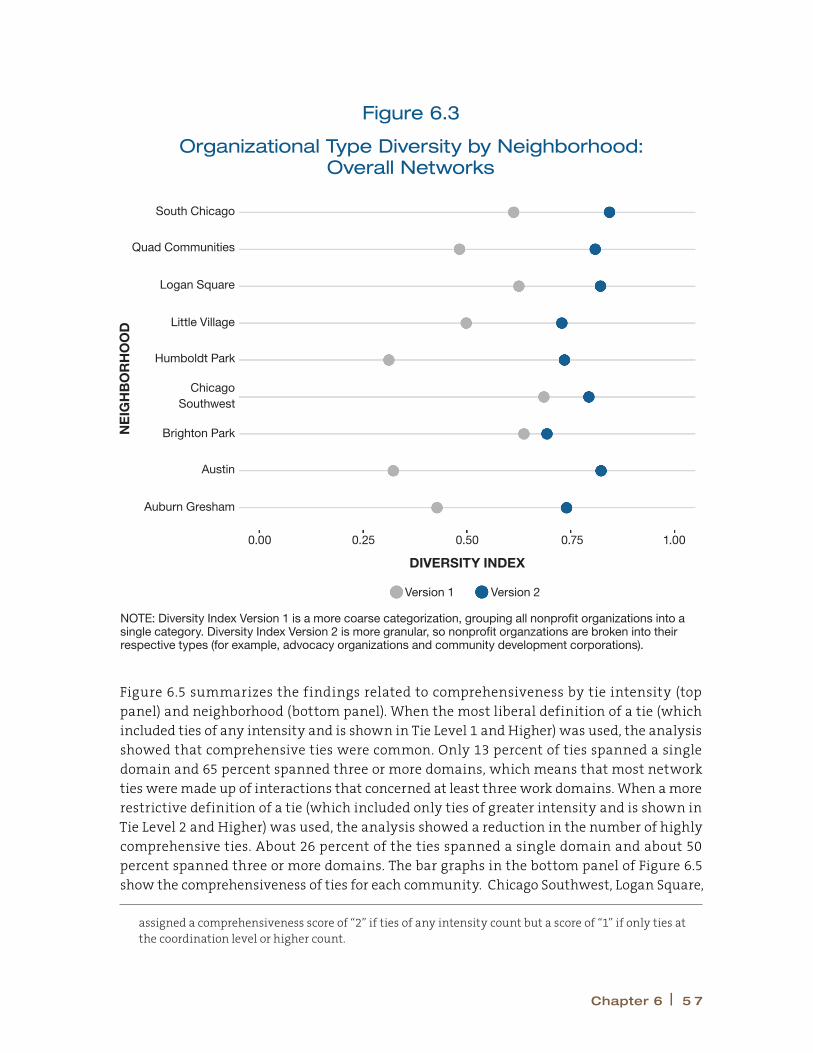
Figure 6.5 summarizes the findings related to comprehensiveness by tie intensity (top panel) and neighborhood (bottom panel). When the most liberal definition of a tie (which included ties of any intensity and is shown in Tie Level 1 and Higher) was used, the analysis showed that comprehensive ties were common. Only 13 percent of ties spanned a single domain and 65 percent spanned three or more domains, which means that most network ties were made up of interactions that concerned at least three work domains. When a more restrictive definition of a tie (which included only ties of greater intensity and is shown in Tie Level 2 and Higher) was used, the analysis showed a reduction in the number of highly comprehensive ties. About 26 percent of the ties spanned a single domain and about 50 percent spanned three or more domains. The bar graphs in the bottom panel of Figure 6.5 show the comprehensiveness of ties for each community. Chicago Southwest, Logan Square,
assigned a comprehensiveness score of “2” if ties of any intensity count but a score of “1” if only ties at the coordination level or higher count.
Figure 6.3
Organizational Type Diversity by Neighborhood: Overall Networks
NOTE: Diversity Index Version 1 is a more coarse categorization, grouping all nonprofit organizations into a single category. Diversity Index Version 2 is more granular, so nonprofit organzations are broken into their respective types (for example, advocacy organizations and community development corporations).
NE
IGH
BO
RH
OO
D
South Chicago
Quad Communities
Logan Square
Little Village
Humboldt Park
Chicago Southwest
Brighton Park
Austin
Auburn Gresham
DIVERSITY INDEX
0.00 0.25 0.50 0.75 1.00
Version 1 Version 2
Chapter 6 | 5 7
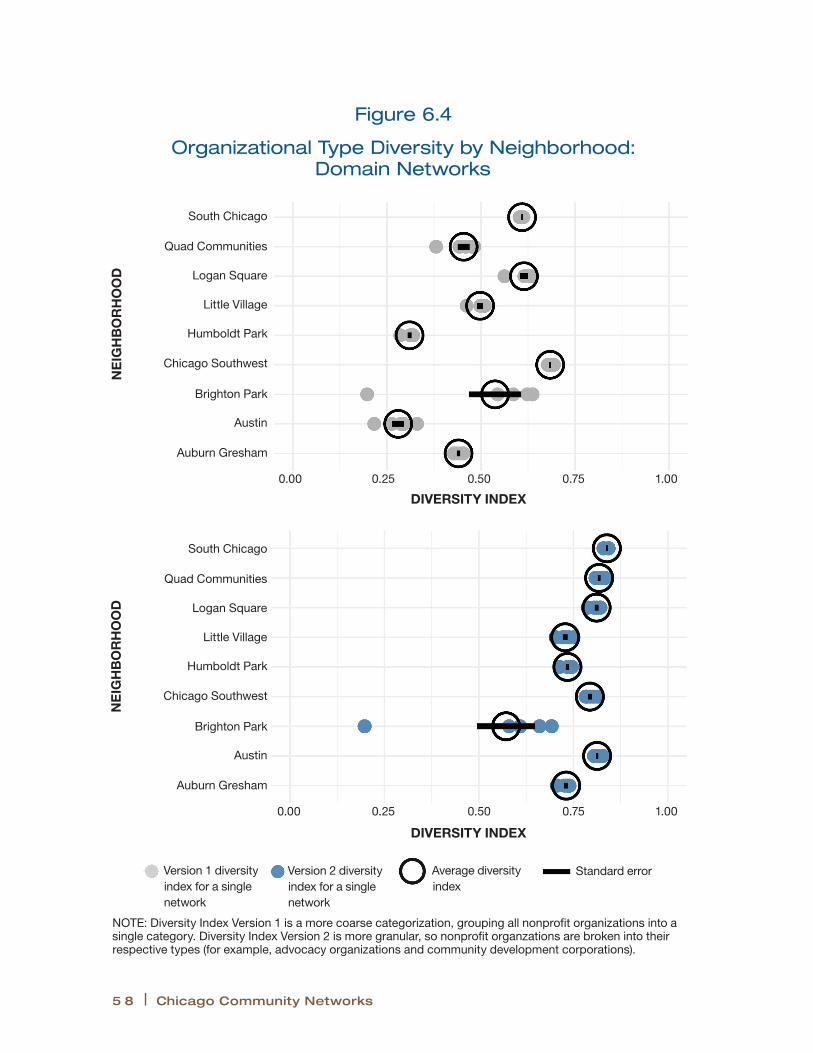
Figure 6.4
Organizational Type Diversity by Neighborhood: Domain Networks
NOTE: Diversity Index Version 1 is a more coarse categorization, grouping all nonprofit organizations into a single category. Diversity Index Version 2 is more granular, so nonprofit organzations are broken into their respective types (for example, advocacy organizations and community development corporations).
South Chicago
Quad Communities
Logan Square
Little Village
Humboldt Park
Chicago Southwest
Brighton Park
Austin
Auburn Gresham
DIVERSITY INDEX
0.00 0.25 0.50 0.75 1.00
DIVERSITY INDEX
0.00 0.25 0.50 0.75 1.00
NE
IGH
BO
RH
OO
D
NE
IGH
BO
RH
OO
D
Version 1 diversity index for a single network
Version 2 diversity index for a single network
Average diversity index
Standard error
South Chicago
Quad Communities
Logan Square
Little Village
Humboldt Park
Chicago Southwest
Brighton Park
Austin
Auburn Gresham
5 8 | Chicago Community Networks
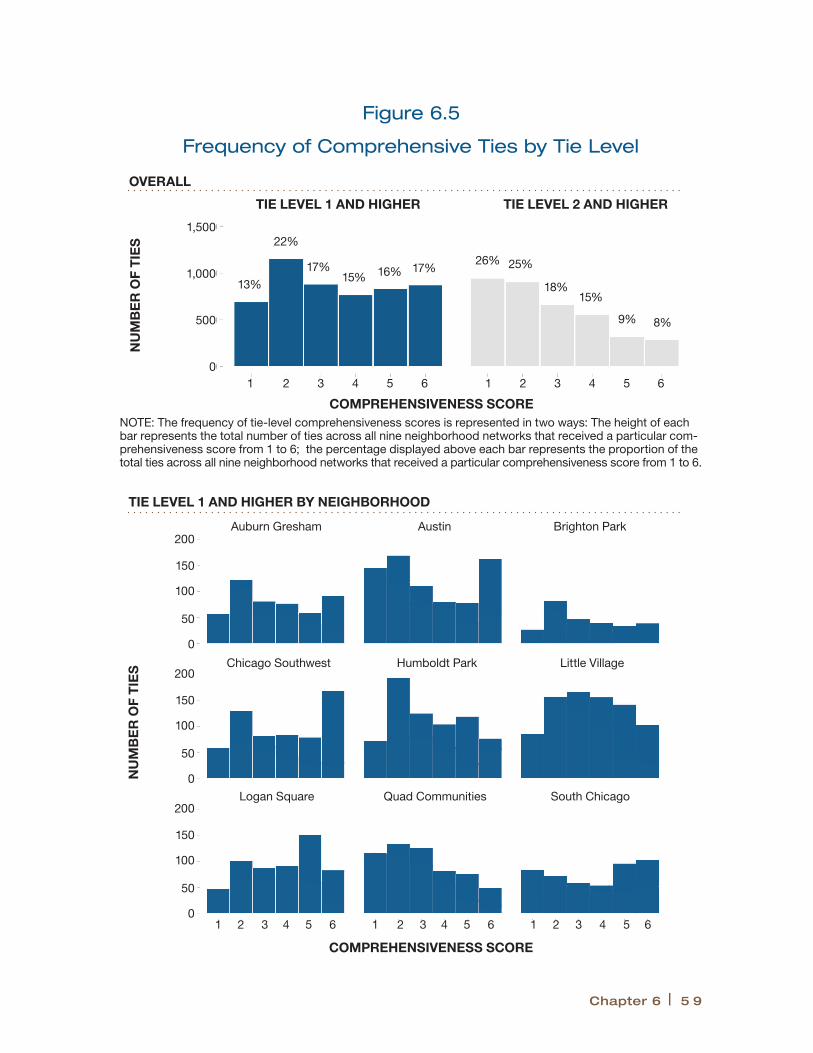
Figure 6.5
Frequency of Comprehensive Ties by Tie Level
TIE LEVEL 1 AND HIGHER BY NEIGHBORHOOD
1 2 3 4 5 6 1 2 3 4 5 6 1 2 3 4 5 6
1 2 3 4 5 6 1 2 3 4 5 6
200
150
100
50
0
200
150
100
50
0
200
150
100
50
0
Auburn Gresham Austin Brighton Park
Chicago Southwest Humboldt Park Little Village
Logan Square Quad Communities South Chicago
COMPREHENSIVENESS SCORE
TIE LEVEL 1 AND HIGHER TIE LEVEL 2 AND HIGHER
NU
MB
ER
OF
TIE
SN
UM
BE
R O
F T
IES
1,500
1,000
500
0
13%
22%
17%15% 16% 17%
26% 25%
18%15%
9% 8%
COMPREHENSIVENESS SCORE
OVERALL
NOTE: The frequency of tie-level comprehensiveness scores is represented in two ways: The height of each bar represents the total number of ties across all nine neighborhood networks that received a particular com-prehensiveness score from 1 to 6; the percentage displayed above each bar represents the proportion of the total ties across all nine neighborhood networks that received a particular comprehensiveness score from 1 to 6.
Chapter 6 | 5 9
and South Chicago had relatively high proportions of ties with comprehensiveness scores of 5 or 6, suggesting that most organizations at least communicated with their partners about activities spanning all or almost all areas of community development. Quad Communities, in contrast, had a greater proportion of ties with comprehensiveness scores of 1, 2, and 3.
In the same way that institutional factors rather than neighborhood demography appears to have been associated with concentrations of network power, comprehensiveness was also associated with underlying patterns of network practices rather than a community’s racial or ethnic composition. Both Logan Square and Chicago Southwest reported the highest levels of comprehensive ties, and the most central organizations in these neigh-borhoods were highly regarded community organizing agencies — the Logan Square Neighborhood Association (LSNA) and the Southwest Organizing Project (SWOP).9 These central groups — which focus on mobilizing other organizations around a host of policy issues including education, safety, and housing — may have contributed over time to the culture of local organizations in which groups communicated, coordinated, and collaborated with each other in more than one area.
For example, LSNA has long-established task forces in multiple work domains, in which com-munity organizations contribute to annual plans to improve education and safety, as well as sit on multiple committees that allow cross-disciplinary practices to emerge. MDRC’s past research in Logan Square found that this diversity was beneficial when collaborations faced challenges. Specifically, over the course of the New Communities Program, LSNA started to promote affordable housing development in the neighborhood, not by constructing units directly, but by forging partnerships with community development corporations that iden-tified properties that could be renovated for affordable housing. When plans to construct affordable apartments encountered opposition from members of the community worried about an influx of low-income people into the area, LSNA mobilized organizations in the network, soliciting their support for a zoning change that allowed the project to continue.
Similarly, organizations in Chicago Southwest reported ties with their partners that were characterized by high levels of communication (Level 1 ties) across multiple domains. SWOP, the lead agency in this neighborhood, encouraged interaction and communication among local organizations through their community organizing networks, operating active work-ing groups and committees in different domains such as education and housing.
The following section describes further implications of comprehensive or multiplex ties for network effectiveness.
9. As with previous measures, comprehensiveness or multiplexity was also analyzed at an organizational level by calculating the proportion of an organization’s ties that were highly comprehensive (not shown). The average proportion was then calculated for each neighborhood. Focusing on ties with comprehensiveness scores of 4 or higher (4 or more work domains), most neighborhoods were roughly similar but Logan Square and Chicago Southwest stood out. In Logan Square, 40 percent of the average organization’s ties spanned 4 or more work domains, compared with a neighborhood average of about 27 percent.
6 0 | Chicago Community Networks

how Network Diversity and the Comprehensiveness of Ties helped preserve Affordable housing, Improve Schools, and promote Safety
In contrast with findings from past research pointing to the challenges that diverse orga-nizational types face when coordinating, the CCN study found that neighborhoods where partnerships spanned multiple work domains and included a broader range of different organizational types were often able to leverage these differences for more effective pro-grams and policy, especially when these partnerships were intentionally formed and well managed. While the study found a general association between diverse, comprehensive networks and more successful implementation outcomes, three comparative case studies illustrate this finding particularly well. The first relates to the importance of network man-agement to forming the diverse partnerships around foreclosure and commercial corridor revitalization. The second relates to the important overlap between educational and policy reform networks when launching school improvement programs. The third relates to the capacity of organizations that bridged domains in community-based violence prevention initiatives and police accountability efforts.
Managing Diverse Coalitions and Comprehensive
Strategies to Preserve Housing and Revitalize
Commercial Corridors
Just before the financial crisis of 2008, a wave of foreclosures in Chicago significantly af-fected many neighborhoods in the CCN study and became the subject of national atten-tion. At the time of the CCN study, Chicago remained the city with the highest foreclosure rates among the 20 largest cities in the country.10 In addition to the problems related to residential foreclosure, businesses in low-income neighborhoods in Chicago face significant challenges in remaining viable, as vacant storefronts reduce traffic to commercial corri-dors and make it harder for them to stay open. Efforts to reach out to individuals at risk of foreclosure and to revitalize commercial corridors have become significant components of many community collaborations in recent years. In Chicago Southwest, these efforts have brought together varied organizations whose work across domains has contributed to successful implementation. In Austin, on the other hand, similar efforts have struggled to gain traction in part because actors who might have been structurally well positioned to manage diverse and comprehensive strategies have not been able to do so.
As described earlier, Chicago Southwest was the neighborhood with the largest proportion of ties among local groups that span all six work domains. It was also the neighborhood with the greatest organizational diversity among groups surveyed, as demonstrated by the relatively equal proportions of nonprofits, schools, and religious organizations in its
10. Rodkin (2016).
Chapter 6 | 6 1
networks. A core set of actors managed this organizational diversity and comprehensive-ness and led the implementation of community projects related to foreclosure prevention and commercial corridor revitalization.
Chicago Southwest continues to be hit hard by foreclosures, and abandoned properties in the neighborhood discourage local investment and may attract criminal activity. A core group of local partners — including SWOP, the local Neighborhood Housing Services (NHS) office, developers, local faith-based organizations, and schools — has responded by engaging a broad coalition to develop strategies to prevent foreclosure and quickly reoccupy foreclosed and abandoned buildings. These partners intentionally cultivated this diverse group of organizations in order to reach a broad set of constituencies, as described in MDRC’s final report on the New Communities Program.11
In recent years, local partners have found ties between the housing and educational do-mains that bridge schools and community organizations to be particularly important to strategies that address local foreclosure. For instance, principals of local schools have been able to identify families in need of services, as well as properties immediately surround-ing schools that appear to be vacant and in need of new occupants. If an individual family is having trouble making payments, the NHS office serves as a counselor and a connector to loan modification or other kinds of programs that can help the family keep its home. If the county repossesses a vacant property, the local NHS office is often able to facilitate a quick disposition (or resale) to a new homeowner who may be better able to maintain the property. Describing the importance of these varied partnerships (even outside of the housing domain), one staff member at the local NHS office said:
I’ve been doing this for a long time, in many different neighborhoods, and a principal part of what’s successful for NHS is to be sure that we are in the cen-ter of whatever the community is doing. So whatever is happening, we need to be part of it. In Back of the Yards, the peace coalition. In West Humboldt, we’re working with the Block Club Federation. At NHS, we’re part of all the issues, but certainly [are involved with] crime and safety, immigration [in this one].
The partnership with Cook County is an example of a political connection that these effec-tively managed local partnerships enabled and facilitated. That is, Cook County was able to expedite the sale of properties to new owners because it could rely on local groups to find owners who could quickly reoccupy them. In essence, the value of the comprehensive ties that spanned across work domains related to schools, housing, and political action de-pended on the effectiveness of each of these partnerships in providing resources that the organizations would not have otherwise been able to deliver alone — from contributions from schools, such as counseling for families; to contributions from housing organizations, such as access to these families; to contributions from Cook County, such as a pipeline of homeowners.
11. Greenberg et al. (2014).
6 2 | Chicago Community Networks
This collaboration, which effectively connected well-managed policy networks to housing networks, included a large-scale effort to secure and renovate properties in the neighbor-hood. SWOP, with help from the regional coalition of organizing groups, United Power, engaged then-Governor Pat Quinn in extended discussions that secured a commitment of several million dollars. During a lengthy waiting period for these funds, SWOP developed new expertise in the bureaucratic procedures and legal requirements associated with new public funding streams, and, with the help of its partner and property developer Brinshore, gained proficiency in housing development.
Despite Chicago Southwest’s general economic struggles, an active Special Service Area (SSA) or business improvement district was established for the 63rd Street Corridor, which has brought the area’s businesses — including banks, insurance companies, auto body shops, and a funeral home — together with local social service organizations. These part-nerships were brought to bear when a police station on the corridor closed, which might have dampened the strip’s commercial activity. In respond, a large, citywide social services entity partnered with a local development corporation on a project to replace the station with a social service center, and thereby avoided the prospect of a vacant property in the corridor. This project was particularly complex, as it involved city-owned land and envi-ronmental remediation related to contaminated properties, but was successfully executed.
In contrast, Austin appears to have struggled in its effort to redevelop its commercial cor-ridor. Despite being Chicago’s largest geographical neighborhood, and the fact that nearly 60 SSAs had been established in the city since 1977, Austin had only recently applied for an SSA. This absence stands in particular relief against Quad Communities, Chicago Southwest, and Little Village, where the local SSAs have often served to bring together businesses and community organizations. A number of factors, including a general atmosphere of mistrust, affected Austin’s ability to launch an SSA. That said, however, even in places where the general level of mistrust was high, such as Quad Communities, SSAs could often convene varied local partners successfully.
In Chicago Southwest, the organizations with the greatest proportion of comprehensive ties included a well-respected branch of a citywide service organization, a long-standing community development group, a local alderman’s office, and SWOP. These groups were regarded highly by their partners, had many comprehensive ties to other organizations, and were central in terms of their overall position in many networks, suggesting that they were well positioned to coordinate comprehensive work. In contrast, the organizations in Austin with the greatest proportion of comprehensive ties were organizations that were either described as emergent, as in the case of the local chamber of commerce, or undergo-ing leadership transitions, such as a local clergy coalition. Therefore, Austin’s challenges may have been also exacerbated by the fact that groups practicing comprehensively were not well positioned to bridge among sectors to bring organizations together.
Chapter 6 | 6 3
harnessing educational Improvement Together With policy reform efforts
In the local efforts to address foreclosure described earlier, it was advantageous for network ties to span the “substantive” work domain of housing, as well as the public policy and organizing domain. It also appears that efforts to improve education similarly benefited from network ties that spanned the education and public policy and organizing domains, as illustrated by the cases below.
In Logan Square, which overall had the highest proportion of comprehensive ties, about 50 percent of ties between groups that related to education also related public policy and organizing. The successful implementation of the Parent Mentor program demonstrates the benefits of this overlap across domains. The Logan Square Neighborhood Association (LSNA), a community organizing group with a deep history in parent organizing and en-gagement strategies, has worked to improve educational outcomes through a broad array of organizing and service strategies. The Parent Mentor program is one of its most significant initiatives and involves partnerships with local middle schools. LSNA first developed the program in the 1990s, and by 2012 LSNA was operating it in nine schools, involving some 200 parents annually. The program attracted statewide attention as a promising new ap-proach to parent engagement in schools,12 and the state legislature allocated funding to expand the program to 15 sites across Illinois. Based on the premise that parental engage-ment is associated with better educational outcomes, the program trained and supported parents to work as teachers’ aides in middle schools.
While the program included a direct service component, in terms of helping improve stu-dent-teacher ratios, it also involved a community public policy or organizing component, in several ways. First, the program attracted state funding, which meant collaborating with schools to implement similar programs throughout Illinois. Second, the program collected data on the children it served, which meant working with the City of Chicago and Chicago Public Schools. Finally, the program offered participating parents a chance to become com-munity leaders and take part not just in improving the local school, but in political action around education more broadly.
In contrast, only about 20 percent of the comprehensive ties in Quad Communities spanned the education and public policy domains. This finding adds another dimension to the story of Dyett High School’s closure and the inability of local groups to come together to respond to it and resolve the conflict about what would replace it. In other words, many groups in Quad Communities worked together on education, but these ties did not always extend to the public policy and organizing domain. More widespread connections to political actors might have allowed the network to resolve the local conflict in a way that met community objectives.
12. Hong (2011); Warren and Mapp (2011).
6 4 | Chicago Community Networks

ChApTer
7
Conclusion
Community capacity has long undergirded local improvement initiatives, including the New Communities Program. While definitions may vary, the following is among the more conventional:1
Community capacity is the interaction of human, organizational, and social capital existing within a given community that can be leveraged to solve col-lective problems and improve or maintain the well-being of a given community. It may operate through informal social processes and/or organized efforts by individuals, organizations, and the networks of association among them and between them and the broader systems of which the community is a part.
According to this definition, communities are able to solve problems and maintain their well-being through both the actions of individual people and organizations, as well as the networks through which they interact with each other and the broader world. One impor-tant dimension of community capacity that this report emphasizes is not just the presence of neighborhood improvement networks, but the specific structural properties of these networks. These structural traits may differ by neighborhood or by the work domains they entail, and can help or hinder groups’ efforts to preserve affordable housing, improve local schools, and address public safety concerns.
For some time, analytic tools such as social network analysis have existed to understand how network structures contribute to successful community mobilization and community development,2 but these have not been extensively applied. Findings from the Chicago Community Networks (CCN) study are a rare opportunity to understand not just that the structure of local networks can improve the implementation of collective projects, but how they do so. The report has especially emphasized the potentially positive contributions of the following structural factors:
• Networks where well-connected organizations are tightly connected to each other appear better situated to implement successful educational improvement and community housing initiatives. In the cases of the education networks in Chicago Southwest and Little Village,
1. Chaskin (1999).
2. See Laumann, Galaskiewicz, and Marsden (1978); Keyes, Schwartz, Vidal, and Bratt (1996).
Chapter 7 | 6 5

a higher concentration of well-connected groups appears to have been associated with the successful implementation of many kinds of school improvement projects. In Quad Community’s housing network, this concentration resulted in the completion of success-ful commercial corridor development projects.
• Public policy networks with well-positioned brokers can foster broad-based mobilization to influence public and elected officials. In the case of Chicago Southwest, these brokers were able to connect otherwise disparate elements of the community to each other and to powerful elected officials and public partners.
• Trust among partners may promote the capacity of individual organizations. Far more than other quantitative factors, the trust of one’s partners was associated with an organiza-tion’s capacity and with reduced numbers of relationship challenges.
• Networks that combine public policy and organizing with service delivery appear to create some important advantages for local partnerships. In Chicago Southwest and Logan Square, ties that bridged policy and political organization with housing and education were especially important in creating the context for powerful foreclosure and community-school partnerships.
The general correspondence of field research to quantitative social network analysis moreover suggests that it may be possible to identify these structural characteristics in the absence of a social network survey, although a survey obviously offers advantages of measurement precision and other insights. That is, while funders and local practitioners may not have access to a social network survey before launching an initiative, at a broad level, the four structural properties described in this report have a qualitative, observable component. In other words, the fact that the study’s qualitative observations about the connectivity, hierarchy, trust, and comprehensiveness of neighborhood networks largely aligned with survey findings indicates that it is possible to understand in a general sense how communities differ before launching an initiative in that location.
Finally, a classic observation about social network analysis is that it may show the impor-tance of network structures, but may not leave room to explore the role of individuals and groups to create, utilize, and change them.3 While the CCN study shows how these structural aspects of partnerships are important, this report reveals how different kinds of community practices contribute to the formation of these structures. For example, in places such as Little Village, a neighborhood’s distinctively collaborative and nonhierarchical networks may be a result of longstanding initiatives that promote consensus and inclusion. In places such as Chicago Southwest, networks that facilitate a brokering of varied connections to political actors may be formed as a result of community organizing. The extent to which network structures appear amenable to short-term change will be addressed in analyses of the sec-ond wave of the CCN survey. The present study, however, also shows how meaningfully
3. Emirbayer and Goodwin (1994).
6 6 | Chicago Community Networks

different structures are built over time through the actions of community organizations as they partner with each other while trying to improve their neighborhoods.
Chapter 7 | 6 7


ReferencesAlbert, Réka, and Albert-László Barabási. 2002. “Statistical Mechanics of Complex Networks.”
Reviews of Modern Physics 74, 1: 47-54.
Ansell, Christopher. 2003. “Community Embeddedness and Collaborative Governance in the San Francisco Bay Area Environmental Movement.” Pages 123-144 in Mario Diani and Doug McAdam (eds.), Social Movements and Networks: Relational Approaches to Collective Action. Oxford, UK: Oxford University Press.
Bonacich, Phillip. 1987. “Communication Networks and Collective Action.” Social Networks 9, 4: 389-396.
Brown, Prudence, and Leila Fiester. 2007. “Hard Lessons About Philanthropy and Community Change from the Neighborhood Improvement Initiative.” Menlo Park, CA: The William and Flora Hewlett Foundation.
Burt, Ronald S. 1992. Structural Holes: The Social Structure of Competition. Cambridge, MA: Harvard University Press.
Chaskin, Robert J. 1999. Defining Community Capacity: A Framework and Implications from a Comprehensive Community Initiative. Chicago: Chapin Hall Center for Children at the University of Chicago.
Chaskin, Robert J., Prudence Brown, Sudhir Venkatesh, and Avis Vidal. 2001. Building Community Capacity. New York: Aldine de Gruyter.
Chaskin, Robert J., and Mikael Karlstrom. 2012. Beyond the Neighborhood: Policy Engagement and Systems Change in the New Communities Program. New York: MDRC.
De La Rosa Aceves, Aurelia, and David M. Greenberg. 2016. “Addressing Challenges in Community-Based Service Coordination: Breaking Down Silos to Promote Economic Opportunity.” New York: MDRC.
Edwards, Gemma. 2010. “Mixed-Method Approaches to Social Network Analysis.” Discussion Paper. Southhampton, UK: Economic and Social Research Council National Centre for Research Methods.
Emirbayer, Mustafa, and Jeff Goodwin. 1994. “Network Analysis, Culture, and the Problem of Agency.” American Journal of Sociology 99, 6: 1411-1454.
Feiock, Richard C., In Won Lee, and Hyung Jun Park. 2012. “Administrators’ and Elected Officials’ Collaboration Networks: Selecting Partners to Reduce Risk in Economic Development.” Public Administration Review 72, 1: 58-68.
Fried, Vance H., Garry D. Bruton, and Robert D. Hisrich. 1998. “Strategy and the Board of Directors in Venture Capital-Backed Firms.” Journal of Business Venturing 13, 6: 493-503.
References | 6 9
Galaskiewicz, Joseph, and Karl R. Krohn. 1984. “Positions, Roles, and Dependencies in a Community Interorganization System.” The Sociological Quarterly 25, 4: 527-550.
Greenberg, David, Nandita Verma, Keri-Nicole Dillman, and Robert Chaskin. 2010. Creating a Platform for Sustained Neighborhood Improvement: Interim Findings from Chicago’s New Communities Program. New York: MDRC.
Greenberg, David M., Sonya Williams, Mikael Karlstrom, M. Victoria Quiroz-Becerra, and Marcia Festen. 2014. “The Promise of Comprehensive Community Development.” New York: MDRC.
Gulati, Ranjay, Dovev Lavie, and Ravindranath Madhavan. 2011. “How do Networks Matter? The Performance Effects of Interorganizational Networks.” Research in Organizational Behavior 31: 207-224.
Hong, Soo. 2011. A Cord of Three Strands: A New Approach to Parent Engagement in Schools. Cambridge, MA: Harvard Education Press.
Hulsey, Lara, Andrea M. Esposito, Kimberly Boller, and Sarah Osborn. 2015. Promise Neighborhoods Case Studies: Final Report. Princeton, NJ: Mathematica Policy Research.
Human, Sherrie E., and Keith G. Provan. 2000. “Legitimacy Building in the Evolution of Small-Firm Multilateral Networks: A Comparative Study of Success and Demise.” Administrative Science Quarterly 45, 2: 327-365.
Huxham, Chris, and Siv Vangen. 2005. Managing to Collaborate: The Theory and Practice of Collaborative Advantage. London: Routledge.
Isett, Kimberley R., Ines A. Mergel, Kelly LeRoux, Pamela A. Mischen, and R. Karl Rethemeyer. 2011. “Networks in Public Administration Scholarship: Understanding Where We Are and Where We Need to Go.” Journal of Public Administration Research and Theory 21, Suppl. 1: i157-i173.
Kania, John, and Mark Kramer. 2011. “Collective Impact.” Stanford Social Innovation Review: 9, 1: 36-41.
Keast, Robyn, Myrna P. Mandell, Kerry A. Brown, and Geoffrey Woolcock. 2004. “Network Structures: Working Differently and Changing Expectations.” Public Administration Review 64, 3: 363-371.
Keyes, Langley C. 1969. The Rehabilitation Planning Game: A Study in the Diversity of Neighborhood. Cambridge, MA: MIT Press.
Keyes, Langley C., Alex Schwartz, Avis C. Vidal, and Rachel G. Bratt. 1996. “Networks and Nonprofits: Opportunities and Challenges in an Era of Federal Devolution.” Housing Policy Debate 7, 2: 201-229.
Kubisch, Anne C., Patricia Auspos, Prudence Brown, Robert Chaskin, Karen Fullbright-Anderson, and Ralph Hamilton. 1997. “Voices from the Field: Learning from the Early Work of Comprehensive Community Initiatives.” Washington, DC: The Aspen Institute.
7 0 | Chicago Community Networks
Laumann, Edward O., Joseph Galaskiewicz, and Peter V. Marsden. 1978. “Community Structure as Interorganizational Linkages.” Annual Review of Sociology 4, 1: 455-484.
Laumann, Edward O., and David Knoke. 1987. The Organizational State: Social Choice in National Policy Domains. Madison, WI: University of Wisconsin Press.
Milward, H. Brinton, and Keith G. Provan. 2006. A Manager’s Guide to Choosing and Using Collaborative Networks. Vol. 8. Washington, DC: IBM Center for the Business of Government.
Milward, H. Brinton, Keith G. Provan, Amy Fish, Kimberley R. Isett, and Kun Huang. 2009. “Governance and Collaboration: An Evolutionary Study of Two Mental Health Networks.” Journal of Public Administration Research and Theory 20, Suppl. 1: i125-i141.
Padgett, John F., and Christopher K. Ansell. 1993. “Robust Action and the Rise of the Medici, 1400-1434.” American Journal of Sociology 98, 6: 1259-1319.
Pendall, Rolf, Leah Hendey, David Greenberg, Kathryn L.S. Pettit, Diane Levy, Amy Khare, Megan Gallagher, Mark Joseph, Alexandra Curley, Aesha Rasheed, Nancy Latham, Audra Brecher, and Chantal Hailey. 2015. Choice Neighborhoods: Baseline Conditions and Early Progress. Washington, DC: Office of Policy Development and Research, U.S. Department of Housing and Urban Development.
Perez, Juan. 2017. “Chicago School Board to Consider Up to $500 Million More Long-Term Borrowing.” Chicago Tribune (May 23). Website: www.chicagotribune.com.
Popp, Janice K, Gail MacKean, Ann Casebeer, H. Brinton Milward, and Ronald Lindstrom. 2014. Inter-Organizational Networks: A Review of the Literature to Inform Practice. Washington, DC: IBM Center for The Business of Government.
Powell, Walter W., Douglas R. White, Kenneth W. Koput, and Jason Owen-Smith. 2005. “Network ynamics and Field Evolution: The Growth of Interorganizational Collaboration in the Life Sciences.” American Journal of Sociology 110, 4: 1132-1205.
Provan, Keith G., Amy Fish, and Joerg Sydow. 2007. “Interorganizational Networks at the Network Level: A Review of the Empirical Literature on Whole Networks.” Journal of Management 33, 3: 479-516.
Provan, Keith G., and Patrick Kenis. 2008. “Modes of Network Governance: Structure, Management, and Effectiveness.” Journal of Public Administration Research and Theory 18, 2: 229-252.
Provan, Keith G., and Robin H. Lemaire. 2012. “Core Concepts and Key Ideas for Understanding Public Sector Organizational Networks: Using Research to Inform Scholarship and Practice.” Public Administration Review 72, 5: 638-648.
Provan, Keith G., and H. Brinton Milward. 1995. “A Preliminary Theory of Interorganizational Network Effectiveness: A Comparative Study of Four Community Mental Health Systems.” Administrative Science Quarterly 40, 1: 1-33.
Referencess | 7 1
Provan, Keith G., Leigh Nakama, Mark A. Veazie, Nicolette I. Teufel-Shone, and Carol Huddleston. 2003. “Building Community Capacity Around Chronic Disease Services Through a Collaborative Interorganizational Network.” Health Education and Behavior 30, 6: 646-662.
Provan, Keith G., Mark A. Vezie, Lisa K. Staten, and Nicolette I. Teufel-Sone. 2005. “The Use of Network Analysis to Strengthen Community Partnerships.” Public Administration Review 65, 5: 603-613.
Rodkin, Dennis. 2016. “Chicago Foreclosure Rate Highest Among 20 Biggest Cities.” Chicago Business (November 10). Website: www.chicagobusiness.com.
Sampson, Robert J. 2012. Great American City: Chicago and the Enduring Neighborhood Effect. Chicago: University of Chicago Press.
Sampson, Robert J., and Corina Graif. 2009. “Neighborhood Social Capital as Differential Social Organization: Resident and Leadership Dimensions.” American Behavioral Scientist 52, 11: 1579-1605.
Shortell, Stephen M., Ann P. Zukoski, Jeffrey A. Alexander, Gloria J. Bazzoli, Douglas A. Conrad, Romana Hasnain-Wynia, Shoshanna Sofaer, Benjamin Y. Chan, Elizabeth Casey, and Frances S. Margolin. 2002. “Evaluating Partnerships for Community Health Improvement: Tracking the Footprints.” Journal of Health Politics, Policy and Law 27, 1: 49-92.
Simpson, Edward H. 1949. “Measurement of Diversity.” Nature 163: 668-668. doi:10.1038/163688a0.
Small, Mario Luis. 2009. Unanticipated Gains: Origins of Network Inequality in Everyday Life. New York: Oxford University Press.
Uzzi, Brian. 1996. “The Sources and Consequences of Embeddedness for the Economic Performance of Organizations: The Network Effect.” American Sociological Review 61, 4: 674-698.
Warren, Mark R., and Karen L. Mapp. 2011. A Match on Dry Grass: Community Organizing as a Catalyst for School Reform. New York: Oxford University Press.
7 2 | Chicago Community Networks
About MDRC
MDRC is a nonprofit, nonpartisan social and education policy research organization dedicated to learning what works to improve the well-being of low-income people. Through its research and the active communication of its findings, MDRC seeks to enhance the effectiveness of social and education policies and programs.
Founded in 1974 and located in New York; Oakland, California; Washington, DC; and Los Angeles, MDRC is best known for mounting rigorous, large-scale, real-world tests of new and existing policies and programs. Its projects are a mix of demonstrations (field tests of promising new program approaches) and evaluations of ongoing government and community initiatives. MDRC’s staff members bring an unusual combination of research and organizational experience to their work, providing expertise on the latest in qualitative and quantitative methods and on program design, development, implementation, and management. MDRC seeks to learn not just whether a program is effective but also how and why the program’s effects occur. In addition, it tries to place each project’s findings in the broader context of related research — in order to build knowledge about what works across the social and education policy fields. MDRC’s findings, lessons, and best practices are shared with a broad audience in the policy and practitioner community as well as with the general public and the media.
Over the years, MDRC has brought its unique approach to an ever-growing range of policy areas and target populations. Once known primarily for evaluations of state welfare-to-work programs, today MDRC is also studying public school reforms, employment programs for ex-prisoners, and programs to help low-income students succeed in college. MDRC’s projects are organized into five areas:
• Promoting Family Well-Being and Children’s Development
• Improving Public Education
• Raising Academic Achievement and Persistence in College
• Supporting Low-Wage Workers and Communities
• Overcoming Barriers to Employment
Working in almost every state, all of the nation’s largest cities, and Canada and the United Kingdom, MDRC conducts its projects in partnership with national, state, and local governments, public school systems, community organizations, and numerous private philanthropies.

New York16 East 34th StreetNew York, NY 10016Tel: 212 532 3200
Oakland475 14th StreetSuite 750Oakland, CA 94612Tel: 510 663 6372
Washington, DC1990 M Street, NWSuite 340Washington, DC 20036
Los Angeles11965 Venice BoulevardSuite 402Los Angeles, CA 90066
www.mdrc.org
B U I L D I N G K N O W L E D G ET O I M P R O V E S O C I A L P O L I C Y
mdrc