Embed Size (px)
Citation preview

The Skills to Pay the BillsAn Evaluation of an Effort to Help Nonprofits Manage Their Finances
Karen WalkerJean Grossman
Kristine AndrewsNicholas Carrington
Angela Rojas
February 2015
This report was commissioned by


The Skills to Pay the Bills An Evaluation of an Effort to
Help Nonprofits Manage Their Finances
Karen Walker (Child Trends)
Jean Grossman
(MDRC)
Kristine Andrews Nicholas Carrington
Angela Rojas (Child Trends)
February 2015

This publication is based on research commissioned and funded by The Wallace Foundation as part of its mission to support and share effective ideas and practices. The Wallace Foundation is a national philanthropy that seeks to improve education and enrichment for disadvantaged children and foster the vitality of the arts for everyone. The foundation works with partners to develop credible, practical insights that can help solve important, public problems. Wallace has five major initiatives under way:
• School leadership: Strengthening education leadership to improve student achievement. • After-school: Helping cities make good after-school programs available to many more
children, including strengthening the financial management capacity of after-school pro-viders.
• Building audiences for the arts: Developing effective approaches for expanding audiences so that many more people might enjoy the benefits of the arts.
• Arts education: Expanding arts learning opportunities for children and teens. • Summer and expanded learning time: Better understanding the impact of high-quality
summer learning programs on disadvantaged children, and how to enrich and expand the school day.
Find out more at www.wallacefoundation.org. Dissemination of MDRC publications is supported by the following funders that help finance MDRC’s public policy outreach and expanding efforts to communicate the results and implica-tions of our work to policymakers, practitioners, and others: The Annie E. Casey Foundation, The Harry and Jeanette Weinberg Foundation, Inc., The Kresge Foundation, Laura and John Arnold Foundation, Sandler Foundation, and The Starr Foundation. In addition, earnings from the MDRC Endowment help sustain our dissemination efforts. Contrib-utors to the MDRC Endowment include Alcoa Foundation, The Ambrose Monell Foundation, Anheuser-Busch Foundation, Bristol-Myers Squibb Foundation, Charles Stewart Mott Founda-tion, Ford Foundation, The George Gund Foundation, The Grable Foundation, The Lizabeth and Frank Newman Charitable Foundation, The New York Times Company Foundation, Jan Nichol-son, Paul H. O’Neill Charitable Foundation, John S. Reed, Sandler Foundation, and The Stupski Family Fund, as well as other individual contributors. The findings and conclusions in this report do not necessarily represent the official positions or policies of the funders. For information about MDRC and copies of our publications, see our website: www.mdrc.org.
iii
Overview
Nonprofit organizations, which deliver many of the social services Americans receive, often face financial management challenges that affect the quality of their services. First, they face complex public and private funding environments that impose substantial administrative bur-dens and economic uncertainty. Second, many have insufficient internal capabilities (many or-ganizations would call these “capacities”) to respond to these realities. This report examines how 25 Chicago-based organizations responded over a four-year period to an initiative designed to address these two aspects of their financial challenges.
Between 2009 and 2013, the Wallace Foundation funded a management consulting firm, Fiscal Management Associates, to provide the 25 nonprofit organizations that participated in the pro-ject with one of two models of professional development: (1) a customized model that included substantial individual consulting and group learning for organizations’ leaders, or (2) a model that provided primarily group learning opportunities. The foundation also provided grants to the 25 organizations designed to offset some of their costs. Simultaneously, the Wallace Foundation funded the Donors Forum, a Chicago-based organization, which worked to improve the public funding environment for nonprofit organizations in Illinois. During the evaluation period, the Donors Forum provided staff support to assist four state human service agencies in their efforts to implement legislation to streamline contracting practices.
Over the four years of the initiative, all the organizations but one made long-lasting changes in their financial practices. Interestingly, the financial practices of organizations receiving the less costly group learning model of support improved almost as much as those of organizations that received the customized learning model, albeit more slowly (that is, in three years rather than two). This indicates that the group learning approach could be cost-effective in cases where time is not an issue. Organizations in both groups invested between 800 and 1,000 hours of execu-tive, financial, and program staff effort to reach their financial management goals. This invest-ment led to stronger outcomes in organizations whose leaders’ priorities closely aligned with the project’s priorities. While the research did not measure the quality of organizations’ ser-vices, leaders and senior staff members reported that better financial practices led to better pro-gram planning and management and improved organizational stability.
Efforts to improve public funding practices met with mixed results. The state created a reposito-ry that permitted nonprofit organizations to submit standard financial information once a year instead of multiple times a year. However, the biggest challenge the organizations faced — late payments from the state — was not addressed because of the severity of Illinois’ budget crisis.
This report discusses lessons learned from the initiative about strengthening the financial man-agement of nonprofit organizations but also, more generally, about how to improve organiza-tional capabilities.

v
Contents Overview iii List of Exhibits vii Preface ix Acknowledgment xi Executive Summary ES-1 Chapter 1 Introduction 1
The Consequences of Poor Nonprofit Financial Management 3 External Funding and Policy Realities Pose Barriers to Nonprofit Organizations’
Stability and Programs 5 Report Structure 7
2 The Initiative and the Study Organizations 9 The Initiative’s First Pathway: Goals of the Professional Development Effort 9 The SFM Initiative’s Second Pathway: Efforts to Improve Funder Practices 14 The Organizations in the SFM Initiative 15 Conclusions 17
3 Working to Improve Financial Management and Its More Immediate Consequences 19 Change in the Finance Office’s Practices 20 Team Decision Making 27 Improvements to Organizational Quality: Strategic Thinking and Turnover 32 Benefits to Programs 34 Conclusions 35
4 Context Matters 37 The Economy and the Initiative 37 The Pace of Progress in the Two Models 42 Conclusions 51
5 The Cost of Professional Development in Strengthening Financial Management 53 Initiative Resource Costs: Professional Development, Labor, and Nonlabor
Expenditures 54 Pattern of Investment Over Time 58 Investments of Time Related to Breadth of Change 62 Conclusions 63
vi
6 Policy Changes and Efforts to Address Them 65 State Fiscal Conditions and Their Effect on Nonprofit Organizations 65 Donors Forum Activity 67 Partnership Principles 68 Efforts to Streamline Contracting in Illinois 69 Budgeting for Results 71 Conclusions 73
7 Main Findings and Implications for Professional Development for Nonprofit Organizations 77 Implications for Strengthening the Financial Management of Nonprofit
Organizations 81 Implications for Professional Development 82 Implications for Changing the Practices of Public Funders 83 Final Thoughts 84
Appendix A Outcome Measure Definitions 85 B Chicago Organizations That Participated in the Strengthening Financial Management Initiative 89 References 93

vii
List of Exhibits
Table
ES.1 The Professional Development Models at a Glance ES-4
2.1 The Professional Development Models at a Glance 12
2.2 Organizational Characteristics 16
2.3 Scores on Key Indicators of Financial Management at the Start of SFM 17
4.1 Organizations That Did and Did Not Achieve Most of Their Outcomes, by Strength of Leadership
41
4.2 Organizations That Did and Did Not Achieve Most of Their Outcomes, by Motivation
42
4.3 Changes in Outcome Measures, by Model and Intervention Period 49
5.1 Median Cost of Professional Development Provided to Each Organization, by Model 56
5.2 Labor Hours and Estimated Median Costs for Organizations, by Model 57
5.3 Total Expenditures on SFM Activities, by Model 58
5.4 Median Hours Spent Over the Time Commonly Needed to Produce Desired Outcomes 62
5.5 Organizations That Achieved Desired Outcomes, by CEO’s Motivation and Time Spent 64
Figure
2.1 Theory of Change 10
3.1 Change from Baseline to 48 Months in Cash-Flow Projections Per Year 24
3.2 Change from Baseline to 48 Months in Ratings of Finance Office Practices 25
3.3 Change from Baseline to 48 Months in Ratings of the Program Staff’s Financial Skills 29
3.4 Change from Baseline to 48 Months in Program Managers’ Involvement in Budget Monitoring 30

viii
3.5 Change from Baseline to 48 Months in Organizational Stability and Quality 33
4.1 Average Change Since Baseline in the Clarity of Financial Reports 43
4.2 Average Change Since Baseline in the Number of Times Per Year Program Managers Monitor Budgets 44
4.3 Average Change Since Baseline in the Number of Cash-Flow Projections Per Year 45
4.4 Average Change Since Baseline in the Strength of Program Managers’ Financial Skills 46
5.1 Median Hours Spent Per Period on SFM by All Staff Members 59
5.2 Median Hours Spent Per Period on SFM by CFOs 60
5.3 Median Hours Spent Per Period on SFM by CEOs 61
Box
2.1 How Progress Is Measured in This Study 14
3.1 Definitions and Significance of Financial Terms Used in This Report 21
5.1 About the Research for the Cost Study 55
ix
Preface
Apart from public education, most of the social services received by Americans are provided by nonprofit organizations. Public and private funders alike bemoan the fact that many of these services are not as strong or effective as they might be. When moved to do something about this situation, their common response is to try to alter programs or train the staff members who ad-minister them. But all too often these strategies do not work because the organizations them-selves are too weak: they are understaffed, their funding is uncertain from year to year, they have deficits, or they have high staff turnover.
This report examines a different approach, one that aims to improve the organizational capabilities of social service organizations (many would call these “capacities”) by strengthen-ing their financial management and lessening the burdens funders put on the organizations they support. The theory is that if organizational leaders can spend less time keeping their organiza-tions solvent, they can spend more time ensuring the quality of their programming and staffing. To test this idea, the Wallace Foundation funded a long-term organizational capability-building process, an effort to reform funder practices, and a long-term study to inform a wide audience about what was or was not working.
This study is unique in several ways. First, it contrasts how organizations reacted to two different models of professional development — a highly customized intervention and a group learning intervention. Second, it examines how organizations changed over time and provides important insights into how long it takes to achieve organizational change. Third, it is the first study to document the long-term effects of building organizations’ capabilities. Fourth, it care-fully documents the costs of the intervention, including both the costs of the assistance provided to the organizations by a consulting firm and the time and money expended by the participating organizations themselves. Finally, the report also examines an effort to improve the funding environment of nonprofit organizations, and highlights the challenges of doing so.
This report generates lessons about strengthening the financial management of the non-profit sector. Beyond that, however, it also generates interesting speculations about the relative usefulness of different types and levels of support for building organizations’ capabilities, sug-gesting that in some instances less costly group learning interventions may be almost as effec-tive as more expensive, customized versions. It also demonstrates the importance of strong or-ganizational motivation and leadership in realizing change. The research did not explicitly measure how improvements in nonprofit financial management affected the quality of program services, but interviews with staff members from organizations in the initiative highlighted the benefits of good financial management to organizational and program planning and stability.
Gordon Berlin President

xi
Acknowledgments
The evaluation for Strengthening Financial Management was funded by the Wallace Founda-tion. Ed Pauly, supported by Polly Singh, provided wise guidance throughout the project. Their deep knowledge of the after-school field and strong, consistent support for evaluation efforts was invaluable at all stages of the project.
Many thanks go to Fiscal Management Associates and the Donors Forum, the organiza-tions that the Wallace Foundation commissioned to carry out the professional development and policy efforts at the center of Strengthening Financial Management. Staff members from both organizations were generous in talking with the evaluation team, sharing their visions and put-ting their work in context.
The first three years of this evaluation were conducted by staff members at Pub-lic/Private Ventures (P/PV). When the organization closed its doors in 2012, the project moved with the project director, Jean Grossman, to MDRC and was completed by MDRC and Child Trends staff members. The research team that completed the evaluation deeply appreciates the data collection done by researchers at Public/Private Ventures, particularly Laurie Kotloff (who led the implementation evaluation), Tina Kauh, Jennifer McMaken, and Debbie Mayer (who worked on the survey effort). Changing the research team midstream is challenging, and the high-quality set of interviews and surveys that Laurie, Tina, and the P/PV team created was crit-ical in completing this report.
Many people at MDRC and Child Trends contributed to the project. Thanks go to Ra-chel Carney and Shawn Teague for the help they provided in analyzing the qualitative data. Camielle Headlam at MDRC led the thorough fact-checking of the document, created tables, and provided critical support as the report was compiled. We would also like to thank the re-ports’ reviewers at MDRC and Child Trends, including Fred Doolittle, Natalia Pane, Karen Cal-loo, Jesús Amadeo, Anne Fenton, Michael Bangser, and John Hutchins. Their comments were very helpful in shaping the report. Joshua Malbin edited the report and enhanced its clarity, and Stephanie Cowell prepared it for publication.
Finally, we are grateful to the executive directors, chief financial officers, other finan-cial staff members, and program managers from the 25 organizations that participated in Strengthening Financial Management. They met with researchers during interviews, completed lengthy annual surveys, and provided helpful information and insights about the project.
The Authors

ES-1
Executive Summary
The Importance of Strong Financial Management for Organizations Serving Young People Nonprofit organizations serving young people exist to provide meaningful opportunities for those young people to build their skills; experience positive, supportive relationships; and pre-pare for the future. No one would judge an organization’s worth by its financial soundness alone, but financially unhealthy programs threaten an organization’s ability to achieve its mis-sion. Unfortunately, although they are critical to effective management, core organizational ca-pabilities and effective administrative functions often are mistakenly perceived as peripheral to an organization’s mission.1
To the contrary, good financial management is essential to effective youth interven-tions. First, it enables organizations to plan strategically: A clear understanding of the resources needed to serve program participants well serves as a guide to fund-raising efforts. It also pro-vides information on the types of investments in an organization’s core capabilities — man-agement, support functions, and infrastructure — that need to be made to sustain program quali-ty. Second, good financial management means organizations can deploy their resources thoughtfully. It enables them to predict the impact of changing circumstances, such as funding delays or shortfalls, and respond to them while managing their effect on program quality. This report examines what happened to a group of organizations that attempted to strengthen their financial management systems from 2009 to 2013.
The Current State of Financial Management Good financial management is not easily achieved in organizations that often have grown or-ganically out of community need, funders’ compassion, and the passion and good ideas of peo-ple committed to bettering young people’s lives. Indeed, weakness in financial management is pervasive across the nonprofit sector. The following problems were common among participat-ing organizations at the beginning of the current study:
• Staff members with less than optimal financial management skills, un-derstaffed financial departments, and underdeveloped information technology (IT) systems created inefficiencies in routine tasks. Staff mem-bers in organizations’ financial departments often operated in crisis mode or were absorbed with daily tasks such as paying bills and responding to funder
1Though many organizations use the term “capacity,” this report uses the term “capability” throughout.
ES-2
requests, leaving long-term financial planning functions underdeveloped. This could potentially have serious consequences for organizational sustain-ability and efficiency.
• A lack of transparency regarding organizations’ financial positions, and an absence of useful forecasts, meant leaders often could not make informed choices about program and organizational needs.
• Incomplete understanding of the true costs of program delivery, includ-ing the support functions necessary for high-quality programs, left those pro-grams chronically underfunded.
• Organizations’ financial staff members operated in isolation, with few connections to staff members who understood the resources needed to sup-port and strengthen programs and who knew how to respond effectively to weaknesses.
The challenges that arise as a result of poor internal financial practices are exacerbated by certain funder practices. Funders place limits on allowable overhead that are often insuffi-cient for organizations to manage programs well. Funding is often insecure, obtained through short-term contracts. And payments for contracted services may be late — sometimes many months late.
The Wallace Foundation Initiative to Strengthen Financial Management in Nonprofit Organizations Recognizing these challenges, the Wallace Foundation — which has a long-standing commit-ment to improving the quality of services for young people — set up the Strengthening Finan-cial Management in Out-of-School Time (SFM) project. The aim was to equip organizations with the ability to plan and manage their financial resources and increase their potential to de-liver high-quality services, and at the same time to record lessons from the experience to aid the many organizations that face similar challenges. The foundation took a three-pronged approach:
1. Directly build the financial management capabilities of organizations serving young people.
2. Work with funders and policymakers to reform practices that strain the abil-ity of organizations to manage their resources well.
3. Fund research into the project and inform a wide audience about the effects of this approach (or lack thereof).
ES-3
Staff members from 25 organizations that provided a variety of out-of-school-time pro-grams for Chicago young people participated in the initiative.2 Their budgets ranged from $800,000 to $36 million, although most had budgets of $3 million to $8 million at the initia-tive’s beginning. All fell short on some or many aspects of financial management.
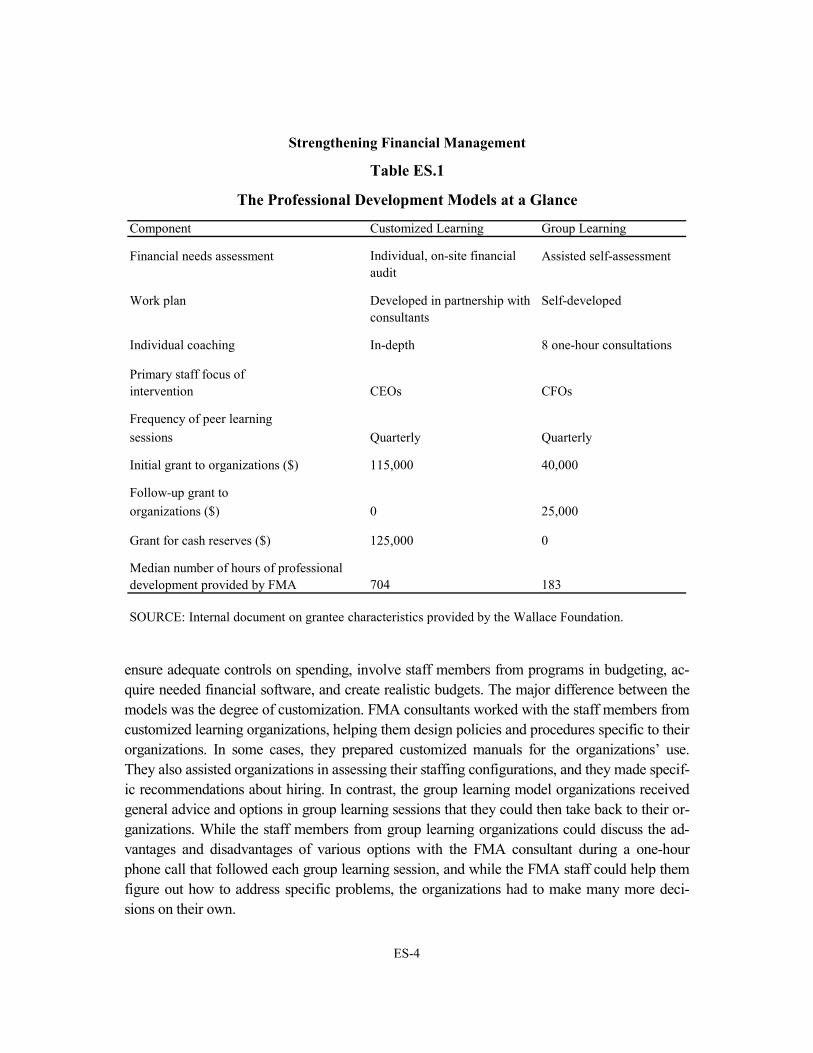
The 25 organizations were divided into two groups based on the Wallace Foundation’s assessment of the level of intervention they could undertake. From 2009 to 2013, Fiscal Man-agement Associates (FMA), a consulting firm that works with nonprofit organizations and foundations to strengthen financial practices, provided all of the organizations with access to peer networking opportunities, and provided each of the two groups with one of two models of consulting and training. The two models varied in the amount and type of professional devel-opment assistance offered to the organizations involved. This report refers to the more intensive intervention as the “customized learning plus group learning” model (or “customized learning,” for short), and refers to the other intervention as the “group learning” model. See Table ES.1 for a brief description of the models. Many of the activities involved the participating organiza-tions’ senior leaders, particularly the chief executive officers and chief financial officers (CEOs and CFOs), although other fiscal and program staff members participated when appropriate. Importantly, the professional development support provided mostly occurred during the first two years of the initiative. In addition to paying for that support the Wallace Foundation provid-ed grants to the organizations to enable them to undertake the work, and the amount and timing of those grants also differed between the two groups of organizations.
FMA made a number of assumptions about what financially stable organizations re-quire: First, organizations need to understand their financial positions on an ongoing basis, as efficiently as possible. Good financial software makes that possible. Second, having well-specified internal financial procedures ensures that all parties know what they need to do and when, with minimal redundancy. Third, in order to develop accurate, realistic budgets, an or-ganization must calculate not only the costs directly linked to the delivery of program services (such as equipment and program staff salaries) but also the overhead costs of running the organ-ization itself. Lastly, to make appropriate financial decisions, organizational leaders need infor-mation not only from financial staff members but also from program managers and others. Pro-gram managers are likely to know how and when to spend resources to maximize a program’s effect, and if cuts need to be made, they are likely to know which will be the least damaging.
FMA designed its group learning sessions around these assumptions, providing guid-ance on how organizations could make their financial procedures more rigorous and systematic,
2Twenty-six organizations were initially selected to participate in the initiative, but one dropped out short-
ly after selection and was therefore excluded from the evaluation. Another closed due to financial problems in the initiative’s penultimate year.
ES-4
ensure adequate controls on spending, involve staff members from programs in budgeting, ac-quire needed financial software, and create realistic budgets. The major difference between the models was the degree of customization. FMA consultants worked with the staff members from customized learning organizations, helping them design policies and procedures specific to their organizations. In some cases, they prepared customized manuals for the organizations’ use. They also assisted organizations in assessing their staffing configurations, and they made specif-ic recommendations about hiring. In contrast, the group learning model organizations received general advice and options in group learning sessions that they could then take back to their or-ganizations. While the staff members from group learning organizations could discuss the ad-vantages and disadvantages of various options with the FMA consultant during a one-hour phone call that followed each group learning session, and while the FMA staff could help them figure out how to address specific problems, the organizations had to make many more deci-sions on their own.
Component Customized Learning Group Learning
Financial needs assessment Individual, on-site financial Assisted self-assessment audit
Work plan Developed in partnership with consultants
Self-developed
Individual coaching In-depth 8 one-hour consultations
Primary staff focus ofintervention CEOs CFOs
Frequency of peer learningsessions Quarterly Quarterly
Initial grant to organizations ($) 115,000 40,000
Follow-up grant toorganizations ($) 0 25,000
Grant for cash reserves ($) 125,000 0
Median number of hours of professionaldevelopment provided by FMA 704 183
Strengthening Financial Management
Table ES.1
The Professional Development Models at a Glance
SOURCE: Internal document on grantee characteristics provided by the Wallace Foundation.

ES-5
For the second prong of the initiative (the one focused on reforming funding practices), a Chicago-based organization, the Donors Forum, was selected to work with funders, state and city policymakers and officials, and organizations serving young people. Its aim was to identify barriers to effective financial management and set priorities among them, develop principles to guide decisions, develop and implement practical solutions to improve the way funders manage contracts, and build momentum for wider reforms in Illinois.
The Study and This Report As the third prong of the initiative, the Wallace Foundation commissioned an independent eval-uation of the extent to which the initiative achieved its intended results, and at what cost of money and effort. The foundation was committed to informing a wide audience about whether and how results were achieved, what challenges were encountered, and whether and how the challenges were overcome.3 It also sought to inform a wide audience about the Donors Forum’s efforts to improve the funding environment. To address these issues, the four-year study relied on information from interviews with CEOs and CFOs, conducted every 9 to 12 months for four years; annual visits to a selection of the organizations; and document reviews.
This report presents findings that should be of interest to practitioners, funders, policy-makers, and the public. It examines the following questions: What forms of support do organi-zations need to strengthen their ability to manage their resources? What type of time commit-ment does this require from the organization itself? From consultants? What types of changes need to be made to funder practices, and how might those changes be achieved? When those changes have been achieved, how effective have they been? What lessons can the evaluation offer those who seek to strengthen the financial management of nonprofit organizations?4
Summary of Findings About the Professional and Organizational Development Models
• The financial management practices of nearly all of the participating or-ganizations improved over the course of the initiative.
3The Wallace Foundation initially awarded the evaluation to Public/Private Ventures. When Public/Private
Ventures closed its doors in mid-2012 due to financial problems, MDRC and Child Trends stepped in to com-plete the evaluation.
4In 2012, Public/Private Ventures published an early report on the progress of the initiative that presents an overview of the participating organizations and their financial management challenges, along with a summary of good financial management practices and early lessons from the first year of the initiative. See Kotloff, Lau-ren, with Nancy Burd, Building Stronger Nonprofits Through Better Financial Management: Early Efforts in 26 Youth-Serving Organizations (Philadelphia, PA: Public/Private Ventures, 2012).
ES-6
Of the 25 participating organizations, all but 2 strengthened their financial practices in at least some areas, and improvements persisted beyond the first two years of intensive profes-sional development. Meaningful changes were seen in a range of areas: improved financial skills; better — and better-used — computer systems; more useful internal financial reports and procedures; and more — and more effective — collaboration across program and financial divi-sions, which strengthened organizations’ ability to create good budgets and monitor them effec-tively. Overall, organizations improved the quality of their financial decision making.
Nearly half of the organizations that received customized learning and nearly half of those that primarily received group learning improved in 80 percent or more of the areas in which they had been weak at the start of the initiative.
• According to organizations’ leaders and senior staff members, better fi-nancial practices led to better program planning and management, and to improved organizational stability.
Executives and senior staff members reported a range of benefits from better financial management that directly affected their ability to pay for and deliver high quality services. For example, a better understanding of programs’ real costs, combined with improved decision-making processes, better equipped organizations to evaluate funding opportunities, rejecting those that did not fully cover programs’ true costs. Organizations were also better able to plan their program spending. Many organizations have predictable cash-flow cycles over the year, and having staff members from across an organization understand those cycles helped the or-ganization better manage its cash flow. Executives also reported that as a result of improved financial management, their organizations were better able to respond to external financial pres-sures such as funding cuts or late payments, leaving them more stable in the long run. With one exception, SFM organizations weathered the Great Recession that began in 2008.
• Multiyear professional and organizational support — combined with funding to purchase new financial software and to defray some of the cost of staff time — helped organizations achieve long-lasting change.
It typically took two to four years for the organizations in SFM to lay the foundations for and build a new way to do business. Two years of involvement by expert financial manage-ment consultants enabled organizations to diagnose areas of need, develop work plans with ranked priorities, train staff members in good financial management practices, and implement their work plans. The median organization in the “customized learning” group received 704 hours of assistance from FMA, while the median organization in the “group learning” group received 183 hours. For both groups more than 90 percent of FMA’s support was provided in the initiative’s first two years.
ES-7
This type of deep change required organizations to expend significant staff time (typical-ly 800 to 1,000 hours over the course of the four years) and money ($30,000 to $60,000). The money was used to recruit new financial staff members, buy software, and pay for associated training. Taking into account the value of staff time, the full cost to each organization is estimat-ed at $70,000 to $110,000. The unrestricted grants from the Wallace Foundation — $115,000 for customized learning organizations and $65,000 for the group learning organizations — enabled organizations to make the investments required to improve their financial management.
• To succeed in achieving the aims of SFM, an organization’s leaders needed to be motivated to change from the outset.
When CEOs reported at the beginning of the initiative that they were strongly motivated to participate in SFM because it aligned with their organizations’ needs and plans, their organiza-tions made significant progress in all aspects of financial management. The reverse was true for organizations where strengthening financial management had not previously been part of their plans. Sustaining an organizational change initiative like SFM beyond an initial burst is not easy, and leadership quality — the ability to communicate the change, execute it, and adapt to emerg-ing circumstances — was critically important for achieving rapid, deep, and long-lasting im-provements. Ironically, the initiative’s goal may have been helped by the harsh economic cli-mate, which reinforced the need for better financial practices. Thus, despite the recession’s ad-verse effects on organizations’ finances, it may have helped sustain the initiative’s momentum.
• The financial practices of organizations receiving the group learning model of support significantly improved, though more slowly and not quite as much as those receiving the customized learning model, indicat-ing that this less expensive approach was cost-effective.
The customized learning organizations made slightly more progress than the group learning organizations, but the gains for the group learning organizations were still impressive, and those organizations received approximately a quarter of the consulting help and half the grant funds. While the financial practices of the customized learning organizations typically changed within two years, the group learning organizations took three or four years to achieve a similar level of change. This slower pace of change might have been in part because group learning organizations received their grant money in two payments, one at the beginning of the project and the second two years later. Organizations in the customized learning group received their grants at the start, which allowed them to make investments in financial staff members and software sooner.
ES-8
Summary of Findings About the Policy Work • The second prong of the initiative, aimed at influencing funding prac-
tices, made some progress, but was slow to achieve results.
The Donors Forum was successful in convening key stakeholders in Illinois; identifying major challenges facing the state’s nonprofit organizations and setting priorities among them; and developing principles for moving forward. The initiative made significant progress toward streamlining contracting procedures, working closely with stakeholders to develop solutions. Along with major nonprofit organizations in Illinois, the Donors Forum supported legislation that would streamline human services contracting. It then went further by providing staff sup-port to an interagency committee charged with putting the legislation into practice. As a result, the state created a cross-agency reporting database. Where previously organizations had to pro-vide the same information (such as audits or letters demonstrating nonprofit status) to multiple agencies when submitting proposals, now they only had to provide that information once. How-ever, organizations did not see this as a significant enough change, for two major reasons. First, the reforms only touched one set of funders — four Illinois State human services agencies — and the organizations still had many other funders with their own reporting requirements. Sec-ond, the more serious problem facing organizations with state contracts was late state payments, and little progress had been made on that issue at the time this report was written.
• The most pressing funding problem facing the SFM organizations over the course of the project was late state payments. The Great Recession resulted in payments that were delayed by up to six months, and little could be done to speed them up.
Although the Donors Forum recognized the challenges that late payments presented to grantees, it was unable to address the issue. Illinois, which had been accruing debt over a num-ber of years and which had large unfunded pensions, was in dire financial straits. One of the ways it juggled its finances was by delaying payments. In Fiscal Year 2011 the state legislature lengthened the time the state could take to pay its invoices, further exacerbating the problem.
Implications The Wallace Foundation’s initiative casts light on the financial practices of organizations and on what can be done to improve them. If 25 well-established and respected Chicago organizations were struggling with financial management, it is highly likely that many more organizations across the country face similar challenges. Encouragingly, the initiative demonstrated that with a concerted effort it is possible to achieve significant and lasting improvements in financial management. Together with improvements in funding practices, these have the potential to
ES-9
strengthen program quality by permitting organizations to focus on programs instead of manag-ing financial crises.
Implications for Funders and Consultants Who Support Organizational Development
• Widespread weaknesses in organizations’ financial management can have negative effects on their stability, planning, and programs. Good financial management is an important factor in facilitating and sustain-ing long-term improvements in program quality. The organizations in-volved in the initiative all had strong reputations for providing high-quality programs, but it was clear that internal financial weaknesses plagued most. Opaque budgeting practices that did not include program managers left pro-gram staff members ignorant of their budgets, leading to over- or under-spending. Organizations that did not understand how to allocate overhead costs accurately across programs faced budget shortfalls that affected pro-gram stability. Inefficiencies in financial procedures took up a lot of time for staff members already stretched thin. This initiative suggests that efforts to create change in financial management can be effective in achieving lasting organizational improvements. Improved program quality is not guaranteed when financial practices are strong, since high-quality programs require other important forms of support, such as good planning, reliance on evidence, high-quality program staff members, high-quality staff training, and activities that engage participants. But financial management provides critically im-portant support.
• In order to create lasting changes in their core administrative infra-structures, organizations need to work consistently for several years on strengthening their financial management. Many initiatives to build or-ganizational capabilities last only a short while, and there is little evidence that they work. It is important that organizations know how to change, but it is not sufficient; organizations also need time and resources. In SFM, chang-ing organizations’ financial management required changes in software, writ-ten manuals, and organizational practices, and each of these changes took time and money. Given that many of the changes were interrelated, it is un-likely that lasting improvement could be achieved in substantially less time.
• Change in financial management requires widespread organizational change. It is important to emphasize that the changes under SFM occurred because the initiative addressed multiple aspects of organizations’ financial
ES-10
practices and multiple senior staff members. The effort focused on training senior leaders, including organizations’ CEOs and CFOs, rather than only training more junior staff members. Organizational leaders were expected to support the effort, and the evidence shows that when they were motivated to do so, their organizations made more changes to their financial management that affected more areas: staffing structure, staff members’ skills, accounting IT systems, the quality of financial reports, and internal decision-making processes. Not every organization needed to change in every area, but many needed changes in most areas related to financial management.
• Unrestricted funding made possible the necessary investments of time and capital. The amount of money required to create lasting change in an organization depends on the organization’s size and needs. In this initiative, the Wallace Foundation’s investments of $65,000 to $115,000 in direct grants covered staff time, software, and training. These costs will vary from place to place, since salaries vary across the country.
• The group learning model was a cost-effective method of improving fi-nancial practices. The grants provided to the group learning organizations totaled a little more than 55 percent of those provided to the customized learning organizations, and the former group received only about a quarter of the hours of assistance received by the latter. While the customized learning organizations demonstrated slightly larger changes, the group learning organ-izations also substantially improved. Achieving larger change faster is desir-able, but it is possible to achieve meaningful change at a lower cost.
Implications for Organizations
• Organizations interested in undertaking efforts to improve their finan-cial practices should be prepared to spend between 800 and 1,000 staff hours on the work over two to three years. Organizations involved in the initiative spent significant amounts of time on activities designed to strength-en their financial management, spread across multiple staff members.
• An organization’s top leader and its top financial manager must be in-volved in this work. Without the motivation and commitment of the organi-zation’s top leaders, changes are hard to achieve. An organization’s CEO must have a basic understanding of good financial management practices and the risks that organizations face if practices are lax. The CEO also needs to communicate the importance of the work, to maintain staff interest and commitment. And finally, it is the CEO who has the ability to oversee

ES-11
changes in staffing to ensure that good practices are adopted and that pro-gram and financial staff members work together. The CFO must also be in-volved in communicating the importance of the work to financial staff mem-bers, in ensuring that staff members get the training they need, and in over-seeing necessary changes to software and policies.
• Changes in software and manuals help sustain organizational change. One of the challenges in helping organizations build their capabilities is sus-taining those changes over time. In SFM, changes were made to manuals and software. Once such changes were made, staff members were trained in the changes and managers worked to ensure that they were adopted. The fact that the new procedures were built into software and written into manuals helped to sustain them over time. It appears to be especially challenging for organi-zations to maintain increased communication between financial and program staff members, so that change in particular should be written into organiza-tions’ policies-and-procedures manuals.
Policy Change: Supporting Changes in Practices for Public Funders Influencing funder practices appeared to be an attractive route for reform, as such changes should logically benefit many organizations at once. However, the SFM initiative’s experience revealed several limitations to the approach. First, in order for new procedures to generate tangible benefits, organizations and funders must learn and use them. Second, changes must affect a substantial portion of organizations’ funding to be valuable to them. From an or-ganization’s perspective, is not enough to influence a single funder, particularly if that funder is not the organization’s major source of support. Third, as is often the case with advocacy, change is slow to materialize. For these reasons, those seeking quick results in the financial manage-ment arena may find it more effective to focus on building organizations’ ability to manage their finances, helping them to withstand adverse funding practices. And in fact the SFM initia-tive demonstrated a feasible way to do this, albeit a labor-intensive one.
Nonetheless, there is a limit to how much an effectively managed organization can im-prove its financial stability, given the existing funding environment. Thus it is valuable to pur-sue changes in funder practices alongside direct capability building, even though achieving such change will be a long-term endeavor requiring significant resources. The following sequence of steps worked well for the Donors Forum in its efforts to improve contracting practices in Illi-nois:
ES-12
1. Convene key stakeholders, including organizations, multiple funding constit-uencies, politicians, and agency officials.
2. Define the problem, garner support for change, and define common princi-ples of good practice.
3. Decide where to focus attention (for example, on specific issues or on types of funders), depending on what types of changes would benefit organizations most and on where change can be achieved.
4. Provide concrete solutions that respond to funders’ needs.
5. When new legislation passes, provide support to help public agencies devel-op concrete plans to implement it.
While working in this way is useful, it may not lead to change in the highest-priority ar-eas. Policy advocates need to find opportunities where change can be achieved.
Final Thoughts Today organizations have to achieve more for less. Funders increasingly demand results but are not always prepared to cover the attendant core organizational costs. Given this climate, the Strengthening Financial Management initiative provides powerful and very encouraging evi-dence for organizations and funders alike. Organizations can strengthen their financial practices if they put in the time and make the needed investments. Funders who want to build the core capabilities of an organization or sector now have a blueprint for effective work.
1
Chapter 1
Introduction
Nonprofit organizations are critical providers of human services in the United States. Too often, however, they lack the financial management knowledge and skills to sustain the administrative infrastructures that support their missions and programs. Strong financial management makes it possible for organizations to hire and retain talented staff members, identify and garner the re-sources necessary to operate programs, and plan for program improvement. While strong finan-cial management does not by itself ensure that programs will be strong, it is a necessary compo-nent of a well-run organization.
To learn more about how to strengthen nonprofit organizations’ ability to deliver high-quality human services in the long term, the Wallace Foundation funded a three-pronged initia-tive called Strengthening Financial Management in Out-of-School Time (SFM) between 2009 and 2013. One prong aimed to strengthen the financial management capabilities of organiza-tions serving young people by providing professional and organizational development opportu-nities to selected organizations’ leaders, along with grant money to support the organizations’ efforts.1 The second prong aimed to improve funder practices to make them less burdensome to nonprofit organizations. The third supported research into the project and aimed to inform a wide audience about the effects of this approach (or lack thereof).
The initiative was premised on two assumptions. The first was that several years of pro-fessional development in financial management would lead to stronger financial practices. The second was that organizations with stronger financial practices would be able to strengthen their youth programs.
To examine these assumptions, a financial management consulting firm and an evalua-tor were engaged, and 25 Chicago nonprofit organizations received one of two forms of profes-sional development and technical assistance.2 Leaders in one group of organizations received two years of quarterly peer learning sessions followed by three workshops over the following two years. Leaders in the other group received individual financial management coaching and peer learning sessions in the first two years followed by three peer learning workshops over the following two years. In total, all organizations received four years of support.
1Though many organizations use the term “capacity,” this report uses the term “capability” throughout. 2Twenty-six organizations were selected to participate in the initiative, but one dropped out shortly after
selection and is therefore not included in the evaluation. Another closed due to financial distress late in the ini-tiative, and information from that organization is included in the evaluation whenever possible.
2
In addition, a Chicago-based organization was engaged to help reform funder practices. This second prong of the initiative assumed that funding requirements placed unnecessary bur-dens on nonprofit managers, and that by working together, funders and nonprofit organizations could design strategies to relieve nonprofits of those unnecessary burdens while making nonprof-its and government entities more accountable to one another for serving vulnerable populations. This effort focused primarily on identifying practices that needed to be changed, convening groups of policymakers and nonprofit organizations to discuss priorities, and providing staff sup-port to state-mandated commissions and working groups to streamline contracting in Illinois.
Unfortunately, the Great Recession of 2008 sent the State of Illinois into a severe finan-cial crisis, resulting in reduced funding for human services and delayed payments to nonprofit contractors. These funding cuts and payment delays were crippling to the nonprofit sector at a time when the demand for services was rising. In a 2009 survey of nonprofit organizations, Illi-nois led the nation in the proportion of organizations reporting that late payments were a prob-lem — 83 percent.3
The recession had a substantial impact on the SFM initiative. Instead of working to im-prove their financial practices in order to improve their programs, many of the nonprofit organi-zations in the initiative found themselves struggling to survive, even if they had entered the Great Recession in good financial shape. The professional development that organizations re-ceived from the initiative reflected these challenges, and included support to help them increase their lines of credit, so they could manage their finances when state reimbursements for services were late — often as many as four to six months late. In the report that follows, therefore, find-ings focus on issues that related to organizational survival.
The study found that organizations that invested a substantial number of hours trying to improve their financial management practices did improve meaningfully by the end of their four-year involvement in the initiative. The organizations that received individual coaching plus group learning saw significant improvements in the first two years but little additional im-provement in the second two years. The organizations that received group learning sessions but not individual coaching also saw significant improvements, but only after the first two years of involvement in the initiative. By the end of four years, however, their outcomes were similar, meaning that this less intensive professional development model appears to be a viable strategy, despite the lower level of investment involved. However, even the less intensive model required a long-term commitment.
The second prong of the SFM initiative — improving public funder practices — did not achieve results as quickly. By the end of the initiative promising steps had been taken, but con-
3Boris, de Leon, Roeger, and Nikolova (2009).
3
siderable work remained and work to change some practices was never started. These results raise significant questions about whether or not it will be possible to achieve policy change.
The chapters in this report that follow describe the initiative and its evaluation findings in more detail. The remainder of this chapter explains some of the reasons financial manage-ment matters.
The Consequences of Poor Nonprofit Financial Management Hull House, founded in 1889 by Jane Addams, was one of the first settlement houses in the United States. The organization helped shape social services across the United States — not just in Chicago, where it created the first public playground, gymnasium, and swimming pool. It led investigations into sanitation, truancy, tuberculosis, and infant mortality, among other problems, and prompted changes in laws and public programs.4
In recent years, the organization provided child and youth development services, foster care, domestic violence counseling, and other services to approximately 60,000 people, of whom approximately 60 percent were children and young people.5 Lizzie Harrington, for ex-ample, received help from Hull House when she was a teenager in foster care. She later became a project director for an employment program run by Hull House that helped low-income peo-ple find jobs.6
On January 27, 2012, Hull House closed its doors for good because it could no longer pay its bills and was millions of dollars in debt. Three hundred employees lost their jobs, and as many as 9,000 children and their families lost services.
“It’s unfortunate, and it’s been emotional,” Harrington said. “I have a special connection to this place. This was part of my childhood.”7
The Great Recession of 2008 may have exacerbated the organization’s financial ills, but its financial position going into the recession was weak. The organization was $2.3 million in debt in 2007, according to its 990 form.8 By the time it closed in early 2012, its debt was over $3 million and the organization’s funding outlook was grim. Eighty-five percent of its funding came from government sources at a time when government spending was decreasing and states
4Cohen (2012). 5Thayer (2012); Knight (2012). 6Webber (2012). 7Webber (2012). 8A 990 form is a tax form that nonprofit and other tax-exempt organizations must file with the Internal
Revenue Service.
4
— especially Illinois — were running behind in their payments to nonprofit organizations for the human services they had already provided.9
Hull House is emblematic of what can happen to services when an organization’s fi-nancial position is tenuous, and its management does not take the steps needed to correct the problems.
During the same period that Hull House was failing financially, smaller and less experi-enced nonprofit organizations also closed their doors. The executive director of a small Chicago nonprofit that participated in the SFM initiative described some of the details of her organiza-tion’s failure. Among the problems she faced when she arrived at the organization was an ab-sence of cash-flow projections and a lack of financial staff members able to provide an accurate account of the organization’s financial conditions. In addition, the overhead rate set by the organ-ization was too low to cover its actual costs. As a result, the staff had used assets restricted to par-ticular programs to sustain other programs, and the organization could not repay those funds or deliver the services the funds were intended to support. The organization found itself with defi-cits that could not be covered. The newly hired executive director worked for months to under-stand the organization’s finances, ultimately telling her board that the financial situation was dire.
Less than a month later the organization, which had served over 2,000 adolescents an-nually in after-school and summer programs, closed its doors. Afterward, the executive director provided a wrenching account of the problems:
The hardest hit was recognizing what was already spent that we shouldn’t have. That was the true crisis.... We needed to raise money to get us out of debt, and the number continued to grow as we combed through each of the contracts.... Some of our grants had overhead expenses, but nothing near to cover what we needed....
[When] I presented [the information] to the board along with different scenarios, the board voted that we had to suspend all operations. We worked to transfer our programs to other organizations to keep programs in the community. Some pro-grams didn’t transfer because there was no money to go with [them].
Even if organizations do not close their doors, financial weaknesses can threaten their sustainability. This can be a particular problem in organizations in which the chief executive officer (CEO) lacks financial savvy. One of the organizations described later in this report serves 225 low-income adolescents each year, including older adolescents, a particularly hard-to-reach group. The pride of the local community, the young people in the organization partici-pate in performing arts competitions and parades under the guidance of the charismatic execu-tive director. The level of commitment many young people have to the organization is impres-
9Cohen (2012).
5
sive, and it shows in their performances. Despite these strengths, the organization’s financial management was rudimentary at the start of SFM. According to staff members, the organization ran budget deficits every year, did not monitor spending, had no written accounting procedures, and did not have a realistic idea of its budgetary needs. There was also tension between the ex-ecutive director and the accountant, who tried to institute some basic procedures, as the execu-tive director described in an interview during the study:
We would have a lot of disagreements between the accountant and myself and the staff because we just didn’t know — we just thought it was the accountant saying, “No, you can’t do that....” Most people [in this organization] thought the accountant was the meanest person in the world — and I was the same way — “Why can’t we do it, [we’ve] got the money.” And she said, “If you have money earmarked for something, you have to spend it on that.”
This organization’s financial practices put its existence at risk. Although today it re-mains a very small organization with limited financial capabilities, its financial practices im-proved over the course of the SFM initiative, and it made tremendous strides in setting up poli-cies and procedures that the staff followed.
Even if they do not result in closure, poor financial management practices can result in furloughs, layoffs, work stoppages, and decreases in the number of people programs can serve. One organization in this study had had both layoffs and work stoppages in the 18 months previ-ous to participating in SFM, and a program manager ascribed them to managers’ lack of knowledge about available resources. Because the organization operated on a tight budget, she said, managers needed to be very knowledgeable about finances.
Unfortunately these stories do not describe rare events. Many nonprofit organizations have weak financial management practices. They are run by individuals passionate about the organizations’ missions who may lack the financial skills necessary to support the missions. CEOs who lack a full appreciation of the need for strong financial management are unable to assess their organizations’ needs for financial management skills, software, and procedures.
External Funding and Policy Realities Pose Barriers to Nonprofit Organizations’ Stability and Programs In addition to internal financial management challenges, funder practices that are outside of nonprofit organizations’ control can also pose significant challenges. Unexpected changes in funder practices can threaten organizations’ budgets. When asked why the organization had un-expectedly found itself in a financial crisis, one chief financial officer (CFO) said:
It was due to sudden changes in government funding. At the last minute, a cou-ple of our major contracts changed the rules on how they would pay, resulting
6
in decreased funding and increased costs. For example, they changed require-ments for teaching staff and we had to hire more teachers.... Also, if you aren’t fully enrolled, they will cut funding. They didn’t do that in the past. It costs us lots of money.
This CFO was referring to contract payments that are based on the number of children and young people an organization actually served. On the face of it, these payments make sense. Why should government agencies and charitable organizations pay when programs do not serve the number of young people and children they originally projected?
The reality is more complicated. Nonprofit organizations have both fixed and variable costs. Fixed costs often include the cost of the space in which programs are housed. Variable costs may include the costs of materials and staff members needed to serve a certain number of young people. When funders make payments based on the number of children and young peo-ple actually served, they assume that all the costs necessary to serve each client are variable. But organizations spread fixed costs across their clients. If they are not paid for serving clients they expected to serve, then they must determine how to spread their fixed costs across fewer clients.
Many might argue that organizations should be able to predict how many people they can serve, and how often. And organizations with strong financial and program management do understand not only their client costs but also how their client population is likely to behave. They use their knowledge about past client characteristics, program enrollment, participation, and outcomes in planning their budgets.
But even the best-managed nonprofit organizations can run into trouble. Nonprofit or-ganizations that serve low-income populations do not have perfect knowledge about how those populations will behave: Changes in economic conditions — both good and bad — can change clients’ behavior. Organizations may also run into trouble due to funder factors that they cannot predict or plan for. And funders often place severe restrictions on administrative costs. One study found that, nationally, about two-thirds of nonprofit organizations reported that allowable overhead rates do not cover the administrative costs necessary for running their organizations. In Illinois, the figure was four-fifths.10
Funders may also delay payments, which can lead to uncertainty, staff layoffs, and re-hiring, creating instability for staff members and the young people who rely on them. Through-out this report, which focuses on the 25 Chicago-area nonprofit organizations involved in the SFM initiative, the reader will see that late payments were a profound challenge for those that relied on Illinois state contracts to fund their services. The Great Recession made the endemic weaknesses in nonprofit financial management far more apparent and made ameliorating them far more urgent.
10Boris, de Leon, Roeger, and Nikolova (2009).

7
Report Structure This report examines four major questions related to the initiative’s efforts:
• Can providing professional development and technical assistance to a non-profit organization’s executive director or lead financial officer improve the skills and financial procedures of that organization over a four-year period?
• Did the two professional development models result in different outcomes?
• What does it cost to strengthen the financial practices of nonprofit organiza-tions, in terms of both the professional development offered and the staff time and other resources necessary to make changes?
• How can funder practices be modified to better support nonprofit organiza-tions?
Chapter 2 describes the SFM initiative’s theory of change, its strategies, and the organi-zations selected to take part in it. Chapter 3 examines how the organizations changed during the four-year study period. It also describes the benefits that staff members from those organiza-tions ascribed to the changes. The chapter pays close attention to how change varied depending on the model of professional development that organizations received. Additionally, Chapter 3 addresses the question of whether or not changes in financial management appeared to contrib-ute to changes in program quality.
Chapter 4 examines how the economic context, the characteristics of the organizations, and the model of professional development they received influenced the pace of organizations’ progress. Chapter 5 examines the costs of the professional and organizational development prong of the initiative. These costs included unrestricted grants to the organizations, the cost of professional development provided by coaches and consultants, and the labor and other costs incurred by the organizations as they completed their work on the initiative.
Chapter 6 addresses the efforts made to improve the policy environment for nonprofit organizations. Chapter 7 provides overall conclusions.

9
Chapter 2
The Initiative and the Study Organizations
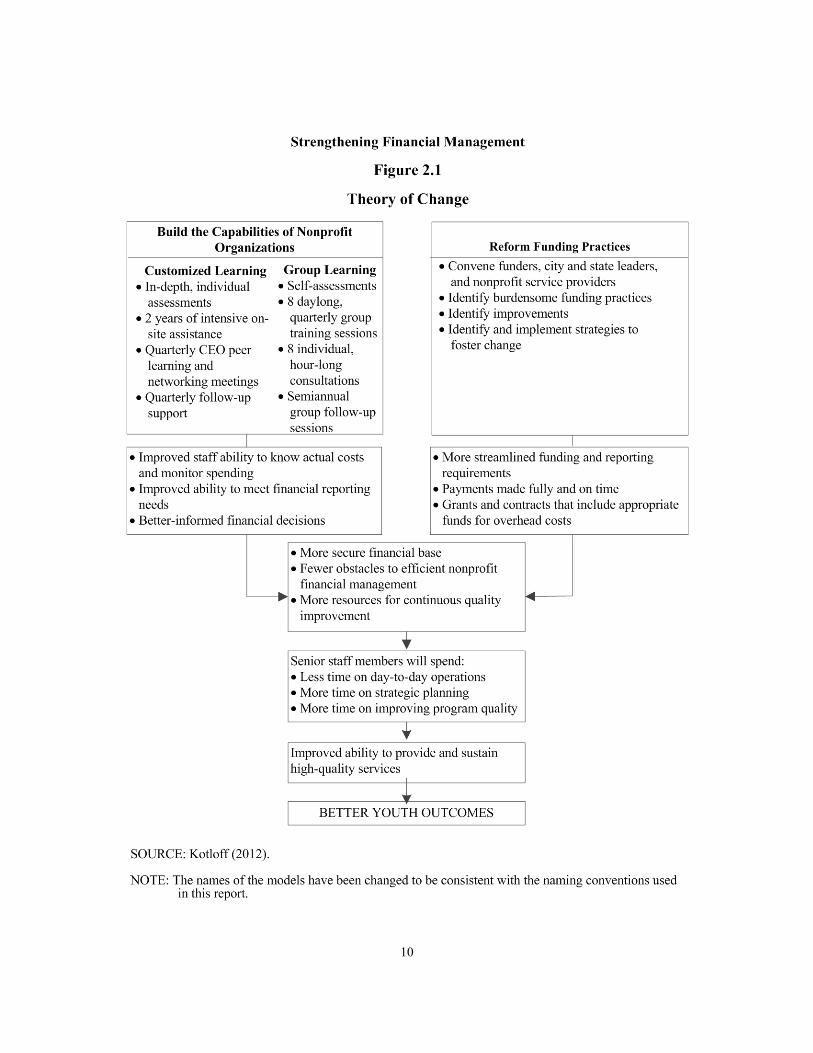
Nonprofit organizations struggle both with gaps in internal management skills and infrastructure and with external funding realities; the Strengthening Financial Management (SFM) initiative therefore targeted both of these crucial areas. The initiative’s theory of change, shown in Figure 2.1, proposed two major pathways for change that generally operated independently of each other. On the left are changes expected as a result of the professional development efforts and on the right are the changes expected as a result of efforts to change funders’ practices.
The professional development pathway focused on a relatively small group of 25 Chi-cago organizations, each of which had at least one after-school program that served children and young people. As part of this pathway, the SFM initiative sought to foster changes in organiza-tions’ financial departments that included more informed financial decision making due to bet-ter reporting, and organizational practices that included program and financial staff members in financial decisions (Fiscal Management Associates called this “team decision making”). These changes, in turn, were expected to improve organizations’ financial stability and free up their staff members to think about program delivery and quality improvement.
The other pathway assumed that nonprofit organizations could not solve all their finan-cial ills on their own because some were generated by funder practices. This effort therefore focused on changing policy, especially public funding policy. It advocated for all nonprofit hu-man service organizations in Illinois, and therefore had the potential to improve conditions for many Illinois nonprofits, including the 25 selected for professional development.
The Initiative’s First Pathway: Goals of the Professional Development Effort The intention of the professional development pathway was to improve program quality by im-proving the skills and practices of organizations’ financial and executive staffs. Good financial management is necessary for delivering effective youth interventions. First, it enables organiza-tions to plan strategically: A clear understanding of the resources needed to serve program par-ticipants well guides fund-raising efforts. It also provides information on the types of invest-ments in an organization’s core capabilities — management, support functions, and infrastruc-ture — that need to be made to sustain program quality.
Second, good financial management means organizations can deploy their resources thoughtfully. It enables them to predict the impact of changing circumstances, such as funding delays or shortfalls, and respond to them while managing their effect on program quality. The
10
11
benefits of good financial management are not limited to efficiency and sustainability — im-portant as those are. Organizations that manage their finances well can more effectively raise and deploy resources to achieve results for their clients.
Finally, good financial management can help organizations avoid layoffs of staff mem-bers who work with young people. In general, layoffs can cause instability in organizations. But laying off after-school staff members is particularly problematic: After-school programs often work because young people and adults form stable relationships that provide young people with essential developmental support, and layoffs disrupt those relationships.
Fiscal Management Associates (FMA), the firm that helped organizations build their professional and organizational capabilities, developed and tested two training models that var-ied in intensity and in the balance between individual and group-based training. Both were in-tended to improve a range of financial capabilities that together enable organizations to plan and monitor budgets that support high-quality program delivery.
At the outset, SFM organizations were assigned to one of two groups based on criteria described in more detail below. The first group of 11 organizations received the “group learn-ing” model; the remaining group of 14 received the “customized learning plus group learning” model (or “customized learning” for short).
The Customized Learning Plus Group Learning Model
Over the first two years, the 14 organizations participating in the customized learning model received individual assistance and professional development support from FMA that in-cluded an initial in-depth assessment of an organization’s financial management systems: its financial planning and monitoring, software use, and staffing configuration. Using the assess-ment FMA worked with each organization to create a work plan, and for the next two years FMA provided intensive on-site consulting and training to executive staff members to support the implementation of that work plan. For the two years after that, FMA provided quarterly peer learning and networking meetings for chief executive officers (CEOs) and follow-up support. The median cost of the professional development provided to organizations in the customized learning group was $133,000, and each organization received a $115,000 grant from the Wal-lace Foundation. As an incentive, each organization that completed its work plan (and all did) received a $125,000 cash reserve grant (see Table 2.1). The reserve was intended to support an organization’s short-term needs for cash; the organization was expected to repay the money to its reserve fund when the need for cash passed.
12
The Group Learning Model
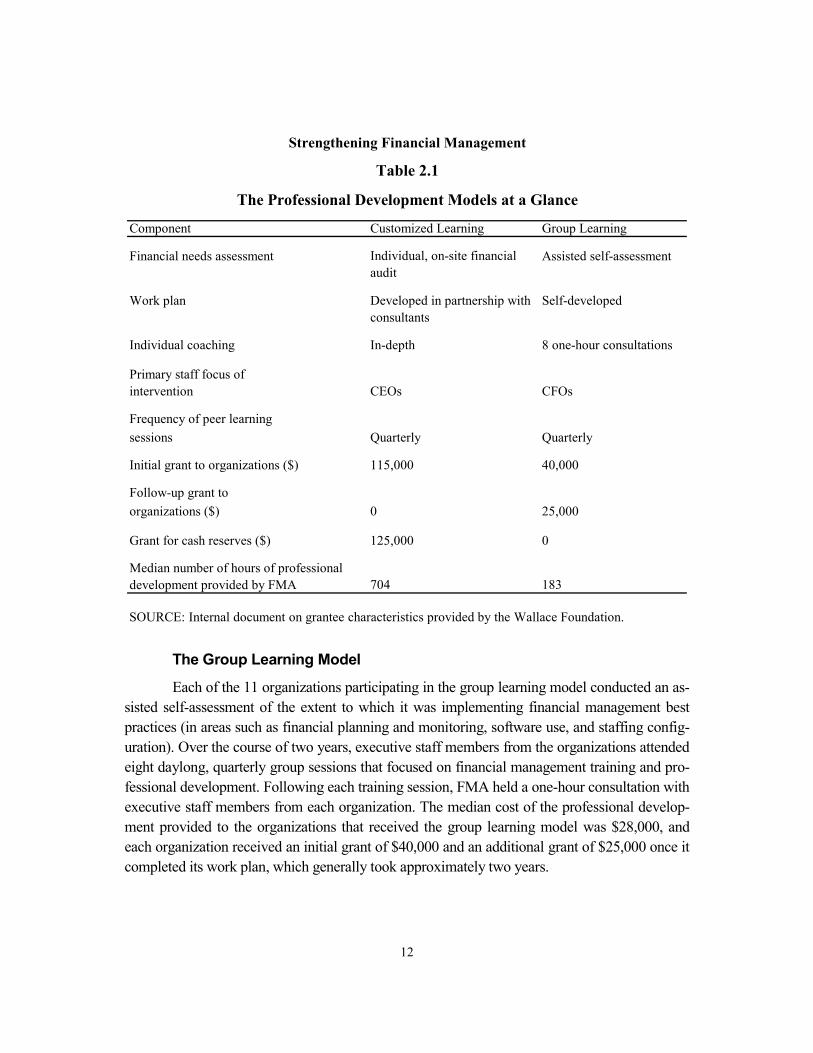
Each of the 11 organizations participating in the group learning model conducted an as-sisted self-assessment of the extent to which it was implementing financial management best practices (in areas such as financial planning and monitoring, software use, and staffing config-uration). Over the course of two years, executive staff members from the organizations attended eight daylong, quarterly group sessions that focused on financial management training and pro-fessional development. Following each training session, FMA held a one-hour consultation with executive staff members from each organization. The median cost of the professional develop-ment provided to the organizations that received the group learning model was $28,000, and each organization received an initial grant of $40,000 and an additional grant of $25,000 once it completed its work plan, which generally took approximately two years.
Component Customized Learning Group Learning
Financial needs assessment Individual, on-site financial Assisted self-assessment audit
Work plan Developed in partnership with consultants
Self-developed
Individual coaching In-depth 8 one-hour consultations
Primary staff focus ofintervention CEOs CFOs
Frequency of peer learningsessions Quarterly Quarterly
Initial grant to organizations ($) 115,000 40,000
Follow-up grant toorganizations ($) 0 25,000
Grant for cash reserves ($) 125,000 0
Median number of hours of professionaldevelopment provided by FMA 704 183
Strengthening Financial Management
Table 2.1
The Professional Development Models at a Glance
SOURCE: Internal document on grantee characteristics provided by the Wallace Foundation.
13
Common Features of the Models
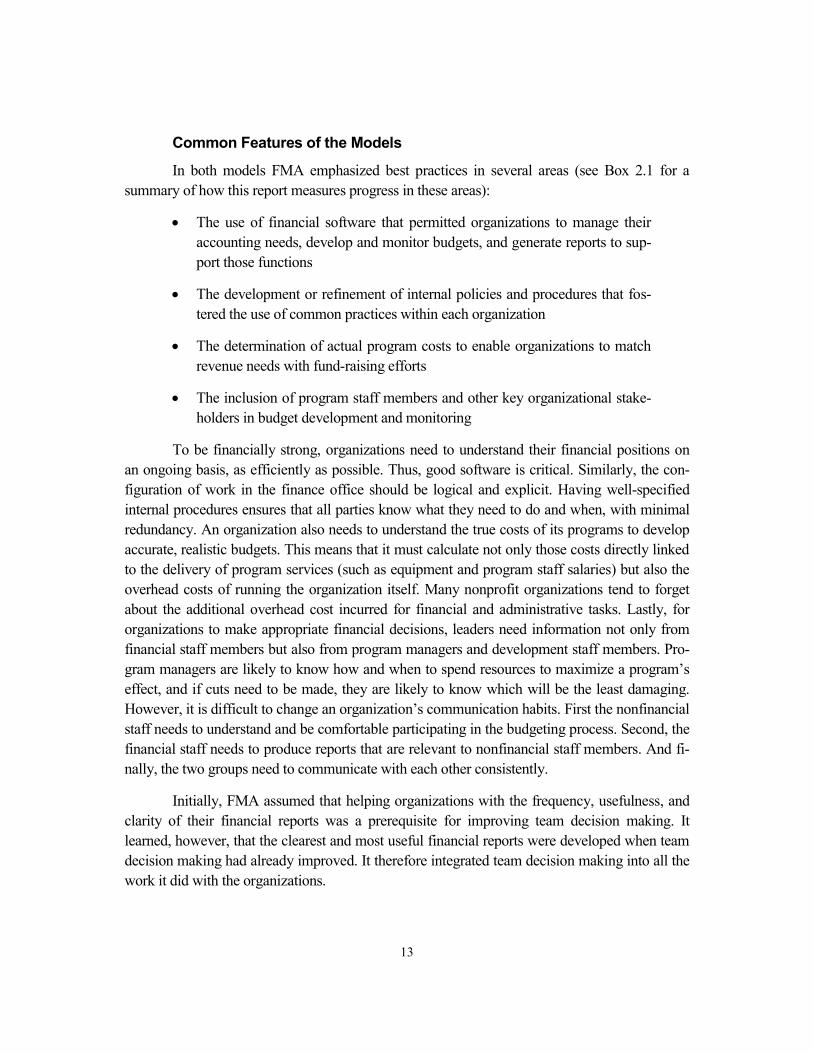
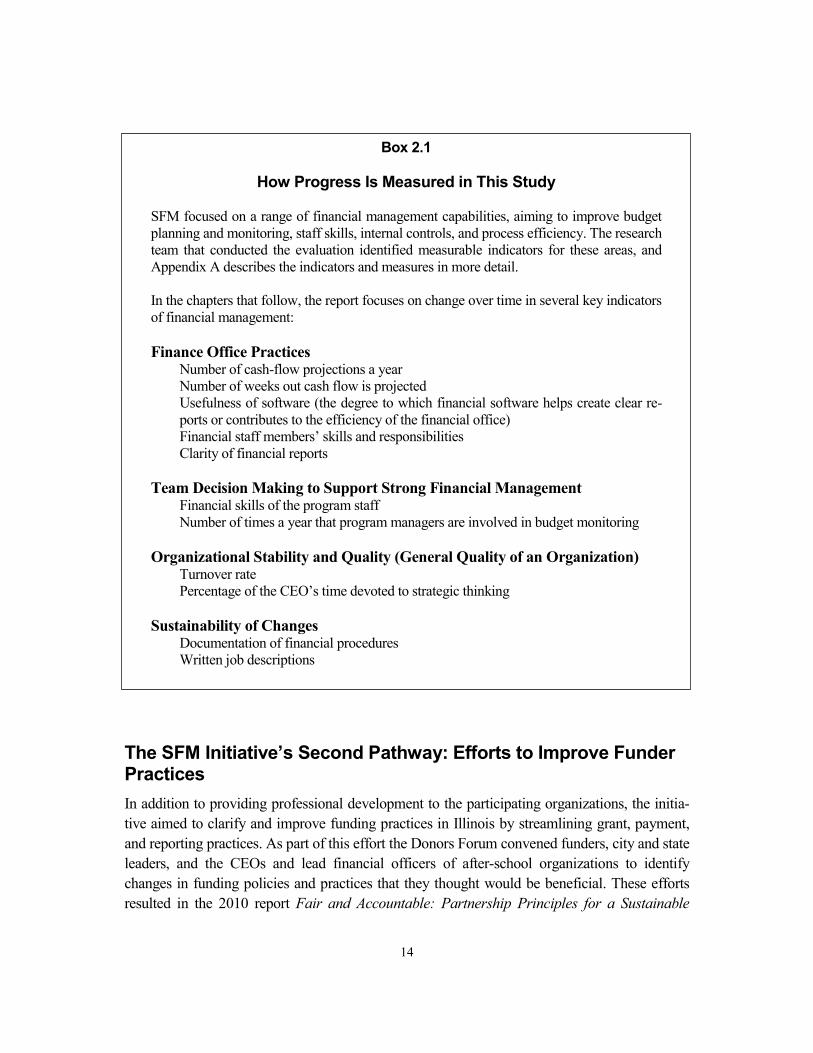
In both models FMA emphasized best practices in several areas (see Box 2.1 for a summary of how this report measures progress in these areas):
• The use of financial software that permitted organizations to manage their accounting needs, develop and monitor budgets, and generate reports to sup-port those functions
• The development or refinement of internal policies and procedures that fos-tered the use of common practices within each organization
• The determination of actual program costs to enable organizations to match revenue needs with fund-raising efforts
• The inclusion of program staff members and other key organizational stake-holders in budget development and monitoring
To be financially strong, organizations need to understand their financial positions on an ongoing basis, as efficiently as possible. Thus, good software is critical. Similarly, the con-figuration of work in the finance office should be logical and explicit. Having well-specified internal procedures ensures that all parties know what they need to do and when, with minimal redundancy. An organization also needs to understand the true costs of its programs to develop accurate, realistic budgets. This means that it must calculate not only those costs directly linked to the delivery of program services (such as equipment and program staff salaries) but also the overhead costs of running the organization itself. Many nonprofit organizations tend to forget about the additional overhead cost incurred for financial and administrative tasks. Lastly, for organizations to make appropriate financial decisions, leaders need information not only from financial staff members but also from program managers and development staff members. Pro-gram managers are likely to know how and when to spend resources to maximize a program’s effect, and if cuts need to be made, they are likely to know which will be the least damaging. However, it is difficult to change an organization’s communication habits. First the nonfinancial staff needs to understand and be comfortable participating in the budgeting process. Second, the financial staff needs to produce reports that are relevant to nonfinancial staff members. And fi-nally, the two groups need to communicate with each other consistently.
Initially, FMA assumed that helping organizations with the frequency, usefulness, and clarity of their financial reports was a prerequisite for improving team decision making. It learned, however, that the clearest and most useful financial reports were developed when team decision making had already improved. It therefore integrated team decision making into all the work it did with the organizations.
14
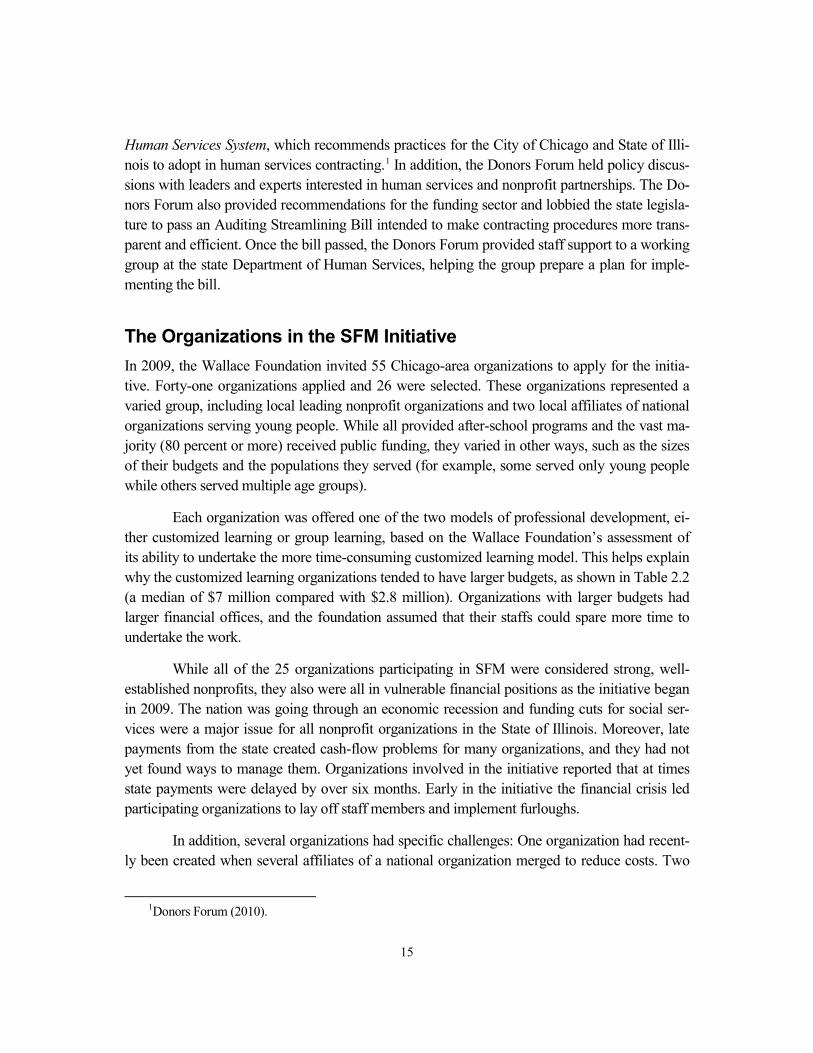
The SFM Initiative’s Second Pathway: Efforts to Improve Funder Practices In addition to providing professional development to the participating organizations, the initia-tive aimed to clarify and improve funding practices in Illinois by streamlining grant, payment, and reporting practices. As part of this effort the Donors Forum convened funders, city and state leaders, and the CEOs and lead financial officers of after-school organizations to identify changes in funding policies and practices that they thought would be beneficial. These efforts resulted in the 2010 report Fair and Accountable: Partnership Principles for a Sustainable
Box 2.1
How Progress Is Measured in This Study
SFM focused on a range of financial management capabilities, aiming to improve budget planning and monitoring, staff skills, internal controls, and process efficiency. The research team that conducted the evaluation identified measurable indicators for these areas, and Appendix A describes the indicators and measures in more detail. In the chapters that follow, the report focuses on change over time in several key indicators of financial management: Finance Office Practices
Number of cash-flow projections a year Number of weeks out cash flow is projected Usefulness of software (the degree to which financial software helps create clear re-ports or contributes to the efficiency of the financial office) Financial staff members’ skills and responsibilities Clarity of financial reports
Team Decision Making to Support Strong Financial Management
Financial skills of the program staff Number of times a year that program managers are involved in budget monitoring
Organizational Stability and Quality (General Quality of an Organization)
Turnover rate Percentage of the CEO’s time devoted to strategic thinking
Sustainability of Changes
Documentation of financial procedures Written job descriptions
15
Human Services System, which recommends practices for the City of Chicago and State of Illi-nois to adopt in human services contracting.1 In addition, the Donors Forum held policy discus-sions with leaders and experts interested in human services and nonprofit partnerships. The Do-nors Forum also provided recommendations for the funding sector and lobbied the state legisla-ture to pass an Auditing Streamlining Bill intended to make contracting procedures more trans-parent and efficient. Once the bill passed, the Donors Forum provided staff support to a working group at the state Department of Human Services, helping the group prepare a plan for imple-menting the bill.
The Organizations in the SFM Initiative In 2009, the Wallace Foundation invited 55 Chicago-area organizations to apply for the initia-tive. Forty-one organizations applied and 26 were selected. These organizations represented a varied group, including local leading nonprofit organizations and two local affiliates of national organizations serving young people. While all provided after-school programs and the vast ma-jority (80 percent or more) received public funding, they varied in other ways, such as the sizes of their budgets and the populations they served (for example, some served only young people while others served multiple age groups).
Each organization was offered one of the two models of professional development, ei-ther customized learning or group learning, based on the Wallace Foundation’s assessment of its ability to undertake the more time-consuming customized learning model. This helps explain why the customized learning organizations tended to have larger budgets, as shown in Table 2.2 (a median of $7 million compared with $2.8 million). Organizations with larger budgets had larger financial offices, and the foundation assumed that their staffs could spare more time to undertake the work.
While all of the 25 organizations participating in SFM were considered strong, well-established nonprofits, they also were all in vulnerable financial positions as the initiative began in 2009. The nation was going through an economic recession and funding cuts for social ser-vices were a major issue for all nonprofit organizations in the State of Illinois. Moreover, late payments from the state created cash-flow problems for many organizations, and they had not yet found ways to manage them. Organizations involved in the initiative reported that at times state payments were delayed by over six months. Early in the initiative the financial crisis led participating organizations to lay off staff members and implement furloughs.
In addition, several organizations had specific challenges: One organization had recent-ly been created when several affiliates of a national organization merged to reduce costs. Two
1Donors Forum (2010).
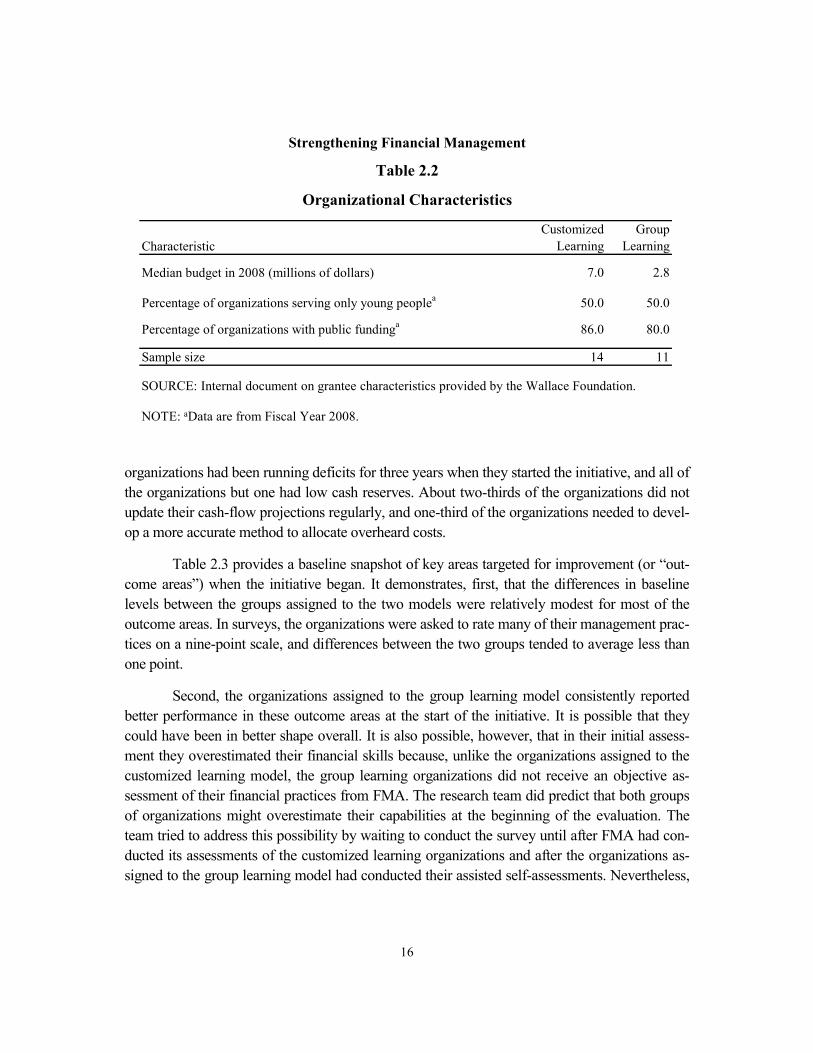
16
organizations had been running deficits for three years when they started the initiative, and all of the organizations but one had low cash reserves. About two-thirds of the organizations did not update their cash-flow projections regularly, and one-third of the organizations needed to devel-op a more accurate method to allocate overheard costs.
Table 2.3 provides a baseline snapshot of key areas targeted for improvement (or “out-come areas”) when the initiative began. It demonstrates, first, that the differences in baseline levels between the groups assigned to the two models were relatively modest for most of the outcome areas. In surveys, the organizations were asked to rate many of their management prac-tices on a nine-point scale, and differences between the two groups tended to average less than one point.
Second, the organizations assigned to the group learning model consistently reported better performance in these outcome areas at the start of the initiative. It is possible that they could have been in better shape overall. It is also possible, however, that in their initial assess-ment they overestimated their financial skills because, unlike the organizations assigned to the customized learning model, the group learning organizations did not receive an objective as-sessment of their financial practices from FMA. The research team did predict that both groups of organizations might overestimate their capabilities at the beginning of the evaluation. The team tried to address this possibility by waiting to conduct the survey until after FMA had con-ducted its assessments of the customized learning organizations and after the organizations as-signed to the group learning model had conducted their assisted self-assessments. Nevertheless,
CharacteristicCustomized
LearningGroup
Learning
Median budget in 2008 (millions of dollars) 7.0 2.8
Percentage of organizations serving only young peoplea 50.0 50.0
Percentage of organizations with public fundinga 86.0 80.0
Sample size 14 11
Strengthening Financial Management
Table 2.2
Organizational Characteristics
SOURCE: Internal document on grantee characteristics provided by the Wallace Foundation.
NOTE: aData are from Fiscal Year 2008.
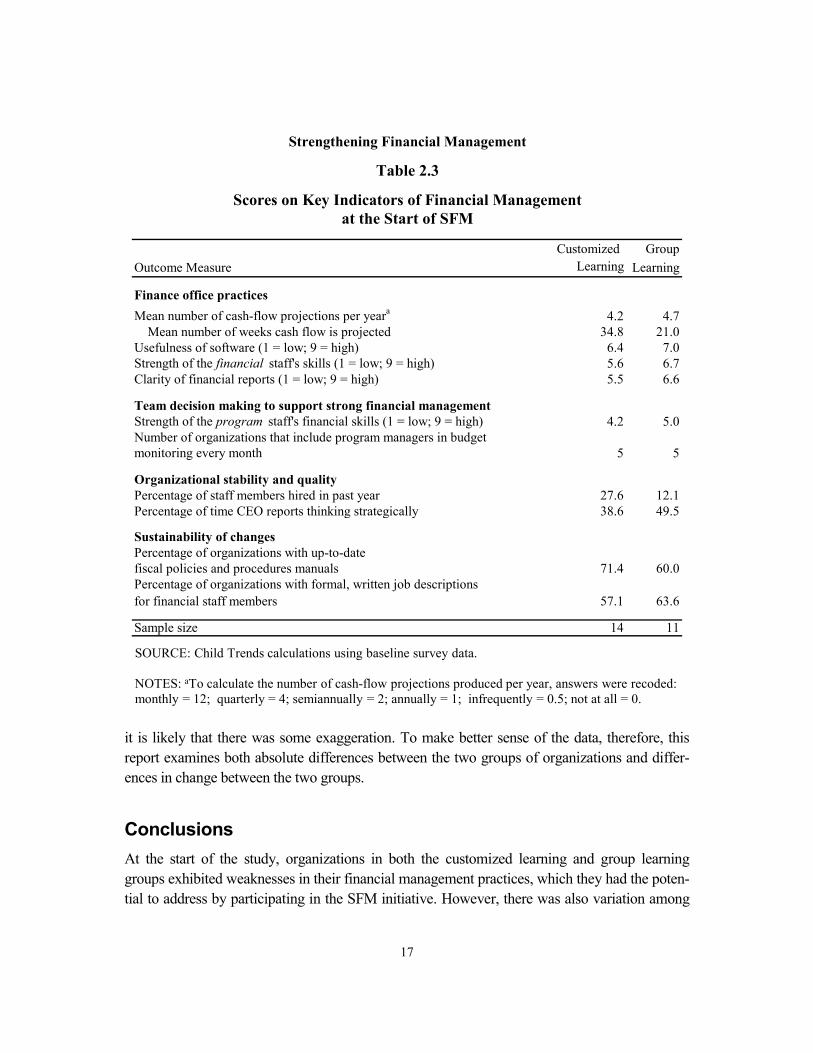
17
it is likely that there was some exaggeration. To make better sense of the data, therefore, this report examines both absolute differences between the two groups of organizations and differ-ences in change between the two groups.
Conclusions At the start of the study, organizations in both the customized learning and group learning groups exhibited weaknesses in their financial management practices, which they had the poten-tial to address by participating in the SFM initiative. However, there was also variation among
Customized GroupOutcome Measure Learning Learning
Finance office practicesMean number of cash-flow projections per yeara 4.2 4.7
Mean number of weeks cash flow is projected 34.8 21.0Usefulness of software (1 = low; 9 = high) 6.4 7.0Strength of the financial staff's skills (1 = low; 9 = high) 5.6 6.7Clarity of financial reports (1 = low; 9 = high) 5.5 6.6
Team decision making to support strong financial managementStrength of the program staff's financial skills (1 = low; 9 = high) 4.2 5.0Number of organizations that include program managers in budget monitoring every month 5 5
Organizational stability and qualityPercentage of staff members hired in past year 27.6 12.1Percentage of time CEO reports thinking strategically 38.6 49.5
Sustainability of changesPercentage of organizations with up-to-datefiscal policies and procedures manuals 71.4 60.0Percentage of organizations with formal, written job descriptionsfor financial staff members 57.1 63.6
Sample size 14 11
Strengthening Financial Management
Table 2.3
Scores on Key Indicators of Financial Managementat the Start of SFM
SOURCE: Child Trends calculations using baseline survey data.
NOTES: aTo calculate the number of cash-flow projections produced per year, answers were recoded: monthly = 12; quarterly = 4; semiannually = 2; annually = 1; infrequently = 0.5; not at all = 0.
18
organizations in their baseline financial management positions. A few organizations already had very sophisticated financial procedures, many resources, and strong policies. They saw SFM as an opportunity to refine some of their practices and strengthen a few weak areas. Other organi-zations had significant financial management challenges, including little understanding of the importance of strong financial management, insufficient staff support, no financial software, and very weak policies and procedures. The majority of the organizations fell somewhere be-tween these extremes.
19
Chapter 3
Working to Improve Financial Management and Its More Immediate Consequences
Before the Strengthening Financial Management Initiative [(SFM)] we didn’t re-alize how much we underestimated the cost of services. [Now] when we apply for a contract or partnership, we’ve become more aware of what it will really cost us to do.... For example, one of the contracts that had been administered by Hull House became available when it closed, and we let it go.... We knew ... that the contract would only cover a percent of the cost of services.
I asked, “What will this mean to our organization? Will we have enough cash ... to cover costs? Will we have time to raise it [if the contract doesn’t cover all the costs]?” We felt that, “no, we don’t have it. What will it do to the families we are serving? It could be our demise.”
A few years ago I would have said, “Yes, go for it,” but when you account for what it would cost to run it, and we only had a week to find the 20 percent not covered. We said, “No,” and turned it down. I wouldn’t have done that before the initiative.
Over the course of four years, the organizations in the SFM initiative engaged in a broad range of efforts designed to build their capabilities. Sustainability was on the minds of the initiative’s de-signers — Fiscal Management Associates (FMA) and the Wallace Foundation — from the be-ginning, and their goal was to embed better financial practices into the organizations’ routines. They took several approaches to doing so. FMA provided intensive assistance for two years — much longer than most professional development efforts — giving themselves more time to overcome staff resistance. It also worked with organizational leaders on the assumption that working with them was necessary to sustain changes over time. If leaders did not understand why certain practices were important, they would be less prepared to assist with the effort. En-couraging each organization’s leaders to include more staff members in financial decisions was yet another strategy. Finally, the less intensive efforts of the second two years, which consisted primarily of occasional group learning sessions, reinforced gains in knowledge and practice.
What changes occurred in the organizations’ financial practices over the course of the four-year period? What benefits, if any, did the organizations experience as a result of those changes? This chapter examines these two questions and shows that over four years, the SFM initiative resulted in substantial improvements in financial practices, team decision making, and other measures of organizational quality. While the organizations that received the customized learning model tended to show more change, the organizations in the group learning model also
20
benefited in important ways, suggesting that the less expensive and intensive model is a good alternative when resources are limited.
The chapter relies on two major sources of data: (1) telephone surveys conducted with the organizations’ chief executive officers (CEOs) and top financial officers when the organiza-tion joined the initiative (at “baseline”) and after four years, and (2) annual research visits to Chicago to talk with staff members in more detail about their organizations’ participation in the initiative. It discusses three major types of changes: (1) changes in finance office practices, (2) changes to include more nonfinancial staff members in the process of developing and monitor-ing budgets, and 3) changes in organizational stability and quality (as measured by staff turno-ver and by CEO time spent on strategic thinking).
Each section of the chapter reviews the importance of the area targeted for improve-ment (the “outcome area”), and then presents the change in outcomes. The remainder of the chapter presents information from interviews with staff members to show how they felt the changes affected their organizations. Box 3.1 defines some of the important financial terms used here and in other chapters.
Change in the Finance Office’s Practices In SFM’s theory of change, laid out in the previous chapter, changes in finance office resources and practices lead to changes in organizational and program quality. These changes in finance offices include:
• Having appropriate financial software and staff members trained to use the software to generate reports
• Having staff members skilled in financial practices such as developing budg-ets, financial analysis and monitoring, and processing accounts payable
• Producing timely, regular, and clear financial reports
Having the technological and human resources needed to produce good financial reports can help the organization as a whole monitor the progress of its work and spending, and enable the organization to better plan future activity.
While financially strong organizations produce many types of financial reports, this evaluation focuses on cash-flow projections. Given the financial crisis the State of Illinois was facing, late payments from the state were creating cash-flow problems for most nonprofit organ-izations. At the beginning of the initiative only about one-third of the organizations projected

21
Box 3.1
Definitions and Significance of Financial Terms Used in This Report
Cash-flow projection
Projections of cash inflow and cash outflow are typically used to gauge operating cash needs. They allow an organization to anticipate shortages and develop strategies for fund-ing when shortages are projected to occur, or for investing surpluses when those occur.† By comparing expected cash inflows and outflows with actual deposits and expenditures and examining any variances, organizations can strengthen their ability to accurately an-ticipate their cash-flow needs in the future.
CEO
This report refers to the senior executive staff person in the grantee organizations as the chief executive officer (CEO). In a number of organizations, the senior executive bore the title of executive director or president. To ease reporting, however, only the term CEO is used.
CFO
This report refers to the senior financial staff person in the grantee organizations as the chief financial officer (CFO). In a number of organizations, the senior financial staff member bore the title of comptroller, accountant, or vice-president for finance. To ease reporting, however, only the term CFO is used.
Chart of accounts
A chart of accounts is similar to a glossary that includes a list of budget categories (such as assets, liabilities, labor, and other direct costs) and the corresponding numeric codes that represent those categories in an organization’s financial software. For example, many organizations use 1,000 numbers to refer to assets, and different types of assets (for exam-ple, bank accounts, endowments) will each have a subcode such as 1,001, 1,002, etc. A chart of accounts allows organizations to group their financial statements quickly into the categories required for reporting.
Assisted self-assessment
The self-assessment organizations conducted in SFM (also known as a “gap analysis”) provided them the opportunity to assess their own management practices relative to estab-lished best practices in a given arena. At the beginning of the project, FMA reviewed group learning organizations’ audits and financial reports and created for each of them a report that flagged their key challenges. Then, in the first group learning meeting, FMA facilitated a peer discussion about those flagged issues and asked organizations to set goals based on them. The process enabled organizations to identify areas of concern and to set priorities to address them.
(continued)
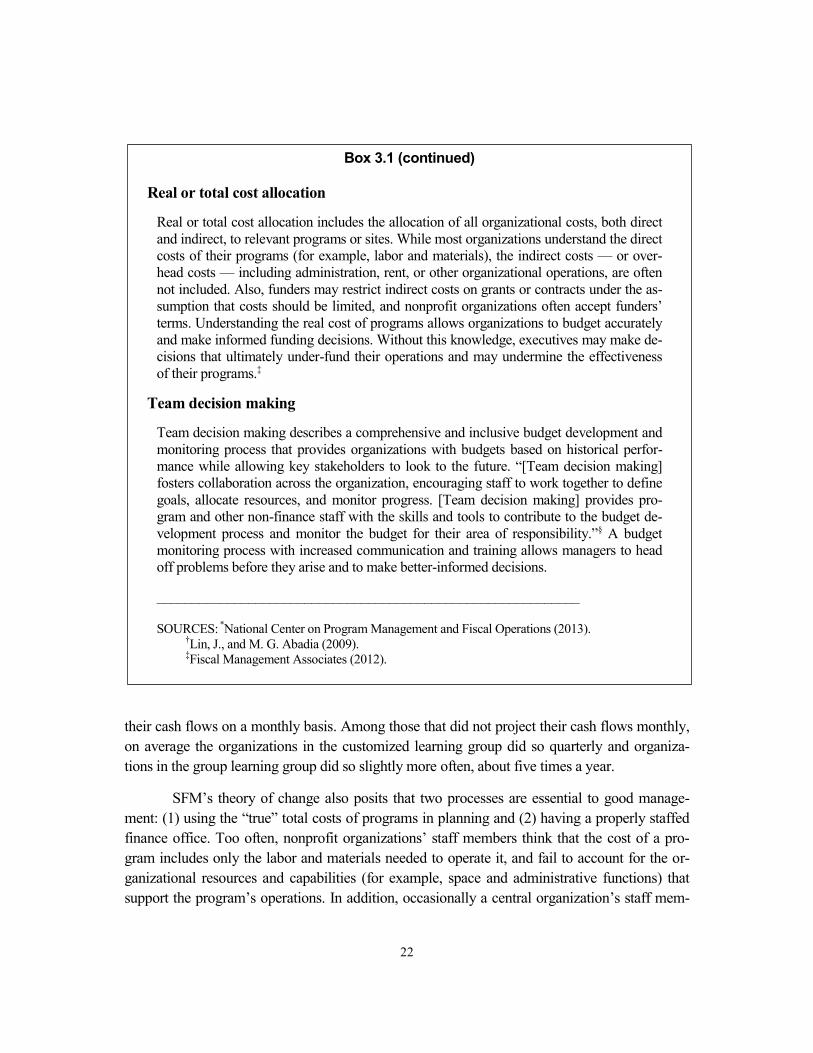
22
their cash flows on a monthly basis. Among those that did not project their cash flows monthly, on average the organizations in the customized learning group did so quarterly and organiza-tions in the group learning group did so slightly more often, about five times a year.
SFM’s theory of change also posits that two processes are essential to good manage-ment: (1) using the “true” total costs of programs in planning and (2) having a properly staffed finance office. Too often, nonprofit organizations’ staff members think that the cost of a pro-gram includes only the labor and materials needed to operate it, and fail to account for the or-ganizational resources and capabilities (for example, space and administrative functions) that support the program’s operations. In addition, occasionally a central organization’s staff mem-
Box 3.1 (continued)
Real or total cost allocation
Real or total cost allocation includes the allocation of all organizational costs, both direct and indirect, to relevant programs or sites. While most organizations understand the direct costs of their programs (for example, labor and materials), the indirect costs — or over-head costs — including administration, rent, or other organizational operations, are often not included. Also, funders may restrict indirect costs on grants or contracts under the as-sumption that costs should be limited, and nonprofit organizations often accept funders’ terms. Understanding the real cost of programs allows organizations to budget accurately and make informed funding decisions. Without this knowledge, executives may make de-cisions that ultimately under-fund their operations and may undermine the effectiveness of their programs.‡
Team decision making
Team decision making describes a comprehensive and inclusive budget development and monitoring process that provides organizations with budgets based on historical perfor-mance while allowing key stakeholders to look to the future. “[Team decision making] fosters collaboration across the organization, encouraging staff to work together to define goals, allocate resources, and monitor progress. [Team decision making] provides pro-gram and other non-finance staff with the skills and tools to contribute to the budget de-velopment process and monitor the budget for their area of responsibility.”§ A budget monitoring process with increased communication and training allows managers to head off problems before they arise and to make better-informed decisions.
____________________________________________________________ SOURCES: *National Center on Program Management and Fiscal Operations (2013). †Lin, J., and M. G. Abadia (2009). ‡Fiscal Management Associates (2012).
23
bers work directly on particular programs, and that organization may cover the cost of their la-bor using overhead funds rather than program budgets. While this practice may appear to save the program money, it actually places an additional financial burden on organizations in an era in which funders severely restrict overhead expenses.
Second, finance offices need enough of the right type of staff to achieve high quality work with efficiency. Having too few staff members or staff members without the appropriate skills can result in backlogs in producing necessary reports, lack of quality control, and staff burnout and turnover, among other challenges. FMA helped organizations receiving both train-ing models understand the importance of having a staff composed of people with the right skills.
Figures 3.1 and 3.2 show how outcomes associated with financial staff skills and report-ing changed over the course of the initiative. Both the group learning and customized learning organizations demonstrated improvements across four outcomes: (1) cash-flow projections, (2) the usefulness of financial software, (3) the financial staff’s skills, and (4) report clarity. Cus-tomized learning organizations tended to show greater improvements than group learning or-ganizations. Also, while all of the changes among the customized learning organizations were statistically significant, only two of the changes for group learning organizations were. Howev-er, by the end of four years, average outcome values were very similar across the two groups of organizations.
Some finance office practices changed a great deal, while others changed relatively lit-tle. Organizations showed large changes in the number of cash-flow projections they generated per year (see Figure 3.1). On average, customized learning organizations generated 3.6 more cash-flow projections a year, and group learning organizations generated 5.7 more. These large changes meant that the organizations essentially doubled their number of cash-flow projections from the beginning to end of the initiative. Organizations also projected their cash flows by about an additional four or five weeks, although this increase was not statistically significant for organizations receiving either training model (not shown). In general, however, organizations were most concerned with their cash flows over the upcoming six-month period, and organiza-tions generally projected cash flows for at least six months.
The clarity of financial reports improved significantly for organizations in both groups. Organizations had reported slightly better than average report clarity at the initiative’s beginning — 6.6 for group learning organizations and 5.5 for customized learning organizations on a 9-point scale (see Table 2.3). Figure 3.2 shows that by the end of the initiative, organizations rated their report clarity significantly higher (1.7 points higher for group learning organizations and 2.1 points higher for customized learning organizations), which put their average final ratings at the high end of the scale (above 7.5).
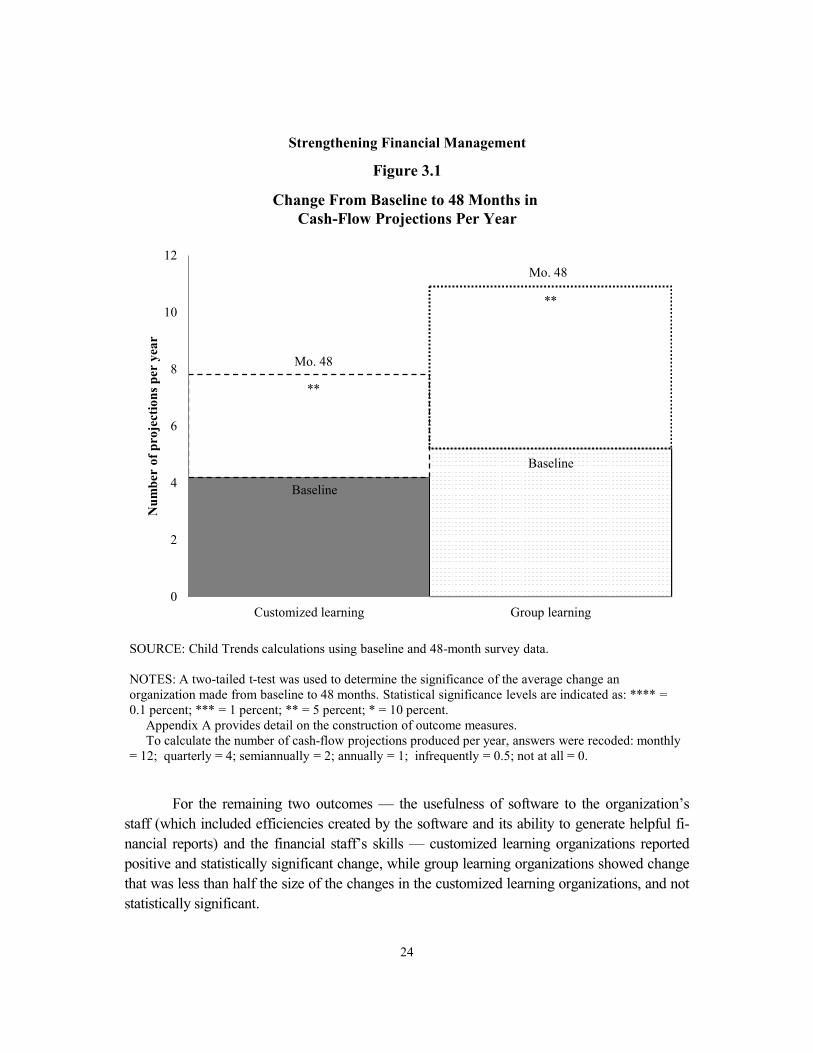
24
For the remaining two outcomes — the usefulness of software to the organization’s staff (which included efficiencies created by the software and its ability to generate helpful fi-nancial reports) and the financial staff’s skills — customized learning organizations reported positive and statistically significant change, while group learning organizations showed change that was less than half the size of the changes in the customized learning organizations, and not statistically significant.
Strengthening Financial Management
Figure 3.1
Change From Baseline to 48 Months in Cash-Flow Projections Per Year
SOURCE: Child Trends calculations using baseline and 48-month survey data.
NOTES: A two-tailed t-test was used to determine the significance of the average change an organization made from baseline to 48 months. Statistical significance levels are indicated as: **** = 0.1 percent; *** = 1 percent; ** = 5 percent; * = 10 percent.
Appendix A provides detail on the construction of outcome measures. To calculate the number of cash-flow projections produced per year, answers were recoded: monthly
= 12; quarterly = 4; semiannually = 2; annually = 1; infrequently = 0.5; not at all = 0.
0
2
4
6
8
10
12
Customized learning Group learning
Num
ber
of p
roje
ctio
ns p
er y
ear
Baseline
Baseline
Mo. 48
Mo. 48
**
**
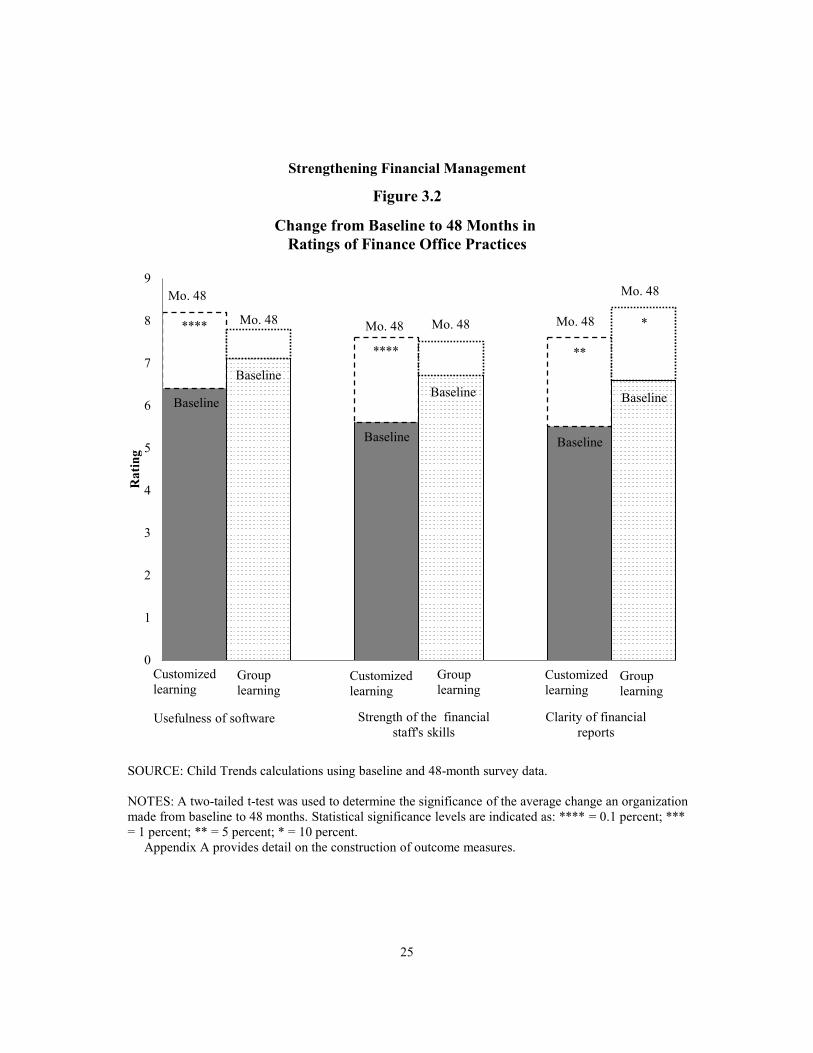
25
Change from Baseline to 48 Months in Ratings of Finance Office Practices
Figure 3.2
Strengthening Financial Management
0
1
2
3
4
5
6
7
8
9
Rat
ing
Customized learning
Grouplearning
Baseline
Mo. 48
Mo. 48
Mo. 48
Usefulness of software Clarity of financial reports
Strength of the financial staff's skills
****
**** **
*
Customized learning
Grouplearning
Customized learning
Grouplearning
Mo. 48
BaselineBaseline
BaselineBaseline
Baseline
Mo. 48 Mo. 48
SOURCE: Child Trends calculations using baseline and 48-month survey data.
NOTES: A two-tailed t-test was used to determine the significance of the average change an organization made from baseline to 48 months. Statistical significance levels are indicated as: **** = 0.1 percent; *** = 1 percent; ** = 5 percent; * = 10 percent.
Appendix A provides detail on the construction of outcome measures.
26
Benefits of Changes to Financial Practices
Interviews with staff members conducted during visits to their organizations provide rich information about how these financial practices helped those organizations and their staffs more broadly. Staff members from 11 organizations reported large positive changes in the number of cash-flow projections the organization produced annually. (Of the others, 7 organizations started and ended the initiative with monthly cash-flow projections and thus had no room for improve-ment, 3 could have improved but showed no gain, and 3 got worse). More frequent cash-flow reports allowed an organization’s development and financial staff to identify financial needs and raise funds accordingly. They also helped the financial staff identify periods when the organiza-tion might need to resort to its cash reserves or lines of credit in order to manage the problems produced by late payments from the state, problems that were exacerbated by the recession.
A little fewer than half of the organizations visited over the course of the initiative in-dicated that they upgraded their software or trained staff members to use previously unused features of their existing software. The survey results indicate that overall, organizations’ leaders thought that the usefulness of their financial software increased, and the interviews provide information about the ways financial software became more useful. New or upgraded software allowed organizations to realize efficiencies by automating functions that had previ-ously been done manually, including invoicing and payroll. Second, software upgrades al-lowed organizations to generate financial reports that they had not previously created or had not created as frequently.
Improved report clarity was another topic leaders discussed during the interviews. Clear reports helped leaders by providing them with a fuller picture of the financial state of the organ-ization. As one chief operating officer pointed out:
Staff generally [understand] what it means to manage a budget, to understand revenue and budget. Previously staff never received reports on program perfor-mance and new funding. It’s very different now. People understand the general financial landscape of the organization and their own program.
More generally, the most commonly mentioned benefit to having more frequent and better quality reports (cited by 11 out of 24 organizations visited by the research team) was that leaders could share them with board members and program staff members. That made financial decision making more transparent, inclusive, and efficient.
Although the surveys of leaders could not assess whether the organizations were includ-ing the correct amounts of allocated overhead costs in their program cost numbers, the initial assessments of customized learning organizations conducted by FMA did address that issue. Those assessments indicated that about two-thirds had flawed cost-allocation methodologies and lacked accurate knowledge about how much money they needed to run their programs

27
while covering all their administrative costs. Interviews conducted during visits revealed that one-third of the organizations that were asked about cost-allocation methods had changed their approaches as a result of FMA’s advice.
Leaders discussed four benefits of changes to cost-allocation methods. First, as the ex-ecutive director quoted at the beginning of this chapter indicated, knowing their costs made it possible for organizations to make thoughtful decisions about the contracts they should or should not accept. Second, it allowed them to identify which existing programs had gaps be-tween their revenues and the funds required to pay for both a program’s activity and its share of overhead costs. One chief financial officer (CFO) also indicated that developing a better under-standing of programs’ costs sometimes allowed her to negotiate successfully with funders. Fi-nally, a clearer understanding of which activities were related to programs and which were re-lated to core organizational functions made it possible to consider charging some staff mem-bers’ activities directly to grants or contracts, even when their salaries were not covered by those grants or contracts. As one CEO said:
Before, we looked at direct costs and administrative costs separately. One thing FMA said about allocations changed how we allocate [our costs]. They threw out different scenarios. Like: “If you have a development person and they are coordinating volunteers for your leadership program, are you charging their sala-ry to development? It should be charged to the program.” Now we identify cer-tain duties that are program-specific. By properly allocating, we can pay them from the restricted funds and have more of the percent reimbursement for actual overhead and admin costs.
In this organization’s case, managers examined financial staff members’ duties and found that they were paying invoices for buses needed to transport young people to and from program sites, and also scheduling the buses. Because the financial staff members’ salaries were charged to the overhead budget and because the staff was not charging time spent scheduling buses to the program, revenues devoted to overhead were being spent to support the program.
Team Decision Making In order for an organization to make appropriate financial decisions, leaders need information not only from the financial staff but also from program managers and the development staff. In order for leaders to successfully diagnose financial problems related to spending on program activities, such as over- or underspending, they need to involve staff members from across the organization. For the program staff to be full partners in the financial decision process, two ele-ments must first be in place:
• The financial staff must share reports with program staff members and board members. These reports should be clear enough to facilitate useful conversa-
28
tions, permitting program staff members to apply their knowledge of pro-grammatic needs to budgeting and monitoring.
• Program staff members across the organization must develop the knowledge and skills necessary to understand the reports.
Equipping program staff members with appropriate knowledge and skills helps facili-tate communication across departments, demystifies the organizational budgeting process, and empowers program leaders to make critical and timely decisions about their programs. FMA offered specific opportunities for program directors and managers to attend workshops with members of other departments in their organizations, to foster their understanding of important financial concepts and improve internal communications. The SFM initiative also encouraged organizations to provide additional training to key program staff members and to include those staff members in the team decision-making process. Engaging program staff members in team decision making was intended to give them a sense of ownership over programs’ budgets and to allow them to practice their newly acquired financial skills.
The surveys asked about two measures related to this outcome area: (1) the financial skills of the program staff and (2) the number of times per year that program managers were involved in budget monitoring. CEOs and CFOs rated program staff members on their ability to understand financial reports, develop realistic program budgets, and understand contractual constraints. Notably, program staff members’ financial skills was the one area in which all the organizations scored relatively low at the beginning of the initiative, and then improved greatly by its end.
Figure 3.3 shows that the executives in both the group learning and customized learning organizations reported that program managers significantly improved their skills related to fi-nancial management over the course of the initiative. Customized learning organizations showed greater change than group learning organizations (a change on average of 2.7 on a 9-point scale, compared with 1.6 for group learning organizations), but both sets of organizations completed the initiative with similar average scores. These changes meant that the executives, who had rated their program staff members as falling in the middle of the scale at the initiative’s beginning, rated them toward the high end of the scale at the initiative’s end.
Organizations also saw changes in the number of times a year that program managers were involved in budget monitoring (see Figure 3.4). CEOs and CFOs from customized learn-ing organizations reported that that their program staff members were involved in budget moni-toring an additional 4.1 times a year, on average, and those from group learning organizations reported that their staff members were involved an additional 3.5 times a year. The group learn-ing change was positive but not statistically significant.
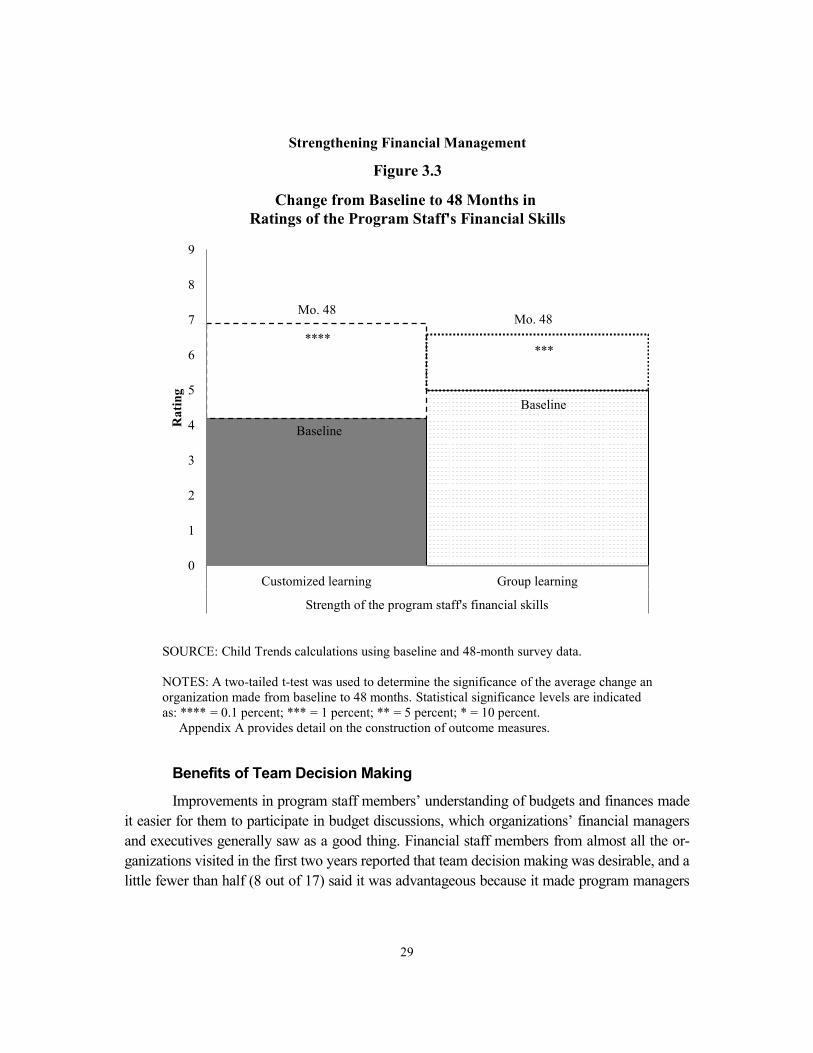
29
Benefits of Team Decision Making
Improvements in program staff members’ understanding of budgets and finances made it easier for them to participate in budget discussions, which organizations’ financial managers and executives generally saw as a good thing. Financial staff members from almost all the or-ganizations visited in the first two years reported that team decision making was desirable, and a little fewer than half (8 out of 17) said it was advantageous because it made program managers
Ratings of the Program Staff's Financial SkillsChange from Baseline to 48 Months in
Figure 3.3
Strengthening Financial Management
0
1
2
3
4
5
6
7
8
9
Customized learning Group learning
Strength of the program staff's financial skills
Rat
ing
Baseline
Baseline
Mo. 48Mo. 48
*******
SOURCE: Child Trends calculations using baseline and 48-month survey data.
NOTES: A two-tailed t-test was used to determine the significance of the average change an organization made from baseline to 48 months. Statistical significance levels are indicated as: **** = 0.1 percent; *** = 1 percent; ** = 5 percent; * = 10 percent.
Appendix A provides detail on the construction of outcome measures.
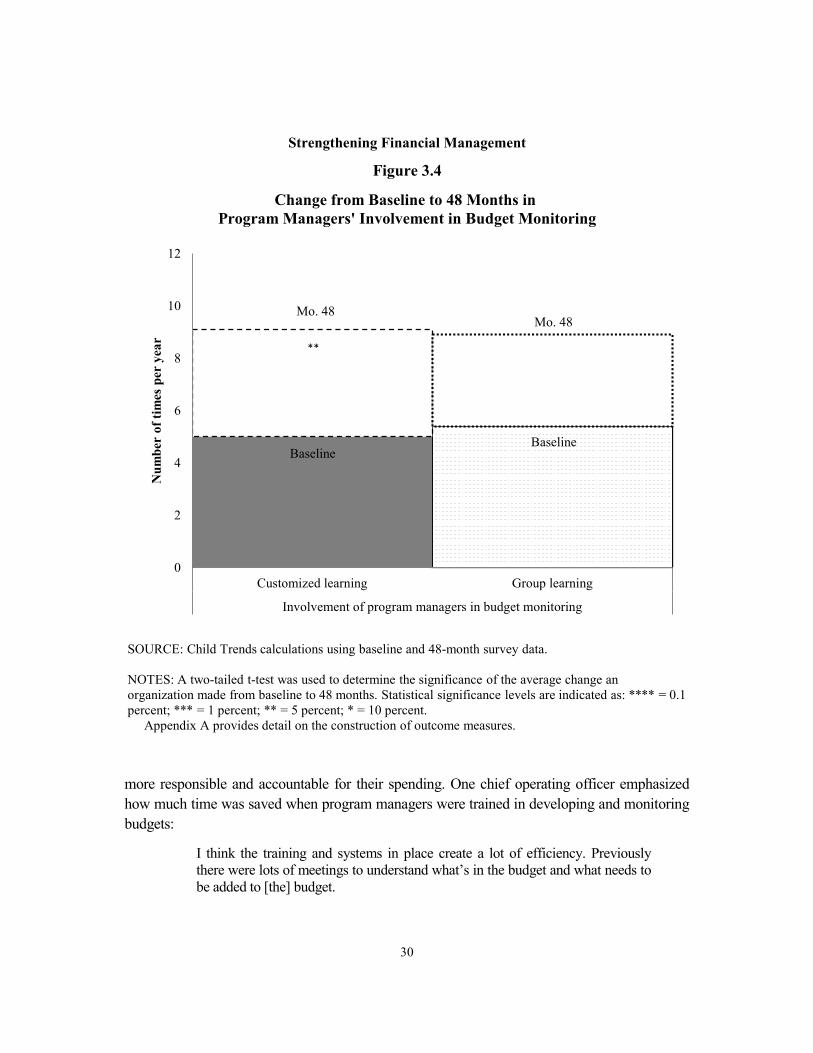
30
more responsible and accountable for their spending. One chief operating officer emphasized how much time was saved when program managers were trained in developing and monitoring budgets:
I think the training and systems in place create a lot of efficiency. Previously there were lots of meetings to understand what’s in the budget and what needs to be added to [the] budget.
Strengthening Financial Management
Figure 3.4
Program Managers' Involvement in Budget MonitoringChange from Baseline to 48 Months in
0
2
4
6
8
10
12
Customized learning Group learning
Involvement of program managers in budget monitoring
Num
ber
of ti
mes
per
yea
r
BaselineBaseline
Mo. 48Mo. 48
**
SOURCE: Child Trends calculations using baseline and 48-month survey data.
NOTES: A two-tailed t-test was used to determine the significance of the average change an organization made from baseline to 48 months. Statistical significance levels are indicated as: **** = 0.1 percent; *** = 1 percent; ** = 5 percent; * = 10 percent.
Appendix A provides detail on the construction of outcome measures.
31
Financial, executive, and program staff members also reported a wide variety of other benefits to team decision making. Almost two-thirds (19) of the 30 program staff members in-terviewed over the years reported benefits ranging from more accurate budgeting to better communication among staff members concerning expenditures (which led to better spending decisions).
The SFM initiative also improved organizations’ relationships with funders. Involving program managers in budget monitoring helped ensure that program spending was appropriate. When asked about the consequences of her involvement in budgeting, one program manager reported:
The best way I can describe it is that we now have a preventative system in place. In the past we’d get nasty letters from funders saying things like: “You’re severe-ly underspent, and you need to spend 60 percent of your funds in two months,” or, “Why are you running into the red in all salary categories?” ... Now we’re very proactive with the budget, and the finance team can inform us of potential dangers before we hear from funders.... The whole system runs a lot smoother, and I think funders are noticing and are more willing to work with us now.
Beyond merely heading off problems, team decision making can actually expand an or-ganization’s relationships with its funders. If program managers and directors understand their grants and contracts then they can participate more in discussions with funders, thereby increas-ing the organization’s capacity to maintain funder relationships. Discussing his program man-agers, one director responsible for several programs said:
In the past, the president was not able to go to all of the meetings with funders. Now that the managers understand what is required by each grant they are able to develop a relationship with different funders. They develop the relationships, which is a great advantage ... [and] are able to respond to questions about the grants.
Finally, program managers and executive directors reported that access to financial in-formation helped them create realistic budgets because staff members could use past financial information to project the level of service they could provide in the future. This became critical in an uncertain economic environment, as organizations faced funding cuts and needed to have plans in place to manage them.
In sum, involving program staff members in financial management offered a range of benefits to organizations, and because few organizations were strong in this area at the begin-ning of the initiative, most of them made substantial gains. There were, however, challenges to garnering and sustaining those benefits, which will be addressed in the next chapter.
32
Improvements to Organizational Quality: Strategic Thinking and Turnover A major goal of the initiative was to help organizations strengthen their financial capabilities so that staff members across the organization could do their jobs more effectively. One indicator that this had occurred was if the CEO was able to spend more time thinking strategically about the organization and less time reacting to financial challenges. As Figure 3.5 indicates, the group learning organizations reported that their CEOs spent, on average, 13 percent more time on strategic thinking than they had at the beginning of the initiative, while there was no signifi-cant change among the customized learning organizations.
The researchers also hypothesized that the initiative would contribute to lower turnover among financial and program staff members as efficiencies lessened stress and allowed staff members to become more active in budget and program planning. Figure 3.5 shows that, while turnover did not decrease among the customized learning organizations, it did decrease among group learning organizations over the course of the initiative, although the decrease was not sta-tistically significant.
The qualitative information gathered in interviews suggests that thinking about turnover as something that should be reduced is too simplistic for an initiative that attempts to change a range of practices across an organization. Staff stability is generally good, but not necessarily when an organization needs skills that its current staff members do not possess. In some cases, organizational leaders may conclude that current staff members may not be able to develop skills the organization requires.
Staff members left the 20 organizations that reported turnover for many reasons. In al-most three-quarters, the employer initiated the departure for at least one staff member. Staff members were let go due to performance reasons, when organizations outsourced financial functions, or because of funding cuts. In contrast, in only about one-third, staff members left for their own reasons: because of stress or burnout, to further their education, because of illness, or for retirement. In addition, in one-fifth of the organizations, staff members left for more lucra-tive positions. (These numbers sum to more than 100 percent because some organizations had multiple staff members leave for different reasons.)
Some long-term staff members were released because they were unable to adapt to new practices fostered by the SFM initiative. Some financial staff members could not produce the required reports or were uncomfortable sharing financial information with others in their organ-izations, and some program staff members were unwilling to accept new responsibilities for financial management. If these tasks were not accomplished, then an organization could not meet its goals as part of SFM. For example, in one organization the CEO reported that she ter-minated one of the organization’s program directors as a result of the SFM initiative:

33
She was woefully deficient in [the] ability to direct budgetary issues [and] to run her budget.... As we looked at the different departments [and] our fiscal health, the pressure was on her, and she wasn’t able to meet the expectations raised when we joined SFM.
Although staff members left for a variety of reasons — including their incompatibility with their organizations’ plans — the next chapter demonstrates that while turnover might have been good for the organizations in the long run, it slowed organizations’ progress toward the initiative’s goals.
Organizational Stability and Quality
Strengthening Financial Management
Figure 3.5
Change from Baseline to 48 Months in
-20
-10
0
10
20
30
40
50
60
70
Customizedlearning
Group learning Customizedlearning
Group learning
Staff members hired in the past year CEO time spent on strategicthinking
Perc
enta
ge
Baseline
Baseline
Mo. 48
Mo. 48
*
Baseline
Mo. 48
Baseline
Mo. 48
SOURCE: Child Trends calculations using baseline and 48-month survey data.
NOTES: A two-tailed t-test was used to determine the significance of the average change an organization made from baseline to 48 months. Statistical significance levels are indicated as: **** = 0.1 percent; *** = 1 percent; ** = 5 percent; * = 10 percent.
Appendix A provides detail on the construction of outcome measures.
Staff members hiredin the past year
Customizedlearning
Group learning
CEO time spent on strategic thinking
Customizedlearning
Group learning
33
34
Benefits to Programs One of the SFM initiative’s hypotheses was that the quality of programs would ultimately im-prove if organizations’ financial practices improved. In particular, giving executives, financial staff members, and program staff members a better understanding of programs’ real costs and more frequent access to cash-flow forecasts and other reports was expected to lead to stronger program planning and delivery over time, as was getting more people in an organization in-volved in discussions about financial management. The research was not designed to examine program improvements because the SFM initiative’s designers and the research team agreed that the evaluation would not last long enough to demonstrate both improvements in financial practices and program quality.1 To investigate whether these changes were starting to occur, though, the research team asked CEOs and program managers about them during visits to their organizations.
About 18 months after the initiative began, organizations started to report some of the programmatic benefits of the financial management improvements they had undertaken. For example, over- and underspending could be addressed in a more timely fashion, allowing the program staff to plan program activities more effectively. Several organizations mentioned the problem of underspending. Staff members who were not aware of their budgets tended to be frugal. As their contracts or grants were close to ending, the financial staff would let them know that they had money left over to spend on their programs, but often without sufficient time to plan expenditures in ways that enhanced their programs’ content. For example, field trips are one way to use a lot of money quickly at the end of a program. While field trips can be an im-portant part of youth programs, they require thought about how young people will benefit. Pro-gram staff members recognized that planning a field trip at the last minute simply to use unex-pended funds was not the most effective use of money, and they appreciated the knowledge about their budgets that the initiative brought.
The initiative also made it possible for organizations to be more efficient, particularly when staff members from different programs within an organization were pulled together to dis-cuss how they could save money in ways that did not affect the organization’s mission. In inter-views, some staff members also commented on ways that SFM had increased the program staff’s creativity, particularly thanks to their involvement in team decision making. For example, a fi-nancial staff member from one organization indicated how the staff has cut costs creatively:
1The original research design ended data collection after 36 months. An additional year was added to that
original timeline to allow the research team to assess whether changes in financial practices persisted over time. It is possible that programs began to improve by the end of 48 months, but there were no baseline measure-ments with which to compare potential changes. The information on change to programs is therefore derived from interviews conducted during the research team’s visits to organizations.
35
We would also be going to our program staff and saying, “We’re going to have less money next year. How can we budget less for choreography? How can we reduce the costs associated with our holiday shows, our spring shows, our stage shows? How can we contain our costs for parade performances?” They have been much more resourceful. They got costumes donated one year. They’ve got-ten equipment and makeup for stage shows donated and [the costs of] lighting and sound reduced [by] working with their vendors and technical people.
Conclusions Overall, organizations in the customized learning organizations exhibited greater improve-ments in more areas than the group learning organizations. However, organizations in both models made significant improvements, and the findings suggest that the group learning model may be a cost-effective alternative. The costs of the two models will be explored later in this report. Also, while customized learning model organizations tended to show greater improve-ments in financial practices and team decision making than group learning organizations, there was substantial variation between the two groups in the pace of those changes, an issue dis-cussed in Chapter 4.

37
Chapter 4
Context Matters
The organizations involved in Strengthening Financial Management (SFM) made important gains in how well their financial offices were managed and in the degree to which they involved program staff members in financial decisions. Progress toward the initiative’s goals, however, was not consistent among organizations assigned to receive the group learning model of profes-sional development nor among those receiving the customized learning model. While all organ-izations showed at least some improvement, the degree and pace of that improvement varied. This chapter examines factors that facilitated or impeded progress toward the initiative’s goals. In particular, it provides a fuller discussion of how the Great Recession, turnover, and organiza-tional leadership influenced the course of the initiative. It also examines differences in progress between the two groups of organizations.
The Economy and the Initiative The Great Recession, which began in 2008, had a serious and lasting impact on many of the organizations involved in the SFM initiative. While only one of the organizations in the initia-tive closed its doors due to financial woes, all but one of the remaining organizations reported that the economy had negative consequences for them. In interviews, staff members at two-thirds of the organizations reported that payments from the State of Illinois arrived late, causing severe cash-flow problems, and about one-third of the organizations reported that their program budgets had been cut, resulting in program closures, staff layoffs, furloughs, and cuts to staff benefits, such as vacations and pension contributions. One organization’s board explicitly de-cided to run a deficit in order to keep program efforts at prerecession levels.
The most negative consequence of the recession for the initiative’s work was that or-ganizations involved in SFM focused on managing the fiscal crisis instead of program im-provement. Since the initiative aimed to foster higher-quality programs one might conclude that SFM was not successful, but such a conclusion would be too simplistic. Managing the fiscal crisis provided organizations with multiple opportunities to improve and hone financial skills that may, in a better fiscal environment, permit them to make programmatic improvements.
The Initiative’s Benefits in a Harsh Economy
The usefulness of cash-flow reports is one important example of how strengthened fi-nancial practices helped organizations in the initiative manage the recession. It is also an exam-ple of how conditions in the recession reinforced the messages and lessons conveyed by Fiscal
38
Management Associates (FMA). During the recession, the State of Illinois entered a deep fiscal crisis, and one way it managed that crisis was to lengthen the time between when it received invoices from nonprofit organizations and when it paid them. It became critical for organiza-tions to understand how these late payments affected their cash flows, and organizations were eager to produce more frequent and more helpful cash-flow reports. More frequent cash-flow projections allowed them to identify periods when they would need to draw on their cash re-serves and lines of credit, determine the best time to incur costs for major purchases, and plan fund-raising efforts.
FMA also encouraged organizations to consider contingency budgeting — that is, cre-ate budgets under different funding scenarios that permitted them to develop plans for what they would do if they did not receive public funding that they expected. Staff members from six of the organizations mentioned scenario or contingency budgeting during interviews, and staff members from five of those organizations indicated that learning how to budget this way had been one of the most helpful things they learned during the initiative. In benign economic con-ditions, such planning helps staff members steer their organizations’ development; in tough conditions, it can be critical in helping organizations survive. One group learning model chief financial officer (CFO) reported that her organization received templates from FMA to do sce-nario planning:
We asked our program managers to use the FMA template [to assess] how the agency could go through our toughest time in agency history. [We identified] worst, mid, least [budget-] cut scenarios [and] talked weekly about how to pre-pare [under each scenario].
Ironically, it was because the financial crisis was so severe that several organizations made so many changes to their financial practices. In other words, the drastic financial condi-tions emphasized the importance of the changes that the initiative was trying to achieve. Thus, progress toward the initiative’s goals was enhanced by the recession.
For example, one organization used scenario budgeting to involve program staff mem-bers in discussions about how the organization would manage deficits, which the staff decided would be through furloughs. Another organization’s staff brought two potential budgets to the board of directors because one of the organization’s major funding sources was on the state’s chopping block. The funding was continued, but the organization’s leader and financial staff members were relieved to have plans for what would happen if the funds were cut.
The recession also altered FMA’s plans for its work with organizations, albeit only slightly. Originally, FMA planned to have organizations select an issue that involved financial and programmatic concerns, such as whether or not it would make sense to start a new program, and then engage in scenario planning concerning that issue. FMA planned to use this scenario
39
planning exercise as an opportunity to enhance team decision making. It soon became clear, however, that the scenarios needed to focus on budgeting for the very real possibility that state funding would be cut. As a result, team decision making became a part of the regular budgeting process.
Increasingly late state payments led FMA to inform the organizations about a process for receiving expedited payments when their cash-flow positions became dire. That process al-lowed nonprofit organizations at risk of not making payroll to apply to the state to receive pay-ments before those payments would normally have been sent out. Early in the initiative, FMA encouraged organizations to apply for or increase lines of credit to cover this type of shortfall, and many of the organizations did so successfully. However, as the initial evaluation report on the initiative indicated, organizations began the initiative with an average of only a little more than a month’s payroll on hand.1 Most of the organizations were able to manage their finances with reserves or increased credit lines when state payments went from being paid within 90 days to being paid in 120 to 180 days, but a handful needed to resort to the expedited process.
The Influence of Staff Turnover
The last chapter described how rates of turnover changed little over the course of the in-itiative, although the rates for the group learning organizations decreased modestly. It also indi-cated that turnover was not always negative from the organizations’ perspectives. Almost 40 percent of the organizations reported that specific staff members’ departure facilitated progress toward SFM goals.
While turnover sometimes contributed to organizations’ progress in financial manage-ment, organizations that had increases in turnover during the initiative tended to show less pro-gress than those with less turnover. For example, nine organizations — a fairly equal mix of group learning and customized learning organizations — reported high turnover in the first two years of the initiative. Those high-turnover organizations showed positive improvements in about 55 percent of the outcome areas where they had room for improvement. In contrast, the 15 organizations with no or limited turnover showed improvement in about 80 percent of the outcome areas where they had room for improvement.
Turnover didn’t necessarily cause this difference. Yet qualitative information from in-terviews indicates that financial staff members who were reluctant to share financial infor-mation with program staff members or who did not have the skills to produce desired reports caused significant delays in progress. When these staff members were let go, progress on the initiative lagged even more, but then sped up when organizations hired replacements.
1Kotloff (2012).
40
The Influence of Organizational Leadership
SFM’s designers — FMA and the Wallace Foundation — assumed that good leader-ship would be an important factor in organizations’ ability to achieve the initiative’s goals. For that reason, organizations’ chief executive officers (CEOs) and CFOs were the key participants in both group learning and individual coaching sessions. Further, FMA’s annual reports noted repeatedly that strong leadership contributed to organizational change.
While the evaluation did not assess the SFM organizations’ leadership directly, early reports and comments by FMA staff members identified eight organizations that had especially strong or especially weak leadership. In addition, during their first two rounds of visits research-ers asked the CFOs and CEOs from 15 organizations why their organizations applied to the SFM initiative, and then assessed those responses. CEOs exhibited different levels of commit-ment and researchers rated them as having either “strong” or “modest” motivation to participate. Responses indicating that an organization applied because it was invited to or that the internal perception of the initiative was, “We may benefit, but we’ll have to wait and see,” were rated as having a modest motivation, as was the response of the leader who reported, “The number of other organizations involved, we didn’t want to be left behind our peers.” CEOs were rated as having strong motivation to participate if they indicated that SFM’s goals aligned closely with their organizational goals. These responses also sometimes included statements about how ex-cited the staff was to be included in the initiative. These data were all collected within a year of the start of the initiative.
The researchers then compared the strength of organizational leaders and their motiva-tion to become involved in the initiative with the proportion of four-year outcome areas in which the organizations made modest or larger gains.2 Table 4.1 shows that four of the organi-zations were rated as having strong leadership, and all four showed progress in 80 percent or more of the outcome areas where they had room to improve; on average, the four strong-leadership organizations improved in over 90 percent of these areas. It also shows that all four of the organizations assessed as having weak leadership showed progress in less than 80 percent of the outcome areas where they had room to improve; on average, these four organizations im-proved in less than 50 percent of these areas.
The findings were similar for motivation (see Table 4.2). Of the 10 organizations as-sessed as having a strong commitment to the initiative’s work, 8 showed progress in more than 80 percent of the outcome areas where they had room to improve. The 2 organizations that had weaker results had been rated as having weak leadership by FMA. Of the 5 organizations
2The researchers measured progress in outcome areas by excluding from the calculation outcome areas in which organizations had begun with very high levels and remained high. They then divided the number of out-come areas in which organizations made progress by the number of outcome areas in which they could have made progress.
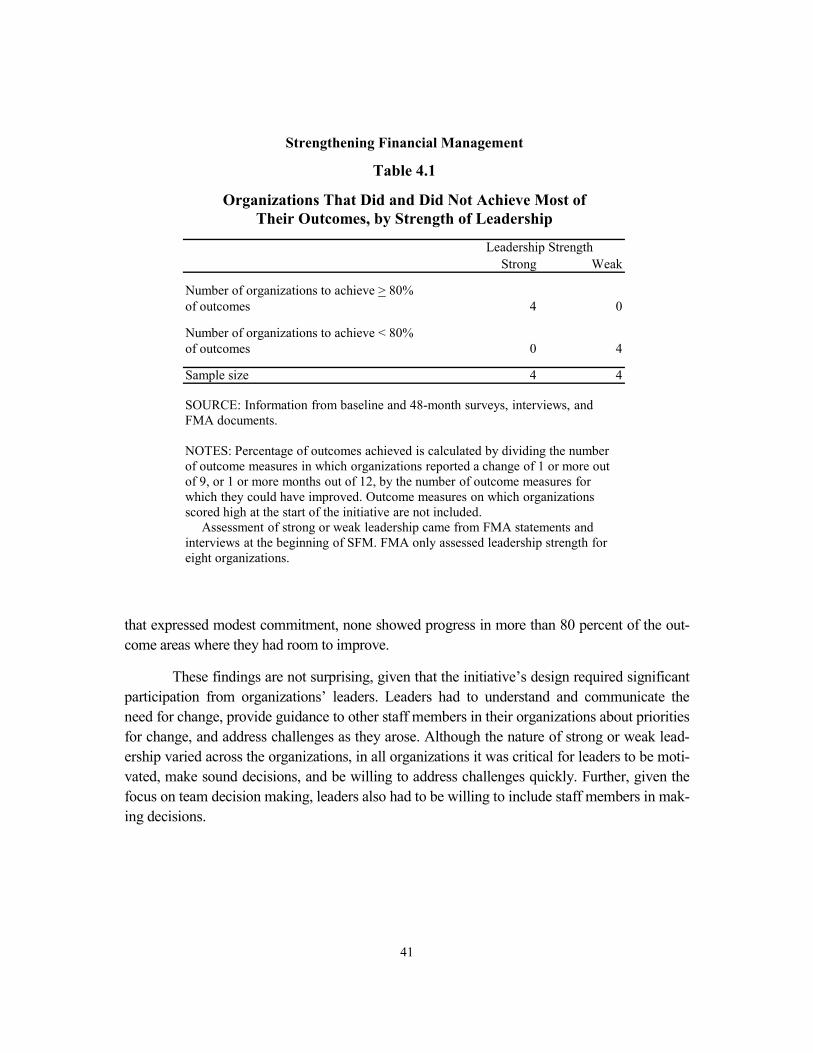
41
that expressed modest commitment, none showed progress in more than 80 percent of the out-come areas where they had room to improve.
These findings are not surprising, given that the initiative’s design required significant participation from organizations’ leaders. Leaders had to understand and communicate the need for change, provide guidance to other staff members in their organizations about priorities for change, and address challenges as they arose. Although the nature of strong or weak lead-ership varied across the organizations, in all organizations it was critical for leaders to be moti-vated, make sound decisions, and be willing to address challenges quickly. Further, given the focus on team decision making, leaders also had to be willing to include staff members in mak-ing decisions.
Strong Weak
Number of organizations to achieve > 80%of outcomes 4 0
Number of organizations to achieve < 80%of outcomes 0 4
Sample size 4 4
Strengthening Financial Management
Table 4.1
Leadership Strength
Organizations That Did and Did Not Achieve Most ofTheir Outcomes, by Strength of Leadership
SOURCE: Information from baseline and 48-month surveys, interviews, and FMA documents.
NOTES: Percentage of outcomes achieved is calculated by dividing the number of outcome measures in which organizations reported a change of 1 or more out of 9, or 1 or more months out of 12, by the number of outcome measures for which they could have improved. Outcome measures on which organizations scored high at the start of the initiative are not included.
Assessment of strong or weak leadership came from FMA statements and interviews at the beginning of SFM. FMA only assessed leadership strength for eight organizations.
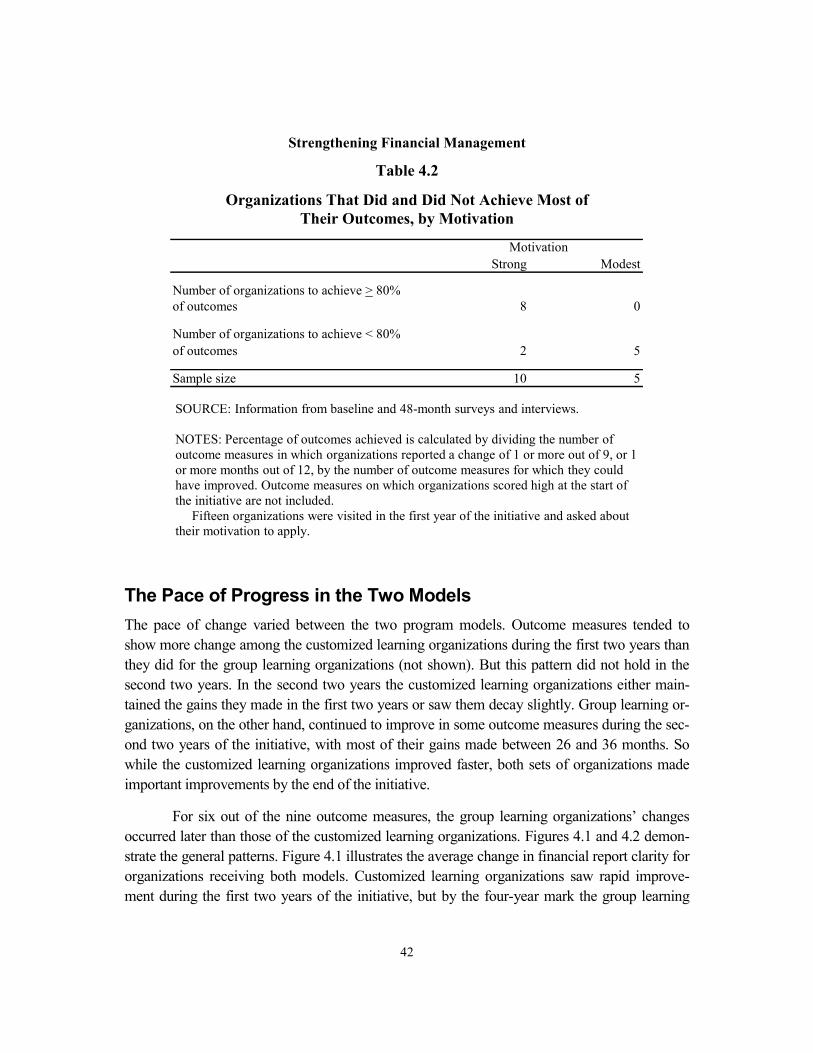
42
The Pace of Progress in the Two Models The pace of change varied between the two program models. Outcome measures tended to show more change among the customized learning organizations during the first two years than they did for the group learning organizations (not shown). But this pattern did not hold in the second two years. In the second two years the customized learning organizations either main-tained the gains they made in the first two years or saw them decay slightly. Group learning or-ganizations, on the other hand, continued to improve in some outcome measures during the sec-ond two years of the initiative, with most of their gains made between 26 and 36 months. So while the customized learning organizations improved faster, both sets of organizations made important improvements by the end of the initiative.
For six out of the nine outcome measures, the group learning organizations’ changes occurred later than those of the customized learning organizations. Figures 4.1 and 4.2 demon-strate the general patterns. Figure 4.1 illustrates the average change in financial report clarity for organizations receiving both models. Customized learning organizations saw rapid improve-ment during the first two years of the initiative, but by the four-year mark the group learning
Strong Modest
Number of organizations to achieve > 80%of outcomes 8 0
Number of organizations to achieve < 80%of outcomes 2 5
Sample size 10 5
Strengthening Financial Management
Table 4.2
Organizations That Did and Did Not Achieve Most of
Motivation
Their Outcomes, by Motivation
SOURCE: Information from baseline and 48-month surveys and interviews.
NOTES: Percentage of outcomes achieved is calculated by dividing the number of outcome measures in which organizations reported a change of 1 or more out of 9, or 1 or more months out of 12, by the number of outcome measures for which they could have improved. Outcome measures on which organizations scored high at the start of the initiative are not included.
Fifteen organizations were visited in the first year of the initiative and asked about their motivation to apply.
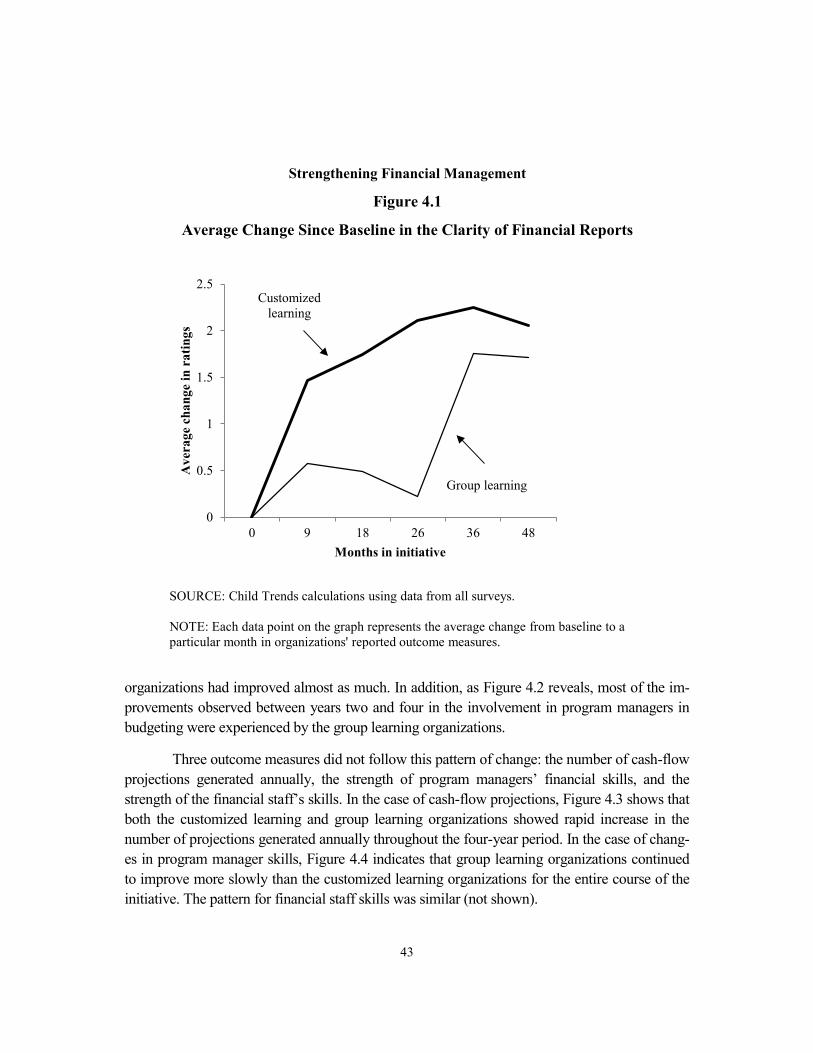
43
organizations had improved almost as much. In addition, as Figure 4.2 reveals, most of the im-provements observed between years two and four in the involvement in program managers in budgeting were experienced by the group learning organizations.
Three outcome measures did not follow this pattern of change: the number of cash-flow projections generated annually, the strength of program managers’ financial skills, and the strength of the financial staff’s skills. In the case of cash-flow projections, Figure 4.3 shows that both the customized learning and group learning organizations showed rapid increase in the number of projections generated annually throughout the four-year period. In the case of chang-es in program manager skills, Figure 4.4 indicates that group learning organizations continued to improve more slowly than the customized learning organizations for the entire course of the initiative. The pattern for financial staff skills was similar (not shown).
Average Change Since Baseline in the Clarity of Financial Reports
Figure 4.1
Strengthening Financial Management
SOURCE: Child Trends calculations using data from all surveys.
NOTE: Each data point on the graph represents the average change from baseline to a particular month in organizations' reported outcome measures.
Group learning
Customized learning
0
0.5
1
1.5
2
2.5
0 9 18 26 36 48
Ave
rage
cha
nge
in r
atin
gs
Months in initiative
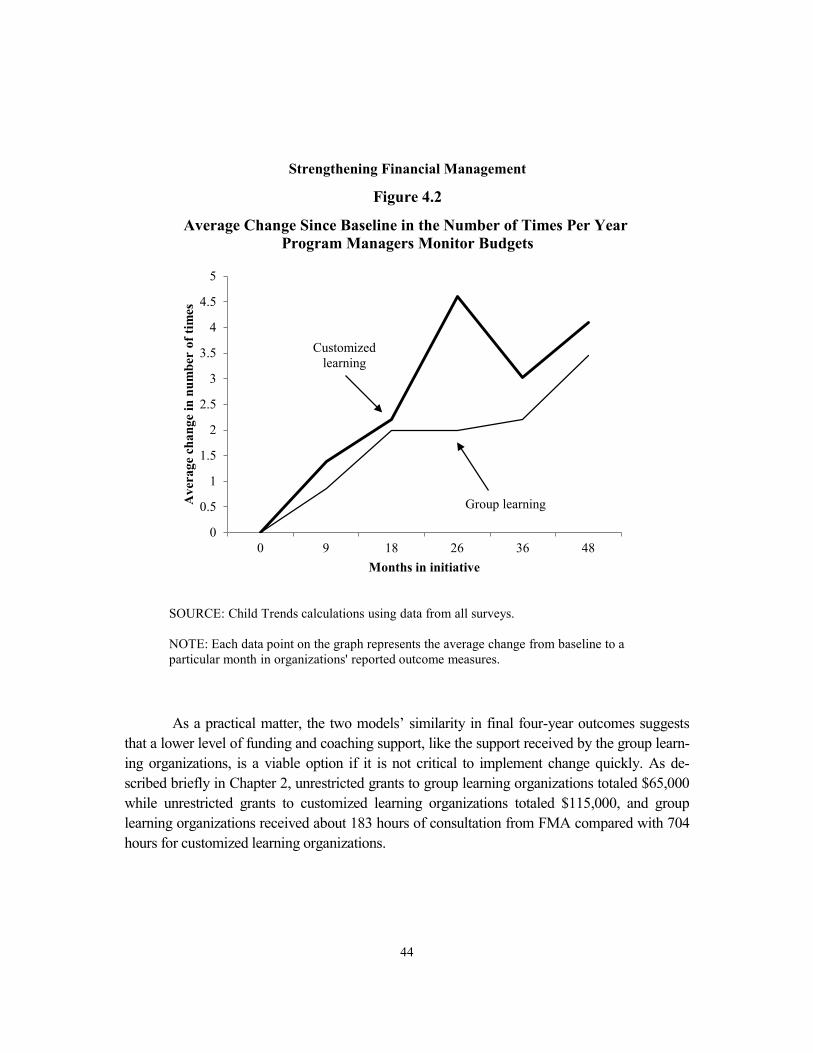
44
As a practical matter, the two models’ similarity in final four-year outcomes suggests that a lower level of funding and coaching support, like the support received by the group learn-ing organizations, is a viable option if it is not critical to implement change quickly. As de-scribed briefly in Chapter 2, unrestricted grants to group learning organizations totaled $65,000 while unrestricted grants to customized learning organizations totaled $115,000, and group learning organizations received about 183 hours of consultation from FMA compared with 704 hours for customized learning organizations.
Average Change Since Baseline in the Number of Times Per Year Program Managers Monitor Budgets
Figure 4.2
Strengthening Financial Management
Group learning
Customized learning
0
0.5
1
1.5
2
2.5
3
3.5
4
4.5
5
0 9 18 26 36 48
Ave
rage
cha
nge
in n
umbe
r of
tim
es
Months in initiative
SOURCE: Child Trends calculations using data from all surveys.
NOTE: Each data point on the graph represents the average change from baseline to a particular month in organizations' reported outcome measures.

45
As preliminary analyses of the data began to show that group learning sites made pro-gress later in the initiative than customized learning sites, the research team decided to investi-gate the issue by examining data to address two main questions:
• Why did the customized learning organizations improve more quickly? To answer this question, data from all visits to organizations were considered.
• Why did the group learning organizations show improvement later on? To address this question, the research team discussed these issues with group learning organizations during the team’s last visits to them.
Multiple factors contributed to the difference between the two groups in the pace of change, but two interrelated factors predominated. First, the customized learning organizations
Average Change Since Baseline in the Number of Cash-FlowProjections Per Year
Figure 4.3
Strengthening Financial Management
SOURCE: Child Trends calculations using data from all surveys.
NOTE: Each data point on the graph represents the average change from baseline to a particular month in organizations' reported outcome measures.
Group learning
Customized learning
0
1
2
3
4
5
6
7
8
0 9 18 26 36 48
Ave
rage
cha
nge
in n
umbe
r of
pro
ject
ions
Months in initiative
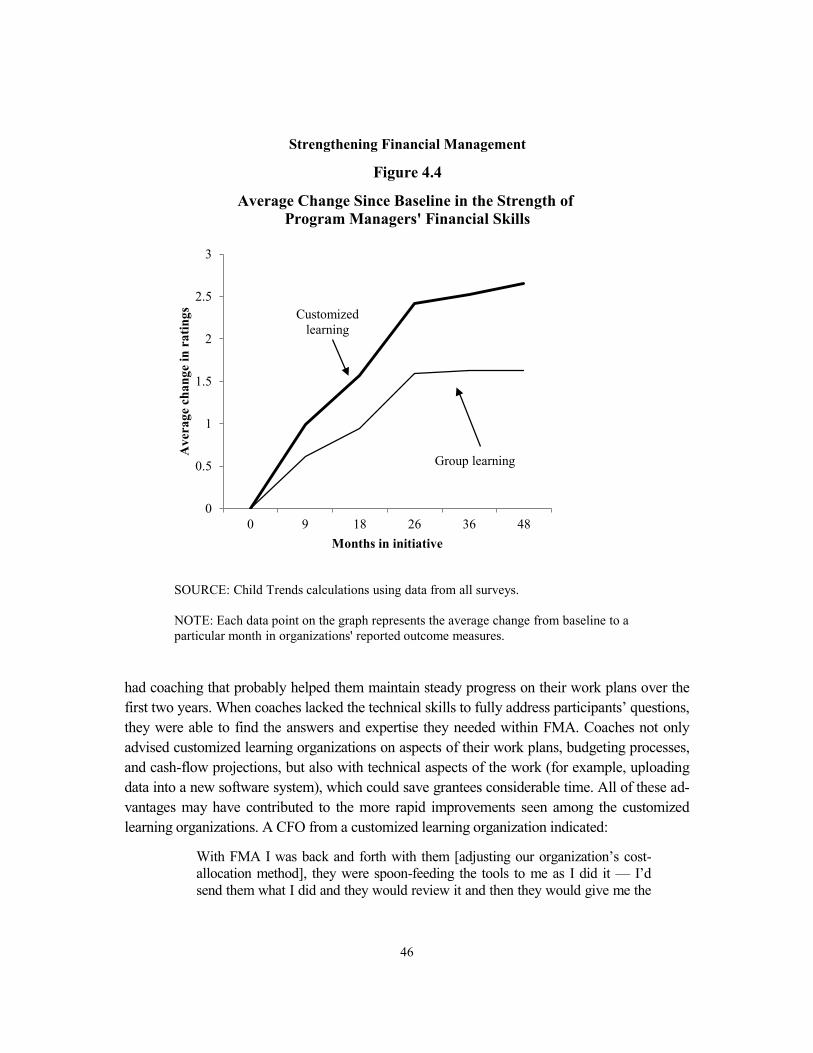
46
had coaching that probably helped them maintain steady progress on their work plans over the first two years. When coaches lacked the technical skills to fully address participants’ questions, they were able to find the answers and expertise they needed within FMA. Coaches not only advised customized learning organizations on aspects of their work plans, budgeting processes, and cash-flow projections, but also with technical aspects of the work (for example, uploading data into a new software system), which could save grantees considerable time. All of these ad-vantages may have contributed to the more rapid improvements seen among the customized learning organizations. A CFO from a customized learning organization indicated:
With FMA I was back and forth with them [adjusting our organization’s cost-allocation method], they were spoon-feeding the tools to me as I did it — I’d send them what I did and they would review it and then they would give me the
Program Managers' Financial SkillsAverage Change Since Baseline in the Strength of
Figure 4.4
Strengthening Financial Management
SOURCE: Child Trends calculations using data from all surveys.
NOTE: Each data point on the graph represents the average change from baseline to a particular month in organizations' reported outcome measures.
Group learning
Customized learning
0
0.5
1
1.5
2
2.5
3
0 9 18 26 36 48
Ave
rage
cha
nge
in r
atin
gs
Months in initiative
47
next part, etc. They are going to be here next Tuesday to feed me the next part, which is cash flow.
In contrast, group learning organizations did not receive this type of individual assis-tance. Group learning organizations were offered quarterly financial management workshops. Participants indicated that these sessions provided useful information about principles and prac-tices of financial management, and provided a space for sharing and discussion. However, the staff did not participate in rapid back-and-forth with coaches.
Second, the customized learning organizations received much more money at the start of the initiative ($115,000) than the group learning organizations ($40,000), and thus could spend money more quickly for labor and nonlabor expenses, software in particular. Group learning organizations’ staff members indicated that they had limited resources for software purchases, including new software, additional modules, and training. Their organizations some-times waited several years before being able to afford these items. In contrast, the customized learning organizations spent more money on nonlabor expenditures such as software and train-ing in the first two years of the initiative, enabling them to improve their reporting and other outcome areas earlier. The median group learning organization spent about $22,000 on nonlabor expenditures in the first two years of the initiative, whereas the median customized learning or-ganization spent about $63,000 in the same period.
During the last visits to their organizations, two group learning CEOs mentioned that lack of training in how to use software was a problem early on. As one of them said:
As far as FMA goes, we were lost for a time. We didn’t have anyone in the building who knew Fund EZ. FMA had to bring someone in to train everyone, not just finance but other directors and program managers, so we could have more people informed about the system.
In sum, the additional resources — both financial and consulting — provided to the customized learning organizations appeared to permit them to achieve their goals more quickly than the group learning organizations. Despite their resource limitations, however, the group learning organizations were sufficiently invested in strengthening their financial management practices to make changes over time.
The Persistence of Outcomes
A critical question in efforts to build organizations’ capabilities is the extent to which outcomes persist once they are achieved. Little research exists into whether or not organizations maintain new capabilities, although the common perception is that it is challenging for organi-zations to sustain change.3 The biggest threats to ensuring that benefits endure may be inade-
3Looney, Shaw, and Crabtree (2011).

48
quate support for change among top leaders, staff turnover, and ongoing — or renewed — staff resistance. As described in Chapter 2, FMA continued to provide less intensive assistance for about the second two years. The activities that took place during this time included:
• Three group learning sessions
• Semiannual check-ins for customized learning organizations, conducted by their financial coaches
• Two user-group sessions tailored to financial software users
FMA invested substantially less in each organization over the last two years of the initi-ative than it did in the first two years: approximately 95 percent of FMA’s investments in the organizations were made during the initiative’s first two years. Coaching ended, apart from the semiannual check-ins. If organizations wanted to use their coaches, they paid for those services directly, but of the 24 organizations, only 6 paid consultants (FMA or others) in the last two years of the initiative.
This study is one of very few that examines whether changes made through profession-al development persist or decay over time. Table 4.3 reveals slight to modest decays in outcome levels for the customized learning organizations in four areas: number of cash-flow projections produced in a year, report clarity, program managers’ involvement in budget monitoring, and the amount of time CEOs spend on strategic thinking. None of these declines was statistically significant. Group learning organizations, on the other hand, showed slight but not statistically significant declines in financial and program staff skills, in the usefulness of their software, and in staff turnover, and positive changes for all other outcomes.
The stability of the customized learning organizations’ outcome levels over time and the increases in levels for the group learning organizations were both unexpected and hearten-ing. To some degree, these efforts to sustain change were built into the initiative’s activities. The group learning organizations received a payment of $25,000 at the end of the first two years to enable them to continue to work on their financial management; staff members from six or-ganizations used the funds for training provided by FMA, one organization bought additional software, and another paid for additional training on how to use the financial software it had bought earlier in the initiative.
FMA also encouraged organizations to write changes in policies and procedures into their manuals and job descriptions, another way of sustaining those changes. As Table 4.3 indi-cates, over the initiative’s four years there was some improvement in the percentage of organi-zations that had updated policies and procedures manuals and job descriptions for all staff

Outcome MeasureCustomized
learningGroup
learningCustomized
learningGroup
learning
Finance office practiceChange in mean number of cash-flow projections per yeara 3.7 ** 3.1 * -0.1 2.3
Change in mean number of weeks cash flow is projected -1.0 0.6 9.5 9.0Change in usefulness of software (1 = low; 9 = high) 1.1 * 1.5 ** 0.7 -0.4Change in strength of the financial staff's skills (1 = low; 9 = high) 1.5 *** 1.2 * 0.5 -0.5Change in clarity of financial reports (1 = low; 9 = high) 2.1 ** 0.2 -0.1 1.3
Team decision making to support strong financial managementChange in strength of the program staff's financial skills 2.4 **** 1.6 *** 0.2 -0.1Change in number of times program managers are involvedin budget monitoring each year 4.6 ** 2.0 -0.5 0.2
Organizational stability and qualityChange in percentage of staff members hired in the past year -12.5 4.5 6.5 -8.4Change in percentage of time CEO reported thinking strategically 11.4 * 1.8 -8.6 8.0
Table 4.3
Strengthening Financial Management
Initiative Beginning to Two-Year Mark
Two-Year Mark to Four-Year Mark
Changes in Outcome Measures, by Model and Intervention Period
SOURCE: Child Trends calculations using survey data.
NOTE: Statistical significance levels are indicated as: **** = 0.1 percent; *** = 1 percent; ** = 5 percent; * = 10 percent.aTo calculate the number of cash flow projections produced per year, answers were recoded: monthly = 12; quarterly = 4;
semiannually = 2; annually = 1; infrequently = 0.5; not at all = 0.
49
50
members: An additional 14.3 percent of customized learning organizations and 22.2 percent of group learning organizations had updated their policies and procedures manuals.
Finally, some of the changes were built into organizations’ accounting systems and saved organizations enough time or money that they were unlikely to backslide. For example, centralized and better organized charts of accounts eased one organization’s accountants’ work-loads. Similarly, organizations that automated their invoicing decreased the staff time spent on the task while increasing accuracy, and thus were unlikely to abandon the practice. Sustaining other changes, however, was more challenging.
Outcomes That Were Challenging to Maintain
Outcome levels related to team decision making were unstable over time even if the overall trajectory was positive across organizations (tables not shown). That instability suggest-ed that change in this area was challenging and that it might decay in the future. In interviews, staff members noted that communications and meetings between financial and program staff members, while useful, might be difficult to sustain when people were busy. Participants noted the importance of having open communication between the financial and development depart-ments, but also shared that this communication still needed to be improved. One CEO shared that communication might improve once the economy got better and more program staff mem-bers could be hired, easing the burden on each of them and giving them more time to be in-volved in financial tasks. That CEO added:
In terms of hardest things to sustain, it’s probably the best level of communica-tion between facilities, program, and finance. When things get busy it’s hard to keep meetings scheduled. I probably need to do some thinking around how to structure the meetings so they happen at the same time or on the same day.
Staff members also said that consultants’ recommendation that financial and program staff members meet monthly was not always practical given the structure of some programs; those staff members did not perceive the decrease in the number of such meetings as decay, but as an adjustment to the realities of an after-school program calendar. Finally, turnover among program directors and financial staff members resulted in a loss of information and motivation to keep communications going. This indicates that it was more challenging to change office cul-ture and staff behavior than to improve staff knowledge and skills or increase reporting frequen-cy. In several organizations executive staff members reported that it was time-consuming to train program managers to think about budgets.

51
Conclusions Both economic conditions and organizational characteristics influenced how SFM unfolded. The Great Recession, which started about a year before the initiative began and lasted through much of the initiative, appeared to underscore the importance of financial management and pro-vided organizations with many opportunities to put into practice the new strategies they learned. Unfortunately, those same conditions impeded the organizations’ progress toward improving their programs — the ultimate goal of the initiative — because the organizations’ leaders and managers had to spend so much effort responding to the financial crisis.
As to organizational characteristics, the strength of organizations’ leaders and their mo-tivations for joining the initiative both appeared to be quite important. These two characteristics predicted success among both the group learning and customized learning organizations. On the other hand, turnover slowed progress toward SFM goals, even if that turnover was desirable (that is, even when it resulted in a more skilled or more cooperative staff).
In general, customized learning organizations improved more quickly than the group learning organizations. The former organizations received larger financial investments in profes-sional development and grants to support their work, and it is likely that those differences were partially responsible for the differences in progress between the models. Group learning organi-zations not only received less money for their participation in the initiative, they also received their funding at two points in time: at the start of the initiative and after the first two years. Not surprisingly, then, the group learning organizations not only achieved less change than the cus-tomized learning organizations (as described in Chapter 3), but also achieved change more slow-ly. What was surprising was that in the end they achieved only slightly lower levels of change.
Desired outcomes persisted over the four years of the research even though there was a sharp decline in professional development activities after the first two years of the initiative. Several reasons seem to account for the persistence:
• Changes in financial software, including the automation of routine tasks, re-sulted in efficiencies that staff members appreciated.
• Changes to financial offices’ procedures were documented, increasing the likelihood that they would persist.
• New job descriptions incorporated language about the financial responsibili-ties of program staff members, not just financial staff members.
The next chapter explores the cost of the initiative more systematically. It discusses how the pattern of investments — especially the investments of time made by the organizations to effect these changes — relates to the pattern of change.

53
Chapter 5
The Cost of Professional Development in Strengthening Financial Management
Increasingly, public and private funders recognize that the overall financial strength of organiza-tions is important in ensuring that programs for children and young people are of high quality, that they are sustainable, and that the organizations that provide them can respond effectively to changing conditions and environments.1 Little, however, is known about the amount of time and money needed to create lasting improvement in an organization’s financial management. This chapter examines the amounts of time and money the organizations participating in the Strengthening Financial Management (SFM) initiative spent over its four years.
SFM was, without doubt, an intense learning intervention — even the less intensive group learning model required substantial investments. Chapters 3 and 4 demonstrated that the initiative appeared to help financial and executive staff members create substantial and long-lasting changes in their organizations’ financial management. But funders and practitioners must also understand the costs of this professional and organizational development if they are to gauge the level of investment needed to induce permanent change. SFM offers an opportunity to gain important insights into the costs and consequences of two different professional devel-opment strategies.
This chapter examines how patterns of expenditures are related to outcomes. The first section compares the costs of the group learning organizations with those of the customized learning organizations, examining costs from three perspectives:
• Grant investments made by the funder
• Professional development provided by Fiscal Management Associates (FMA)
• Total value of the organizations’ spending on the initiative, including labor and purchased items
Next, the chapter examines the patterns of investment over time. Chapter 4 showed that outcome measures changed at different paces for the group learning and customized learning organizations. Were these differences in when change occurred due to the different patterns of Wallace Foundation investments?
1Gregory and Howard (2009).
54
Finally, the chapter addresses the question of investment and outcomes. In particular, there was great variation in the number of hours that organizations reported spending on the initiative. Did organizations that reported spending more time on the initiative also have better outcomes?
Initiative Resource Costs: Professional Development, Labor, and Nonlabor Expenditures As described in Chapter 2, at the start of the SFM initiative the Wallace Foundation hired FMA to assist the organizations and provided them with grants to support their efforts: a $115,000 grant to each of the customized learning organizations followed by $125,000 for its cash re-serves upon completion of its work plan within two years, and $40,000 to each of the group learning organizations followed by a $25,000 grant upon completion of its work plan. The Wal-lace Foundation paid directly for FMA’s expenses.
The foundation’s grants to the organizations were unrestricted — that is, organizations could use the money as they wished — but they were generally intended to cover three catego-ries of expenditures:
• Staff time spent attending professional development activities related to the initiative
• Staff time developing and implementing steps of the work plans created through the initiative
• Nonlabor expenses (for example, software purchases, upgrades, and consult-ing) associated with the initiative
However, the present research does not assume that the Wallace Foundation’s grant amounts and payments to FMA represent the whole of the resources actually used by both FMA and the organizations to strengthen organizations’ financial management. Instead, researchers interviewed FMA and the organizations’ chief financial officers (CFOs) every 9 to 12 months about how much time and money they spent on the initiative.2 The amounts discussed in this chapter summarize these responses, not the grant amounts. See Box 5.1 for a fuller explanation of the information collected for this study and its presentation.
2In most cases, the researchers’ calculations yielded amounts approximately equal to organizations’ total
grant amounts.
55
Box 5.1 About the Research for the Cost Study
The research team collected cost information from the Wallace Foundation, FMA, and the or-ganizations involved in the initiative.
From the Wallace Foundation: Information on the amount and timing of the grants provided to each of the organizations.
• Group learning organizations received $40,000 at the beginning of the initiative and $25,000 once they had completed their work plans, for a total of $65,000.
• Customized learning organizations received $115,000 at the beginning of the initiative. (They also received $125,000 for their cash reserves if they completed their work plans within two years, but that amount is not included in the calculations that compare costs in this chapter.)
From FMA: Information on the time FMA devoted to the initiative.
• The research team calculated the hours of professional development offered to each organ-ization, including both consulting and group learning time. Group learning time was allo-cated among organizations as a proportion of the hours that FMA spent preparing for and giving each session. Thus, if an FMA staff member gave a workshop to 10 organizations and spent 30 hours on the workshop, then each organization would be considered to have received 3 hours of FMA’s time.
• Labor costs, including overhead and fringe benefit costs, were calculated based on those hours.
From organizations: Information on the time and money organizations spent on SFM activi-ties.
• Organizations provided the number of hours spent by each staff member involved in the initiative.
• The research team calculated labor costs by multiplying the hours spent by various staff members on the initiative by those staff members’ hourly rates, including fringe benefits.
• Organizations provided information on expenditures for items such as software.
Information from the cost study is presented in both dollars and hours. The dollar cost provides a single measure that permits comparisons between the two models with respect to labor and nonlabor expenditures. It has a disadvantage, however, because most of the initiative’s costs were labor costs, which vary across the United States. Therefore, when possible information on the number of hours expended is provided, so that readers can estimate the cost of providing this type of effort in their own communities.
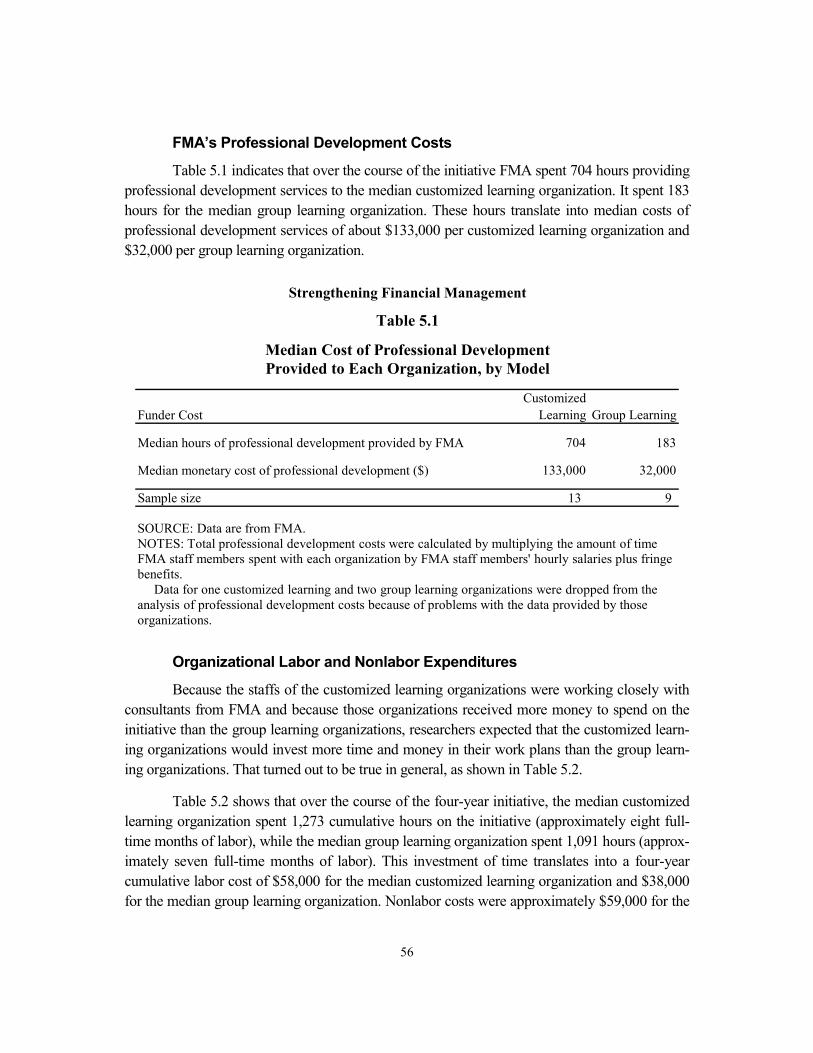
56
FMA’s Professional Development Costs
Table 5.1 indicates that over the course of the initiative FMA spent 704 hours providing professional development services to the median customized learning organization. It spent 183 hours for the median group learning organization. These hours translate into median costs of professional development services of about $133,000 per customized learning organization and $32,000 per group learning organization.
Organizational Labor and Nonlabor Expenditures
Because the staffs of the customized learning organizations were working closely with consultants from FMA and because those organizations received more money to spend on the initiative than the group learning organizations, researchers expected that the customized learn-ing organizations would invest more time and money in their work plans than the group learn-ing organizations. That turned out to be true in general, as shown in Table 5.2.
Table 5.2 shows that over the course of the four-year initiative, the median customized learning organization spent 1,273 cumulative hours on the initiative (approximately eight full-time months of labor), while the median group learning organization spent 1,091 hours (approx-imately seven full-time months of labor). This investment of time translates into a four-year cumulative labor cost of $58,000 for the median customized learning organization and $38,000 for the median group learning organization. Nonlabor costs were approximately $59,000 for the
Funder CostCustomized
Learning Group Learning
Median hours of professional development provided by FMA 704 183
Median monetary cost of professional development ($) 133,000 32,000
Sample size 13 9
Strengthening Financial Management
Table 5.1
Median Cost of Professional DevelopmentProvided to Each Organization, by Model
SOURCE: Data are from FMA. NOTES: Total professional development costs were calculated by multiplying the amount of time FMA staff members spent with each organization by FMA staff members' hourly salaries plus fringe benefits.
Data for one customized learning and two group learning organizations were dropped from the analysis of professional development costs because of problems with the data provided by those organizations.
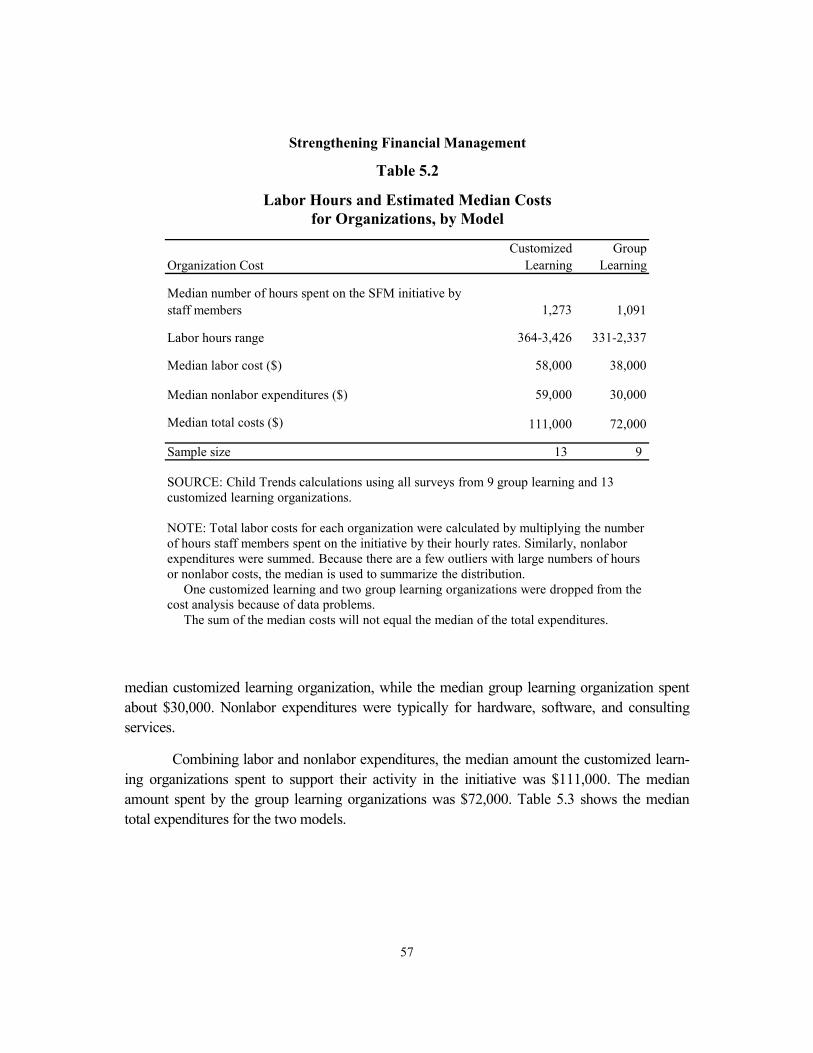
57
median customized learning organization, while the median group learning organization spent about $30,000. Nonlabor expenditures were typically for hardware, software, and consulting services.
Combining labor and nonlabor expenditures, the median amount the customized learn-ing organizations spent to support their activity in the initiative was $111,000. The median amount spent by the group learning organizations was $72,000. Table 5.3 shows the median total expenditures for the two models.
Organization CostCustomized
LearningGroup
Learning
Median number of hours spent on the SFM initiative by staff members 1,273 1,091
Labor hours range 364-3,426 331-2,337
Median labor cost ($) 58,000 38,000
Median nonlabor expenditures ($) 59,000 30,000
Median total costs ($) 111,000 72,000
Sample size 13 9
Strengthening Financial Management
Table 5.2
Labor Hours and Estimated Median Costsfor Organizations, by Model
SOURCE: Child Trends calculations using all surveys from 9 group learning and 13 customized learning organizations.
NOTE: Total labor costs for each organization were calculated by multiplying the number of hours staff members spent on the initiative by their hourly rates. Similarly, nonlabor expenditures were summed. Because there are a few outliers with large numbers of hours or nonlabor costs, the median is used to summarize the distribution.
One customized learning and two group learning organizations were dropped from the cost analysis because of data problems.
The sum of the median costs will not equal the median of the total expenditures.
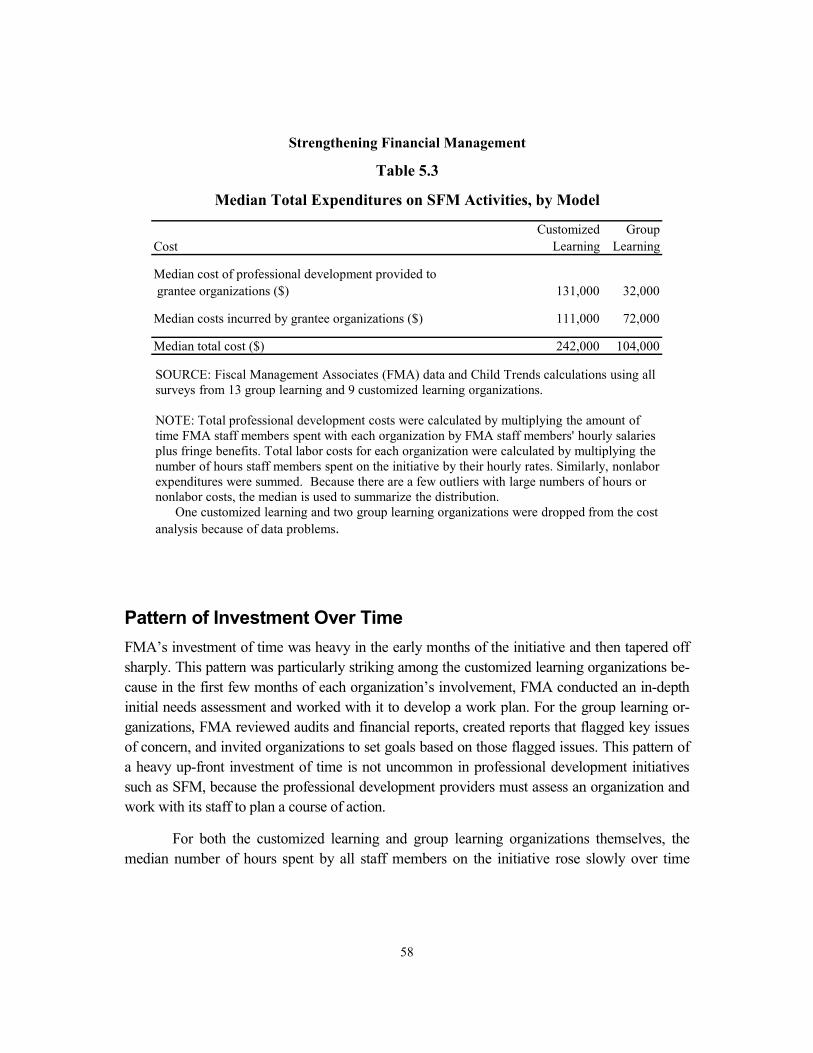
58
Pattern of Investment Over Time FMA’s investment of time was heavy in the early months of the initiative and then tapered off sharply. This pattern was particularly striking among the customized learning organizations be-cause in the first few months of each organization’s involvement, FMA conducted an in-depth initial needs assessment and worked with it to develop a work plan. For the group learning or-ganizations, FMA reviewed audits and financial reports, created reports that flagged key issues of concern, and invited organizations to set goals based on those flagged issues. This pattern of a heavy up-front investment of time is not uncommon in professional development initiatives such as SFM, because the professional development providers must assess an organization and work with its staff to plan a course of action.
For both the customized learning and group learning organizations themselves, the median number of hours spent by all staff members on the initiative rose slowly over time
CostCustomized
LearningGroup
Learning
Median cost of professional development provided to grantee organizations ($) 131,000 32,000
Median costs incurred by grantee organizations ($) 111,000 72,000
Median total cost ($) 242,000 104,000
Strengthening Financial Management
Table 5.3
Median Total Expenditures on SFM Activities, by Model
SOURCE: Fiscal Management Associates (FMA) data and Child Trends calculations using all surveys from 13 group learning and 9 customized learning organizations.
NOTE: Total professional development costs were calculated by multiplying the amount of time FMA staff members spent with each organization by FMA staff members' hourly salaries plus fringe benefits. Total labor costs for each organization were calculated by multiplying the number of hours staff members spent on the initiative by their hourly rates. Similarly, nonlabor expenditures were summed. Because there are a few outliers with large numbers of hours or nonlabor costs, the median is used to summarize the distribution.
One customized learning and two group learning organizations were dropped from the cost analysis because of data problems.

59
through 36 months, falling precipitously during the last year of the initiative (See Figure 5.1). 3 Within this general pattern, however, there was a difference between the two groups both in the rate of increase and the total amount of labor spent between months 18 to 26. Through month 18, the customized learning organizations invested more time in the initiative. But as the first phase of the initiative came to a close the customized learning organizations’ activity slowed, perhaps because they had achieved the goals they needed to qualify for their second-phase grant of $125,000 for a cash reserve. The group learning organizations, however, experi-enced no such dip.
3The hours each individual in an organization spent on the initiative was reported by the CFO each time
the organizations were surveyed.
Median Hours Spent Per Period on SFM by All Staff Members
Figure 5.1
Strengthening Financial Management
70
152186
118
301
14
102 106130
212
347
40
50
100
150
200
250
300
350
400
0 9 18 26 36 48
Med
ian
num
ber
of h
ours
Months in initiative
Customized learning Group learning
SOURCE: Child Trends calculations using all surveys.
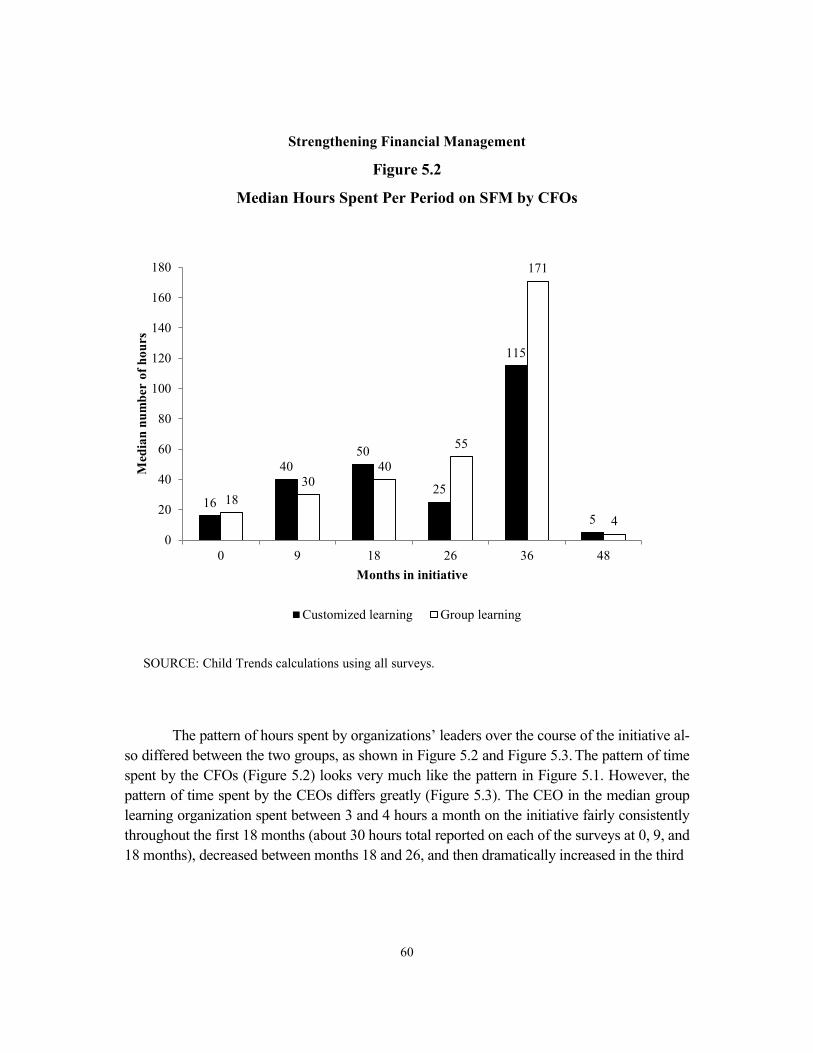
60
The pattern of hours spent by organizations’ leaders over the course of the initiative al-so differed between the two groups, as shown in Figure 5.2 and Figure 5.3. The pattern of time spent by the CFOs (Figure 5.2) looks very much like the pattern in Figure 5.1. However, the pattern of time spent by the CEOs differs greatly (Figure 5.3). The CEO in the median group learning organization spent between 3 and 4 hours a month on the initiative fairly consistently throughout the first 18 months (about 30 hours total reported on each of the surveys at 0, 9, and 18 months), decreased between months 18 and 26, and then dramatically increased in the third
Median Hours Spent Per Period on SFM by CFOs
Figure 5.2
Strengthening Financial Management
16
4050
25
115
518
3040
55
171
40
20
40
60
80
100
120
140
160
180
0 9 18 26 36 48
Med
ian
num
ber
of h
ours
Months in initiative
Customized learning Group learning
SOURCE: Child Trends calculations using all surveys.
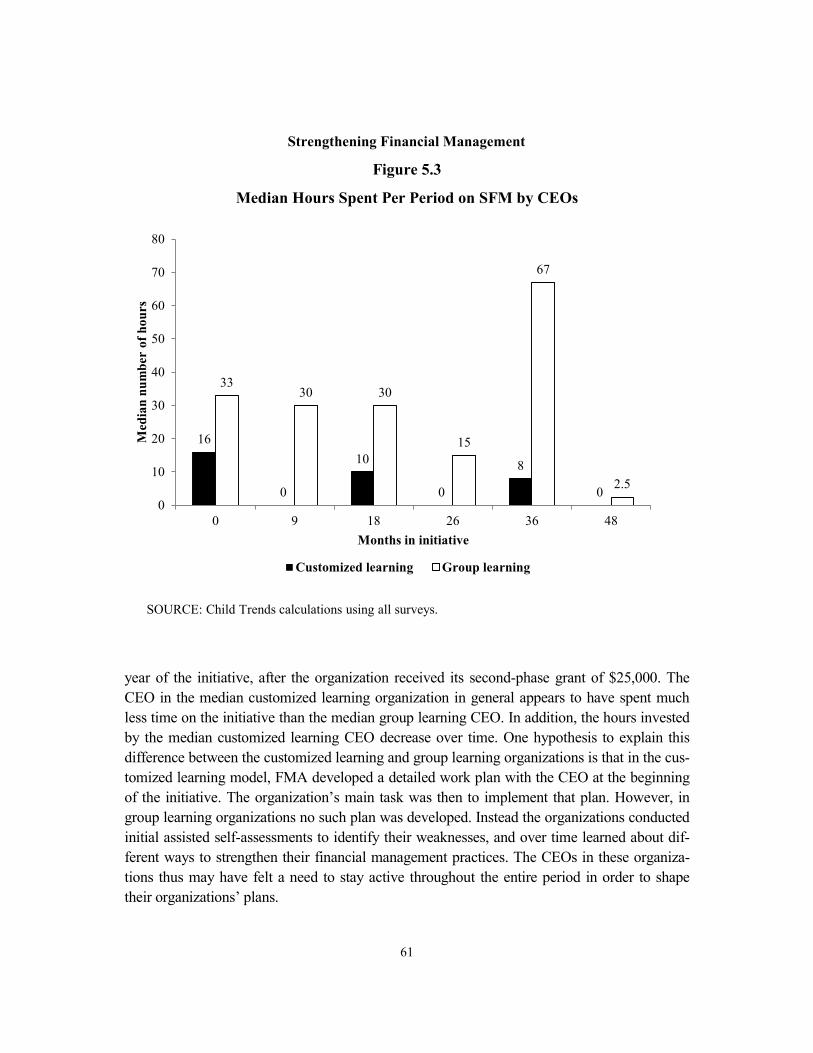
61
year of the initiative, after the organization received its second-phase grant of $25,000. The CEO in the median customized learning organization in general appears to have spent much less time on the initiative than the median group learning CEO. In addition, the hours invested by the median customized learning CEO decrease over time. One hypothesis to explain this difference between the customized learning and group learning organizations is that in the cus-tomized learning model, FMA developed a detailed work plan with the CEO at the beginning of the initiative. The organization’s main task was then to implement that plan. However, in group learning organizations no such plan was developed. Instead the organizations conducted initial assisted self-assessments to identify their weaknesses, and over time learned about dif-ferent ways to strengthen their financial management practices. The CEOs in these organiza-tions thus may have felt a need to stay active throughout the entire period in order to shape their organizations’ plans.
Median Hours Spent Per Period on SFM by CEOs
Figure 5.3
Strengthening Financial Management
16
0
10
0
8
0
3330 30
15
67
2.50
10
20
30
40
50
60
70
80
0 9 18 26 36 48
Med
ian
num
ber
of h
ours
Months in initiative
Customized learning Group learning
SOURCE: Child Trends calculations using all surveys.
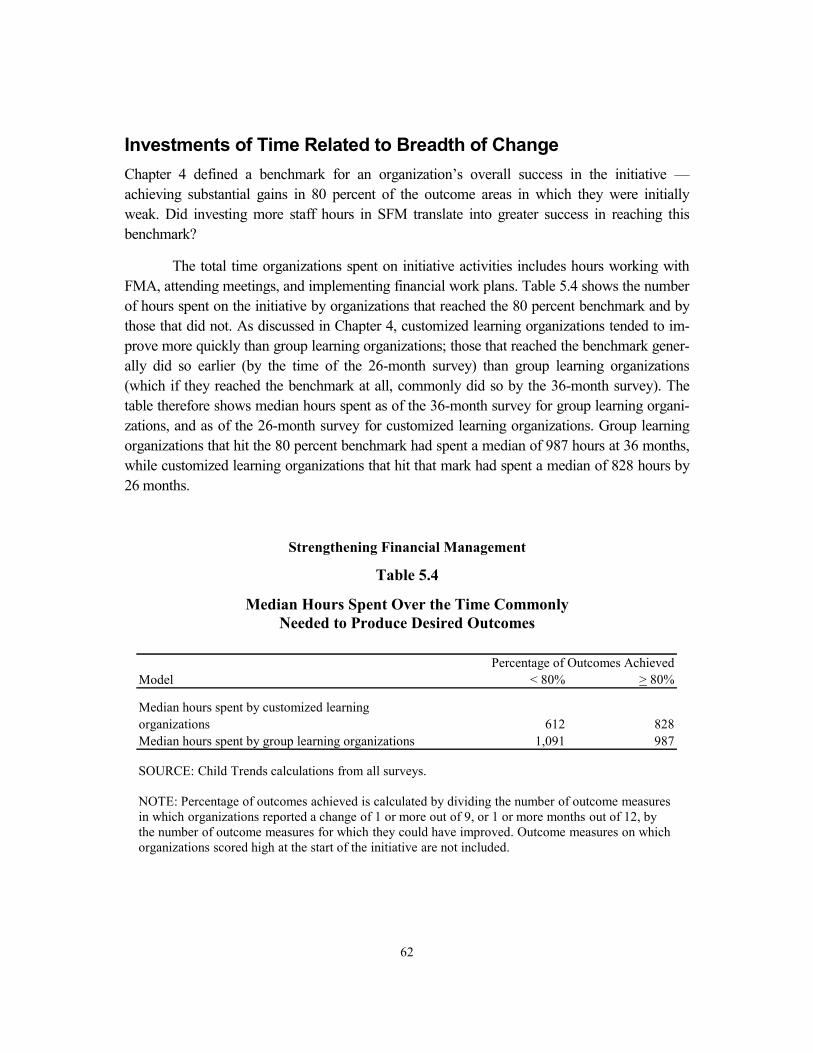
62
Investments of Time Related to Breadth of Change Chapter 4 defined a benchmark for an organization’s overall success in the initiative —achieving substantial gains in 80 percent of the outcome areas in which they were initially weak. Did investing more staff hours in SFM translate into greater success in reaching this benchmark?
The total time organizations spent on initiative activities includes hours working with FMA, attending meetings, and implementing financial work plans. Table 5.4 shows the number of hours spent on the initiative by organizations that reached the 80 percent benchmark and by those that did not. As discussed in Chapter 4, customized learning organizations tended to im-prove more quickly than group learning organizations; those that reached the benchmark gener-ally did so earlier (by the time of the 26-month survey) than group learning organizations (which if they reached the benchmark at all, commonly did so by the 36-month survey). The table therefore shows median hours spent as of the 36-month survey for group learning organi-zations, and as of the 26-month survey for customized learning organizations. Group learning organizations that hit the 80 percent benchmark had spent a median of 987 hours at 36 months, while customized learning organizations that hit that mark had spent a median of 828 hours by 26 months.
Model < 80% > 80%
Median hours spent by customized learning organizations 612 828Median hours spent by group learning organizations 1,091 987
Strengthening Financial Management
Table 5.4
Median Hours Spent Over the Time Commonly
Percentage of Outcomes Achieved
Needed to Produce Desired Outcomes
SOURCE: Child Trends calculations from all surveys.
NOTE: Percentage of outcomes achieved is calculated by dividing the number of outcome measures in which organizations reported a change of 1 or more out of 9, or 1 or more months out of 12, by the number of outcome measures for which they could have improved. Outcome measures on which organizations scored high at the start of the initiative are not included.
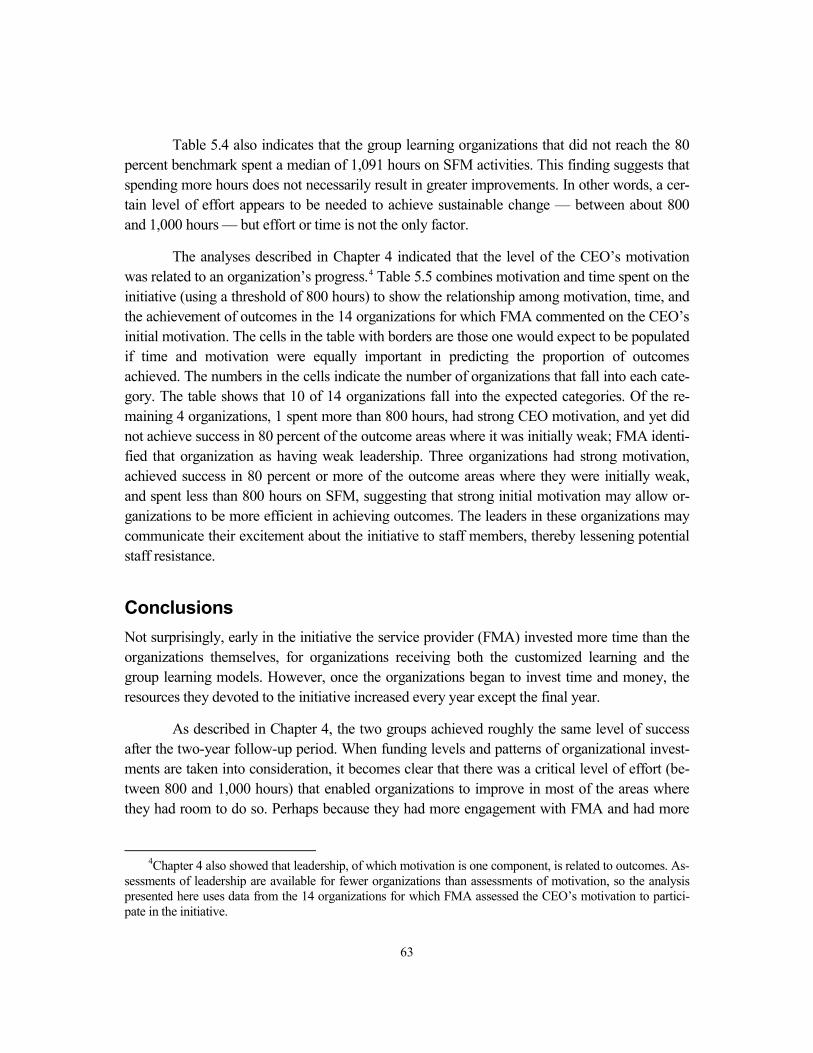
63
Table 5.4 also indicates that the group learning organizations that did not reach the 80 percent benchmark spent a median of 1,091 hours on SFM activities. This finding suggests that spending more hours does not necessarily result in greater improvements. In other words, a cer-tain level of effort appears to be needed to achieve sustainable change — between about 800 and 1,000 hours — but effort or time is not the only factor.
The analyses described in Chapter 4 indicated that the level of the CEO’s motivation was related to an organization’s progress.4 Table 5.5 combines motivation and time spent on the initiative (using a threshold of 800 hours) to show the relationship among motivation, time, and the achievement of outcomes in the 14 organizations for which FMA commented on the CEO’s initial motivation. The cells in the table with borders are those one would expect to be populated if time and motivation were equally important in predicting the proportion of outcomes achieved. The numbers in the cells indicate the number of organizations that fall into each cate-gory. The table shows that 10 of 14 organizations fall into the expected categories. Of the re-maining 4 organizations, 1 spent more than 800 hours, had strong CEO motivation, and yet did not achieve success in 80 percent of the outcome areas where it was initially weak; FMA identi-fied that organization as having weak leadership. Three organizations had strong motivation, achieved success in 80 percent or more of the outcome areas where they were initially weak, and spent less than 800 hours on SFM, suggesting that strong initial motivation may allow or-ganizations to be more efficient in achieving outcomes. The leaders in these organizations may communicate their excitement about the initiative to staff members, thereby lessening potential staff resistance.
Conclusions Not surprisingly, early in the initiative the service provider (FMA) invested more time than the organizations themselves, for organizations receiving both the customized learning and the group learning models. However, once the organizations began to invest time and money, the resources they devoted to the initiative increased every year except the final year.
As described in Chapter 4, the two groups achieved roughly the same level of success after the two-year follow-up period. When funding levels and patterns of organizational invest-ments are taken into consideration, it becomes clear that there was a critical level of effort (be-tween 800 and 1,000 hours) that enabled organizations to improve in most of the areas where they had room to do so. Perhaps because they had more engagement with FMA and had more
4Chapter 4 also showed that leadership, of which motivation is one component, is related to outcomes. As-
sessments of leadership are available for fewer organizations than assessments of motivation, so the analysis presented here uses data from the 14 organizations for which FMA assessed the CEO’s motivation to partici-pate in the initiative.
64
readily available grant funds early on, the customized learning organizations were able to spend more time on the initiative in the first two years (about 800 hours) and were able to achieve suc-cess earlier than the group learning organizations. The group learning organizations ultimately achieved similar results, but did so later in the initiative and at the cost of slightly more effort (about 1,000 hours).
These findings suggest that from a funder’s point of view the group learning model of professional development appears to provide good value as long as it is not urgent to effect change quickly.
CEO Motivation < 80% >80%
Strong motivation<800 hours 1 3>800 hours 1 4
Modest motivation<800 hours 3 0>800 hours 2 0
Strengthening Financial Management
Table 5.5
Organizations That Achieved Desired Outcomes, by CEO's Motivation and Time Spent
Percentage of Outcomes Achieved
SOURCE: Child Trends calculations from all surveys were used to determine the hours organizations spent on the initiative. The CEO's motivation level at baseline was noted by FMA.
NOTE: The CEO's motivation level at baseline was noted by the researchers for 14 of the 25 organizations. Percentage of outcomes achieved is calculated by dividing the number of outcome measures in which organizations reported a change of 1 or more out of 9, or 1 or more months out of 12, by the number of outcome measures for which they could have improved. Outcome measures on which organizations scored high at the start of the initiative are not included.
Borders indicate cells that one would expect to be populated if time and motivation were equally important in predicting the proportion of outcomes achieved.
65
Chapter 6
Policy Challenges and Efforts to Address Them
The financial health of nonprofit organizations does not simply depend on their internal financial management practices and the health of the economy. Other external factors, like funder re-quirements and the regulatory environment, have a profound effect on organizations’ well-being. Indeed, a common complaint of nonprofit organizations is that complying with funder demands requires an excessive amount of managers’ and leaders’ time because the requirements differ by funder and even by contract. Requirements are often inconsistent (for example, different budget categories and definitions of allowable expenses) and frequently redundant (for example, requir-ing organizations to provide the same data for multiple reports). As part of the Strengthening Fi-nancial Management (SFM) initiative, the Wallace Foundation supported efforts by the Donors Forum to bring about changes in funders’ practices. The Donors Forum advocated in general for nonprofit organizations at the state level, and therefore had the potential to improve conditions for many Illinois nonprofits, including the 25 selected for the SFM initiative.
This chapter discusses the problems the SFM organizations and all Illinois nonprofits faced. Next it describes the Donors Forum’s activities in the initiative and the changes for which it advocated. It then examines how the Donors Forum supported the passage and implementa-tion of several pieces of legislation that reflected some of its desired changes, and assesses some of the results of that activity.
State Fiscal Conditions and Their Effect on Nonprofit Organizations In 2009, as the SFM initiative began, the country was in the midst of a severe economic reces-sion. The recession had particularly dire effects on Illinois nonprofit organizations: Two-thirds of Illinois nonprofits surveyed by the Urban Group reported that they had frozen or reduced employee salaries as a result of economic problems, and over half reported that they had re-duced their number of employees. These figures were about 15 percentage points higher than the national averages. Also in 2009, 60 percent of Illinois nonprofit organizations reported that late payments from the state were a “big problem,” compared with only 24 percent nationally, and Illinois ranked first in the nation in the proportion of nonprofits that experienced late pay-ments as a big problem.1
1Boris, de Leon, Roeger, and Nikolova (2009).
66
Organizations in SFM reported that payments from the state were often as much as 120 to 180 days late, and that they struggled to manage financially as a result. One chief financial officer (CFO) in the initiative reported:
We have to take money that is intended for something else and use it to pay this staff. We don’t have a lot of extra funds — we have to live off our reserves — it gets stressful — you wonder if you will make your next payroll — we were at the place where I was worried about that. At which point I would have accessed our line of credit. It stresses the whole agency.
The fiscal problems of the State of Illinois unfortunately were not a temporary problem, and late payments were only a symptom of continuing and pervasive state fiscal problems. In 2010, as a way of managing its fiscal crisis the state enacted a law that increased the allowable “lapse” time between receiving an invoice from a provider and paying the bill from two months to six months. This worsened the problem of late state payments. The state also had a rising pension burden, rising Medicaid costs, falling revenues, and budgeting practices that obscured both its revenues and its expenditures. One of those budgeting practices was to defer payments to new fiscal years, which contributed to the strains nonprofit organizations were experiencing. While in theory the state required a balanced budget, in practice the state’s debt had been mounting over the years. The recession exacerbated all of these problems.2
In addition to late payments from the state, the Donors Forum also learned through in-terviews that nonprofit organizations experienced burdensome administrative and reporting re-quirements. Since the state did not maintain a central reporting system, nonprofits that held mul-tiple contracts with various state agencies were required to report the same or similar data to multiple agencies in multiple formats, using multiple systems. As the Donors Forum wrote in the 2010 report summarizing the information it collected:
Because these systems don’t let providers retrieve their own data, many provid-ers then invest in and maintain a separate organizational database in order to merge information, track progress toward their own budget and planning goals, report to the board, and plan for the future. At the same time, it seems state agen-cies do not have the mechanisms required to track connections between their funding streams across service providers, issue common [requests for proposals], or seek opportunities to streamline the reporting process.3
Nonprofit organizations often face similar challenges when they work with multiple private funders. The Donors Forum initially planned to include efforts to improve private fun-ders’ practices in addition to those used by the City of Chicago and the State of Illinois. As the
2State Budget Crisis Task Force (2012). 3Donors Forum (2010).
67
initiative unfolded, the Donors Forum focused primarily on government funders, particularly the State of Illinois. According to a Donors Forum staff member:
The public funders create more of a burden, so that was the reason why we had to focus. In light of economic crisis on a national and state level, it made sense to look at public funders as the starting point.
Information collected by Public/Private Ventures and included in the initial report on SFM supported the findings of the Donors Forum concerning the administrative burden of pub-lic funding practices. The SFM grantees overwhelmingly agreed that it was labor-intensive and costly to comply with different proposal format requirements each time they bid on a contract, and that the unique reporting requirements, formats, and schedules of various grants and con-tracts made reporting data labor-intensive and costly as well.4 That report also concluded that the problem was substantially worse for public funders than for private funders.
To address these concerns the Donors Forum sought to clarify and improve funding practices by streamlining grant, payment, and reporting practices. It also engaged in efforts to become a voice for nonprofits in the state budgeting process, which was undergoing considera-ble revision.
This policy work has resulted in changes to state contracting practices but — as is true of much policy advocacy — change was slow to come, driven by the priorities of multiple stakeholders, and ultimately less successful than initially desired. There are multiple reasons for this limited success; perhaps most important were the state’s budgetary challenges and the in-herent limitations of a policy advocacy strategy adopted by the Donors Forum that responded to the state’s priorities instead of setting new priorities. In addition, although the Donors Forum had very good reasons for focusing on the practices of the State of Illinois’ human services agencies, doing so meant that they addressed only one — admittedly major — funding stream.
Donors Forum Activity The Donors Forum engaged in several activities over the four-year span of the initiative. First, it convened public and nonprofit leaders to identify challenges related to the public funding of hu-man services provided by nonprofit organizations. Second, it identified positive partnership prin-ciples on which public and nonprofit leaders could agree. Third, it provided consulting support to the Illinois Department of Human Services to help it implement newly passed legislation intend-ed to improve contracting practices. Fourth, it acted as a conduit for communication between nonprofit organizations and the state as Illinois unrolled its Budgeting for Results initiative.
4Kotloff (2012).
68
Early in the SFM initiative the Donors Forum convened and interviewed funders, city and state leaders, and the chief executive officers (CEOs) and lead financial officers of after-school organizations to identify changes that could improve funding policies and practices. In addition, it held policy forums with leaders and experts in human services and in nonprofit part-nerships. The Donors Forum implemented what is now called “Building a Stronger Illinois: The Public/Nonprofit Partnership Initiative,” an effort that included (1) publishing and disseminating Fair and Accountable: Partnership Principles for a Sustainable Human Services System (“Partnership Principles”), (2) shaping the implementation of state budget reforms, and (3) ad-vocating that the state create administrative efficiencies by streamlining auditing requirements, specifically by lobbying for the passage of an Auditing Streamlining Bill.
Although the Donors Forum’s activities were not specifically aimed at the SFM grant-ees, its efforts were intended to improve aspects of the funding environment that posed chal-lenges to all nonprofit organizations’ financial management.
Partnership Principles One of the Donors Forum’s major early accomplishments was to hold a series of conversations with community stakeholders, government agencies, and nonprofit organizations to develop a set of agreed-upon principles for government funders and nonprofits to follow. The principles were intended to enable nonprofit organizations to provide high-quality human services, while providing funders with assurances that those services were achieving the desired results, and yet without unduly burdening the organizations. They were put forth in the Donors Forum’s Part-nership Principles report.5 There are six of them:
1. Contracted services are based on a dynamic, data-driven system [for determining what services are needed].
2. Contracted providers are offered a transparent and competency-based selection process.
3. Contract terms and renewals are conditioned on community best interest and per-formance.
4. Payment amount and timing is based on a viable system.
5. Reporting and monitoring promotes efficiency and accountability.
6. Communication fosters shared commitments on behalf of the public good.
Following each of the principles, the report provided several points that envisioned the nature of good partnerships, such as, “4.2.a. Payments to providers adhere to agreed-upon timeframes,”
5Donors Forum (2010).
69
and “5.3.a. Government agencies use common systems for provider reporting and billing to avoid duplicate entry.”
The Donors Forum used the Partnership Principles report to gain support for stream-lined government. When the bills described below were being shaped and implemented, it re-lied on the Partnership Principles to provide concrete suggestions to legislators and staff mem-bers at the State of Illinois’ human services agencies.
Efforts to Streamline Contracting in Illinois As the full extent of the state budget crisis became clear, the Illinois General Assembly sought ways to ameliorate it. Over the years it had addressed its financial problems by delaying pay-ments to the following Fiscal Year and by borrowing money, but it was becoming clear that the state could not continue to do this because its general debt was growing dramatically, as were its pension debts. In 2009, the General Assembly proposed several budget bills, but little action was taken.6 In May 2010, however, with the support of the Donors Forum and other nonprofit organizations, including The United Way of Metropolitan Chicago, the General Assembly passed House Bill 5124 with unanimous votes in both the House and the Senate. The bill was an initial step toward making contracting practices more efficient and reducing the burdens on state and nonprofit personnel, thereby saving costs. It was approved by the governor and signed into law in July 2010 as Public Act 96-1141.7
Streamlined auditing was likely to save only a minimal amount of money compared with the state’s debt and pension obligations, but the bill easily garnered support. It mandated that the four human services agencies in Illinois — the Department of Human Services, the De-partment of Healthcare and Family Services, the Department of Children and Family services, and the Department of Public Health — convene a steering committee to determine how con-tracting with providers could be made more efficient. The steering committee comprised senior agency and nonprofit staff members and included a consultant hired by the Donors Forum who provided significant support to the committee in carrying out its work. The committee held pub-lic hearings, carried out surveys of public agencies and nonprofit providers, and did research into how other states managed their contracting services. State staff members from the Depart-ment of Human Services found the support provided by the Donors Forum consultant very helpful because the budget crisis had resulted in understaffing at state agencies.8
The committee’s report, Streamlined Auditing and Monitoring of Community Based Services: First Steps Toward a More Efficient System for Providers, State Government, and the
6Institute for Illinois’ Fiscal Sustainability (2013). 7Public Act 096-1141 (2010). 8Pratt Richards Group (2013).
70
Community,9 proposed a multiyear process to streamline contracting in several ways. It recom-mended the creation of a Central Repository Vault that would allow providers to upload docu-ments (such as organizational bylaws and 501(c)3 letters of nonprofit status) to a single data-base on a yearly basis, instead of every time they submitted proposals. It suggested that redun-dancies in auditing requests be done away with and that the state reduce the amount of program monitoring it did. For example, it suggested that the state put in place a system to review and accept national accreditation requirements for organizations and permit the accreditation pro-cess to become part of the state monitoring process. The plan also called for streamlining data-bases, using one chart of accounts for all human services agencies, and adopting technology that would make providers’ databases more compatible with the state’s.
Following the recommendations to the General Assembly, House Bill 1488 was passed with unanimous votes in both the House and the Senate and was signed into law by Governor Quinn as Public Act 97-0558 in August 2011. Commonly called the “Streamlined Auditing Act,”10 the statute mandated that the governor create a Management Improvement Initiative Committee, composed of the four Illinois human services agencies and others, to implement the recommendations for streamlining contracting. A senior consultant hired by the Donors Forum sat on the committee. Other members of the committee included senior staff members from large human services providers, and advocacy and professional membership organizations. The committee, in turn, created six teams to address each of six objectives: accreditation status, fi-nancial audits, multiyear contracting, streamlining, Medicaid, and a Central Repository Vault. The Donors Forum consultant provided support to the teams, particularly to the contracting and Central Repository Vault teams. She helped ensure that the work moved forward in a way that reflected the Partnership Principles.
An early step in the implementation of the Streamlined Auditing Act was the launch of the Central Repository Vault, in July 2012. In order to understand how the organizations in the SFM initiative were affected by the Vault, the research team conducted a brief survey in Janu-ary 2014 with the 19 SFM organizations that received public funds from the State of Illinois. Sixteen (84 percent) of the chief financial officers (CFOs) responded, and 14 indicated that they were aware of the Vault. However, during 2013 only 10 of their organizations had actually used it, although 2 more indicated that they would do so in 2014. These results indicate how slowly change occurs, even when procedures are mandated by statute, as was the case with the Vault. It is challenging to determine the effects of the changes to state contracting when those changes have not been experienced by all.
9State of Illinois Department of Human Services, Department of Children and Family Services, Depart-
ment of Healthcare and Family Services, and Department of Public Health (2011). 10State of Illinois Department of Human Services (2011).
71
CFOs in organizations using the Vault had very mixed opinions regarding its helpful-ness. Half reported that they agreed “a little” that it would ease contracting with the state. One thought it would not be useful at all, and only two CFOs thought it would help a lot. In follow-up interviews, CFOs said they were only moderately pleased because their organizations had multiple private and public funders that did not use the Vault. Proposals to receive federal funds that did not come through the four State of Illinois human services agencies still had to include the same documents as before. Thus, while the Vault addressed an issue at the state level, the reality is that many nonprofit providers in the after-school field apply for funds from multiple sources, requiring multiple submissions of the same documents. This highlights the challenges and complexities in creating efficiencies: While they may go into effect in one part of the fund-ing system, inefficiencies can persist in other parts.
The members of the Management Improvement Initiative Committee also considered the challenge of differing federal and state reporting requirements. In 2012 the committee de-cided to address that challenge by having the state adopt federal reporting guidelines and tem-plates, and it identified the changes that would need to occur in the state’s requirements for that to happen.11 The committee does not seem to have addressed the concern that federal contract-ing requirements can be very involved and complex, requiring sophisticated financial offices, making it unclear whether all the SFM organizations that received public funding would be able to comply with new reporting requirements.
The data collection for this current report ended early in 2014, and by then the Stream-lined Auditing Act was two and a half years into implementation. The Vault had been put into place, and streamlined auditing rules went into effect in July 2013. However, work remained, including the need for the state to adopt new technology that would make it easier for contrac-tors to submit performance data. That technology was due to be put in place in 2015. New legis-lation passed in 2010 made the need for more advanced technology even more pressing. (This legislation is collectively referred to as the Budgeting for Results Act, although it was passed as pieces of two different bills that also cover many other subjects.)
Budgeting for Results Budgeting for Results is a state-mandated approach intended to create greater transparency and public participation in budgeting, to ensure resources are allocated to approaches most effective at producing desired results, and to force Illinois to estimate its revenues more accurately. In 2010 and 2011 the Illinois General Assembly passed two pieces of legislation that led to its cre-ation. The first piece of legislation, Public Act 96-958 (Senate Bill 3660), was sponsored by Democrats and passed both the House and the Senate in May 2010 with votes that split largely
11Kraus (2013).
72
along party lines.12 Called the Emergency Budget Act of 2011, it permitted the government to borrow additional money and extend its “lapse” period for bill payments: Previously the state had two months beyond the end of its Fiscal Year, which ends June 30, to pay that Fiscal Year’s bills. That is, the state had until August 31. This new legislation gave the state until December 31. However, it also included budget reform language that required state officials and agencies to establish performance goals and priorities prior to developing their budgets. This established the overarching principle that budgeting should be based on the results of state programs as op-posed to the expenditures of the previous year.
In early 2011, Public Act 096-1529 (House Bill 5424) laid out the specifics to go with that principle.13 That act required the annual appointment of a Budgeting for Results Commis-sion to advise the governor on setting state goals and the specific outcomes that would represent progress toward those goals. The bipartisan commission is composed of members of the House and Senate, the lieutenant governor, business leaders, and experts in fiscal policy and state budg-ets. It must produce budget recommendations for the governor in a report due on November 1 of each year. The act also specifies that the commission must convene at least two public hearings a year to identify priorities for spending and that it must recommend a percentage of the state budget to be allocated to each of the state’s goals. Public Act 096-1529 easily passed both the House and the Senate with broad bipartisan support and was signed into law in February 2011.
Budgeting for Results represented a major shift for nonprofit organizations in Illinois. While in theory they and the Donors Forum supported the legislation, which reflected several Partnership Principles, they had concerns about its implementation: It was not clear, for exam-ple, how the state would go about establishing benchmarks to determine if its goals had been achieved. Nonprofit organizations that lacked the latest technology were not confident that they would be able to track their participants’ outcomes and collect the information that the state needed to make funding decisions. Finally, it was not clear whether social values would still have a role in outcomes-based budgeting. Would performance metrics continue to allow pro-viders to serve the state’s neediest children and young people, or would the challenges involved in serving them make it difficult to get state funds to do so?
Once established, the Budgeting for Results Commission invited public discussion. The Donors Forum organized nonprofit partners (including some of the organizations involved in SFM) to provide presentations to the commission and lawmakers on the potential effects of the act, and many of these concerns came to light. In response, the Donors Forum arranged to have nonprofit executives provide testimony at a public hearing of the Budgeting for Results Com-mission in 2012. It commissioned a report by American University and Indiana University that analyzed outcomes-based budgeting as it has emerged across the United States and highlighted
12Emergency Budget Act of Fiscal Year 2011 (2010). 13Public Act 096-1529 (2011).

73
challenges that would face the State of Illinois as it implemented Budgeting for Results. It also produced a report card on Budgeting for Results in 2012.
The messages delivered in the report card and the report were negatively received by a vocal handful of state leaders, which posed some challenges for the Donors Forum’s relation-ship with state government.14 An examination of the documents suggests that the negative re-sponses were largely the result of errors in communications. While the Donors Forum intended to position itself as a partner to the state and a representative of the Illinois nonprofit communi-ty, the report card and report on Budgeting for Results did not make that intention clear. The report card gave the state a “B” for establishing the Budgeting for Results legislation but “Cs” and “Ds” and “Incompletes” for its implementation. Thus, very useful — and succinctly pro-vided — information was framed in largely evaluative way.
The report the Donors Forum commissioned is titled Budgeting for Results: Key Issues of Concern.15 It emphasizes the challenges and complexities facing the State of Illinois as it im-plemented outcomes-based budgeting. Although it provides informed recommendations for how Illinois could move forward with Budgeting for Results, those recommendations appear at the ends of paragraphs, where they are easy to overlook.
When criticisms about the Donors Forum surfaced, it responded quickly. The staff worked more carefully on crafting its messages, making sure to emphasize the organization’s role as a partner to the state. For example, legislative testimony given by a Donors Forum policy expert in 2013 had a more positive and helpful tone than the materials prepared in 2012. The Donors Forum staff also worked to establish relationships with members of the Budgeting for Results Commission, and introduced state officials to outcomes-based budgeting being done outside Illinois. Although it is impossible to make a direct connection between Donors Forum activities and actions taken by the Budgeting for Results Commission, it is notable that the 2013 Budgeting for Results Commission report reflects some of the changes that the Donors Forum wanted, such as an increased number of public hearings and a focus on the technology that non-profit providers would need to comply with the new requirements of Budgeting for Results.16
Conclusions Policy work requires juggling the needs and desires of advocates and legislators. Progress is slow. The Donors Forum used multiple strategies simultaneously throughout its work, including providing staff members to participate in committees and working groups, producing reports to inform funders and policymakers, helping funders and nonprofit leaders reach consensus on
14Pratt Richards Group (2013). 15Mikesell, Mullins, and Ward (2012). 16Budgeting for Results Commission (2013).
74
issues, and facilitating dialogue between nonprofit organizations and their funders. The Donors Forum’s staff quickly came to recognize how few public employees were available at the state level to implement mandated changes and how valuable it was to provide material support to them. The Donors Forum therefore “loaned” consultants to the Illinois Department of Human Services to serve as advisers. But even after all these efforts and even though several bills had passed, at the time this report was written concrete changes in the nonprofit funding environ-ment were just starting to occur. Even once decisions have been made, and plans formalized and put into place, nonprofit organizations are slow to adopt changes.
Much of what the Donors Forum did, and what other advocacy groups do, was to pre-pare key elements — such as vetted policy solutions or even legislative sample text — so that when the political environment was right, change in the direction nonprofit organizations de-sired became more likely than changes in other directions. Many of the day-to-day activities of a policy advocacy group focus on shaping the definition of a problem (which may begin with a basic understanding that something is “wrong”), developing the reputation needed to become the “turn-to partner” to help identify and shape solutions to the problem, and building support for its ideas among other important players. When the Donors Forum provided solutions to problems, as it did when it worked with the state to streamline contracting practices, it met with considerable success. When the organization focused on defining the problem without also em-phasizing concrete solutions, as it did in the beginning of the Budgeting for Results process, it stumbled, with negative consequences for some of its relationships.
Effecting policy change takes time, and those who desire it must be patient. In addition, when measuring one’s effectiveness in the policy arena, if one counts only the tangible changes in policy or practices that have occurred so far one will fail to take account of the “potential en-ergy” that has been stored to effect change at an appropriate moment in the future. If external factors remained constant from year to year, such “counts of new laws passed” could reveal an advocacy group’s effectiveness. But external factors do not remain constant, they are always worsening or getting better, making such counts misleading.
Because the Donors Forum undertook its work for SFM in particularly difficult finan-cial times, the timing of legislative changes was governed primarily by factors external to the policymaking process itself. The economy played a major role in determining the actions public funders were able and willing to take in any given year. The Donors Forum’s strategy was to define the problems faced by nonprofit organizations and then align its efforts with the prob-lems that state policymakers decided to address, providing potential solutions to those. Some issues that were highly important to nonprofit organizations’ survival could not be addressed. For example, one of the reasons CFOs were disappointed in the Central Repository Vault was that it did not address the issue of late state payments, one of their organizations’ biggest finan-cial problems at the time. However, while the state was willing to make its budgeting and con-
75
tracting processes more rational, legislators could not agree on how to address the state’s under-lying budgetary problems — including high debt levels and unfunded pensions — which were the root cause of the late payments.
Even if the economic environment had been less harsh or policymakers more amenable to the policy changes desired by nonprofit organizations, there were limits inherent in the Do-nors Forum’s strategy of working on the issues that the state identified as important. The state addressed many fewer issues in its implementation of the Streamlined Auditing Act than the Donors Forum identified in its Partnership Principles report. The Donors Forum took ad-vantage of the situation to shape how the Streamlined Auditing Act was implemented, but was limited to changes that the state defined as important or for which political agreement could be shaped. While the Donors Forum made extensive efforts to shape elected officials’ perceptions, it worked primarily with agency officials, and was less successful in the more politically charged environment of Budgeting for Results.
While changes to public policy can be frustratingly slow, they are needed to fully ad-dress the problems with nonprofit organizations’ financial environment, so advocates must take a long-term perspective. Organizations promoting change need to be vigilant in keeping their issues in front of policymakers and the public, diligent in working as trusted partners with poli-cymakers and nonprofit organizations to prepare vetted solutions or sample legislation, and pa-tient. Even then, unfortunately, strategies such as those taken by the Donors Forum’s may be too limited to create change on the scale that is needed.

77
Chapter 7
Main Findings and Implications for Professional Development for Nonprofit Organizations
Strong financial management is a cornerstone of organizational stability. In organizations serv-ing young people, financial stability contributes to strong, sustainable programs that can attract both talented staff members to run them and young participants who can benefit from them. Yet strong financial management is not easily achieved in organizations that have often grown or-ganically out of community need, funders’ compassion, and the good ideas and hard work of people committed to bettering young people’s lives.
Strong financial management in nonprofit organizations is also impeded by severe re-strictions imposed by public and private funders on the proportion of program funding that can be used to support administrative functions, often set below the level that would cover reasona-ble administrative costs.1 At the same time funders may increase administrative costs by impos-ing requirements pertaining to reporting and monitoring, thus further burdening financial struc-tures that are already too weak.
The Strengthening Financial Management (SFM) initiative set out to address the finan-cial management challenges facing nonprofit organizations that provide out-of-school-time pro-grams for children and young people. It offers valuable lessons about how the organizations involved responded to the effort and the factors that influenced their progress. It also sheds light on policy work conducted to improve funder practices and identifies the strategies that helped push the policy agenda forward, those that did not, and the limits of even successful strategies.
The multiyear professional development strategy embodied in the SFM initiative helped all but 2 of the 25 participating organizations to strengthen their financial practices, and those improvements persisted even after the professional development intervention ended.
The organizations that participated in the SFM initiative experienced meaningful changes in a range of financial practices. Organizations demonstrated increased financial report-ing capabilities and better methods of allocating costs, which helped them create more accurate budgets. They also demonstrated improved financial procedures with better internal controls for practices such as issuing checks. And they realized efficiencies by automating many tasks.
Many of the changes persisted over time. Once the most intensive period of profession-al development was over, the research team expected to see practices decay as the staff turned
1Kotloff (2012).
78
over and time passed, because sustaining organizational change is challenging. There was mod-est decay in some outcome measures two to four years after the initiative began, but the majori-ty of the outcome measures that improved either remained level or continued to improve.
Although there was a difference among organizations in how many desirable outcomes they achieved, all but two improved in at least some areas. Staff members from almost half (12 out of 25) of the organizations reported that their organizations improved in 80 percent or more of the financial practices in which they had previously been weak. These gains were made equally among organizations receiving the group learning model of professional development and those receiving the customized learning model.
The group learning model appeared to be a cost-effective alternative to the custom-ized learning model.
Group learning organizations received about 182 hours of professional development support from Fiscal Management Associates (FMA), about 25 percent of the 732 hours received by the customized learning organizations. The group learning model consisted primarily of group learning sessions and offered organizations very limited one-on-one time with consult-ants, whereas the customized learning model offered considerable individual coaching. Both sets of organizations reported improvements, with the customized learning organizations im-proving more — but only slightly more. The difference in the hours of professional develop-ment offered to the two groups is much larger than the difference in outcomes, suggesting that group learning is an attractive option.
The customized learning organizations did improve much more quickly. By the end of the first two years, the customized learning organizations had improved their financial man-agement more than the group learning organizations. However, the customized learning organi-zations then leveled off (or fell back slightly), while the group learning organizations continued to make progress in strengthening their financial practices, particularly between their second and third years in the initiative. This difference in the pace of change was probably the result of the timing of the grants the organizations received to support their efforts. Each customized learning organization received a grant of $115,000 at the beginning of the initiative and an addi-tional grant of $125,000 for its cash reserve if it completed its initial work plan within two years. Each group learning organization received a grant of $40,000 at the beginning of the ini-tiative and another grant of $25,000 when it completed its work plan. The customized learning organizations therefore had more money to start their efforts and a strong incentive to achieve progress rapidly.
79
An organization’s level of motivation in applying to SFM played a role in the extent to which it was able to achieve change, as did the number of hours that it committed to the initiative.
Some chief executive officers (CEOs) from SFM organizations reported at the outset that they were strongly motivated to join the initiative because it aligned with their organiza-tions’ needs and plans; those organizations reported significant change in 80 percent or more of their outcome areas two or three years later. In general, organizations that achieved success in-vested 800 to 1,000 hours of staff time in SFM (spread across multiple staff members), but some organizations with strong motivations were able to make good progress at the cost of few-er staff hours. Organizations whose CEOs did not express strong motivation to join SFM at the start of the initiative did not achieve progress in 80 percent or more of their outcome areas even if they spent 800 or more hours trying to do so.
This finding about the importance of motivation raises an important question about the other findings from this research: Perhaps the organizations that benefited most from SFM would have improved their financial practices even if they had not participated in the initiative. The research design did not permit the research team to investigate this particular issue with great rigor. However, it is notable that several organizations that showed strong change had vet-eran CEOs who indicated that the initiative provided the resources that allowed them to make that change, noting that such funding and professional development support were very unusual.
It appears that the group learning organizations that achieved good outcomes spent about 100 more hours to do so than customized learning organizations. This may have been be-cause customized learning organizations had professional development consultants present who could ease their work. It may also have been because group learning organizations took three years to complete their work rather than two, as discussed above.
Organizational leaders and staff members reported that strengthening their financial management practices improved their ability to plan programs and organizational strategies.
While the benefits of better financial management varied, examples provided by staff members suggested that it supported organizational stability. The SFM initiative began in 2009, approximately a year after the Great Recession began. In Illinois, where the initiative was locat-ed, the state had severe budget problems, and nonprofit organizations were very vulnerable to state funding cuts. All but one of the SFM organizations weathered the recession, and many became stronger and had significantly larger budgets.
As importantly, executives and staff members from the organizations reported that by the end of the initiative they had better information with which to make decisions. For example, executives were able to assess the implications of accepting particular contracts. Some contracts
80
allow an organization to cover all of its overhead costs, while others do not. After participating in SFM, executives knew whether they could run their programs within the budgets allowed in their contracts or whether they had to raise additional funds to support those programs. Another benefit reported by executives was that they and program managers were able to use resources more efficiently. This enabled them to avoid underspending on contracts and grants, which can result in funding losses when organizations cannot invoice or, more seriously, when their future funding is decreased based on that underspending.
Efforts to influence funder practices met with mixed results. The initiative made some progress, but the State of Illinois’ budget crisis was so severe that one of the most serious problems facing the nonprofit organizations in SFM (and nonprofits across Illinois) — late payments from the state — could not be addressed during the initiative.
The organization that led the efforts to improve funder practices, the Donors Forum, made a decision early in the initiative to focus on the State of Illinois because state funding practices placed greater burdens on nonprofits than the practices of private funders. The Donors Forum did make some progress in addressing burdens related to contracts, such as requirements that organizations submit the same forms for each contract proposal, duplicative reporting re-quirements, and duplicative audits. The Donors Forum provided important staff support to a committee composed of state human service agencies and nonprofit leaders that was charged with making changes to these practices. Several changes resulting from this committee’s work were implemented during the course of the evaluation, with others due to take effect in 2015.
The most serious funder-imposed burden facing nonprofit organizations, however, was the state’s late payment of invoices. Payments were made as many as six months after organiza-tions billed for their services. The Donors Forum was unable to address this issue primarily be-cause the fiscal crisis in Illinois was so severe.
While the SFM initiative was underway Illinois adopted a new budgeting framework called Budgeting for Results. State budgets were now to be based on the goals identified by a bipartisan committee appointed by the governor and on the results state agencies had achieved in the previous year. This legislation had profound implications for contractors, including non-profit organizations, since it required them to submit information on how well they had achieved the outcomes they had agreed to produce. Over the course of the initiative, the Donors Forum’s efforts to influence the implementation of Budgeting for Results met with limited suc-cess, in part because the Donor Forum’s initial approach was taken as criticism rather than as an offer of partnership. In the last year of the initiative it adopted a more collaborative approach that met with greater success.

81
Implications for Strengthening the Financial Management of Nonprofit Organizations
Training our people to change practices was a challenge. I have a director who only after last year stopped doing his own spreadsheets. He didn’t trust the sys-tem at all. I’m finally at a place where he is now on board. He is very picky be-cause his grants are from the state and they are very picky. Changing that culture took some time. — A CEO
Both models of professional development offered in SFM were multiyear endeavors, with the primary professional development period spanning two years. The chief financial officers (CFOs) in the group learning organizations met quarterly for full-day sessions throughout this period, while FMA worked more continuously over the two-year period with the CEOs of cus-tomized learning organizations. In the final two years, the organizations’ leaders continued their involvement by attending a few occasional meetings and workshops. Commonly in the non-profit world most training occurs in a single session or at most in a series of a few workshops. SFM was a long-term endeavor. Because the training in this case was spread out over years, the organizations’ involvement in it spanned many organizational changes, such as staff turnover at all levels (including turnover among CEOs and CFOs), promotions, and financial crises. The messages and practices reinforced over a four-year period became embedded in the organiza-tions’ culture and procedures. This may be one of the reasons that the improvement achieved by the customized learning organizations largely persisted over the two years following the coach-ing phase of the initiative. (The improvement achieved by group learning organizations might also have persisted, but because those organizations reached their goals later, the research peri-od did not include as much time to follow their persistence thereafter.)
Although the group learning model appears to be a viable alternative, a slightly differ-ent distribution of resources might be useful if the initiative were repeated. In SFM’s theory of change, much depended on organizations acquiring better financial software or using financial software better, which was expected to lead to better reporting capabilities. The research found that these assumptions were, in fact, supported by evidence from many interviews. However, because the group learning organizations received less money up front than the customized learning organizations, they invested substantially less in software and training than the custom-ized learning organizations, and made those investments slightly later. It might have been help-ful to provide more of their grant money earlier, allowing them to purchase software earlier.
Another implication of this research is that an organization’s success in achieving its in-tended professional development and organizational outcomes is probably influenced by a number of factors other than the timing of capital investment. While the financial outcomes that were tracked improved on average for organizations in both groups in the SFM initiative, within each of the groups some organizations improved much more than others, and some improved

82
much faster than others. Organizations started at different levels: some needed to change only a few practices while others had to make many improvements. As a result, there were differences in how much organizations could change. Organizations also faced different challenges from staff turnover and staff reluctance to change.
The commitment of the CEO to the endeavor also influenced the amount and pace of change. There were times, for example, when the departure of the CFO or some other financial staff member enabled an organization to move forward more quickly, because that departing employee had resisted change. There were also times when departures and subsequent hires of CEOs, CFOs, and other financial staff members slowed the pace of organizations’ progress be-cause the new employees needed time to transition into their roles and understand the initiative.
Implications for Professional Development SFM was a professional development initiative aimed at strengthening the financial practices of nonprofits, but this study may provide lessons for other types of professional development initi-atives (not necessarily aimed at financial management). First, it appears from this initiative that if long-lasting improvement is desired, the professional development strategies used to achieve the goal need to take place over a long time. How long is unknown. Two years may be a good duration for other professional development initiatives to try. Long-term studies of these initia-tives, like this four-year study, can them help determine the optimal length of the interventions.
SFM not only consisted of a two-period professional development period, but included a two-year “weaning-off” period, when organizations still had access to limited networking op-portunities. It is unclear exactly how much this contributed to preventing decay in the organiza-tions’ practices. What is clear is that the group learning organizations continued to make pro-gress toward their financial management goals during these second two years, although that could be thanks to the second infusion of money they received at the two-year mark rather than the weaning-off activities themselves. Either way, the SFM research suggests that to achieve long-lasting change, a professional development intervention needs to last a considerable time.
It is also likely that as long as the professional development takes place over the long term, group learning sessions may be almost as effective as individually tailored professional development intervention. They certainly require less investment of professional development assistance. They may take more of the organizations’ staff time over the long haul, but only a fraction of the number of hours saved in professional development. One of the reasons that long-term support may be helpful is that it permits organizations to try a variety of strategies and get helpful feedback and additional ideas when strategies do not work. While good — and standardized — financial practices exist, what may be appropriate for an organization of a cer-tain size or at a certain stage of development may not be appropriate for one of a different size,
83
or at a different stage. If held regularly, group learning sessions can be venues where organiza-tions can share their successes and failures and receive suggestions for the future. In addition, working in peer groups may enhance participants’ motivation to change.
Finally, both models of professional development targeted organizations’ leaders rather than the less-senior staff members who would actually do the work entailed in achieving the desired change. Most professional development initiatives aimed at nonprofit organizations fo-cus on those lower-level staff members. SFM’s results suggest that focusing on leaders may be more effective.
Implications for Changing the Practices of Public Funders Influencing funder practices appeared to be an attractive route for reform, as improvements in these practices should logically benefit many organizations at once. However, the SFM initia-tive’s experience revealed several limitations to the approach. First, in order for new procedures to generate tangible benefits, organizations and funders must learn about and use them. Second, changes must affect a substantial portion of organizations’ funding to be valuable. From an or-ganization’s perspective, it is not enough to influence a single funder, particularly if that funder is not the organization’s major source of support. Third, as is often the case with advocacy, change is slow to materialize. For these reasons, those seeking quick results in the financial management arena may find it more effective to focus on building organizations’ ability to manage their finances, helping them to withstand adverse funding practices. And in fact the SFM initiative demonstrated a feasible way to do so, albeit a labor-intensive one.
Nonetheless, there is a limit to how much even an effectively managed organization can improve its financial stability, given the existing funding environment. Thus it is valuable to pursue changes in funder practices alongside direct capability building, even though achieving such change will be a long-term endeavor requiring significant resources. The following se-quence of steps worked well for the Donors Forum in its efforts to improve contracting practic-es in Illinois:
1. Convene key stakeholders, including nonprofit organizations, multiple fund-ing constituencies, politicians, and agency officials.
2. Define the problem, garner support for change, and define common principles of good practice.
3. Decide where to focus attention (for example, on specific issues or on types of funders), depending on what types of changes would benefit nonprofit organi-zations most, and on where change can be achieved.
84
4. Provide concrete solutions that respond to funders’ needs.
5. When new legislation passes, provide support to help public agencies develop concrete plans to implement it.
While working in this way is useful, it may not lead to change in the highest-priority ar-eas. Policy advocates need to find opportunities where change can be achieved.
Final Thoughts Today organizations have to achieve more for less. Funders increasingly demand results but are not always prepared to cover the attendant core organizational costs. Given this climate, the Strengthening Financial Management initiative provides powerful and very encouraging evi-dence for organizations and funders alike. Organizations can strengthen their financial practices if they put in the time and make needed investments. Funders who want to build the core capa-bilities of an organization or sector now have a blueprint for effective work.
Appendix A
Outcome Measure Definitions

87
Most of the outcome measures used in the report are straightforward — for example, the percentage of organizations with formal job descriptions, or the number of times a year an organization makes cash-flow projections, or the clarity of an organization’s financial reports as rated by the CEO (where 9 = high and 1 = low). Two of the 11 outcome measures listed in Box 2.1 were averages across related survey responses, however. The scales of the various outcome measures are described here.
Level of Financial Staff’s Financial Skills (1 = low; 9 = high)
To gauge the level of financial skills possessed by an organization’s financial staff, the research team asked the CFO to rate on a scale from 1 to 9 (where 1 = not strong at all and 9 = very strong) the current staff’s strength with respect to:
• Strategic financial planning • Developing budgets • Producing financial reports • Financial analysis • Accounts payable • Managing accounts receivable • Working and communicating with nonfinancial staff members • Forecasting cash needs • Monitoring contracts (expenses and receivables) • Producing all audit schedules and year-end financial statements in a timely manner • Preparing budgets and financial reports for funders • Using financial software • Overall
The CEO was also asked to rate the organization’s financial staff overall on a scale from 1 to 9. The responses to these 14 questions were averaged to come up with an overall measure.
Level of Program Managers’ Financial Skills (1 = low; 9 = high)
To gauge program managers’ financial skills, CFOs and CEOs were similarly asked to describe on a scale from 1 to 9 the extent to which they agreed or disagreed with the following state-ments (where 1 = strongly disagree and 9 = strongly agree):
• “Program managers have the skills to understand financial reports.” • “Program managers have the skills to develop realistic program budgets.” • “Program managers have the skills to understand their budget and contractual con-
straints (i.e. where they had discretion and where they didn’t).”
88
The overall measure for an organization was the average of the CEO and CFO’s responses.
In addition to these two averaged outcomes, three outcome measures gauged either CEO or CFO opinions in particular areas.
Usefulness of Software (1 = low; 9 = high)
This measure is a single-item variable. CFOs were asked the degree to which they agreed or disagreed with the following statement on a scale from 1 to 9 (where 1 = strongly disagree and 9 = strongly agree):
• “This organization has the software capacity to produce accurate projections and reports on the financial status of my organization.”
Report Clarity (1 = low; 9 = high)
This measure is a single-item variable. CEOs were asked the degree to which they agreed or disagreed with the following statement on a scale from 1 to 9 (where 1 = strongly disagree and 9 = strongly agree):
• “Our financial reports allow me to clearly see the financial status of my organiza-tion.”
Percentage of Time Spent on Strategic Thinking
This measure is a single-item variable. CEOs were asked:
• “Last month, what proportion of your time did you spend on program quality (staff motivation, program development, program quality monitoring) and longer-term stra-tegic issues (meeting with funders or policy makers not about specific contract issues, general advocacy, strategic planning, etc.) as opposed to day-to-day management tasks?”
They could respond with answers from 0 percent to 100 percent.

Appendix B
Chicago Organizations That Participated in the Strengthening Financial Management Initiative


91
After School Matters
Albany Park Community Center
Alternatives, Inc.
Association House of Chicago
Better Boys Foundation
Big Brothers Big Sisters of Metropolitan Chicago
BUILD (Broader Urban Involvement & Leadership Development)
Carole Robertson Center for Learning
Casa Central
Center on Halsted
Chicago Youth Centers
Chinese American Service League
Erie Neighborhood House
Gads Hill Center
Girl Scouts of Greater Chicago and Northwest Indiana
Girls in the Game
Howard Area Community Center
Instituto Del Progreso Latino
Logan Square Neighborhood Association
Metropolitan Family Services
Mujeres Latinas en Acción
Neighborhood Boys & Girls Club
South Shore Drill Team
Southwest Youth Collaborative
Youth Guidance

93
References
Boris, Elizabeth, Erwin de Leon, Katie Roeger, and Milena Nikolova. 2009. National Study of Nonprofit-Government Contracting: State Profiles. Washington, DC: Urban Institute.
Budgeting for Results Commission. 2013. 3rd Annual Report. Website: http://www2.illinois.gov/gov/budget/Pages/BFR-documents.aspx.
Cohen, Rick. 2012. “Death of the Hull House: A Nonprofit Coroner’s Inquest.” Nonprofit Quarterly (August 2). Website: www.nonprofitquarterly.org/management/20758-death-of-the-hull-house-a-nonprofit-coroners-inquest.html.
Donors Forum. 2010. Fair and Accountable: Partnership Principles for a Sustainable Human Services System. Chicago: Donors Forum.
Gregory, Ann Goggins, and Don Howard. 2009. “The Nonprofit Starvation Cycle.” Stanford Social Innovation Review, Fall 2009: 47-53.
Emergency Budget Act of Fiscal Year 2011 (Public Act 096-0958), Illinois General Assembly SB3660. (Passed July 1, 2010.)
Institute for Illinois’ Fiscal Sustainability. 2013. “State Still Waiting on Budget Reform.” Website: www.civicfed.org/iifs/blog/state-still-waiting-budget-reform.
Knight, Louise. 2012. “As Chicago’s Hull House Closes its Doors, Time to Revive the Settlement Model?” The Nation (January 25).
Kotloff, Lauren, with Nancy Burd. 2012. Building Stronger Nonprofits Through Better Financial Management: Early Efforts in 26 Youth-Serving Organizations. Philadelphia, PA: Public/Private Ventures.
Kraus, Carol A. 2013. “Cost Principles and Administrative Requirements of Federal and State Grants.” Springfield, IL: State of Illinois Department of Human Services. Website: www.dhs.state.il.us/page.aspx?item=67120.
Looney, Anna J., Eric K. Shaw, and Benjamin F. Crabtree. 2011. “Passing the Baton: Sustaining Organizational Change After the Facilitator Leaves.” Group Facilitation: A Research and Applications Journal 11: 15-23.
Mikesell, John, Daniel Mullins, and Marvin Ward. 2012. Budgeting for Results: Key Issues of Concern. Washington, DC: Donors Forum and American Unversity Center for Public Finance Research.
Pratt Richards Group. 2013. Donors Forum’s Public/Nonprofit Partnership Initiative: Evaluation Findings and Recommendations. Evanston, IL: Pratt Richards Group.
Public Act 096-1141, Illinois General Assembly HB5124. (Passed July 21, 2010.)
Public Act 096-1529, Illinois General Assembly HB5424. (Passed February 16, 2011.)
94
State Budget Crisis Task Force. 2012. Reports of the State Budget Crisis Task Force: Illinois Report. New York: State Budget Crisis Task Force.
State of Illinois Department of Human Services. 2011. The Management Improvement Initiative: Progress Report to the General Assembly, Public Act 97-0558. Springfield, IL: Illinois Department of Human Services.
State of Illinois Department of Human Services, Department of Children and Family Services, Department of Healthcare and Family Services, and Department of Public Health. 2011. Streamlined Auditing and Monitoring of Community Based Services: First Steps Toward a More Efficient System for Providers, State Government, and the Community. Report to the Illinois General Assembly As Required by Public Act 96-1141. Springfield, IL: Illinois Department of Human Services.
Thayer, Kate. 2012. “Jane Addams Hull House to Close.” Chicago Tribune (January 19).
Webber, Tammy. 2012. “Jane Addams Hull House Closes Doors After More Than 120 Years.” Associated Press (March 28).
About MDRC
MDRC is a nonprofit, nonpartisan social and education policy research organization dedicated to learning what works to improve the well-being of low-income people. Through its research and the active communication of its findings, MDRC seeks to enhance the effectiveness of so-cial and education policies and programs.
Founded in 1974 and located in New York City and Oakland, California, MDRC is best known for mounting rigorous, large-scale, real-world tests of new and existing policies and programs. Its projects are a mix of demonstrations (field tests of promising new program approaches) and evaluations of ongoing government and community initiatives. MDRC’s staff bring an unusual combination of research and organizational experience to their work, providing expertise on the latest in qualitative and quantitative methods and on program design, development, implementa-tion, and management. MDRC seeks to learn not just whether a program is effective but also how and why the program’s effects occur. In addition, it tries to place each project’s findings in the broader context of related research — in order to build knowledge about what works across the social and education policy fields. MDRC’s findings, lessons, and best practices are proac-tively shared with a broad audience in the policy and practitioner community as well as with the general public and the media.
Over the years, MDRC has brought its unique approach to an ever-growing range of policy are-as and target populations. Once known primarily for evaluations of state welfare-to-work pro-grams, today MDRC is also studying public school reforms, employment programs for ex-offenders and people with disabilities, and programs to help low-income students succeed in college. MDRC’s projects are organized into five areas:
• Promoting Family Well-Being and Children’s Development
• Improving Public Education
• Raising Academic Achievement and Persistence in College
• Supporting Low-Wage Workers and Communities
• Overcoming Barriers to Employment
Working in almost every state, all of the nation’s largest cities, and Canada and the United Kingdom, MDRC conducts its projects in partnership with national, state, and local govern-ments, public school systems, community organizations, and numerous private philanthropies.