Embed Size (px)
Citation preview

This report and others are available online at Nomura's new research website. To obtain a user id and password, please contact Diana Berezina at [email protected].
The web address is http://www.nomura.com/research/s16
Please read the important disclosures and analyst certifications appearing on the second to last page.
31 March 2006
Contacts: Mark Adelson (212) 667-2337 [email protected]
Nomura Securities International, Inc.Two World Financial Center New York, NY 10281-1198
www.nomura.com/research/s16
Bloomberg: NFIR <GO>
MBS Basics
Stop for just a second and think about some of the things that make America great.
Maybe you thought about some of the following: the Apollo Program … baseball … the Bill of Rights … Budweiser … capitalism … CBS/ABC/NBC/CNN/ESPN … Chevrolet Corvette … civil liberties … Coca Cola … cowboys … democracy … Disney World … freedom of the press … freedom of speech … freedom of religion … GE … Hollywood … hotdogs … the Hubble Space Telescope … MLK Jr. … the National Guard … The New York Times … the NFL … the Peace Corps … the Smithsonian Institution … the Teamsters … Thomas Edison … Thomas Jefferson … the USMC … the USS Enterprise … Wall Street … or Wal-Mart. Maybe you thought about something else entirely.1 You probably didn't think of mortgage-backed securities (MBS), but you should have, and here's why…
MBS provide essential funds for residential mortgage loans in the U.S. MBS help reduce mortgage loan interest rates for borrowers and increase the availability of mortgage loans. By fostering a nationwide market for mortgage loans, MBS have eliminated regional funding shortages and largely equalized mortgage interest rates nationwide. The MBS market has directly molded lending practices. It has standardized the application process for most mortgage loans, thereby providing faster decisions to applicants. Most important, MBS have helped to boost the rate of homeownership in America.
Increasing home ownership arguably strengthens America's democracy by giving more Americans an economic stake in their communities. A homeowner with an economic stake arguably is more likely to care about his community and, therefore, to participate in the political process by casting his vote each November on Election Day.
I. Introduction
Mortgage-backed securities or "MBS" are a type of fixed income investment. The main feature that distinguishes MBS from other fixed income investments is prepayment risk. Prepayment risk in MBS comes from the prepayment option in most U.S. residential mortgage loans: mortgage loan borrowers in America generally have the right to prepay their loans at any time without penalty.
Because of prepayment risk, MBS usually offer higher yields than otherwise-comparable fixed income securities. For example, Exhibit 1 shows that basic government-guaranteed MBS command higher yields than comparable U.S. Treasury notes (i.e., the spread is consistently positive).
1 D'Souza, D., 10 Great Things About America, Philly Talk Radio Online (4 Jul 2002) <http://www.phillytalkradioonline.com/comment/10-great-things.html>
Nomura Fixed Income Research

Nomura Fixed Income Research
(2)
Exhibit 1Ginnie Mae MBS Spread to 5-Year Treasury Notes
(basis points)
0
50
100
150
200
250
300
2000 2001 2002 2003 2004 2005
Source: Bloomberg MTGEGNSF, GT5
Understanding MBS is important for several reasons. First, residential mortgage loans account for a large share of all debt in America. MBS account for one of the largest pieces of the whole U.S. bond market and for the majority of all securitizations. MBS are the original source of securitization technology and understanding MBS is helpful (often essential) to understanding other types of securitizations.
II. MBS and Mortgage Loans in the Larger Context
Consider the following: home mortgage loans account for about a third of all credit market borrowing by non-financial sectors.2 According to the Federal Reserve, U.S. home mortgages amounted to roughly $9.15 trillion out of $26.4 trillion total domestic, non-financial borrowings at the end of 2005. Clearly, home mortgages have a prominent presence in the U.S. credit markets.
Likewise, MBS and real estate ABS3 together account for roughly a quarter of the whole U.S. bond market. Together, they amount to roughly $5.46 trillion of outstanding securities, while the whole
2 Board of Governors of the Federal Reserve System, Flow of Funds Accounts of the United States – Flows and Outstandings, Fourth Quarter 2005, Federal Reserve Statistical Release Z.1, Table L.2 (9 Mar 2006) (http://www.federalreserve.gov/releases/z1/current/z1.pdf). "Non-financial sectors" refers to borrowings by entities that generally spend the money that they borrow. Examples include a family buying a home, a corporation building a factory, or the federal government building an aircraft carrier. In contrast, "financial" borrowing refers to borrowing by banks and finance companies for the purpose of re-lending the borrowed funds. 3 "Real estate ABS" include securities backed by specialty mortgage loans such as loans to borrowers with bad credit records.

Nomura Fixed Income Research
(3)
U.S. bond market is about $20.9 trillion.4 In the narrower context of securitizations, MBS and real estate ABS account for more than half of the roughly $8.3 trillion outstanding (including CMBS5 and asset-backed commercial paper).
III. Mortgage Loan Basics
The most common type of residential mortgage loan in the U.S. is a 30-year, fixed-rate loan. The terms provide for payments in equal monthly installments and allow the borrower to prepay the loan at any time. Thus, the loan provides for 360 equal payments, each of which includes both interest and principal.
A borrower's right to prepay his loan is extremely important. When interest rates fall, the borrower can take advantage of the situation by refinancing his loan at a lower rate. When interest rates rise, the borrower receives the benefit of having locked-in a lower rate in the past.
Although fixed-rate mortgage loans remain the most common, a borrower can choose a loan that has an adjustable interest rate. Such a loan is called an adjustable-rate mortgage loan or "ARM." The simplest form of ARM provides for adjustments to its interest rate annually or semiannually. The adjustment is determined by changes in a published market index, such as LIBOR or the yield on U.S. Treasury securities with a remaining maturity of one year. Some ARMs start with low initial interest rates that last until the first adjustment. The low initial rate is called a "teaser rate." Lenders offer teaser rates to attract new borrowers.
Some ARMs, so-called "hybrid" ARMS, provide for a fixed rate of interest for their first several years, after which they convert to having annual or semi-annual rate adjustments. The ARM MBS market uses a short-hand terminology to describe the key terms of hybrid ARMs. For example, a hybrid ARM with a five-year fixed-rate period followed by interest rate adjustments that occur annually is called a "5/1" hybrid ARM. Similarly, a hybrid ARM with a three-year fixed-rate period followed by annual adjustments is called a "3/1" hybrid ARM. There are also "7/1" and "10/1" hybrid ARMs. Today, hybrid ARMs are much more common that regular ARMs.6
As with fixed-rate loans, a borrower's right to prepay an ARM is valuable. An ARM borrower with a teaser rate loan may try to refinance at the end of the teaser rate period. He might try to get a new
4 Based on data from the Bond Market Association and from BloombergSM, U.S. bond market outstandings at the end of 2005 were as follows:
U.S. Bond Market Outstandings (excluding commercial paper, at year-end 2005)
Sector Amount ($ trillions)
Federal Agency (GSE) MBS 3.68 Private-Label (Non-agency) MBS 1.19 Real Estate ABS 0.59 Non-real estate ABS (incl. CDOs) 1.37 Corporate Bonds 5.03 Federal Agency Debt 2.60 State and Municipal Debt 2.22 U.S. Treasury Securities 4.17 Total 20.85
5 CMBS are securities backed by mortgage loans on commercial properties such as office buildings and shopping malls. CMBS are different from residential MBS because commercial mortgage loans are very different from residential mortgage loans. Commercial mortgage loans embody little or no prepayment risk compared to residential mortgage loans. 6 For example, according to CDR/CPR Technologies, as of 28 February 2006, hybrid ARMs accounted for roughly 80% of all ARMs backing agency MBS.

Nomura Fixed Income Research
(4)
loan with a new teaser rate. Likewise, the borrower on a hybrid ARM might want to refinance at the end of his loan's fixed-rate period. He might refinance into another hybrid ARM or into a fixed-rate loan. For all types of mortgage loans, the borrower's right to prepay enables him to seize opportunities to lock-in financing when interest rates decline to favorable levels.
Long a Bond & Short an Option: For understanding MBS, it is sometimes helpful to think of a mortgage loan as comprising two parts: a bond and an option.
Bond Component: The bond component of a mortgage loan corresponds to the borrower's obligation to pay principal and interest in specified installments over the term of the loan. In the case of an ordinary 30-year fixed-rate mortgage loan, the bond component corresponds to the obligation to make 360 equal monthly payments over a period of 30 years. Conceptually, the bond component is quite simple: it is a cash flow for which the timing and amount of each payment is known with certainty. Accordingly, it is easy to estimate the value of the bond component by discounting the cash flows at an appropriate discount rate.7
Option Component: The option component of a mortgage loan corresponds to the borrower's right to prepay the loan at any time. In the jargon of options, the borrower has the right to "call" (i.e., purchase) the bond component of the loan at a price of par (i.e., the current principal balance). Thus, the prepayment risk of a mortgage loan resides in the option component.
Estimating the value of the option component can be difficult. Doing so depends on one's estimate of future fluctuations in interest rates (i.e., interest rate "volatility") and on one's estimate of borrower prepayment behavior under different interest rate conditions. Both interest rate fluctuations and borrower prepayment behavior are somewhat unpredictable.
When a lender creates a mortgage loan by lending money to a borrower, the lender essentially purchases the bond component from the borrower. In the jargon of the securities markets, the lender is "long" the bond component of the loan. Conversely, the borrower's position in the bond component is "short." Likewise, at the inception of the loan, the borrower acquires the option component from the lender. In this case, the lender is the one who is short, while the borrower is long. Putting it all together, the lender is long the bond and short the option. Thus, MBS professionals sometimes describe mortgage loans as containing embedded short positions in options.
From a valuation perspective, the value of a mortgage loan is the combined value of the bond and option components. Because the bond position is long and the option position is short, the value of the loan equals the value of the bond minus the value of the option. Estimating the value of the entire loan can be difficult because estimating the value of the option component is difficult.
IV. Basic MBS Features
The most common type of MBS is a simple "pass-through" security that represents ownership of an underlying "pool" of mortgage loans. An investor who owns the MBS is entitled to receive collections of interest and principal, including prepayments. In MBS jargon, the payments on the loans are "passed-through" to the investors. However, a small portion of the interest collections is not passed-through. Instead, it is used to cover expenses of the deal. Thus, an MBS has a "pass-through rate," which is the net rate at which investors receive interest on the balance of the mortgage loans backing the security. For example, if the mortgage loans backing an MBS have interest rates of 6.5%, the MBS might have a pass-through rate of 6%. The difference, 0.5%, covers expenses.
Every MBS has a "servicer." The servicer is a company that collects payments from borrowers and handles the administrative task of aggregating the collected funds and distributing them to investors.
7 For ARMs, estimating the value of a loan's bond component is more difficult because the amount of each monthly payment changes whenever the interest rate on the loan is adjusted.

Nomura Fixed Income Research
(5)
Naturally, the servicer receives a fee for its services. In most MBS, the fees to the servicer consume all or nearly all of the difference between the interest rate on the mortgage loans and the pass-through rate on the security. In many cases, the lender that originated the mortgage loans becomes the servicer for the MBS comprising those loans.
Most MBS are issued or guaranteed by one of the three mortgage-related "agencies" or "government sponsored enterprises" (GSEs): (1) Ginnie Mae, (2) Fannie Mae, and (3) Freddie Mac. Each "agency MBS" has the benefits of a credit guarantee from its related agency. Those guarantees insulate MBS investors from credit risk on the underlying loans. The federal government backs Ginnie Mae's guarantee. The guarantees of the other two agencies do not have federal backing, but professionals generally view those agencies as having extremely high credit quality.8
Apart from the GSEs, private sector entities also issue MBS. Those are called "private label MBS." Private label MBS do not carry guarantees from the GSEs and, therefore, use other forms of credit enhancement to counter-balance the credit risk of their underlying mortgage loans. Section X, below, focuses on private label MBS.
The loans backing an agency MBS are similar to each other. For example, a given agency MBS could be backed either by fixed-rate mortgage loans (FRMs) or by ARMs, but not by both. In the case of agency MBS composed of FRMs, all the loans would have interest rates close together. For some kinds of agency MBS, all the FRMs must have exactly the same interest rate. In other agency MBS, the interest rates on the FRMs can vary by as much as 1.75%.
In the case of an agency MBS backed by ARMs, the interest rate adjustment mechanism in all the loans must be based on the same index. For example, all the ARMs backing an agency MBS could have adjustment formulas tied to LIBOR. Alternatively, all the ARMs could have formulas tied to the one-year Treasury constant maturity index (CMT). However, an agency MBS could not be backed by a mixture of LIBOR-based and CMT-based ARMs.
Likewise, the mortgage loans backing a given agency MBS would have roughly similar maturities. An agency MBS would not be backed by a mixture of loans having both 30-year and 15-year final maturities. However, an agency MBS might be backed by recently originated 30-year loans and by 30-year loans that had been originated several years in the past.
Professionals tend to group agency MBS into large categories and often treat the securities as fungible within each category. For example, one category would be all the Fannie Mae MBS with pass-through rates of 6% and backed by 30-year FRMs. Another category would be all Ginnie Mae MBS with 5½% pass-through rates and backed by 15-year FRMs.
V. A Closer Look at the GSEs and GSE MBS
The GSEs exist to support America's policy of promoting home ownership. Today, they promote home ownership by providing a medium through which capital from around the country – and even from around the whole world – is made available to fund residential mortgage loans. Because of that mission, the GSE programs do not accept the very largest mortgage loans, which often finance luxury homes.
Ginnie Mae: Ginnie Mae is the trade name of the Government National Mortgage Association (a/k/a GNMA). Ginnie Mae is part of the U.S. government. It is an office within the Department of Housing and Urban Development (HUD).
8 Some market participants believe that the federal government would support Fannie Mae and Freddie Mac even though it is not legally obligated to do so.

Nomura Fixed Income Research
(6)
Strictly speaking, Ginnie Mae does not issue any securities, but instead guarantees MBS issued by banks, thrifts and mortgage bankers that participate in Ginnie Mae's programs. When an approved Ginnie Mae originator wants to issue a Ginnie Mae-guaranteed security, it first applies to Ginnie Mae for a guarantee commitment. Then, after the originator has selected mortgage loans for inclusion in the pool, it delivers the loan documents to an independent custodian. When the custodian certifies that all the required documents are in order, Ginnie Mae assigns a "pool number" to the mortgage pool and the originator issues mortgage pass-through certificates. The originator can hold the mortgage pass-through certificates in its portfolio, can sell the mortgage pass-through certificates to investors or to dealers, or it can use the mortgage pass-through certificates as collateral for a loan.9
Ginnie Mae guarantees full and timely payment of principal and interest on its MBS. The guarantee is backed by the "full faith and credit" of the United States.10 This makes Ginnie Mae MBS the safest (for credit purposes) in the market. Accordingly, of all MBS, Ginnie Mae-guaranteed MBS trade at the tightest spread against Treasury securities. In addition, because of the government guarantee, Ginnie Mae MBS receive the most favorable risk weighting (0%) under the risk-based capital guidelines for banks.11
The only mortgage loans that qualify for inclusion in Ginnie Mae pools are ones that are insured or guaranteed by the federal government. Most of the loans carry either insurance from the Federal Housing Administration (FHA) or a guarantee from the Veterans Administration (VA). The FHA and VA programs are designed to target low- and moderate-income borrowers. Most FHA/VA loans have modest principal balances.
Ginnie Mae runs two parallel programs called Ginnie Mae I and Ginnie Mae II. Under the Ginnie Mae I program, all mortgage loans in a pool must have the same interest rate. The Ginnie Mae II program allows the rates on the mortgage loans composing a pool to vary by as much as 75 basis points. Both programs generally require that all the mortgage loans composing a pool be of the same type (e.g., fixed rate, adjustable rate, graduated payment, etc.). The Ginnie Mae I program does not accept ARMs, but the Ginnie Mae II program does.
The servicer of the mortgage loans underlying a Ginnie Mae MBS remains liable for all losses on the mortgage loans. However, because all the mortgage loans are insured or guaranteed by the federal government, the practical risk borne by the servicer is very small.
Fannie Mae and Freddie Mac: Fannie Mae is the trade name of the Federal National Mortgage Association (a/k/a "FNMA"). Fannie Mae is a federally chartered, private corporation, which benefits from special treatment under various federal laws. Freddie Mac is the trade name of the Federal Home Loan Mortgage Corporation (a/k/a FHLMC). Freddie Mac is a "corporate instrumentality" of the United States.
Fannie Mae and Freddie Mac are subject to oversight by HUD.12 The U.S. Treasury is authorized to lend each one up to $2.25 billion.13 The President has the power to appoint five members to the 18-member board of each agency.14 Both are exempt from state and local taxes.15 The securities issued by each agency qualify as "exempt securities" under the federal securities laws.16
9 Lore § 2.02. 10 12 U.S.C. § 1721(g)(1) (LII 2005). 11 12 C.F.R. Part 3 Appendix A Section 3(a)(1)(iv), Part 208 Appendix A Section III(C)(1) & n.31, Part 225 Appendix A Section III(C)(1) & n.35, Part 325, Appendix A Section II(C) & n.26 (2005). 12 12 U.S.C. §§ 4513, 4541 (LII 2005). 13 12 U.S.C. §§ 1455(c)(2), 1719(c) (LII 2005). 14 12 U.S.C. §§ 1452(a)(2)(A), 1723(b) (LII 2005) 15 12 U.S.C. §§ 1452(e), 1723a(c) (LII 2005). 16 12 U.S.C. §§ 1455(g), 1719(d) (LII 2005).

Nomura Fixed Income Research
(7)
In contrast to Ginnie Mae, both Fannie Mae and Freddie Mac directly issue MBS. Although each of them guarantees its own securities, those guarantees are not backed by the full faith and credit of the United States. MBS from Fannie Mae or Freddie Mac receive somewhat less favorable treatment than do Ginnie Mae MBS under risk-based capital guidelines for banks. The current standards classify them in the second most favorable risk-weight category (20%).17
Although Fannie Mae and Freddie Mac accept federally insured or guaranteed mortgage loans for their programs, their main emphasis is on loans that do not have any kind of federal insurance or guarantee. Such loans are called "conventional" mortgage loans. However, the law restricts the maximum size of the mortgage loans that Fannie Mae and Freddie Mac can accept.18 For 2006, the maximum size for a loan on an ordinary one-family dwelling is $417,000. The restriction has the effect of excluding loans on luxury homes. It comports with the GSEs' public policy mission of promoting home ownership.
From a mortgage lender's perspective, each of Fannie Mae and Freddie Mac offers two alternative programs for "securitizing" mortgage loans. In the first type of program (a "cash program"), the agency purchases the mortgage loans from a mortgage lender for cash. Then, unless the agency chooses to hold the mortgage loans in its portfolio, it forms an MBS from the mortgage loans and sells the MBS to investors. In the second type of program (a "swap program" or "guarantor program"), the mortgage lender transfers mortgage loans to the agency in exchange for an MBS representing ownership of the same mortgage loans. The Fannie Mae and Freddie Mac swap programs are similar to the Ginnie Mae system in that the mortgage lender is left with an MBS that it can either hold, pledge, or sell in the market. The Fannie Mae and Freddie Mac swap programs differ from the Ginnie Mae system in that the securities are actually issued by Fannie Mae or Freddie Mac.
Fannie Mae and Freddie Mac each offer the option of swapping mortgage loans "with recourse" or "without recourse."19 When an institution swaps loans without recourse, Fannie Mae or Freddie Mac assumes the risk of loss from borrower defaults. That means that the institution has no responsibility for covering credit losses on loans that default. In contrast, when an institution swaps loans with recourse, it remains on the hook to cover credit losses on defaulted loans. Loans swapped with recourse are said to be swapped under the "regular servicing option." Those swapped without recourse are said to be swapped under the "special servicing option."
VI. Valuation of MBS
Duration & Convexity: Prepayment risk gives MBS the undesirable property of "negative convexity." That means that when market yields move, MBS prices adjust less favorably than prices of comparable securities. To understand negative convexity, start by considering the usual sensitivity of bond prices to changes in market yields. Exhibit 2 depicts the "price functions" for three hypothetical instruments: a 30-year Treasury bond, a 10-year Treasury note, and an MBS pass-through security. Each line on the chart relates to one of the three securities and shows what the price of the securities would be at different market yields. For convenience, we have chosen hypothetical securities that would all have a price of par (i.e., $1,000) at a market yield of 6%.
Comparing the three price functions on the chart, we observe that a given change in market yields produces the largest price change on the 30-year bond. In other words, the price function of the 30-year bond is the steepest of three. Fixed income professionals refer to the steepness of a security's price function as its "duration." In mathematical terms, duration is the negative of the first derivative of the price function. It reflects the percentage change in a security's price for a
17 12 C.F.R. Part 3 Appendix A Section 3(a)(2)(vi), Part 208 Appendix A Section III(C)(2)(b) & n.36, Part 225 Appendix A Section III(C)(2) & n.40, Part 325, Appendix A Section II(C)(Category 2)(b) & n.24 (2005). 18 12 U.S.C.A. §§ 1454(a)(2)(C), 1717(b)(2)(C) (LII 2005). 19 Federal National Mortgage Association, Single-Family Selling Guide, Part II, § 201 (31 Jan 2006); Federal Home Loan Mortgage Corporation, 1 Single-Family Seller/Servicers' Guide § 11.10 (28 Jun 2004).

Nomura Fixed Income Research
(8)
percentage point change in its yield. The units for measuring duration are years (even though it is not a measure of time). A security with "longer" duration has a steeper price function than one with "shorter" duration.
Exhibit 2Positive vs. Negative Convexity
Price Functions of Selected Instruments
$700
$900
$1,100
$1,300
$1,500
$1,700
2.0% 3.0% 4.0% 5.0% 6.0% 7.0% 8.0% 9.0% 10.0%
Market Yields
Pric
e10 Yr. Note
30 Yr. Bond
MBS
Source: Nomura Securities International
Next, notice how each of the price functions is really a curve. None of them is actually straight. The curvature of each price function is its "convexity." Convexity describes how a security's duration changes in response to movements in market yields. In mathematical terms, convexity is the second derivative of the price function.
The price functions for the 30-year bonds and the 10-year note curve upward. That means that as market yields decline the prices of the securities rise faster and faster. As market yields climb, the prices of the securities fall but at a decreasing rate. This favorable characteristic is called "positive convexity."
In contrast, notice how the price function for the MBS is curved downward. As market yields decline, the price of the MBS rises slightly and then levels off. The downward curvature of the MBS price function is called "negative convexity." Compared to a security with positive convexity, one with negative convexity gains less when market yields decline significantly.
Analytic Valuation: As noted above, analytically valuing MBS is difficult. Reliably specifying the entire price function for an MBS is even harder. The difficulty comes from the unpredictability of both interest rate volatility and prepayments. Nonetheless, analytic valuation is an important tool for assessing whether the actual trading prices of the securities represent attractive opportunities.
Static Analysis: One approach for analytically valuing an MBS is with a "static" analysis. A static analysis starts by selecting one prepayment assumption for the underlying mortgage loans. The prepayment assumption produces a single path of cash flows. Then, the cash flows can be discounted using suitable discount rates. The yield on the cash flows can be converted to a semi-annual bond equivalent yield (BEY), which allows for comparison with the yield on other types of securities, such as Treasury securities.

Nomura Fixed Income Research
(9)
The advantage of static analysis is simplicity. The main disadvantage is that it relies on a single estimate about how quickly the borrowers will prepay their mortgage loans. Obviously, if interest rates fall, more borrowers will prepay and if interest rates rise fewer will do so. The prepayment assumption built into a static analysis, therefore, implicitly contains assumptions about the future behavior of interest rates.
Dynamic Analysis: A second approach for analytically valuing MBS is with a dynamic analysis. Such an analysis uses two separate computer models. One model addresses the behavior of interest rates. The second model addresses borrowers' propensity to refinance their loans under different interest rate scenarios. The dynamic analysis uses the two models together to estimate the value of an MBS by projecting future cash flows under multiple scenarios. The dynamic analysis uses the interest rate model to generate multiple hypothetical paths of future interest rates. For each such path, the dynamic analysis then uses the prepayment model to estimate the level of mortgage loan prepayments in each future month. Thus, the prepayment model produces a hypothetical cash flow corresponding to each scenario.
Next, the dynamic analysis calculates the "option adjusted spread" (OAS) for the subject security. To do so, it applies a fixed spread over benchmark spot interest rates to calculate a simulated price for the security under each scenario, as well as the average of the simulated prices across all scenarios. The OAS model then adjusts the fixed spread and repeats the calculation process until the average of the simulated prices across all scenarios converges to the actual market price of the security. The reported OAS is the fixed spread that equates the average of the simulated prices to the actual market price of the security.
The main advantage of the dynamic analysis is that it attempts to capture the variability of interest rates and the dependency of prepayment behavior on both current interest rate environment and the path of interest rates over time. This is arguably much more realistic than simply choosing a single prepayment scenario in the static analysis.
A major disadvantage of the dynamic analysis is that it relies on many assumptions that necessarily underlie both the interest rate model and the prepayment model. Another disadvantage is that it arguably overemphasizes averages in determining the OAS. The cash flows on some types of MBS are extremely sensitive to the rate of mortgage loan prepayments. For such a security, the calculated value under different simulated interest rate scenarios can differ enormously. In fact, there might be no individual scenario in which the modeled value equals the average over all scenarios. For such a security, the OAS derived via simulation may be valuable for comparing the subject security to other similar instruments, but it might not help an investor to develop meaningful expectations about how the security will really perform. For that, the investor should analyze the security under specific scenarios. The investor naturally would want to know the range of conditions under which the investment produces attractive returns as well as the range under which it might produce unacceptable losses. Thus, using scenario analysis to complement the OAS simulation process can lead to better decisions.
VII. Trading MBS
Agency MBS trade in two different ways. The more common way is on a "TBA" or "to be announced" basis. TBA trading treats broad classes of securities as fungible. For example, all Fannie Mae 5½% MBS backed by FRM30s (i.e. 30-year, fixed-rate mortgage loans) are treated as interchangeable for TBA trading. Likewise, all Freddie Mac 5% MBS backed by FRM15s would be interchangeable.
The seller in a TBA trade has broad flexibility in delivering securities to settle the trade. The buyer in a TBA trade does not know exactly what securities he will receive when the trade settles. The Bond Market Association has established "good delivery guidelines" that govern what a seller can deliver to settle a TBA trade. A typical TBA seller pursues a "cheapest to deliver" strategy in satisfying its delivery obligations.

Nomura Fixed Income Research
(10)
TBA trades have a monthly settlement cycle. Different types of agency MBS have different notification and settlement dates.20 Each notification date brings a flurry of activity as trade counterparties transmit notices specifying the securities that they plan to deliver for settling trades. As the 3:00 pm settlement deadline approaches, trade counterparties review the securities that they have received and select the least desirable ones to use for satisfying their remaining delivery obligations.
The second way to trade agency MBS is on a "specified pool" basis. Such a trade involves a specific security. An MBS buyer usually must pay a slightly higher price in a specified pool trade because he knows exactly what he will receive. Specified pool trading allows buyers to select the most desirable pools.
The Bloombergsm system provides much of the information that MBS professionals use for trading purposes.
VIII. A Closer Look at Prepayments and Mortgage Cash Flows
Consider an ordinary, fixed-rate mortgage loan. Suppose that it has a term of 30 years and an annual interest rate of 7%. Suppose further that it provides for equal monthly payments over its entire life. If the borrower on such a loan kept the loan for its full term, his stream of payments would correspond to that shown in Exhibit 3. The horizontal axis of Exhibit 3 reflects the 30-year term of the loan. The vertical axis reflects the amount of money paid each month. As shown on the chart, in the early years of the loan, interest accounts for the majority of each monthly payment. In contrast, principal accounts for only a small portion of each payment during the start of the loan, but becomes a larger share during the loan's final years.
Exhibit 3Principal and Interest Cashflows:
30-Year, 7%, Fixed-Rate Mortgage Loan(s)(no prepayments)
Principal
Interest
Time
Mon
ey
Source: Nomura Securities International
Notice that the vertical axis on Exhibit 3 does not show specific dollar amounts. That is because the proportions of interest and principal composing each monthly payment are independent of the size of
20 Settlement dates for different types of agency MBS are posted on the Bond Market Association's web site at <http://www.bondmarkets.com/story.asp?id=498>.

Nomura Fixed Income Research
(11)
a loan. The proportions remain the same regardless of whether a loan is for $100,000 or $1 million. Indeed, the proportions would be the same for just one loan or for a pool composed of thousands of loans.
A. Coupon Stripping
Now consider Exhibit 4. That exhibit shows just the principal cash flow by itself. Suppose that it reflects the principal cash flow on a pool of mortgage loans with an aggregate balance of $100 million. Suppose further that an investor purchases just that cash flow. This can actually happen.
Some MBS pass-through deals create two classes of certificates, which represent the right to receive disproportionate allocations of principal and interest. For example, one class may entitle the holders to receive all the interest on the mortgage loans but none of the principal. Such a pass-through certificate is often called an "IO" (for "interest only"). The complementary "principal only" certificate is called a "PO" and entitles the holders to receive the principal on the mortgage loans but none of the interest. Naturally, coupon stripping need not be taken to such an extreme. For example, a transaction may provide for a 50/50 allocation of principal between two classes and a 75/25 allocation of interest.
Exhibit 4Principal Cash Flows:
30-Year, 7%, Fixed-Rate Mortgage Loan(s)(no prepayments)
Principal
Time
Mon
ey
Source: Nomura Securities International
Because the holder of a PO is entitled to receive only the principal component of the mortgage loan cash flow, the PO represents an investment in a cash flow that might be weighted in the later years of the life of the underlying mortgage loans. The holder of the PO will realize a substantial cash flow in the early years only if prepayments occur.
Conversely, as shown on Exhibit 5, an IO represents an investment in a cash flow that is weighted toward the early years of the life of the underlying mortgage loans. However, if the mortgage loans are prepaid, interest stops accruing and the cash flow to the IO stops. If all the mortgage loans prepay before the holder of the IO has recovered his initial investment, he will suffer a loss.

Nomura Fixed Income Research
(12)
Exhibit 5Interest Cash Flows:
30-Year, 7%, Fixed-Rate Mortgage Loan(s)(no prepayments)
Interest
Time
Mon
ey
Price Sensitivity of POs: IOs and POs (and less extreme variations on the "coupon stripping" theme) often display a greater degree of price sensitivity to fluctuations in market yields than do traditional pass-throughs. In the case of POs, this results from the interplay of two factors which are mutually reinforcing. The first is the "pure interest rate effect." Under all but the most unusual market conditions, a given change in market yields21 will have a greater impact on the price of long-term bonds than on the price of short-term bonds (i.e., longer-term bonds tend to have longer durations). Because the cash-flow on a PO is weighted in the later years of the life of the instrument, the price of a PO will fluctuate by a greater amount than a simple pass-through in response to a given change in market yields. Thus, the pure interest rate effect, alone, will generally produce a greater increase or decrease in the value of a PO than in the value of a simple pass-through representing ownership of a comparable pool of mortgage loans.
The second factor, which amplifies the price volatility of IOs and POs, is the "prepayment effect." Because the cash flow of POs does not include interest, POs always trade at a discount from par.22 Accordingly, the holder of a PO will recover the amount of the discount and experience an improved yield if the underlying mortgage loans prepay at a rate faster than anticipated. The rate of prepayment would be expected to increase as prevailing interest rates decline and borrowers realize opportunities to refinance their loans. Thus, when prevailing interest rates fall, the value of a PO increases from both the "pure interest rate effect" and the "prepayment effect." While the value of a traditional pass-through backed by fixed-rate mortgage loans would also increase under those circumstances, the amount of such an increase would be less than in the case of a PO because of the lesser impact of both effects.
Conversely, when interest rates rise, the value of a PO is likely to suffer a larger decrease than the value of an ordinary pass-through backed by a comparable pool of mortgage loans. Certain investors
21 The analysis in the text assumes a vertical shift of the yield curve without a material change in the shape of the yield curve accompanying such a shift. 22 Par represents the "face amount" of a security. In the case of a PO, par refers to the scheduled total amount to be paid to the holder of the instrument without regard to timing. In the case of a traditional Pass-through or PC, par refers to the scheduled amount of principal to be paid to the holder without regard to any interest to be paid or the timing of payments. In the case of an IO, the term par would not strictly apply. Nevertheless, the term is often used with respect to an IO to describe the aggregate outstanding principal balance of the mortgage loans comprising the pool from which cash flow will be directed to the IO.
Nomura Fixed Income Research
(13)
in POs have incurred losses in the hundreds of millions of dollars because of sudden fluctuations of interest rates.23
Price Sensitivity of IOs: The interest rate sensitivity of IOs is slightly more complex than that of POs. The holder of a PO knows in advance the exact amount of principal scheduled to be collected on the underlying mortgage loans. The entire question of valuing a PO, therefore, simply boils down to one of timing – money received sooner is worth more than money received later. In contrast, the holder of an IO faces material uncertainty about both the amount and timing of the cash flow on the instrument. As noted above, if all the underlying mortgage loans prepay, the cash flow to the IO ceases entirely. The holder of an IO may be viewed as having gambled on the rate at which the underlying mortgage loans will be prepaid. An investor purchasing an IO will offer a price based on his expectations regarding the future rate of prepayment of the underlying mortgage loans. If the mortgage loans prepay at a rate slower than expected, the investor will experience better investment returns than he had anticipated. Conversely, if the mortgage loans prepay at a rate faster than expected, the investor will experience worse investment returns than he had anticipated.
The pure interest rate effect generally has less impact on an IO than on its complementary PO. This is because the cash flow on an IO is weighted towards the early years of the life of the instrument. The prepayment effect, on the other hand, has a more significant impact on the value of an IO. As interest rates rise, the pure interest rate effect puts downward pressure on the value of an IO. However, because refinancing activity can be expected to slow down as rates rise, the prepayment effect puts upward pressure on the value of an IO as rates rise. The cumulative result of the pure interest rate effect and the prepayment effect varies as interest rates rise and fall. For example, as interest rates begin to rise, the prepayment effect generally outweighs the pure interest rate effect and the value of an IO should increase. However, as interest rates rise further, the rate of prepayment will continue to slowdown but it will eventually level out as refinancing activity grinds to a halt. Further increases in interest rates will decrease the value of the IO because the prepayment effect can no longer counterbalance the pure interest rate effect.
Conflicting Expectations: If all participants in the MBS market shared common expectations about future prepayment speeds, IOs and POs might never have been created. Suppose, for example, that given change in prevailing interest rates would increase the value of a simple pass-through by $1,000. If the ordinary pass-through were broken into an IO and a PO and if all investors shared the same prepayment expectations, the same change in rates might cause the value of the PO to increase by $1500 and the value of the IO to decrease by $500. In all cases, the combined net change in value of both the IO and the PO would equal the change in value of the ordinary pass-through. In the real world this does not occur – purchasers of IOs expect that the future rate of prepayments will be lower than that expected by the purchasers of the complementary POs.24
B. Measuring Prepayments
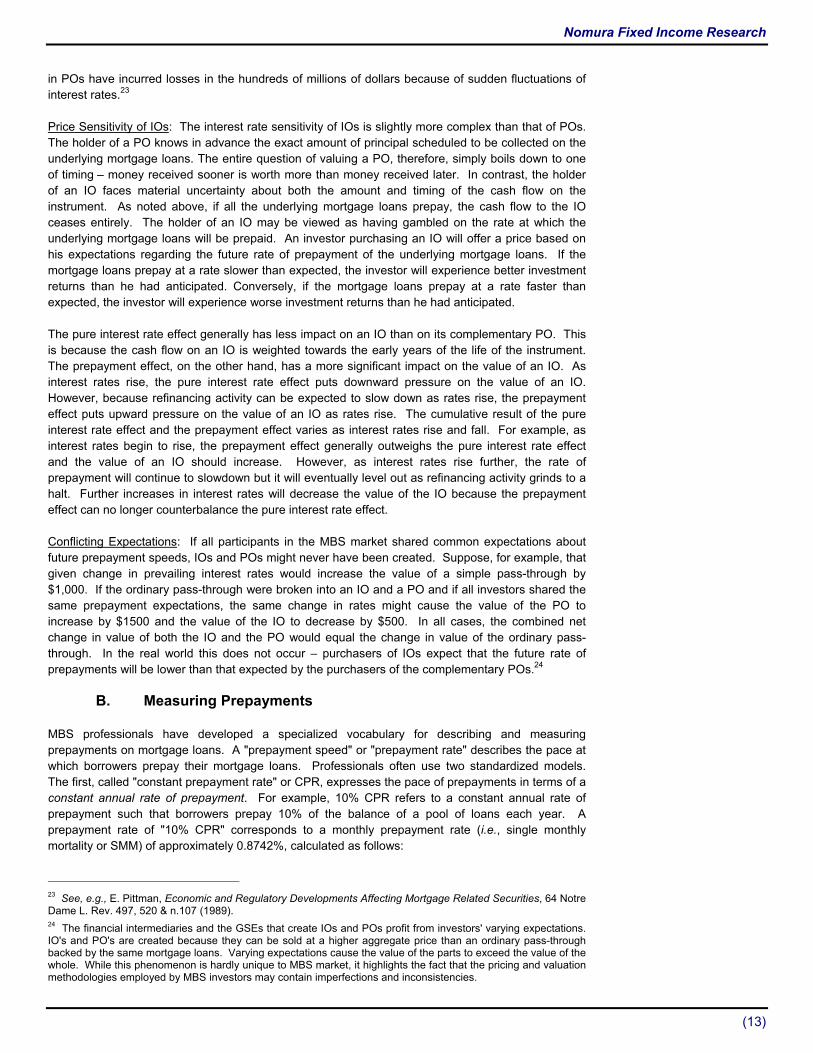
MBS professionals have developed a specialized vocabulary for describing and measuring prepayments on mortgage loans. A "prepayment speed" or "prepayment rate" describes the pace at which borrowers prepay their mortgage loans. Professionals often use two standardized models. The first, called "constant prepayment rate" or CPR, expresses the pace of prepayments in terms of a constant annual rate of prepayment. For example, 10% CPR refers to a constant annual rate of prepayment such that borrowers prepay 10% of the balance of a pool of loans each year. A prepayment rate of "10% CPR" corresponds to a monthly prepayment rate (i.e., single monthly mortality or SMM) of approximately 0.8742%, calculated as follows:
23 See, e.g., E. Pittman, Economic and Regulatory Developments Affecting Mortgage Related Securities, 64 Notre Dame L. Rev. 497, 520 & n.107 (1989). 24 The financial intermediaries and the GSEs that create IOs and POs profit from investors' varying expectations. IO's and PO's are created because they can be sold at a higher aggregate price than an ordinary pass-through backed by the same mortgage loans. Varying expectations cause the value of the parts to exceed the value of the whole. While this phenomenon is hardly unique to MBS market, it highlights the fact that the pricing and valuation methodologies employed by MBS investors may contain imperfections and inconsistencies.
Nomura Fixed Income Research
(14)
12 %10%100%100%8742.0 −−≅
Exhibit 6 shows the principal cash flows on our hypothetical pool of mortgage loans at various CPR prepayment speeds. Each panel in Exhibit 5 shows the monthly level of principal cash flow on the pool of mortgage loans ($100 million, 30-year, 7%, fixed rate). The shaded portions of the four panels have different shapes, but all have the same area. That is because the total amount of principal cash flows remains the same under all prepayment scenarios; only the timing of the principal cash flows changes. At higher CPR prepayment speeds, more of the principal cash flow comes in the early years of the life of the pool. For example, at a prepayment speed of 6% CPR, the weighted-average life or "WAL" of the pool is 10.8 years.25 At a slower prepayment speed of 3% CPR, the WAL is somewhat longer: 14.4 years. Conversely, at a fast prepayment rate of 24%, the WAL is just 3.5 years. In graphical terms, the WAL corresponding to given CPR is roughly the point along the x-axis that divides the shaded area in half.
Exhibit 6 Constant Prepayment Rates (CPR), Principal Cash Flows
30-Year, 7%, Fixed-rate Mortgage Loans
6% CPR 3% CPR
12% CPR 24% CPR
Time
Source: Nomura Securities International
The second commonly used prepayment model is called PSA.26 The PSA model is based on the CPR model. It's like the CPR model except that prepayments start slowly and rise to their ultimate rate over a period of 2½ years (30 months). More precisely, the base case of the PSA model (i.e., "100% PSA") is defined as follows: prepayments are 0.2% CPR in the first month following origination of a pool of mortgage loans and increase by 0.2% CPR per month until they reach a steady-state rate of 6% CPR in the 30th month. Multiples of the base case, such as 200% PSA, refer to situations
25 Weighted-average life or WAL often is used instead of maturity for pricing amortizing assets such as a pool of mortgage loans or an MBS. It expresses the weighted-average time to the return of principal on a asset. In calculating an asset's WAL, each payment date is expressed as the interval (in years) between the time of calculation and the payment date. Each interval is weighted by the amount of principal that will be distributed on the corresponding payment date. 26 The PSA prepayment model takes its name from the Public Securities Association, the predecessor to The Bond Market Association.
Mon
ey

Nomura Fixed Income Research
(15)
where prepayments in each month are at a level corresponding to a multiple of the 100% PSA scenario.
Exhibit 7 shows the principal cash flows on our hypothetical pool of mortgage loans at various PSA prepayment speeds. Each panel in Exhibit 7 shows the cash flows at a PSA prepayment speed that relates to the corresponding CPR speed in Exhibit 6. For example, the top left panel in Exhibit 7 shows the 100% PSA scenario, which corresponds to the 6% CPR scenario in Exhibit 6. Likewise, the 400% PSA scenario in Exhibit 7 corresponds to the 24% CPR scenario in Exhibit 6.
Exhibit 7 "PSA" Prepayment Examples, Principal Cash Flows
30-Year, 7%, Fixed-Rate Mortgage Loans
100% PSA 50% PSA
200% PSA 400% PSA
Time
Source: Nomura Securities International
In graphical terms the shaded area in each panel of Exhibit 7 resembles the shaded area in the corresponding panel of Exhibit 6 except that a roughly triangular area on the left edge of each graph has been cut out and "spread" over the remaining area.27
As shown in Exhibits 6 and 7, the timing of principal cash flows can vary greatly over the 30-year term of the loans, depending on prepayment speeds. That variability makes simple pass-through securities unappealing to some investors.
C. Prepayments in the Real World
Prepayments in the real world do not adhere to steady patterns like those embodied in the CPR and PSA models. Instead, prepayments are erratic and jumpy. All other things being equal, an environment of low interest rates motivates more borrowers to refinance their loans, producing higher prepayment speeds. Similarly, loans with higher interest rates tend to experience faster prepayments because the borrowers get favorable refinancing opportunities more frequently.
27 In real life, prepayments on pools of mortgage loans do not actually adhere to either the CPR or PSA schemes. Prepayments in the real world are erratic and highly variable. Even so, MBS professionals use the CPR and PSA as simple standards or "models" for summarizing the past prepayment behavior of a loan pool (e.g., "The pool has been paying at 25% CPR…") or for expressing projections for future prepayments (e.g. "we expect prepayments to increase to roughly 30% CPR over the coming months…).
Mon
ey

Nomura Fixed Income Research
(16)
Exhibit 8 shows the reported prepayment speeds on loans backing two cohorts of Fannie Mae MBS: those with pass-through rates of 5% and 6.5%, respectively. The chart shows that the prepayment speed on the 6.5% MBS is consistently faster than the prepayment speed on the 5% MBS. In addition, the chart shows that the prepayment speeds of both cohorts rise and fall over time as interest rates fluctuate.
Exhibit 8Prepayments on Fannie Mae Pass-through MBS
0
200
400
600
800
1,000
1,200
1,400
1,600
2000 2001 2002 2003 2004 2005 2006
PS
A P
repa
ymen
t Spe
ed
3.0
3.5
4.0
4.5
5.0
5.5
6.0
6.5
7.0
Yie
ld o
n 10
-Yea
r Tre
asur
y N
ote
FN 5%FN 6.5%10-yr Try
Source: Bloomberg FNCL 5, FNCL 6.5, GT10
IX. CMOs/REMICs
Since the early 1980s, MBS professionals have used "tranching" (from the French work for "slicing") to carve up mortgage cash flows into securities that appeal to a wider investor base. A deal that involves tranching cash flows over time is usually called a "CMO" or "REMIC." CMO stands for "collateralized mortgage obligation" and REMIC stands for "real estate mortgage investment conduit."28 Many CMOs are made by tranching the cash flows from agency pass-through securities. In addition, CMOs are often created from raw mortgage loans in private-label MBS deals (see Section X).
For example, Exhibit 9 shows the effects of tranching the cash flow from our hypothetical mortgage pool into four serially-maturing classes. In basic CMO transactions, at least three classes are issued and each has a different final maturity date. No principal is paid on a given class until each other class having an earlier final maturity date has been paid in full.
Prepayments on the underlying mortgage loans are used to prepay the principal due on the CMO classes. Because some fraction of the underlying mortgage loans will almost certainly be prepaid, it is unlikely that any class will remain outstanding until its final maturity date. An early payment of principal on a CMO class is sometimes referred to as a "special redemption."
In most CMO transactions, the collateral is not whole mortgage loans. Instead, the collateral is GSE MBS. Because of the guarantees backing the agency MBS, CMOs are usually structured without any additional credit enhancement.
28 REMIC is a tax classification that applies to most CMOs. See, I.R.C. §§ 860A-860G (LII 2005).
Nomura Fixed Income Research
(17)
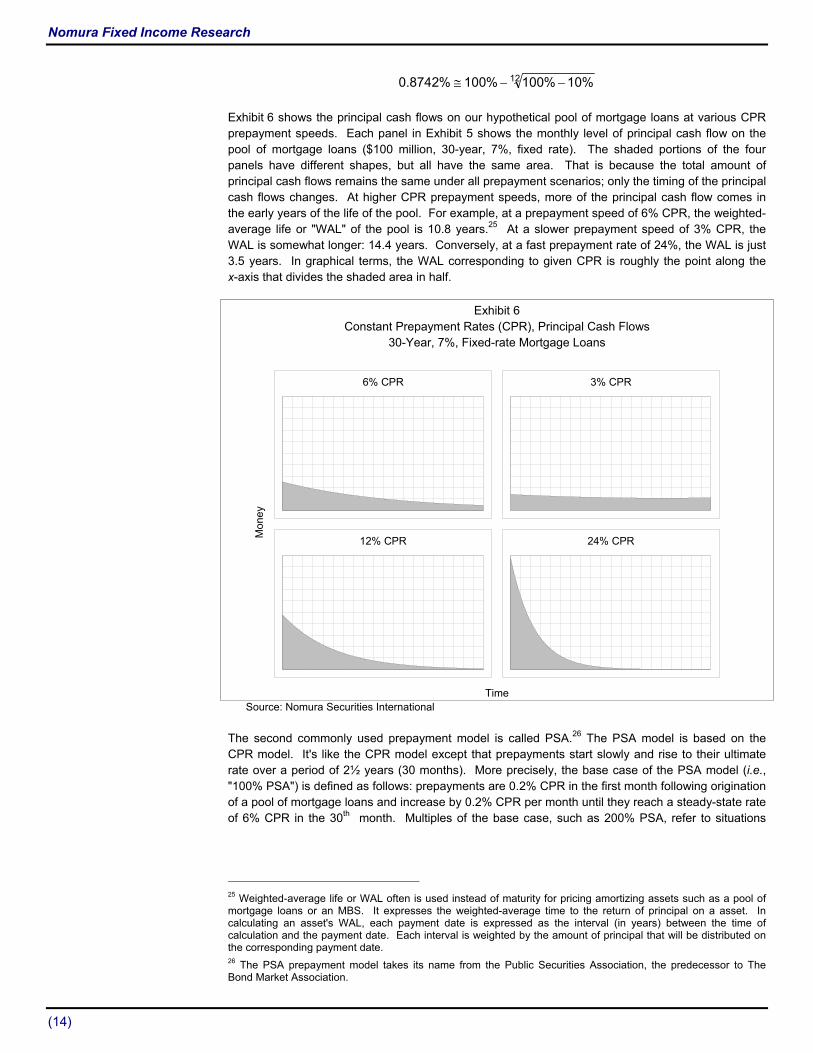
The top left panel of Exhibit 9 shows the entire, undivided cash flow at a prepayment speed of 165% PSA. The top right panel shows the principal cash flow to each of the four classes at that speed. In the example, the four classes comprise 40%, 30%, 20%, and 10%, respectively, of the total principal amount of the pool. In an actual deal, they might be designated classes A1, A2, A3, and A4.
Exhibit 9 Slicing Principal Cash Flows over Time: Building a CMO
165% PSA 165% PSA
A1 A2 A3
350% PSA 75% PSA
Time
Source: Nomura Securities International
The lower panels show the cash flows to each class at both faster (350% PSA) and slower (75% PSA) prepayment speeds. CMO classes of the type shown in Exhibit 9 are called "sequential" classes.
Notice how changes in the overall prepayment speed cause a greater change in the timing of the cash flows on the last class (A4) than on the first class (A1). In effect, the process of tranching has shifted some prepayment risk from the early classes to the later ones. In addition, notice how the process of tranching creates securities that return their principal within narrower payment "windows" than the whole undivided pool.
Example: Weighted-Average Lives of CMO Classes in Exhibit 9
(years)
Class 165% PSA (base case)
350% PSA (fast)
75% PSA (slow)
A1 3.1 2.0 4.9 A2 8.0 4.5 13.5 A3 14.4 7.9 21.6 A4 23.1 14.0 27.8
Source: Nomura Securities International
It is common in a CMO transaction for the different classes to bear interest at different rates. In fact, some classes may bear interest at fixed rates while other classes bear interest at floating rates. In some cases, a class of floating rate classes may have a complementary class which floats in the opposite direction. Such a class is often referred to as an "inverse floater."
Mon
ey

Nomura Fixed Income Research
(18)
A CMO issuer benefits from being able to offer classes with different WALs at different interest rates. If the yield curve is upwardly sloping,29 the issuer will benefit from issuing classes with shorter WALs because, all else being equal, those classes will pay lower yields. In effect, the issuer "walks up the yield curve," selling as many classes as possible at lower short-term interest rates. This results in lower overall interest costs than would a traditional, single-class pass-through.
After introducing the earliest CMOs, MBS professionals devised fancier ways for tranching mortgage cash flows. For example, the created "planned amortization classes" (PACs). A PAC is a type of CMO class that is partially protected from prepayment risk. A PAC is designed with an amortization schedule that can be maintained provided that actual prepayments do not experience severe fluctuations. In quantitative terms, a PAC's amortization schedule can be maintained provided that actual prepayments occur at a constant rate no greater than a specified maximum speed (i.e., the "upper band") and no slower than a specified minimum speed (i.e., the "lower band"). Protection for a PAC comes from one or more corresponding "companion classes" that absorb fluctuations in mortgage loan cash flows to stabilize the cash flow to the PAC. If rapid prepayments cause the companion classes to be retired while the PAC remains outstanding, the protection for the PAC will have been exhausted and the PAC will be "naked." If subsequent cash flow fluctuations make a PAC diverge from its amortization schedule, the PAC will be "busted."
Exhibit 10 depicts the dynamics of a CMO with PACs. The top-left panel shows how the upper (350% PSA) and lower (75% PSA) PAC bands define the PAC cash flow. The PAC cash flow is the area under both curves (i.e., the intersection of the areas bounded by each curve).
The top-right panel of Exhibit 10 shows the PAC cash flow tranched into four classes. The remaining cash flow from the pool is represented as a single companion class on top of the PACs. The top-right panel shows how the companion class would receive cash flow over the entire life of the pool if prepayments occur at an intermediate rate of 165% PSA.
Exhibit 10 Shifting Prepayment Risk: Building PACs in a CMO
Defining PAC Cashflow
PAC
165% PSA
350% PSA 75% PSA
Time
Source: Nomura Securities International
29 Most of the time, the yield curve has an upward slope. That is, long-term rates usually are higher than short term rates. Sometimes, however, the yield curve may be relatively flat or may have a downward slope.
Mon
ey

Nomura Fixed Income Research
(19)
The lower panels of Exhibit 10 show the effect of prepayments at the upper and lower PAC bands, respectively. In those scenarios, the companion class absorbs all the timing variability and insulates the PACs from prepayment risk. At speeds beyond the bands, one or more of the PACs would become busted (would fail to keep on its amortization schedule).
Tranching mortgage loan cash flows in a CMO shifts prepayment risk from one class or group of classes to another. In the PAC example above, the tranching shifted prepayment risk from the PACs to the companion class.
Exhibit 11 takes the example one step further. It shows the PACs as a single class and divides the companion class into three separate classes. Notice how the timing of cash flows on each of the companion classes varies greatly under differing prepayment speeds. In addition, among the companion classes, notice how the timing of cash flow on the third one experiences the greatest variability. Under the intermediate case of 165% PSA, the third companion class has a WAL of 20.1 years. Under the fast case of 350% PSA, the WAL becomes a short 5.1 years while under the slow case of 75% PSA the WAL extends to 26.3 years.
Exhibit 11 Shifting Prepayment Risk: Sensitivity of Companion Classes
165% PSA 165% PSA
350% PSA 75% PSA
Time
Source: Nomura Securities International
Another kind of CMO tranche is the "targeted amortization class" or TAC. A TAC differs from a PAC in that the TAC provides protection only against rapid prepayments. That is, a TAC is structured so that if prepayment rates increase the prepayments will be diverted to the corresponding support classes. A TAC does not provide protection against decreases in prepayment rates. Accordingly, if prepayment rates decrease, the WAL of a TAC will extend.
In addition to allocating prepayment risk through the creation of PACs, TACs, and support classes, CMOs often include interest-only and principal-only classes as well. The features of these types of classes can be combined with the features of PACs and TACs to create "PAC PO" classes, "TAC PO" classes, and "PAC IO" classes.
It is common in CMO transactions for interest to be paid currently on all classes except for the class with the latest final maturity date. Interest on the final class is added to the outstanding principal amount of the class as it accrues. A CMO class of that type is often called a "Z" class because it has
Mon
ey

Nomura Fixed Income Research
(20)
a zero coupon. One variation on the basic Z class is the "Z PAC." A Z PAC is simply a PAC with an accruing coupon. Another variation on the basic Z class is the "companion Z class." A companion Z class is simply a support class with an accruing coupon.
A third variation on the basic Z class is the "Jump Z class." A Jump Z class "jumps" to the front of the line if certain conditions are met. More specifically, if the specified conditions are met (e.g., prepayment rates increase above a particular level), all or a component of the principal cash flow generated by the underlying loans is allocated to the Jump Z class. There are two types of Jump Z classes: "Sticky Jump Z classes" and "Non-sticky Jump Z classes." The difference between the two is whether or not the Jump Z class retains its priority for receiving all or a component of the collateral cash flow if the specified condition ceases to be met. A Sticky Jump Z class can only jump once; after it jumps it always retains its priority. A Non-sticky Jump Z class can jump back and forth ("toggle") an unlimited number of times.
In addition to the above-described varieties of CMO classes, issuers and investment bankers have created many other types of classes. All share the common feature of little or no credit risk. Where they differ is in the allocation of prepayment risk. Certain CMO classes may have exotic names, but ultimately, the analysis of the risks associated with a particular class turns on the sensitivity of the cash flow on the class to changes in prepayment rates. Because prepayment risk, in the aggregate, cannot be eliminated but rather merely allocated among the classes of a particular issue, the analysis of the risks associated with any type of support class depends on a complete understanding of the protections provided to the corresponding protected classes.
CMO Residuals: Each CMO includes a tranche called the "residual." In principle, the residual tranche receives any cash flow that remains after all the other tranches have been retired. More importantly, special (and onerous) tax treatment applies to residuals from CMOs that are REMICs.
Many CMOs are structured so precisely that their residuals do not receive any cash flow at all. Those residuals are called "non-economic" residuals and their sole purpose relates to taxes. However, in some CMOs, the residuals do receive cash flow and have economic value.
Economic residuals are complex instruments and may be highly volatile. They are not well understood by many investors. Both the amount and timing of the cash flow are sensitive to changes in interest rates and the rate at which the underlying mortgage loans are prepaid. Residuals are more sensitive to interest rate fluctuations than most other CMO classes.30
X. Private-Label MBS & Credit Enhancement
Although the GSEs produce most MBS, private sector companies also create MBS completely apart from the GSEs. Those MBS are called "private label MBS" and they are not guaranteed by any of the GSEs. Most private label securities carry ratings from the rating agencies. They use subordination or other forms of credit enhancement to achieve triple-A ratings on at least a portion of the MBS created in a deal.
Private-label MBS generally comprise mortgage loans that would not qualify for inclusion in agency MBS. For example, "jumbo" mortgage loans exceed the size limits for agency MBS but conform to traditional GSE guidelines in other respects (i.e., standard loan terms and prime-quality borrowers). So-called "alternative-A" have borrowers of "A" creditworthiness but contain one or more non-standard features. Examples of non-standard features include (i) no information about the borrower's income or assets, (ii) unusual property types such as vacation home or rental property, and (iii) a very high loan amount in relation to the value of the property (i.e., a high loan-to-value
30 Some other types of CMO classes also display high volatility. These include: inverse floaters, support classes of PACs and TACs, Z classes, and so-called super PO classes.

Nomura Fixed Income Research
(21)
ratio). Alt-A mortgage loans generally have interest rates that are in the range of 0.50% to 1.25% higher than standard, prime-quality loans.
"Sub-prime" mortgage loans usually are loans to borrowers with blemished credit records. A typical sub-prime borrower has been delinquent by at least 30 days on his mortgage loan during the past year. However, some borrowers may be classified as sub-prime for other reasons, such as lacking financial reserves or the level income usually associated with the size of loan that they are seeking. Sub-prime mortgage loans have interest rates higher than alt-A mortgage loans.
Mortgage Loan Credit Quality: The credit quality of a mortgage loan depends on various factors. Traditionally, mortgage lenders identified three factors as the main ones in evaluating the credit risk on a mortgage loan:
• COLLATERAL coverage – measured by loan-to-value ratio (LTV)
• borrower CREDIT history – measured by credit score (e.g. FICO score)
• borrower payment CAPACITY – measured by debt-to-income ratio (DTI)
In addition, many secondary factors, such as the type of loan (fixed or adjustable rate) or the type of property (house, mobile home, or apartment) affect the riskiness of a residential mortgage loan. The rating agencies and the GSEs publish extensively on the subject of mortgage loan credit risk.31
Naturally, the actual credit performance of mortgage loans depends not only on the characteristics of the loans but also on the economic environment. During good times, few loans default and produce losses, while under stressful conditions a greater number do so. One of the best ways to measure credit performance is through lifetime cumulative losses on static pools or on whole vintages of loans.32 Exhibit 12 shows the level of cumulative losses reported on different vintages of loans in the jumbo, alternative-A, and sub-prime categories.
31 See, e.g., Federal National Mortgage Association, Single-Family Selling Guide, Part X, Chapter 3 (31 Jan 2006); Federal Home Loan Mortgage Corporation, 1 Single-Family Seller/Servicers' Guide, Chapter 37 (28 Jun 2004); Siegel, J. et al., Moody's Approach to Rating Residential Mortgage Pass-Through Securities, Moody's special report (8 Nov 1996); Siegel, J., Moody's Mortgage Metrics: A Model of Analysis of Residential Mortgage Pools, Moody's special report (1 Apr 2003); Standard & Poor's, Residential Mortgage Criteria (1997). 32 The term "static pool" generally refers to a specific pool of loans originated by a company in the same month (or other suitable period). Static pool performance data shows how a particular performance measure changes over time for a given static pool. For example, static pool data on losses would show the ratio of cumulative losses to original principal balance for each month following the origination of a pool of loans. A vintage of loans refers to all the loans produced by a given lender or by the whole lending industry in a particular year (or other specified period). The term vintage connotes a more extensive aggregation of loans than a single static pool. Cumulative losses are measured as a percentage of the original principal balance of a static pool or vintage.

Nomura Fixed Income Research
(22)
Exhibit 12Mortgage Loan Credit Performance (as of March 2006)
0.0%
0.5%
1.0%
1.5%
2.0%
2.5%
3.0%
3.5%
4.0%
4.5%
5.0%
1990
1991
1992
1993
1994
1995
1996
1997
1998
1999
2000
2001
2002
2003
2004
2005
Origination Year
Cum
ulat
ive
Loss
es
Jumbo
Alt-A
Sub-prime
Source: LoanPerformance.com
Notice that recent vintages of loans display low levels of losses. That is partly because loans rarely default (and produce losses) in their first or second year after origination. Losses on a pool of mortgage loans generally start to peak only after the loans have aged by three to five years. The vintages from 2000 and earlier have already experienced nearly all the losses that they ever will. Few loans from those vintages remain outstanding and they represent just a tiny fraction of the original total. The vast majority of loans from those vintages were prepaid in the waves of refinancing activity in 2003 and 2004.
Based on the performance of vintages from 1997 through 2000, it is tempting to conclude that: (i) pools jumbo mortgage loans generally should have cumulative losses of less than 10 basis point, (ii) pools of alt-A loans should have losses in the range of 10 to 60 basis points, and (iii) pools sub-prime loans should have losses in the range of 4% to 5%. However, such a conclusion arguably would be a mistake. The credit performance of those vintages reflects a generally good economy and a period of rising home prices. Losses on newer vintages could be considerably higher if the economy deteriorates or if home prices stop rising or start to decline. Also, the individual pools from a given origination year can perform very differently from the average for that year. For example, some pools of "prime quality" loans from the 1988 to 1991 vintages experienced losses above 5%.33
Credit Enhancement: To achieve high ratings from the rating agencies, private-label MBS require credit enhancement to counterbalance the credit risk of the loans. The most common type of credit enhancement in private-label MBS is subordination, or the "senior-subordinate structure." In such a structure, one or more subordinate classes absorb losses and must be wiped out before any losses are allocated to the senior classes. Subordination is another type of tranching. In contrast to slicing along the dimension of time, subordination entails slicing along the dimension of credit.
Six Pack Structure: Most private label MBS backed by standard jumbo mortgage loans use the so-called "six pack" subordination structure for credit enhancement. Many alt-A MBS also use the six pack structure.
33 For example: Citicorp Mortgage Securities, Series 1989-05, 1989-A, 1989-C, 1989-D, 1990-5, 1990-11, and 1990-A. Also see, Residential Funding Mortgage Securities I, Series 1989-S6, 1990-S1, and 1990-5.

Nomura Fixed Income Research
(23)
The term "six pack" refers to the use of six layers of subordination. In the six pack structure, realized losses on the underlying mortgage loans are allocated to the most subordinate class, until it is wiped out, and then to the next most subordinate class.
Sample Six Pack Structure
Class Size Ratings A 94.15% Aaa/AAA B1 2.00% Aa2/AA B2 1.50% A2/A B3 1.00% Baa2/BBB B4 0.65% Ba2/BB B5 0.40% B2/B B6 0.30% not rated
An additional feature of the six pack structure is a prepayment lockout that preserves the size of the subordinate classes by preferentially allocating prepayments to the senior class. At the start of a deal, all prepayments are allocated to the senior class. Later, if certain conditions are satisfied, the lockout phases out. A typical arrangement is to maintain the lockout either until the seventh year of the deal or until the proportionate size of the subordinate classes has grown to two times its original level. If the size of the subordinate class doubles during the first three years, the lockout phases out by half. After three years, doubling of the subordinate classes permits full phase-out of the lockout. However, in all cases, if the underlying pool experiences high delinquencies or losses, the lockout is preserved.
OC Structure: Some MBS backed by alt-A loans use a different type of subordination structure called the "OC structure." OC stands for overcollateralization. Deals backed by sub-prime mortgage loans also generally use the OC structure. Professionals usually classify such sub-prime deals as real estate ABS rather than as MBS.
The defining characteristics of the OC structure is that it uses excess spread as credit enhancement. In a typical OC structure there are three distinct layers of credit enhancement: (1) current period excess spread, (2) overcollateralization, and (3) subordination. In an OC structure, the pool balance and the certificate balance can differ – the difference is the OC.
In an OC structure, excess spread is the first line of defense against credit losses. Excess spread is the difference between the net interest rate on the underlying loans and the weighted-average coupon on the certificates. Excess spread can amount to several percentage points per year, which is available on a flow basis over the life of a deal – essentially similar to a subordinated interest-only security. For example, suppose that a mortgage pool has a weighted-average gross mortgage interest rate of 6¼%. After deducting the servicing fee, the weighted average net mortgage rate would be 6%. Suppose that the senior certificates pay a coupon of one-month LIBOR plus 35 bps. If one-month LIBOR is 4.65%, that translates into a certificate rate of 5.00%. Thus, the pool produces excess spread of 100 bps.
The first use for excess spread is to cover current period losses. Beyond that, however, an OC structure usually provides a mechanism to capture "unused" excess spread for potential future use. The most common mechanism is to apply excess spread to pay down the principal balance of senior certificates. The senior class experiences accelerated amortization. Sometimes this is called turbo-ing the senior class. This creates a mismatch between the pool balance and the certificate balance. The difference is called overcollateralization (OC). The OC provides a cushion against future losses.
For example, a deal might provide that excess spread will be used first to cover current period losses. Next, remaining excess spread will be applied to repay the most senior class until OC of 1.50% has been created. After three years, if excess spread has built up the OC to the target level, further excess spread is available for distribution to residual certificates, provided that the pool meets certain performance tests. If subsequent losses on the underlying loans diminish the deal's accumulated

Nomura Fixed Income Research
(24)
OC, excess spread collected in later months will be applied to amortize the senior class in order to restore the OC to its target level.
In a typical OC structure, the overcollateralization is the equivalent of a non-interest bearing subordinate class contained within the deal's residual interest. The OC provides protection to all the other classes of the deal against losses that exceed the excess spread in a given month. If losses on the underlying loans are charged against the deal's accumulated OC, excess spread collected in subsequent months will be applied to amortize outstanding bonds in order to restore the OC to its target level.
A typical OC structure also uses a trigger mechanism to restrict distributions of principal to the subordinate classes of the deal. This has the effect of strengthening the credit quality of the most senior class at the expense of the other classes.
One of the strongly positive features of excess spread as a component of a deal's credit enhancement is that it "adjusts" to the deal's changing loss potential. As noted above, there is less excess spread when prepayments are fast. However, high prepayments also go hand-in-hand with lower losses, because once a loan has prepaid it can no longer default. Conversely, there is more excess spread when prepayments are slow, which is when a deal has greater ongoing exposure to the risk of loss on its underlying loans.
A OC structure uses a trigger mechanism to restrict distributions of principal to the subordinate and residual classes of the deal. This has the effect of strengthening the credit quality of the most senior class, but at the expense of the other classes.
OC structures often include two kinds of triggers: one based on delinquencies and one based on cumulative losses. For example, a deal might include a delinquency trigger level equal to half the subordination (including OC) supporting the senior class. If the three-month rolling-average of delinquencies exceeds the trigger level, the test would fail and any excess spread would have to be paid to the senior class, thus increasing the amount of OC. Likewise, if cumulative losses on the pool exceed specified levels (scheduled over time) all excess spread would be paid to the senior classes.
Further Variations on Credit Enhancement: In so-called "fast pay/no-pay" senior-subordinated structures no distributions of principal may be made to holders of the subordinate certificates until the senior certificates have been retired. A variation on the fast-pay/no-pay theme is a structure in which all prepayments of principal are allocated to the senior certificates until they are retired. Scheduled collections of principal are allocated pro rata between the senior certificates and the subordinated certificates, unless needed to cover a current shortfall or for deposit into a reserve fund.
In the past, some senior-subordinated arrangements provided for a reserve fund in which amounts otherwise payable to the holders of the subordinated certificates were held to protect against future losses on the underlying mortgage loans. Such an arrangement offers the benefit of maintaining a high level of credit enhancement as the balance of the underlying mortgage pool declines. The reserve fund is similar to OC but its source is subordinate allocations rather then excess spread.
Some transactions use bond insurance or other forms of guarantees for credit enhancement. Mortgage pool insurance policies are an interesting variation because the guarantee does not relate directly to scheduled payments on the pass-through certificates but rather to collections on the underlying pool. Guarantees by banks take the form of stand-by letters of credit. Guarantees by other types of entities (for example, bank holding companies) are usually called simply "guarantees." Letters of credit and guarantees were more common in the past when many banks and other guarantee providers had triple-A ratings.

Nomura Fixed Income Research
(25)
XI. Conclusion
MBS account for a large piece of the capital markets. Prepayment risk is the main feature that differentiates MBS from other fixed income securities. Prepayment risk gives MBS the undesirable attribute of negative convexity. Beyond simple pass-through securities, MBS issuers can use elaborate tranching strategies to create securities with greater or lesser degrees of prepayment risk.
The main force in the MBS market is the GSEs: Fannie Mae, Freddie Mac, and Ginnie Mae. They create both simple pass-through securities and elaborate CMOs/REMICs. The GSEs guarantee all their MBS against credit losses and the market treats the GSE guarantee as very strong. Separately, private sector issuers create MBS from loans that do not qualify for the GSE programs. The private-label MBS do carry GSE guarantees and usually use some form of subordination for credit enhancement.
MBS is a big subject and this paper provides an introduction. It hints at the depth of the subject and the technical complexity of MBS modeling and pricing. However, achieving true expertise in MBS requires much more than reading this paper. It requires mastery of tools such as Bloomberg and Intex. It requires time, effort, and patience for extensive further study.

Nomura Fixed Income Research
(26)
Appendix: Timeline of Early MBS Evolution
MBS Pre-History (before 1930): Long before the first MBS was ever created, financial institutions engaged in the practice of "participating" in each other's loans. That is, one bank could purchase a "piece of the action" in another bank's loan to a borrower. Among the major commercial banks, this practice dates back to before the turn of the century.
1934: In partial response to the Great Depression, Congress established the FHA in 1934 to provide government guaranteed mortgage insurance.34 Creating the FHA was one of the earliest expressions of a national housing policy directed toward promoting home ownership.
1938: In 1938, Congress created the original Federal National Mortgage Association to provide a secondary market in FHA-insured mortgages.35 The original Fannie Mae performed two functions: the "special assistance" function and the "secondary mortgage market" function.
The special assistance function amounted to a form of subsidy to provide low interest rate mortgage loans through certain of the FHA programs. The loans had below-market interest rates, which made them worth less than other loans. Fannie Mae purchased the loans at a price of par (which was more than the loans were worth) and, if required, resold the mortgage loans at discount prices. The U.S. Treasury had to bear the loss that Fannie Mae incurred through its special assistance function.36
All of Fannie Mae's other operations were called the "secondary market function". Those too were limited to FHA-insured mortgage loans. The secondary market function was not a subsidy and was required to be completely self-supporting.37
1948: In 1948, Fannie Mae purchased its first mortgage loan guaranteed by the VA.
1949: In 1949, the first secondary market transaction between two savings and loan associations took place.38
1954: In 1954, the Fannie Mae Charter Act converted Fannie Mae to a privately owned and financed corporation. The Housing and Home Finance Agency retained supervisory authority over Fannie Mae.39
1957: In 1957, the Federal Home Loan Bank Board ("FHLBB") issued the first regulations permitting thrift institutions to buy and sell participation interests in mortgage loans.40
1968: In 1968, Congress created the Ginnie Mae and transferred to it the special assistance function formerly performed by Fannie Mae.41 At that time, Fannie Mae ceased to be a government agency
34 Pub. L. No. 73-479, 48 Stat. 1246, 1252 (1934); Krasnowiecki, Miller and Ziff, The Kennedy Mortgage Co. Bankruptcy Case: New Light Shed on the Position of Mortgage Warehousing Banks, 56 Am. Bankr. L.J. 325, 326 (1982) [hereinafter, "Krasnowiecki"]; Murray and Hadaway, Mortgage-Backed Securities: An Investigation of Legal and Financial Issues, [Winter 1986] J. Corp. L. 203, 205 (1986) [hereinafter, "Murray"]; Note, Section 106 of the Secondary Mortgage Market Enhancement Act of 1984 and the Need for Overriding State Legislation, 13 Fordham Urb. L.J. 681, 687 n.47 (1985) [hereinafter, "Bleckner"]. 35 Murray at 205; Lore, Mortgage-Backed Securities -- Developments and Trends in the Secondary Mortgage Market (1987-88 ed.), § 2.03 at 2-18 (1987) [hereinafter, "Lore"]. 36 Krasnowiecki at 327. 37 Krasnowiecki at 327 (citing Title III, National Housing Act § 304(a)(1), 12 U.S.C. § 1719(a)(1)). 38 Murray at 205. 39 Lore § 2.03 at 2-19. 40 Murray at 205. 41 Krasnowiecki at 327; Bleckner at 687 nn.42, 43; Lore § 2.03 at 2-19; Pub. L. No. 90-448, 82 Stat. 536 (1968), 12 U.S.C. §§ 1716b, 1717(a)(2) (LII 2005).

Nomura Fixed Income Research
(27)
but remained subject to the oversight by HUD.42 Nonetheless, the market still uses the term "agency" to refer to Fannie Mae as well the other GSEs.
1970: In 1970, Ginnie Mae guaranteed the first publicly traded pass-through securities representing undivided interests in "pools" of FHA/VA mortgage loans.43
Also in 1970, Congress created Freddie Mac to provide a secondary mortgage market for conventional mortgage loans (i.e., loans not supported by insurance or a guarantee from the federal government).44 Congress also authorized Fannie Mae to provide a secondary market for the conventional mortgage loans.45
1971: In 1971, Freddie Mac introduced the first conventional mortgage pass-through certificate.46
1971-1977: From 1971 through 1977, virtually all mortgage-backed securities ("MBS") were either guaranteed by Ginnie Mae or issued directly by Freddie Mac. During that period, the volume of outstanding MBS issued or guaranteed by the two agencies increased dramatically. Fannie Mae had not yet become actively involved in issuing MBS. Fannie Mae continued to purchase mortgage loans to hold in its portfolio and did not commence actively issuing MBS until later. Private institutions developed an interest in creating and issuing their own MBS without the involvement of the agencies.
1977: In 1977, Bank of America National Trust & Savings Association became the first true private sector issuer of MBS.47
From 1978 to 1984, a limited number of private institutions became issuers of MBS. The major Wall Street investment banking firms established MBS departments. The major impediment to the growth of the market for private (i.e., non-agency) MBS were legal restrictions on the ability of regulated institutional investors to invest in private MBS.
1983: In June 1983, FHLMC issued the first collateralized mortgage obligations ("CMOs").48
1984: In 1984, the Secondary Mortgage Market Enhancement Act of 1984 ("SMMEA") became law.49 The most important change brought about by SMMEA was the removal of restrictions on investment by regulated financial institutions in many private MBS.50
1986: In July 1986, FNMA issued the first stripped MBS providing for disproportionate allocation of principal and interest between two classes of certificates representing interests in a single mortgage pool.51
In 1986, the Tax Reform Act of 1986 became law and established real estate mortgage investment conduits ("REMICs") as a new tax classification for CMOs and certain other MBS.52 The REMIC tax
42 Murray at 205; Krasnowiecki at 327; Bleckner at 687 n.43; 82 Stat. 536 (1968), 12 U.S.C.A § 1717(a)(2), (b)(6), (LII 2005). 43 Murray at 205; Lore § 2.02 at 2-6. 44 Emergency Home Finance Act, Pub. L. No. 91-351, 84 Stat. 451 (1970), 12 U.S.C.A § 1451 et seq. (LII 2005). 45 Krasnowiecki at 327-28. 46 Murray at 205. Lore sets the date of FNMA's first conventional mortgage purchase as 1972. Lore § 2.03 at 2-31. 47 Bank of America National Trust and Savings Association, SEC No-Action Letter [1977-1978 Transfer Binder] Fed. Sec. L. Rep. (CCH) ¶ 81193 (May 19, 1977). 48 Lore § 2.04 at 2-52. 49 Pub. L. No. 98-440, 98 Stat. 1689 (1984). 50 Pub. L. No. 98-440, §§ 105-106, 98 Stat. 1689, 1691-92 (1984) (amending 12 U.S.C. §§ 24 (seventh), 1464(c)(1), 1757). 51 Lore § 2.03 at 2-43. 52 I.R.C §§ 860A-860G; Pub. L. No. 99-514, § 671, 100 Stat. 2085, 2309 (1986).

Nomura Fixed Income Research
(28)
classification provided greater flexibility to issuers in structuring MBS and caused a further expansion of the MBS market.
1989: In August 1989, the Financial Institutions Reform, Recovery, and Enforcement Act of 1989 ("FIRREA") was signed into law. FIRREA abolished the FHLBB and transferred certain of its regulatory functions to the newly created Office of Thrift Supervision ("OTS").53
— E N D —
53 Pub. L. No 101-73, 103 Stat. 183 (1989).

Nomura Fixed Income Research
(29)
Recent Nomura Fixed Income Research Fixed Income General Topics
• Update on U.S. Fixed Income Market Conditions (6 Mar 2006) • Rating Shopping – Now the Consequences (16 Feb 2006) • Report from Las Vegas – Coverage of Selected Sessions of ASF 2006 (3 Feb 2006) • U.S. Fixed Income 2006 Outlook/2005 Review (15 Dec 2005) • Condition of the U.S. Housing Market (3 Nov 2005) • Structured Finance Trends – Yield Spreads, Credit Support, and
Collateral Performance – The Big Picture (27 Jun 2005) • Bond Portfolio Credit Analysis … The CDO Approach (24 May 2005)
ABS/CDO • CDO/CDS Update (27 Mar 2006) • Synthetic ABS 101: PAUG and ABX (7 Mar 2006) • Student Loan ABS Update (21 Feb 2006) • Report from Arizona 2006 – Coverage of Selected Sessions of ABS West 2006
(15 Feb 2006) • The Evolution of Commercial Real Estate CDOs (4 Jan 2006) • Model Risk Update – Margins of Error and Scenario Analysis (29 Nov 2005) • Correlation Redux (17 Oct 2005) • Report from Boca Raton 2005: Coverage of Selected Sessions of ABS East 2005
(20 Sep 2005) • Anatomy of a Credit CPPI (8 Sep 2005) • Constant Maturity CDS (CMCDS) – A Guide (20 May 2005)
MBS/CMBS • The CMBX: the Future is Here (23 Mar 2006) • February 2006 CMBS Monthly (10 Mar 2006) • GNMA Project Loan Prepayment Report (10 Feb 2006) • GNPL REMIC Factor Comparison (24 Jan 2006) • CMBS Credit Migrations 2005 Update (30 Nov 2005) • Overview of the ARMs Market (23 Nov 2005) • FHA/VA Monthly (12 Apr 2005) • Some Investment Characteristics of GNMA Project Loan Securities (4 Apr 2005)
Strategy • Examining the Economic Impact of Home Price Appreciation (HPA) (23 Mar 2006) • FAS 155: A Catalyst for Synthetic CDO Market Growth? (23 Mar 2006) • MBS: Strategies for Rising Volatility Environment (22 Mar 2006) • RMBS: Estimating Credit Impact of "ARM Reset Risk" (21 Mar 2006) • RMBS: Large Regional Differences in Credit Performance (17 Mar 2006) • Fed Fund Policy and the "Taylor Rule" (16 Mar 2006) • SEC Regulation of Credit Rating Agencies (15 Mar 2006) • Corporate Bonds: Sector Recommendations (14 Mar 2006) • Housing Prices: Lower Affordability in CA & FLA (14 Mar 2006) • ABS: BBB HEL Spreads Driving CDO IRRs Lower (10 Mar 2006) • Jumbo-A MBS: Luxury Home Prices Still Robust (7 Mar 2006) • Home Prices: OFHEO 4 th Qtr. 2005 HPI March 7, 2006 • Banks: Tighter Standards on Nontraditional Mortgages? March 6, 2006 • MBS: Bank Holdings & the Inverted Curve March 1, 2006 • Housing Affordability Continues to Slip (28 Feb 2006) • MBS Credit: FICO Scores & Default Risk (24 Feb 2006) • Hybrid Securities: Higher Yielding Corporate Alternatives (22 Feb 2006) • TIPS Outlook: Neutral Short-Term, Positive Longer-Term (16 Feb 2006) • Federal Reserve: Report on Bank Lending Standards (16 Feb 2006) • Agency Bonds: Value in European Callables (14 Feb 2006) • US Housing: National Foreclosure Rates Climbing (10 Feb 2006) • California Housing: Slowdown Ahead? (10 Feb 2006) • Home Prices: Will Smaller MSAs Outperform in 2006? (10 Feb 2006) • MBS Relative Value: Net Carry Across the Coupon Stack (8 Feb 2006) • MBS: Market Check-up: February Update (7 Feb 2006) • Basel 1A, II – Just Around the Corner (7 Feb 2006) • GNMA/FNMA Swaps – Could Stay Rich (6 Feb 2006)

Nomura Fixed Income Research
(30)
I Mark Adelson, a research analyst employed by Nomura Securities International, Inc., hereby certify that all of the views expressed in this research report accurately reflect my personal views about any and all of the subject securities or issuers discussed herein. In addition, I hereby certify that no part of my compensation was, is, or will be, directly or indirectly related to the specific recommendations or views that I have expressed in this research report, nor is it tied to any specific investment banking transactions performed by Nomura Securities International, Inc., Nomura International plc or by any other Nomura Group company or affiliate thereof.
© Copyright 2006 Nomura Securities International, Inc. This publication contains material that has been prepared by the Nomura entity identified on the banner at the top of page 1 herein and, if applicable, with the contributions of one or more Nomura entities whose employees and their respective affiliations are specified on page 1 herein or elsewhere identified in the publication. Affiliates and subsidiaries of Nomura Holdings, Inc. (collectively, the “Nomura Group”) include: Nomura Securities Co., Ltd. ("NSC") and Nomura Research Institute, Ltd., Tokyo, Japan; Nomura International plc and Nomura Research Institute Europe, Limited, United Kingdom; Nomura Securities International, Inc. ("NSI") and Nomura Research Institute America, Inc., New York, NY; Nomura International (Hong Kong) Ltd., Hong Kong; Nomura Singapore Ltd., Singapore; Nomura Australia Ltd., Australia; P.T. Nomura Indonesia, Indonesia; Nomura Malaysia Sdn. Bhd., Malaysia; Nomura International (Hong Kong) Ltd., Taipei Branch, Taiwan; or Nomura International (Hong Kong) Ltd., or Nomura International (Hong Kong) Ltd., Seoul Branch, Korea. This material is: (i) for your private information, and we are not soliciting any action based upon it; (ii) not to be construed as an offer to sell or a solicitation of an offer to buy any security in any jurisdiction where such an offer or solicitation would be illegal; and (iii) is based upon information that we consider reliable, but we do not represent that it is accurate or complete, and it should not be relied upon as such. Opinions expressed are current opinions as of the original publication date appearing on this material only and the information, including the opinions contained herein are subject to change without notice. In addition, other members of the Nomura Group may from time to time perform investment banking or other services (including acting as advisor, manager or lender) for, or solicit investment banking or other business from, companies mentioned herein. Further, the Nomura Group, and/or its officers, directors and employees, including persons, without limitation, involved in the preparation or issuance of this material may, from time to time, have long or short positions in, and buy or sell (or make a market in), the securities, or derivatives (including options) thereof, of companies mentioned herein, or related securities or derivatives. Fixed income research analysts, including those responsible for the preparation of this report, receive compensation based on various factors, including quality and accuracy of research, firm’s overall performance and revenue (including the firm’s fixed income department), client feedback and the analyst’s seniority, reputation and experience. NSC and other non-US members of the Nomura Group, their officers, directors and employees may, to the extent it relates to non-US issuers and is permitted by applicable law, have acted upon or used this material, prior to or immediately following its publication. Foreign currency-denominated securities are subject to fluctuations in exchange rates that could have an adverse effect on the value or price of, or income derived from the investment. In addition, investors in securities such as ADRs, the values of which are influenced by foreign currencies, effectively assume currency risk. The securities described herein may not have been registered under the U.S. Securities Act of 1933, and, in such case, may not be offered or sold in the United States or to U.S. persons unless they have been registered under such Act, or except in compliance with an exemption from the registration requirements of such Act. Unless governing law permits otherwise, you must contact a Nomura entity in your home jurisdiction if you want to use our services in effecting a transaction in the securities mentioned in this material. This publication has been approved for distribution in the United Kingdom and European Union by Nomura International plc (“NIPlc”), which is authorised and regulated by the UK Financial Services Authority (“FSA”) and is a member of the London Stock Exchange. It is intended only for investors who are “market counterparties” or “intermediate customers” as defined by FSA, and may not, therefore, be redistributed to other classes of investors. This publication has also been approved for distribution in Hong Kong by Nomura International (Hong Kong) Ltd. (“NIHK”), which is regulated by the Hong Kong Securities and Futures Commission (“SFC”) under Hong Kong laws. Neither NIplc nor NIHK hold an Australian financial services licence as both are exempt from the requirement to hold this license in respect of the financial services either provides. NSI accepts responsibility for the contents of this material when distributed in the United States. This publication has also been approved for distribution in Singapore by Nomura Singapore Limited. No part of this material may be (i) copied, photocopied, or duplicated in any form, by any means, or (ii) redistributed without the prior written consent of the Nomura Group member identified in the banner on page 1 of this report. Further information on any of the securities mentioned herein may be obtained upon request. If this publication has been distributed by electronic transmission, such as e-mail, then such transmission cannot be guaranteed to be secure or error-free as information could be intercepted, corrupted, lost, destroyed, arrive late or incomplete, or contain viruses. The sender therefore does not accept liability for any errors or omissions in the contents of this publication, which may arise as a result of electronic transmission. If verification is required, please request a hard-copy version. Additional information is available upon request. NIPlc and other Nomura Group entities manage conflicts identified through the following: their Chinese Wall, confidentiality and independence policies, maintenance of a Stop List and a Watch List, personal account dealing rules, policies and procedures for managing conflicts of interest arising from the allocation and pricing of securities and impartial investment research and disclosure to clients via client documentation. Disclosure information is available at www.nomura.com/research.

NEW YORK TOKYO LONDON
Nomura Securities International Nomura Securities Company Nomura International PLC 2 World Financial Center, Building B 2-2-2, Otemachi, Chiyoda-Ku Nomura House New York, NY 10281 Tokyo, Japan 100-8130 1 St Martin's-le-grand (212) 667-9300 81 3 3211 1811 London EC1A 4NP 44 207 521 2000
David P. Jacob 212.667.2255 International Head of Research
Nomura U.S. Fixed Income Research
David Resler 212.667.2415 Head of U.S. Economic Research Mark Adelson 212.667.2337 Securitization/ABS Research John Dunlevy 212.667.9298 Cross Market Strategist Arthur Q. Frank 212.667.1477 MBS Research Weimin Jin 212.667.9679 Quantitative Research Michiko Whetten 212.667.2338 Quantitative Credit Analyst James Manzi 212.667.2231 CMBS Research/Strategy Gerald Zukowski Deputy Chief Economist Xiang Long 212.667.9652 Quantitative Analyst Cristian Pasarica 212.667.9623 Quantitative Analyst Diana Berezina 212.667.9054 Analyst Jeremy Garfield 212.667.2158 Analyst Edward Santevecchi 212.667.1314 Analyst Pui See Wong 212.667.2132 Analyst Tomoko Nago-Kern 212.667.9894 Translator Kyoko Teratani Translator