Embed Size (px)
Citation preview

Maths Literacy Paper 2
Copyright reserved Please turn over
1
MATHS LITERACY PAPER 2
MARKS: 150 TIME: 3 hours
QUESTION 1
On the 22nd April 2009 South Africa held national elections. On the 19th April, the Sunday Times newspaper published
two graphics (one below and one on the next page) to illustrate the anticipated outcome of the elections in terms of seats in the national and provincial legislatures. Extracts from the accompanying article are reproduced below.
The actual results of the elections in terms of seats in the national and provincial legislatures are reproduced at the bottom of the next page.
There were 23 181 997 registered voters for the 2009 elections.
Use the information provided to answer the questions that follow.
Another Landslide for the ANC DA and COPE are neck and neck, survey finds.
The ANC is on course to scoop 60% of the vote on Wednesday. …
These are among the results of the final election poll conducted by Plus 94 Research between April 3 and 9. … A total of 7 000 voters in urban and rural areas were questioned.
… The poll forecasts that the DA will win the Western Cape – though not outright – while COPE will become the official opposition in six provinces: Mpumalanga, North West, Free State, Northern Cape, Limpopo and Eastern Cape.
(Sunday Times, 19 April 2009)

Maths Literacy Paper 2
Copyright reserved Please turn over
2
National Seats in the provincial legislature
Votes Seats Eastern
Cape Free State
Gauteng KwaZulu-Natal
Limpopo Mpumalanga North West
Northern Cape
Western Cape
ACDP 142 658 3 1 1 1
ANC 11 650 748 264 44 22 47 51 43 27 25 19 14
AZAPO 38 245 1
COPE 1 311 027 30 9 4 6 1 4 1 3 5 3
DA 2 945 829 67 6 3 16 7 2 2 3 4 22
FF 146 796 4 1 1
ID 162 915 4 1 2 2
IFP 804 260 18 1 18
MF 43 474 1 2
PAC 48 530 1
UCDP 66 068 2 2
UDM 149 680 4 3
Other 170 491 1 1
Total 17 680 729 400 63 30 73 80 49 30 33 30 42

Maths Literacy Paper 2
Copyright reserved Please turn over
3
1.1 Answer the following questions regarding the research on which the newspaper article is
based. 1.1.1 What is the name of the organization that conducted the research on which the article
is based? (2) 1.1.2 Why does the Sunday Times name the organization? (2) 1.1.3 Express the sample size as a percentage of the voting population. (4)
A number of predictions are made in the survey. 1.2.1 What is the prediction in terms of the percentage vote that the ANC will get? What
was the actual percentage of votes that the ANC got? (4)1.2.2 The article states that “The poll forecasts that the DA will win the Western Cape –
though not outright”. What is meant by this statement and how accurate was the prediction. (4)
1.2
1.2.3 The survey predicts that: “COPE will become the official opposition in six provinces”. What is meant by this statement and how accurate was the prediction. Provide a detailed substantiation for your answer. (5)
COPE was a new party in the 2009 elections. 1.3.1 Use the grid provided in Appendix A to complete a double bar graph to compare the
number of seats predicted for COPE in each province and the actual number of seats the party won. (5)
1.3
1.3.2 Based on the bar graph and the data available discuss whether or not COPE performed as well as the survey predicted it would? Provide a detailed substantiation for your answer. (4)
1.4 In light of the actual results as well as the analysis we have done in this question, discuss whether or not you think the survey was effective. Provide a detailed substantiation and possible explanations for your answer. (5)
[35]
QUESTION 2
The advertisement below for a VW Tenacity appeared in a local newspaper. Some of the details have been enlarged to make it easier to read them.
In this question we will explore three different ways of paying for the car.

Maths Literacy Paper 2
Copyright reserved Please turn over
4
Option 1: One way of buying the car is to pay cash. 2.1 2.1.1 What is cash price of the car? (2)
Option 2: Another option is to pay for the car by means of the terms offered in the advertisement. Answer the following questions that relate to the finance option described in the advertisement. 2.2.1 What deposit do you have to pay? (2)2.2.2 What is the total monthly payment that you would be making (installment plus the loan
service fee)? (3)2.2.3 What is the total value of all the monthly payments that you have to make for the car? (3)2.2.4 The “Final Balloon Value” is the amount that you will still owe on the car after making
all of your monthly payments. What is the “Final Balloon Value”? (1)
2.2
2.2.5 Calculate the total value of all the monthly payments and the “final Balloon Value” and try to explain why this is slightly different to the “Total Cost” shown in the advertisement. (4)
Option 3: A third option is to make a greater monthly payment every month and to pay the total debt over the repayment period. 2.3.1 Refer to the repayment factor table below and calculate the monthly repayment that you
will make for a loan with a Principal Debt, Interest Rate and the Number of Installments shown in the advertisement. (5)
2.3
2.3.2 What will the total cost be of paying for the car using this option – you must assume that the monthly loan service fee will be the same. (4)
Monthly repayment per R1 000 borrowed 1 year 2 years 3 years 4 years 5 years 6 years 7 years 8 years 9 years 10 years
8,0% 86,99 45,23 31,34 24,41 20,28 17,53 15,59 14,14 13,02 12,13 8,5% 87,22 45,46 31,57 24,65 20,52 17,78 15,84 14,39 13,28 12,40 9,0% 87,45 45,68 31,80 24,89 20,76 18,03 16,09 14,65 13,54 12,67 9,5% 87,68 45,91 32,03 25,12 21,00 18,27 16,34 14,91 13,81 12,94
10,0% 87,92 46,14 32,27 25,36 21,25 18,53 16,60 15,17 14,08 13,22 10,5% 88,15 46,38 32,50 25,60 21,49 18,78 16,86 15,44 14,35 13,49
2.4 Redraw the table below in your answer book and describe at least one advantage and one disadvantage of each of the three purchase options analysed in this question. (6)
[30]
Option Total paid for the car Advantage of option Disadvantage of option Option 1 Option 2 Option 3
QUESTION 3 Water is a scare resource and we need to work hard to preserve it. One way of reducing water consumption is to collect the rainwater that falls on the roof of a house.
To calculate the volume of water that can be captured during a rain storm we imagine the rectangular prism shown in the diagram on the left.
Area of ground covered by roof
Height of rain that falls

Maths Literacy Paper 2
Copyright reserved Please turn over
5
The volume of water collected is given by the formula: volume of water
collected = surface area of the ground covered by the roof ×
height of rain that falls
NOTE: Be careful to express all of the values in terms of the same units when using the formula.
Consider the following situation: A house with roof that covers 80m2 of ground A monthly rainfall of 58mm 3.1.1 Show that the height of rain that fell in the month is 0,058m (3)3.1.2 Hence show that the volume of water collected is 4,64m3 (3)
3.1
3.1.3 If there are 1 000 litres in one m3, show that 4 640 litres could have been collected in the month. (3)
Assume: That four people live in the house Average daily water consumption is 25 litres/person/day That there are 30 days in a month 3.2.1 Show that the average monthly water consumption for the household is 3 000 litres. (3)
3.2
3.2.2 Show that if the water can be stored then the household will end the month with a surplus of 1 640 litres (2)
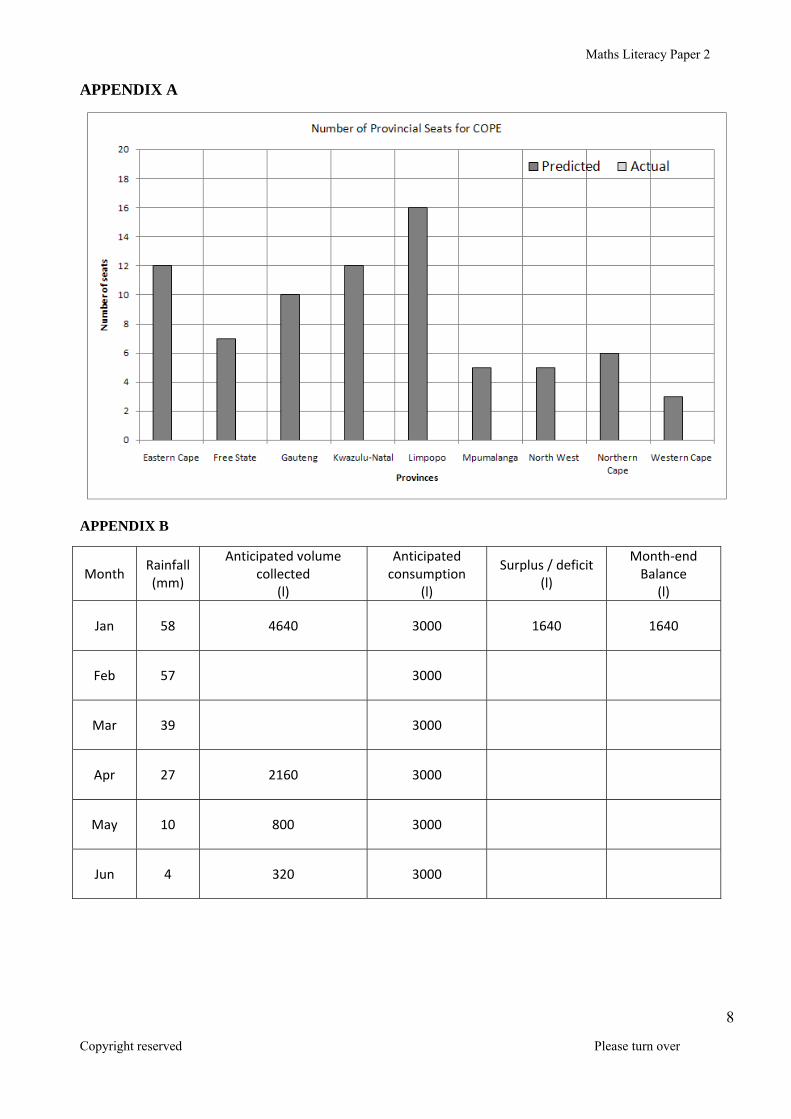
The average monthly rainfall for Musing (Limpopo) is reflected in the water collection balance sheet supplied as Appendix B. Complete the questions below on Appendix B and hand this sheet in with your answer book. 3.3.1 Show that the surplus water collected in February would be 1 560 litres (3)3.3.2 Show that the amount of water stored in the storage tank would be 3 200 litres at the end
of February. (2)
3.3
3.3.3 By completing the table, show that the household will run out of rainwater during June. (11)
3.4 The rainwater model that we have developed in this question assumes that the excess water each month is captured in a tank. The formula for the volume of a cylindrical tank is given by:
volume = π × r2 × h where π ≈ 3,141
In light of the water collection balance sheet developed in Appendix B the household has decided to build a cylindrical tank to hold at least 3 500 litres of water.
3.4.1 Show that 3 500 litres of water is equivalent to 3,5m3 of water. (2) 3.4.2 Hence, calculate the radius of the tank if the tank is to be built 1,8m tall. (5) [37]
QUESTION 4
Swine (H1N1) flu was first detected in April 2009. By the 31st July 2009 162 380 cases of swine flu had been reported worldwide and 1 154 people had died from the virus (www.who.int).
Questions being asked by many people include: How likely am I to catch the flu? How likely am I to die from the flu? The graphs below have been produced by the Center for Disease Control describing the situation in the United States. Study these and answer the questions that follow.

Maths Literacy Paper 2
Copyright reserved Please turn over
6
Determine the following information from the graphs. 4.1.1 How many confirmed cases of H1N1 flu were there by 24 July 2009? (2)
4.1
4.1.2 How many confirmed deaths from H1N1 flu were there by 24 July 2009? (2)
4.2 Use the information in the graphs to: 4.2.1 Show that there are approximately 107 million people in the age group 25 – 49 years.
Clearly show all working. (5)
4.2.2 Assume that the number of people in the age group 50 to 64 years is approximately 56 million. Calculate the approximate death rate per million people in each of the age groups: a. 25 to 49 years b. 50 to 64 years (4)
4.3 Based on your answers discuss, with explanation, which of the age groups in 4.2 appear to be at greater risk of dying from the H1N1 flu? (4)

Maths Literacy Paper 2
Copyright reserved Please turn over
7
CFL 15W
R16, 95 Lasts 6 000
hours
Incandescent 60W
R3, 99 Lasts 750 hours
4.4 Does the impression created by the “confirmed deaths” graph support your answer in 4.3? If yes, explain how. If no, explain why not. (4)
[21] QUESTION 5
Eskom has been battling an electricity shortage since early in 2008. Not only do we need to conserve electricity but by saving electricity we also reduce the demand on the earth’s fossil fuels (coal) and the production of carbon dioxide emissions which contribute to global warming.
For the consumer the question is how to conserve electricity and save money at the same time.
It is claimed that compact flourescent light (CFL) bulbs use one-quarter the amount of electricity and last eight times as long as a regular incandescent light bulb.
However, the CFL costs significantly more to buy!
To calculate the hourly running cost of each light bulb you need to know that: Eskom charges 65,35c/kWh (prices vary) 5.1.1 The CFL bulb uses 15W of electricity per hour that it burns. How many kilowatts does it
burn in one hour? (Recall 1kW = 1 000W) (2)
5.1
5.1.2 Hence calculate the hourly running cost of using a CFL in rand (correct to 4 decimal places). (3)
Use your answer to question 5.1 to complete the table below. You need only write down the values of a to d.
Total cost (fixed + running costs)
Fixed cost Running cost/hour 0 hours 50 hours 100 hours 150 hours
CFL R16,95 (a) (b) (c) (d)
5.2
Incandescent R3,99 R0,0392 R3,99 R5,95 R7,91 R9,87 (6)
5.3 Use the information from the table in 5.2 and graph paper to draw a graph comparing the running costs of the two bulbs for the time 0 to750 hours. (8)
Use your graph to answer the following questions 5.4.1 After approximately how many hours do the two options break-even? (4)
5.4
5.4.2 Approximately how much will you have saved after 600 hours by using the CFL bulb? (4) [27]
Maths Literacy Paper 2
Copyright reserved Please turn over
8
APPENDIX A
APPENDIX B
Month Rainfall (mm)
Anticipated volume collected
(l)
Anticipated consumption
(l)
Surplus / deficit (l)
Month‐end Balance
(l)
Jan 58 4640 3000 1640 1640
Feb 57 3000
Mar 39 3000
Apr 27 2160 3000
May 10 800 3000
Jun 4 320 3000