Embed Size (px)
Citation preview


Grade 10 - 2 - Exemplar Assessments 2008
Grade 10 Assessment Exemplars 1 Information Sheet 3
2 Examination/Test Instructions 4
3 Learning Outcomes 1 and 2
3.1 Assignment : Functions 5
3.2 Investigation: Number Patterns 7
3.3 Control Test: Products, Factors, Equations 8
3.4 Project: Finance 10
3.5 Exam A: Paper 1 13
3.6 Exam B: Paper 1 17
4 Learning Outcomes 3 and 4
4.1 Assignment: Shape, Space and Measurement 22
4.2 Investigation: Trigonometry 26
4.3 Control Test: Trigonometry, Measurement and Analytical Geometry 29
4.4 Project: Data Handling 33
4.5 Exam A: Paper 2 35
4.6 Exam B: Paper 2 41

Grade 10 - 3 - Exemplar Assessments 2008
Information Sheet: Mathematics
a
acbbx
2
42 −±−= ).1( niPA += niPA )1( +=
niPA )1( −= ).1( niPA −=
∑=
=n
i
n1
1 ( )∑
=
+=n
i
nni
1 2
1 ( )( ) ( )( )∑=
−+=−+n
i
dnan
dia1
122
1
( )
∑=
−
−−=
n
i
ni
r
raar
1
1
1
1 ; 1≠r ∑=
−
−=
n
i
i
r
aar
1
1
1 ; 11 <<− r
i
ixF
n ]1)1[( −+= i
ixP
n ])1(1[ −+−= h
xfhxfxf
h
)()(lim)('
0
−+=→
2
122
12 )()( yyxxd −+−=
++2
;2
2121 yyxxM cmxy +=
( )11 xxmyy −=− 12
12
xx
yym
−−
= θtan=m
( ) ( ) 222 rbyax =−+−
ABCIn ∆ ; C
c
B
b
A
a
sinsinsin== βαβαβα sin.coscos.sin)sin( +=+
βαβαβα sin.coscos.sin)sin( −=− Abccba cos.2222 −+= βαβαβα sin.sincos.cos)cos( −=+
CabABCarea sin.2
1=∆ βαβαβα sin.sincos.cos)cos( +=−
ααα 22 sincos2cos −= αα 2sin212cos −= 1cos22cos 2 −= αα
ααα cos.sin22sin =
n
xx ∑=
n
fxx ∑=
n
xxn
ii∑
=
−= 1
2)(var
n
xxSD
n
i∑
=
−= 1
2)(
)(
)()(
sn
AnAP = )()()()( BandAPBPAPBorAP −+=
Grade 10 - 4 - Exemplar Assessments 2008
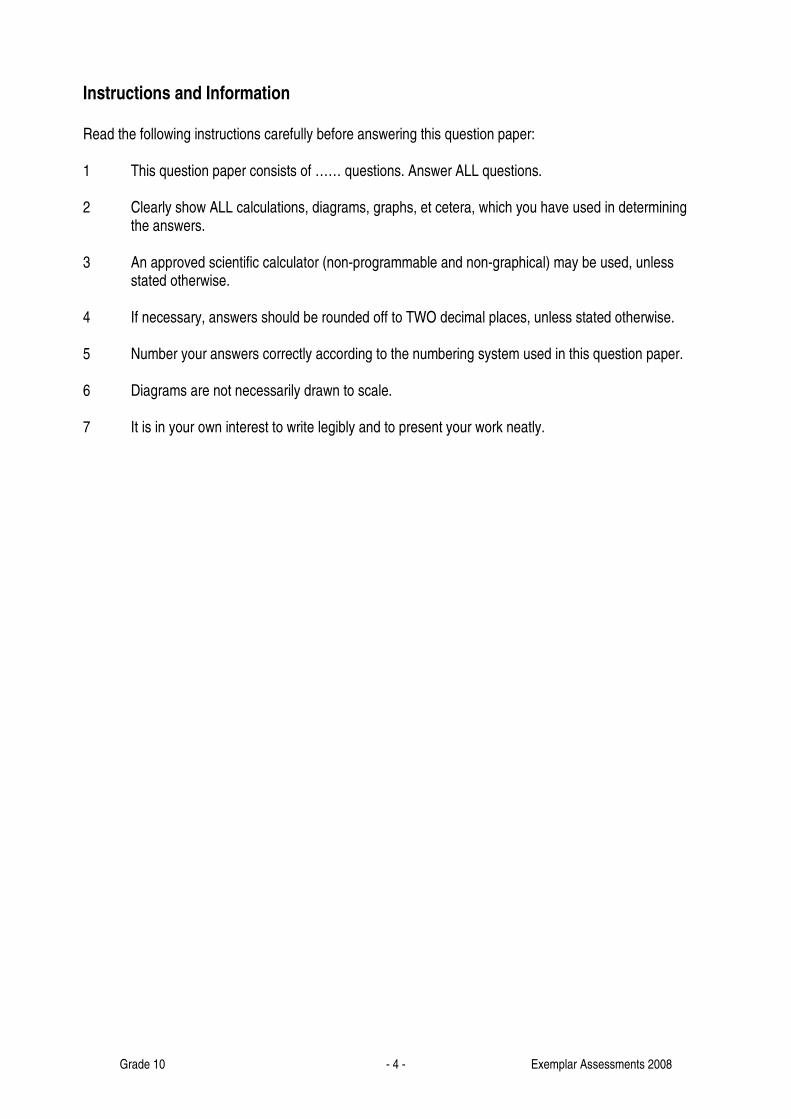
Instructions and Information Read the following instructions carefully before answering this question paper: 1 This question paper consists of …… questions. Answer ALL questions. 2 Clearly show ALL calculations, diagrams, graphs, et cetera, which you have used in determining the answers. 3 An approved scientific calculator (non-programmable and non-graphical) may be used, unless stated otherwise. 4 If necessary, answers should be rounded off to TWO decimal places, unless stated otherwise. 5 Number your answers correctly according to the numbering system used in this question paper. 6 Diagrams are not necessarily drawn to scale. 7 It is in your own interest to write legibly and to present your work neatly.

Grade 10 - 5 - Exemplar Assessments 2008
Grade 10 Assignment: Functions Marks: 30 1 Draw the graphs of each of the below by means of point-by-point plotting (or use technology). 2 Now indicate whether it is a straight line, parabola, hyperbola or any other function by filling the algebraic equations in the correct column in the table below:
Straight line
Parabola
Rational
Other
3 What do the equations representing straight line graphs have in common?
4 What do the equations representing parabolas have in common?
5 What do the equations representing hyperbolas have in common?
6 Write down three other expressions that make : straight lines, parabolas or hyperbolas .
7 Is the graph of 123 2 ++= xxy a line, a parabola or some other shape? Explain.
1.1 2xy = 1.7
=x
y1
2 1.13 3
xy =
1.2 xy 2= 1.8 21 +−=x
y 1.14 x
y2−=
1.3 xy += 2 1.9 43 −−= xy 1.15 ( )21+= xy
1.4 x
y1= 1.10 2
1
1 +−
−=x
y 1.16 822 −−= xxy
1.5 22 += xy 1.11 5−=y 1.17 32 +−= xy
1.6 22xy −= 1.12 23
1 −+
=x
y 1.18 2522 =+ yx

Grade 10 - 6 - Exemplar Assessments 2008
8 Is the graph of 123 3 ++= xxy a line, a parabola or some other shape? Explain
9 What do you notice about the graphs of the following equations:
x
y1= , 2
1 +=x
y , 2xy = , 22 += xy
Make a conjecture about the effect of the ‘+2’.
10 What do you notice about the graphs of the following equations:
x
y1= ,
xy
12= , 2xy = , 22xy =
Make a conjecture about the effect of the ‘ 2× ’
This assignment will be marked according to the following rubric;
6 – 8 4 – 5 2 – 3 0 - 1
Accuracy of graphs
(If technology is used learners must
provide printouts of all graphs)
Accurate and Correct Throughout
Almost all Correct Some correct Mostly incorrect
Completion of Table
All Entries Correct Most Entries Correct Incomplete with Errors
Observations Made
Clear and correct explanations given for
all conclusions
Clear explanations given but conclusions
incomplete
Did not clearly explain the reasoning
No Attempt /Have given a Vague Description of Incomplete Conclusions
Correctness of expressions for linear, parabolic
and rational functions
Accurate and Correct Almost all Correct No attempt / Many
errors
Punctuality
Deadline met Deadline not met
/Negotiated Deadline met
Presentation Acceptable / not
acceptable

Grade 10 - 7 - Exemplar Assessments 2008
Grade 10 Investigation: Number Patterns Marks: 100 Investigate one of the two options outlined below and then write up a full description of the work you did. You need to show a significant number of special cases, including some which might produce exceptions or results which are different from the rest. You should be able to make some conjectures from what you discover from the special cases you investigate. Write these conjectures as clearly as possible and then attempt to prove them. Marks will be awarded as follows: 40% for explaining clearly exactly what you did; 35% for your choice of examples and for the accuracy of your calculations; 20% for conjectures and their proof; 5% for presentation. OPTION 1: AN INTERESTING SEQUENCE
The first term of a sequence 21 =T and the second term 52 =T .
Calculate the next 6 terms using the following rule: 2
1 1
−
− +=
n
nn T
TT .
Explain what it means if a sequence ‘starts to recur’. Does the sequence start to recur? Investigate other sequences where you choose the first two terms and then use the same rule to calculate subsequent terms. For the first two terms, try whole numbers, integers, fractions, numbers which are equal … Make some conjectures and attempt to prove them. OPTION 2: REVERSE, SUBTRACT, REVERSE, ADD
Follow the rules used in this example for other three digit numbers:
• Take any three digit number: 378 (say) • Reverse it: 873 • Take the smaller number from the bigger number: 873 - 378 = 495 • Reverse the difference: 594 • Add this reversed difference to the original difference: 594 + 495 = 1 089
Investigate whether digits could be equal; how many different options there could be; whether 0 could be used as one or more of the digits… Any conjecture/s? Attempt to prove it/them.

Grade 10 - 8 - Exemplar Assessments 2008
Grade 10 Test: Products, Factors, Equations, Surds and Number Patterns Time: 1 hour Marks: 50 Question 1 Calculate the following products:
1.1 ( )22 53 yx − (4)
1.2 ( )( )ab +− 32 (4)
1.3 ( )( )422 2 ++− ppp (4)
1.4 ( )3232 − (2)
[14] Question 2 Factorise fully:
2.1 164 −x (4)
2.2 352 2 +− mm (4) [8] Question 3
3.1 The lengths of the perpendicular sides of a right angled triangle are ( )12 + units
and ( )12 − units. Calculate the length of the hypotenuse (in surd form).
(4) 3.2 One side of a rectangular field is ( )yx − metres long. Given that the area is
)( 22 yyxx −+− square metres, calculate the perimeter in terms of x and y.
(8) [12]

Grade 10 - 9 - Exemplar Assessments 2008
Question 4 Consider the following sequence of Es:
4.1 How many blocks will be needed to build the 10th E? (2) 4.2 How many blocks will be needed for the nth E? (2) 4.3 116 blocks are needed for the kth E. Calculate the value of k. (4) 4.4 Can the total number of blocks ever be a multiple of 10? Explain. (2) [10] Question 5
The three fractions 5
3,
3
2 and
2
5 have the property that the product of any two equals the reciprocal of
the third. 5.1 Find a different set of three fractions with the same property. (4) 5.2 What is the third of three fractions with the property described above if the first
two fractions are y
x and
q
p, where pyx ,, and q are positive integers?
(2) [6]

Grade 10 - 10 - Exemplar Assessments 2008
Grade 10 Project: Finance Marks: 75 Section A – Exchange Rates The table below shows the average Rand (R)/US dollar ($) exchange rate from 2000 to 2007. The figure given under the column “Exchange Rate” is how many Rands were required to get one US Dollar.
YEAR EXCHANGE RATE
2000 6.94
2001 8.58
2002 10.52
2003 7.57
2004 6.45
2005 6.37
2006 6.78
2007 7.06
1 In 2006, a book published in America cost $15.00. How much would you expect to pay for the book in South Africa? 2 You go to a bookshop and see the book on the shelf. It costs R136.00. Is this more or less than you expected? Suggest some reasons for the difference between the price you expected to pay and the marked price of the book. 3 In which year would you expect the book to cost the least? Substantiate your answer. 4 In 2007, A T-shirt made in South Africa costs R95.00. The shirt is exported to America. How much would it cost in $? 5 If you were running a clothing factory where the clothes were made from imported American cotton, in which year would the exchange rate have been best for you and in which year would it have been worst? Explain. 6 If you were running a business that exported South African chocolates to America, in which year would the exchange rate have been the best for you and in which year would have been the worst? Explain. 7 The banks only give a few exchange rates in the same format as the table above, i.e. how many Rand you need to buy one unit of foreign currency ($, €uros (€) and British Pounds (£)). All other exchange rates are quoted in the amount of foreign currency that can be purchased with R1.00. In 2007, the Rand/Australian dollar (A$) exchange rate was R1.00 to A$ 0.17. If you went to the bank with R100, how many Australian dollars would you be able to get? 8 How much would you need in R to get A$ 1? Is this a better or worse exchange rate than the Rand/Dollar exchange rate in 2007? Explain your answer.

Grade 10 - 11 - Exemplar Assessments 2008
9 Work out the exchange rate between Rands and US dollars in the same format as the exchange rate for Australian dollars, i.e. work out how many US dollars you can get for R1.00. 10 Using the 2007 exchange rates for Australian dollars and US dollars, work out how many Australian dollars you would need to get 1 US dollar. 11 In December 2007, the price of crude oil, which is used to make petrol, was $92.00 per barrel. How much did South Africa pay for a barrel of oil and how much did Australia pay for a barrel of oil? 12 In 2007, the exchange rate between the Rand and the British pound was R14.13 to 1£. The Rand/US dollar exchange rate was R7.06 to 1$. Estimate the exchange rate between the US dollar and the British pound. 13 You are visiting America and decide to buy a Big Mac burger for lunch. It costs $3.20. What is the Rand equivalent of the Big Mac Burger. (Use the 2007 exchange rate given in the table above.) 14 While you are eating your Big Mac, you compare what you have just paid in Rands for your burger with what you would have paid in South Africa (R15.50). Is the Big Mac more or less expensive in America? 15 Experiment with exchange rates, using any method you think suitable, to work out a Rand/Dollar exchange rate that would result in the price of a Big Mac in America being equivalent to the price that you pay for a Big Mac in South Africa. Does the official Rand/Dollar exchange rate undervalue or overvalue that Rand?
(Note: The last three questions that you have answered represent a simplified version of what is known as “Burgernomics” or the “Big Mac Index”. Burgernomics is used by economists all over the world to compare exchange rates and determine whether currencies are undervalued or overvalued. You can find out more about Burgernomics on the internet.)

Grade 10 - 12 - Exemplar Assessments 2008
Section B – Inflation and Interest 1 In 2000, a pair of track shoes costs R450. The inflation rate is 5,4%. What would you expect the shoes to cost in 2007? 2 The table below gives that actual annual inflation rates from 2000 to 2007. Use the table to work out the 2007 price of the track shoes. How does this compare with your answer in 1. Explain why your answers are different.
YEAR INLFATION
RATE (%)
2000 5,4
2001 5,7
2002 9,2
2003 5,8
2004 1,4
2005 3,4
2006 4,7
2007 7,7
3 You decide to buy a cellphone costing R890. You have saved R320 towards the cost of the cellphone and your parents have agreed to lend you the balance at 8,5% per year simple interest. You will pay your parents back in equal monthly payments for a period of 2 years. Work out your monthly repayments. 4 Instead of borrowing money, you decide that you are going to save for two years and then buy your new cellphone. 4.1 You invest the R320 that you have in a special savings account which pays 8% per annum interest, compounded monthly. Calculate the balance in this account after 2 years. 4.2 After six months, you deposit R170 into an ordinary savings account, at 7.5% interest per annum, compounded six monthly. Six months later, you deposit R160 and six months later you deposit R170 into the same account. Calculate the balance in this account at the end of two years 4.3 During the two-year period that you are saving, the rate of inflation is 6,7% per annum. What will the cost of the cellphone be at the end of the two years? 4.4 Using your results from questions 4.1 – 4.3, determine whether or not you will have enough money to pay cash for the cellphone.

Grade 10 - 13 - Exemplar Assessments 2008
Grade 10 Mathematics Exam Paper 1 Time: 2 hours Marks: 100 Question 1
1.1 Simplify:
1.1.1 ( )( )11 2 ++− xxx (3)
1.1.2 2
1
4
29−
y
x (Give your answer with positive exponents) (4)
1.2 Factorise:
1.2.1 24102 +− xx (2)
1.2.2 yxyx 2222 +−− (4)
[13] Question 2 2.1 Solve for x :
2.1.1 032 2 =−− xx (3)
2.1.2 555 =x (3) 2.1.3 8321 <−≤− x (Give your answer in interval notation.) (4) 2.2 Calculate the average speed for a return journey from Cape Town to Stellenbosch and back if the average speed of the outward journey was hkm /60 and the average
speed of the return journey was hkm /90 . (6)
[16] Question 3 Ms Shoko has 38 children in her class. The average mass of the boys is 35 kg , the average mass of the
girls is 32 kg and the total mass of all 38 children is 1 270 kg . How many boys and how many girls are in
her class? [8]
Grade 10 - 14 - Exemplar Assessments 2008
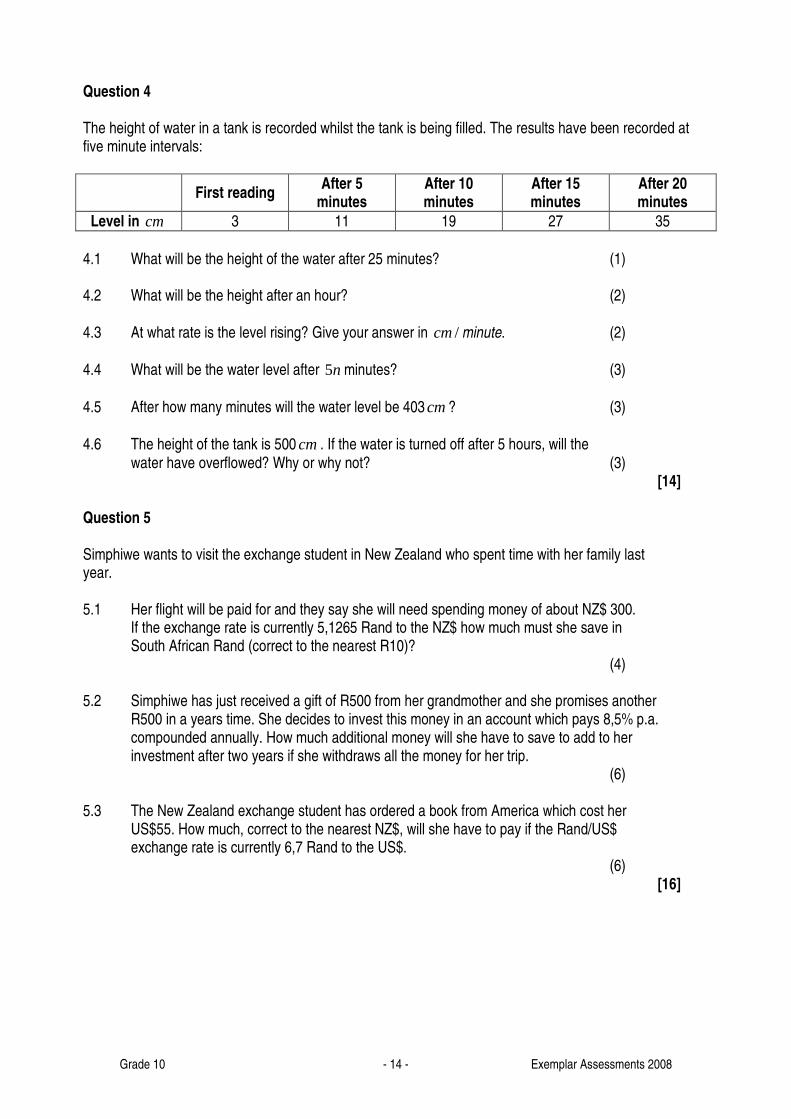
Question 4 The height of water in a tank is recorded whilst the tank is being filled. The results have been recorded at five minute intervals:
First reading After 5
minutes After 10 minutes
After 15 minutes
After 20 minutes
Level in cm 3 11 19 27 35
4.1 What will be the height of the water after 25 minutes? (1) 4.2 What will be the height after an hour? (2) 4.3 At what rate is the level rising? Give your answer in /cm minute. (2) 4.4 What will be the water level after n5 minutes? (3) 4.5 After how many minutes will the water level be 403 cm ? (3) 4.6 The height of the tank is 500 cm . If the water is turned off after 5 hours, will the water have overflowed? Why or why not? (3) [14] Question 5 Simphiwe wants to visit the exchange student in New Zealand who spent time with her family last year. 5.1 Her flight will be paid for and they say she will need spending money of about NZ$ 300. If the exchange rate is currently 5,1265 Rand to the NZ$ how much must she save in South African Rand (correct to the nearest R10)? (4) 5.2 Simphiwe has just received a gift of R500 from her grandmother and she promises another R500 in a years time. She decides to invest this money in an account which pays 8,5% p.a. compounded annually. How much additional money will she have to save to add to her investment after two years if she withdraws all the money for her trip. (6) 5.3 The New Zealand exchange student has ordered a book from America which cost her US$55. How much, correct to the nearest NZ$, will she have to pay if the Rand/US$ exchange rate is currently 6,7 Rand to the US$. (6)
[16]

Grade 10 - 15 - Exemplar Assessments 2008
Question 6
Given the two functions ( ) 92 +−= xxf and ( ) 3+−= xxg
6.1 Sketch the graphs of f and g on the same system of axes, showing the co-ordinates of all
intercepts with the axes. (6) 6.2 Calculate the co-ordinates of the points at which ( ) ( )xgxf = (4)
6.3 Read from your graph, the values of x for which ( ) 0>xf . (2)
6.4 Draw a dotted line on your sketch, showing graph of ( )xfy2
1= . The intercepts
on the axes must be shown. (3) [15]
Question 7
Sketched below are graphs of ( ) xbaxf .= and ( ) qx
pxg += for 0>x
O>x
y
C(1;6)
B(4;0)
A(0;2)
7.1 Given that ( )xf cuts the y -axis at )2;0(A and that )6;1(C lies on both graphs,
calculate the values of a and b (4)
7.2 It is further given that ( )xg cuts the x -axis at the point ( )0;4B . Calculate the
values of p and q . (4)
7.3 Write down the equation of the horizontal asymptote of ( )xg (2)
[10]

Grade 10 - 16 - Exemplar Assessments 2008
Question 8
Sketched are graphs of ( ) xaxfy tan== and ( ) cxbxgy +== sin
Write down the:
8.1 value of a ; (1)
8.2 period of f ; (1)
8.3 values of b and c (2) 8.4 range of g (1)
8.5 values of ]180;180[ 00−∈x for which ( ) ( )xgxf ≥ . (3)
[8]

Grade 10 - 17 - Exemplar Assessments 2008
Grade 10 Mathematics Exam Paper 1 Time: 2 hours Marks: 100 Question 1 1.1 Simplify:
1.1.1 )35)(12( 2 −+− aaa (3)
1.1.2 a
aa
6
3.2 11 −+
(3)
1.1.3 3
2
5
73 −−+ xx (4)
1.2 It is given that 5 × 3M × 3N = 5 000, where M and N are whole numbers. Determine the value of M × N . (3)
1.3 Solve for x in each of the following:
1.3.1 (x + 1)(x – 2) = 4 (4) 1.3.2 3x = 50 (3)
1.4 Solve the following inequality. Illustrate your answer on a number line if x is a real number. 2422 <−≤− x (4)
1.5 Learners are asked to factorise the following expression: 10 + 15k – 6mk – 4m Mbulelo’s answer is shown: 10 + 15k – 6mk – 4m = 5(2+ 3k) – 2m(3k + 2) ............. (step 1) = 5(2 + 3k) + 2m(2 + 3k).......... (step 2) = (5 + 2m)(2 + 3k) .......................(step 3) 1.5.1 Identify the step where he made a mistake. Explain. (2) 1.5.2 Factorise it correctly. (2) 1.6
Consider the number line above. Riaan says that there are more rational numbers between A and B than between B and C. Do you agree ? Explain. (2)
[30]
• • A B
• C

Grade 10 - 18 - Exemplar Assessments 2008
Question 2 Rebecca completed a hiking trail of 22 km in 5 hours. For the first part of the walk she walked at 4 km/h and for the rest of the hike she walked at 5 km/h. How long did she walk at 4 km/h and how long at 5 km/h? [5] Question 3 The science class did experiments on new types of candles which the manufacturers claim will burn very long. A particular candle was lit in a wind free environment and its length measured every hour. The data regarding the length of the candle was recorded in the following table:
3.1 What was the length of the candle after 8 hours? (2) 3.2 Use a variable to write an algebraic statement to generalize the relationship between the time in hours and the length of the candle. (3) 3.3 After how many hours would the candle have melted completely? (3)
[8] Question 4 Dots are arranged in the following patterns: Pattern 1 Pattern 2 Pattern 3 Pattern 4
� � � � � � � � � � � � � � � � � � � � � � � � � � � � � � � � � � � � 4.1 Determine the number of dots in the nT (the thn − Pattern). (3)
4.2 Hence calculate how many dots Pattern 50 will have. (2)
[5]
Time in hours 0 1 2 3 4 5
Length in cm 33 31 29 27 25 23

Grade 10 - 19 - Exemplar Assessments 2008
y
x 0
f
2
• P (3 ; 9)
Question 5 5.1 Below is a table with the buying and selling prices of different currencies: (13 /09/ 06)
5.1.1 You have R5000 to spend in Switzerland. How much Francs can you buy? (2)
5.1.2 What will it cost you in Rands to purchase 5000 Yen? (2)
5.1.3 If you exchange 1000 NZD how much Rands will you get? (2) 5.1.4 You want to import a personal computer from Japan at a total cost of 96180 Yen. The equivalent computer’s cost in South Africa is R8 500. Will you import or buy locally? Show all calculations to justify your answer. (3)
5.2 Determine through calculation which of the following investments will be more profitable:
5.2.1 R7 000 at 10% p.a compound interest for 5 years. (4) 5.2.2 R7 000 at 12% p.a simple interest for 5 years. (3)
[16] Question 6
In the sketch f is the graph of the function xay = + q
6.1 Calculate the value of a and q if the point P(3 ; 9) lies on the graph. (4) 6.2 Write down the equation of the asymptote of f. (2) 6.3 Write down the equation of )(xh if:
6.3.1 it is the reflection of f in the y-axis (2) 6.3.2 it is the reflection of f in the x-axis (2)
6.4 For which value of x will 16
11)( =xf ? (3)
[13]
Country Currency Symbol Exchange Rate (units per R1)
Switzerland Franc Swiss Franc 0.1697 New Zealand Dollar NZD 0.21
Japan Yen Y 16.03

Grade 10 - 20 - Exemplar Assessments 2008
4
2
-2
50 100 150 200 250 300 350
y
x
g
f
Question 7 7.1 Determine the equation of a linear function f (x) = mx + c, if 7)0( −=f
and 0)2( =f (2)
7.2 Draw a sketch graph of 24 +=x
y . Clearly indicate the asymptotes. (3)
7.3 A sketch graph of 9)( 2 +−= xxf is shown.
7.3.1 What is the length of line segment PR? (4)
7.3.2 For which values of x is 0)( >xf ? (2)
7.3.3 Compare the shapes of
9)( 2 +−== xxfy
and )(3 xfy ⋅= (2)
[13] Question 8 The following graphs have been drawn below: xxf tan)( = and xaxg sin)( = + q
8.1 Determine the value of a and q. (2) 8.2 Write down the values of x for which 1)()( =− xfxg . (2)
8.3 Write down the period of f. (1)
[5]
Y
X -3 R
P
O

Grade 10 - 21 - Exemplar Assessments 2008
Question 9 Two motorists M1 and M2 each traveled at a constant speed. The distances (in km) they covered after t hours are represented in the graphs below.
-0.5 0.5 1 1.5 2 2.5 3 3.5 4 4.5 5 5.5-50
50
100
150
200
250
300
350
400
450
500
550
600
650
700
9.1 Use the graphs to determine the speed of each motorist (2) 9.2 Write an algebraic formula that represents the relationship between time and distance for motorist M1. (2) 9.3 Which part of the algebraic formulae represents the speed of the motorist? (1) [5]
M 1 M 2
Time in hrs
Dis
tanc
e in
km

Grade 10 - 22 - Exemplar Assessments 2008
DC
BA
K
Q
S
R
P
Grade 10 Assignment: Shape, Space and Measurement Marks: 75
1 On a sheet of unlined paper, construct line AB = 9cm. Now construct line DC so that DC is parallel to AB and equal to AB. Join B to C and A to D. (2) 1.1 What type of quadrilateral is ABCD? (1) 1.2 Write down four conjectures about ABCD that involve either equal lines or equal angles. (4) 1.3 Confirm each conjecture by measuring the lines or angles and write down the measurements. (4) [11] 2 Using a compass, construct a circle with a radius of 5cm. Label the centre of the circle K. (1) 2.1 Draw any two diameters of the circle and label them PQ and RS as shown in the diagram. (2) 2.2 How long is PQ? Explain how you know this without measuring PQ. (2) 2.3 Which other lines equal PK? Give a reason for this. (2) 2.4 Join points P, R, Q and S. What type of triangle is ∆ PKR? Give a reason. (2) 2.5 What type of triangle is ∆ PKS? Give a reason. (2)
2.6 Prove that °= 90RPS . (4) 2.7 Are there any other angles that are °90 ? If so, name them. (2) 2.8 Do you think that you have proved that quadrilateral PRQS is a rectangle. Explain. (2) [19]

Grade 10 - 23 - Exemplar Assessments 2008
( 0 ; 0 )
3 On the grid provided, plot points F(1;1) and G(6;1). (1) 3.1 What is the length of FG? (1) 3.2 Plot point E so that FE is the same length as FG and the coordinates of E are integers, but FE is not parallel to the y-axis. What are the coordinates of E? Explain the method you used to plot E. (3) 3.3 Plot point H so that EFGH is a rhombus. What are the coordinates of H. (1) 3.4 Which property of a rhombus did you use to draw EFGH? (1) 3.5 Draw the diagonals FH and DE. Using coordinate geometry, prove that the diagonals bisect each other. (3) [10] 4 What is the definition of a regular polygon? Using your definition of a regular polygon, decide which of the following are regular polygons. In each case, you must state which requirements of your definition are true (if any) and which are not true (if any). Make use of diagrams to illustrate your answers. 4.1 Scalene triangle (2) 4.2 Rhombus (2) 4.3 Isosceles trapezium (2) 4.4 Isosceles triangle (2) 4.5 Square (2) 4.6 Kite (2) 4.7 Parallelogram (2) 4.8 Equilateral triangle (2) [16]

Grade 10 - 24 - Exemplar Assessments 2008
5 On the grid paper, plot the points A(-1;2) B(0;-5) and (4;7). Join the points. (4) 5.1 What type of triangle is ∆ ABC? (1) 5.2 Prove the conjecture you have made in 5.1. (5) Note: The coordinates of A, B and C are all integers and no integer is used more than once. Use this rule to answer the next question. 5.3 On the grid, plot points J, K, L and M so that JKLM is a kite. Give the coordinates of the four points you have plotted. (4) 5.4 Prove that JKLM is a kite. (5) [19]

Grade 10 - 25 - Exemplar Assessments 2008
( 0 ; 0 )
( 0 ; 0 )
Diagram Sheet Question 3 Question 5

Grade 10 - 26 - Exemplar Assessments 2008
αααα
E
D CB
A
φφφφ
side adjacent to φφφφ
side oppositeφφφφ
hypotenuse
side adjacent to θ θ θ θ
side opposite θθθθ
θθθθRQ
P
Grade 10 Investigation: Trigonometry Marks: 85 You are reminded of the definitions of sine, cosine and tangent, abbreviated as sin, cos and tan: In the right angled triangle below:
PR
PQ
hypotenuse
oppositeside == θθsin , PR
QR
hypotenuse
oppositeside == φφsin
PR
QR
hypotenuse
toadjacentside == θθcos , PR
PQ
hypotenuse
toadjacentside == φφcos
QR
PQ
toadjacentside
oppositeside ==θ
θθtan , PQ
QR
toadjacentside
oppositeside ==φ
φφtan
Task 1 1.1 Name all the similar triangles in the sketch above. (3)
1.2 Given that BD = 8 units, DC = 4 units and 24=AD units, calculate the lengths of all the other line segments in the sketch. Leave your answers in surd form (5) 1.3 Express αsin , αcos and αtan in as many different ways as possible.
For example ...sin ===AC
AD
BC
BAα (15)
1.4 Given that β=CBA ˆ , express ββ cos,sin and βtan in as many different
ways as possible. (15) [38]

Grade 10 - 27 - Exemplar Assessments 2008
Task 2 The three circles have radii 2, 3 and 5 units.
4
2
-2
-4
-5 5
D
C3
C 2
C1
B 3
B2
B 1
A 3
A 2
A1
2.1 Read, as accurately as possible, the co-ordinates of the points marked:
3321 ,...,, CAAA and hence complete the following table (work correct to 1 decimal place).:
x co-
ordinate y co-
ordinate r
x
r
y
x
y
1A
2A
3A
1B
2B
3B
1C
2C
3C
(10) 2.2 Write any observations about what you have read and calculated using the
co-ordinates of the nine points. (9) [19]

Grade 10 - 28 - Exemplar Assessments 2008
Task 3
3.1 Measure DOA ˆ , DOB ˆ and DOC ˆ and use your calculator to determine the sine, cosine and tangent of each of these three angles. (6) 3.2 How, if at all, are the ratios determined in the previous question related to the values in the table completed in task 2? (2) 3.3 Use your calculator to investigate
3.3.1. the maximum and minimum values (if they exist) of θsin , θcos
and θtan for any values of θ (try multiples of 010 ) (10)
3.3.2 the value/s of θθ 22 cossin + for at least 5 of values of θ (use 00=θ , some positive values and some negative values). (2)
3.3.3 the values of θθ cos,sin , θθ
cos
sin and θtan for at least 5
values of θ (4) 3.4 Write any observations about the results you obtained through your calculator
work. (4) [28]

Grade 10 - 29 - Exemplar Assessments 2008
Grade 10 Test: Trigonometry, Measurement and Coordinate Geometry Time: 1 hour Marks: 50 Question 1 In each of the following right-angles triangles, write down the value of the required trigonometric ratio (leave your answers as ratios) and calculate the size of the angle marked θ :
1.1 Find the value of θsin and the size of angle θ (2)
1.2 Find the value of θcos and the size of angle θ (2)
1.3 Find the value of θtan and the size of angle θ (2) [6] Question 2 A radio mast (PR), 24m high, is stabilised with steel cables (PQ) that stretch from the top of the mast to the ground. The angle between the mast and the cable is
°40 . Calculate the length of the steel cables (PQ), correct to two decimal places. [4]
θ 15
7
8
29
2 5
θ
5
3
4
θ
R
P
Q

Grade 10 - 30 - Exemplar Assessments 2008
O C(5;0)A(-5;0)
B(3;4)
M
Question 3 The architect’s diagram is a cross section of a house. An official in the planning office has asked you to check whether or not the roof slopes at an angle of at least 4 degrees, as required by law. Using the scale bar, work out the length in mm of the line XY. 3.1 Using the scale bar, work out the length in mm of the line XY. (2) 3.2 Calculate the length of XZ. (1)
3.3 Calculate the slope of the roof ( ZYX ) (2) [5] Question 4 In the figure, the points A(-5;0), B(3;4) and C(5;0) are given. 4.1 Calculate the coordinates of M, the midpoint of AB (2) 4.2 Join MO and find the equation of line MO. (3) 4.3 Find the equation of line BC. (4) 4.4 What are you able to prove about lines MO and BC? Explain. (2) [11]
+000 FFL
Kitchen Living Room
+4290 Top of parapet wall
Height of roof +2900
Raft foundation (to engineer’s specification)
250 mm timer pole bearer
Scale Bar (mm)
Height of roof +2400 Y
Z

Grade 10 - 31 - Exemplar Assessments 2008
Question 5 The the figure, A is the point (3;6) and B is the point (12;21). James has to find the coordinates of point C, which is 3
1 of the distance from A to B.
James used the following method:
( )9;5
327
;3
15
3216
;3123
=
=
++=C
Show, by calculation, that the distance from A to C is not 3
1 of the distance of from A to B and James’ method
does not work. [5] Question 6 A product designer is designing a set of three open baskets according to the following specifications: • The capacity of the baskets: large basket = 1,5l medium basket = 1,25l small basket = 1,0l
6.1 Has the same scale factor been applied when reducing the basket capacity from large to medium and from medium to small? Substantiate your answer with calculations. (3)
6.2 Convert the capacity of each basket to 3cm ( 311 cmml = ). (3) 6.3 The designer decides that the large basket should be 15cm long and 12cm wide. Show that the height of the basket will be 8.3cm. (3) 6.4 The baskets fit inside each other with a 0,5cm gap all around. What is the length and breadth of the medium basket? (2) 6.5 The small basket will be covered with decorative paper. Calculate the area of paper required to cover the bottom and sides of the small basket. (The dimensions of the small basket are length = 13cm, breadth = 10cm and height = 7,7cm.) (3) [14]
A(3;6)
C(5;9)
B(12;21)

Grade 10 - 32 - Exemplar Assessments 2008
Question 7 In the figure, the cube and the cylinder have equal volume. If two sides of the cube are doubled, and the diameter of the cylinder is doubled, will the volumes of the resulting prisms still be equal? Show all calculations. [5]
y
y
x
x
x

Grade 10 - 33 - Exemplar Assessments 2008
Grade 10 Project: Introduction to Data Handling Marks: 55 In this assignment we wish to investigate how people get to school in the morning. What is the most popular mode of transport and is there a correlation between their distance from school and the duration of their journey. In order to do this, you need to collect information from the learners at your school. Before collecting data, it is important to be sure that you know what questions you want to be able to answer so that you collect all the data you need. You also need to consider your sample size quite carefully. It needs to be big enough to represent the population adequately but small enough to make it measurable. The greater the amount of data you collect, the more accurate your deductions will be. Part 1 For each individual, you will need to record the following;
• What mode of transport they use to get to school (this could be walk, cycle, bus, car, train, other). If they use a combination of transport, for example they walk to the bus stop, catch the bus and then walk to school, record the mode that represents the majority of their journey in terms of time
• How far away from school they live • How long a typical journey to school takes
(5) Part 2
• Determine the modal form of transport for your dataset and both the median and mean for the distance travelled and time taken. (6) • Explain why finding the mean and median form of transport is not sensible. (2) • Explain why it might be best to group the time taken and distance travelled into intervals before finding the mode of these two sets of data. (2) • Decide on reasonable intervals for your data for the time taken to get to school. Group your data and represent it graphically using a histogram. (12) • From your histogram, determine what the modal interval is for time taken to get to school. (2) • Attempt to give reasons for certain transport methods being favoured over others in relation to the area in which your school lies and how it might differ from other schools in different areas. (4)

Grade 10 - 34 - Exemplar Assessments 2008
Part 3 A scatter plot is good for determining if there is any correlation between two different sets of data. There a three different types of correlation that may occur; positive correlation, where one set of data increases as the other set increases; negative correlation, where one set of data decreases as the other increases, or no correlation, where the datasets seem unrelated. You need to draw a scatter plot to investigate the correlation between the distance from school and the time it takes to travel that distance. In order to do this, you need to label the x-axis according to one dataset and the y-axis according to the second dataset. You then plot a point for each individual in your sample. The more points that are plotted on the graph, the clearer the relationship becomes. (10) Using your graph, determine if there is a correlation between the distance people travel to school and the time it takes them to get there. Motivate your answer making reference to your scatter diagram and attempt to find reasons for the correlation, or the lack thereof. (4) Part 4 Represent the data you have on the mode of transport used when travelling to school in a pie chart. Be sure to write a key and indicate the percentages of the sample group on your diagram. (4) Part 5: Using all the information you have collected and represented in different ways, write a paragraph describing the transport habits of learners at your school. (4)

Grade 10 - 35 - Exemplar Assessments 2008
5cm
8cm
h
Grade 10 Mathematics Exam Paper 2 Time: 2 hours Marks: 100 Question 1
S(x ; 3 )
R( -1 ; 1 )
Q( 4 ; 6 )
P( -5 ; 9 )
1.1 Find the gradient of line PQ (3) 1.2 If it is given that PSPQ ⊥ , find the value of x in the point S (5)
1.3 1.3.1 Assuming that 7−=x , find the gradient of line SR (2) 1.3.2 What does this tell us about SR? Explain. (2) 1.4 Join PR 1.4.1 What type of triangle is PRS∆ ? Show all working. (5) 1.4.2 Find the area of PRS∆ (3) [20] Question 2 Dylan made a right square pyramid out of plaster for an art project as shown alongside. Each side of his pyramid's base measures 8 cm. The height of the slant triangle of this pyramid measures 5 cm.

Grade 10 - 36 - Exemplar Assessments 2008
2.1 What is the area, in square cm’s, of the base of Dylan’s pyramid? (2) 2.2 What is the total surface area, in square cm’s, of Dylan’s pyramid? Show your working. (5) 2.3 What is h, the height, in cm’s, of Dylan’s pyramid? Show or explain how you got your answer. (4) 2.4 Using the height you determined in part 2.3, what is the volume, in cubic cm’s, of Dylan’s pyramid? Show your working. (3) [14] Question 3 The sketch below shows 11 identical irregular hexagons.
8
6
4
2
-2
-4
-6
-5 5
LK
J
H G
F
E
D
C
B A
3.1 If hexagon A is reflected about the x-axis, then A will be mapped onto …….. (1) 3.2 If hexagon E is reflected about the line 0=x , then E is mapped onto ……… (1) 3.3 If hexagon B is reflected about the line xy = , then B is mapped onto …… (2)

Grade 10 - 37 - Exemplar Assessments 2008
θθθθC
B
A
30°°°°
20°°°°E
DC
B
A
3.4 If hexagon K is first reflected about the x-axis and then translated by the rule )2;2();( +−→ yxyx , then K is mapped onto …… (2)
3.5 Describe, in words, how hexagon H would be mapped onto E (4) 3.6 Write the rule that transforms hexagon D onto F (2) 3.7 Describe the transformation/s that map hexagon A onto C (4) [16] Question 4
4.1 In the given sketch, BC = 5 units, AB = 13 units and o90ˆ =BCA . Without using a
calculator, determine the value of: 4.1.1 θsin (1) 4.1.2 θtan2 (3)
4.1.2 θ2cos (2)
4.2 In the sketch below, BCD∆ is right angled at C, BD = 3 units, 030ˆ =CDB
and 020ˆ =EBA . Also, BCDE is a rectangle. calculate the lengths of 4.2.1 BC (4) 4.2.2 CD (3) 4.2.3 AD (5) [18]

Grade 10 - 38 - Exemplar Assessments 2008
Question 5 A shark spotter is standing at lookout point 25m above the waters edge. He spots a shark in the
water at an angle of depression of o50 . If the swimmer that is also in the water is 5m from the foot of the lookout spot, how far is the shark from the swimmer?
[6] Question 6
The table below shows the attendance at each of Strandfontein High School's home soccer games last season.
6.1 What is the range of the attendance for the 8 home soccer games last season? Show or explain how you got your answer. (2) 6.2 Determine, showing all working, each of the following measures of the attendance for the 8 games. 6.2.1 mean (3) 6.2.2 median (2) 6.2.3 mode (1)
6.3 If the attendance at the 6th game is not included in the data set, which measure (mean, median, or mode) has the greatest increase in value when compared to your answers in 6.2? Explain how you got your answer. (3) [11]
Attendance at Home Soccer matches
Game Attendance
1st 287
2nd 268
3rd 283
4th 283
5th 270
6th 70
7th 283
8th 275
25m
5m
50

Grade 10 - 39 - Exemplar Assessments 2008
Question 7 The amount of time, in minutes, that a group of Grade 10 learners spent on their cellular phone in a week was measured and recorded below;
82 102 108 142 150 170
145 115 154 121 128 126
147 92 137 158 81 146
177 152 152 130 88 132 7.1 Complete the frequency table on your diagram sheet (5) 7.2 Draw a histogram on your diagram sheet that represents the data you have completed in your frequency table. (5) 7.3 What is the modal class? (1) 7.4 What percentage of learners used their cellular phones for 2 hours or more in the week? (2) 7.5 What comment can you make regarding the use of cellular phones amongst this group of learners? (2) [15]

Grade 10 - 40 - Exemplar Assessments 2008
Diagram Sheet Question 1 Question 7
S(x ; 3 )
R( -1 ; 1 )
Q( 4 ; 6 )
P( -5 ; 9 )
Time in minutes Frequency
80 - 99
100 - 119
120 - 139
140 - 159
160 - 179

Grade 10 - 41 - Exemplar Assessments 2008
Grade 10 Mathematics Exam Paper 2 Time: 2 hours Marks: 100
Question 1
y
x
D ( -2 ; k )
C ( 4 ; 6 )
B ( -8 ; 2 )
A ( -3 ; 7 )
1.1 Calculate the gradient of BC (3) 1.2 D(-2; k) lies on BC. DA ⊥ AC. Find the value of k. (4) 1.3 Find the length of BC. (3) 1.4 Assuming the value of k is 4, calculate the area of ∆ ABC. (5) 1.5 In order to move from point A to point C, the following transformation is applied:
Move down one unit; move right seven units.
If E is the point that results from applying the same transformation to point B, what are the co-ordinates of E? (2) 1.6 What can you conclude about AC and BE? Justify your answer. (2) 1.7 Is the transformation that has been applied to move from A to B the same as the transformation applied to move from C to E? Describe the transformation/s. (2) 1.8 What can you conclude about quadrilateral ACEB? Give a reason for your answer. (2) [23]

Grade 10 - 42 - Exemplar Assessments 2008
10
8
6
4
2
-2
-4
5 10
y
x
F
A
h
RQ
P
12 12
12
Question 2 2.1 ∆ PQR is an equilateral triangle, with the measurement of each side equal to 12cm. 2.1.1 Use any appropriate method to show that the perpendicular height of the triangle is 10,39cm. (3) 2.1.2 Hence, calculate the area of the triangle. (2) 2.2 A triangular pyramid is constructed using four triangles that are the same as the triangle in 2.1 (i.e. an equilateral triangle with sides measuring 12cm). 2.2.1 Calculate the perimeter of the base of the pyramid. (1) 2.2.2 Explain how you know that the height of the slanted triangles is 10,39cm. (1) 2.2.3 Calculate the total surface area of the pyramid. (3)
[10]
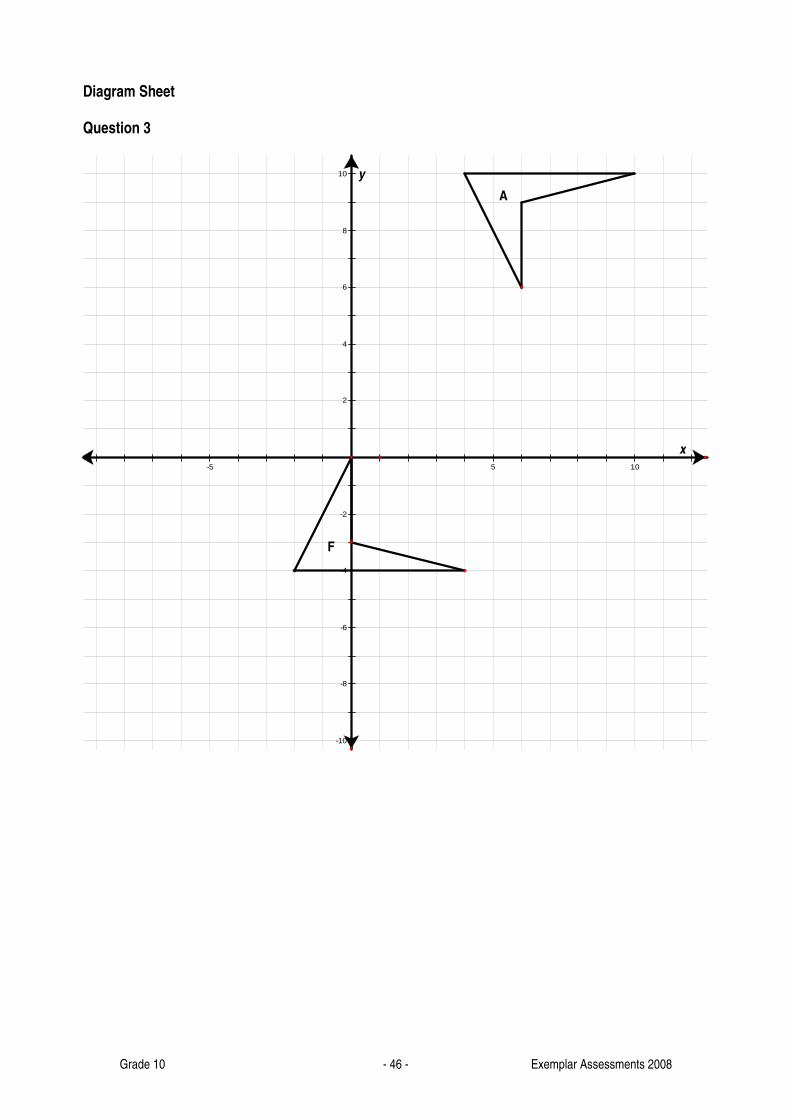
Question 3 On the diagram sheet provided, A is a quadrilateral. Draw the image of A if: 3.1 A is reflected in the x-axis (Label the image B.) (2) 3.2 A is reflected in the line xy = .
(Label the image C.) (2) 3.3 A is translated by the rule )6;2();( −+→ yxyx
(Label the image D.) (2) 3.4 A is first reflected in the line 0=x and is then moved down 10 units. (Label the image E). (4) 3.5 Explain the transformation/s that have been applied to A to map A onto F. (4) [14]
Grade 10 - 43 - Exemplar Assessments 2008
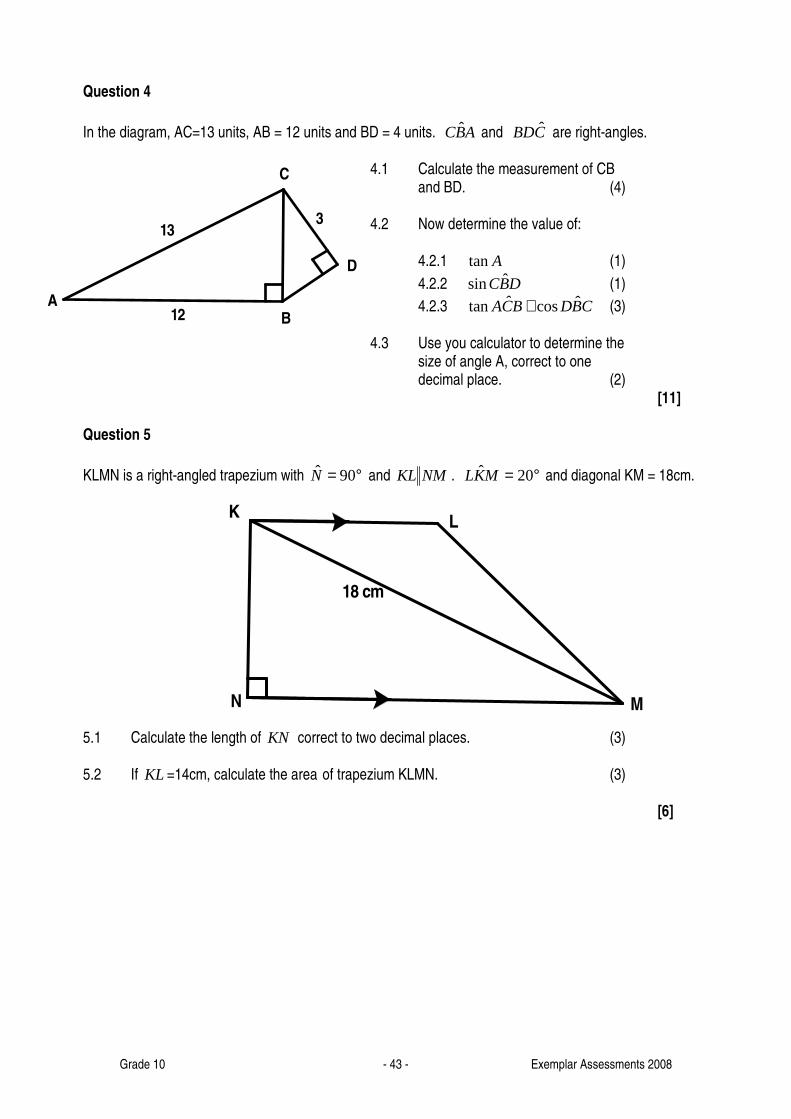
313
12
D
C
BA
18 cm
N M
LK
Question 4
In the diagram, AC=13 units, AB = 12 units and BD = 4 units. ABC ˆ and CBD ˆ are right-angles. 4.1 Calculate the measurement of CB and BD. (4) 4.2 Now determine the value of: 4.2.1 Atan (1)
4.2.2 DBC ˆsin (1)
4.2.3 CBDBCA ˆcosˆtan + (3) 4.3 Use you calculator to determine the size of angle A, correct to one decimal place. (2) [11] Question 5
KLMN is a right-angled trapezium with °= 90N and NMKL . °= 20ˆMKL and diagonal KM = 18cm.
5.1 Calculate the length of KN correct to two decimal places. (3) 5.2 If KL =14cm, calculate the area of trapezium KLMN. (3) [6]

Grade 10 - 44 - Exemplar Assessments 2008
D1
D2
3 m
yx
Question 6 A laser speed trapping device is mounted on a pole that is 3m high. The device measures the initial angle of depression of a car (x) and then measures the angle of depression again 1 second later (y).
These measurements are used to work out how much distance the car has covered in 1 second and then to determine whether or not the driver is breaking the speed limit.
6.1 Show that the initial distance from the camera is given by: x
Dtan
31 = and the distance
from the camera, one second later, is given by y
Dtan
32 = (3)
6.2 If °= 5,3x and °= 6y , calculate the distance (in metres) covered by the car
in 1 second. (3) 6.3 If the speed limit is 60 km/hour, determine whether or not the motorist is exceeding the speed limit. Show all calculations. (If you were unable to do 6.1, assume that the car covered 20,51 m in 1 second.) (2) [8] Question 7 A cricket coach has to replace one of his batsmen because of injury. He looks at the scores that the two top players in the B-Team have obtained during the season.
7.1 Determine the mean number of runs obtained by each player. (4) 7.2 Determine the modal number of runs obtained by each player. (2) 7.3 Based on the results of your calculations above, which player would you advise the coach to choose? Give a reason for your answer. (2)
[8]
AB Ashwell 15 5 25 60 30 70 40 5 30 5 10 10 30 60

Grade 10 - 45 - Exemplar Assessments 2008
Question 8 A market survey company recorded how long shoppers spent in a mall on Saturdays. Their results are recorded below:
Time in Minutes No of males No of females Total
0 - 29 23 25 48
30 - 59 46 27 73
60 - 89 20 41 61
90 - 119 15 59 74
120 - 149 14 52 66
150 - 179 8 23 31
180 + 2 16 18 8.1 How many men and how many women were included in the survey? (2) 8.2 Given that the data has already been grouped, explain how you would calculate the approximate mean number of minutes that men spend in a mall. (3) 8.3 What is the modal class for women? (1) 8.4 What percentage of women fall within this modal class? (2) 8.5 Which class will contain the median number of minutes that women spend at the mall? (2) 8.6 Based on the data, do you think that researchers can claim that, “Significantly more women than men spend between 60 and 90 minutes in the mall”? Justify your answer through calculation. (3) 8.7 Use the grid provided below to draw a histogram that depicts the total number of people visiting the mall. (5) 8.8 Using your histogram, comment on any interesting or significant aspects of the data with regard to how long people spend at the mall. (2) [20]
Grade 10 - 46 - Exemplar Assessments 2008
Diagram Sheet Question 3
10
8
6
4
2
-2
-4
-6
-8
-10
-5 5 10
y
x
F
A

Grade 10 - 47 - Exemplar Assessments 2008
Question 8


![Grade 10 Assessment Booklet - Maths Excellencemathsexcellence.co.za/papers/resources/Grade 10... · Grade 10 Investigation: ... (2) [10] Question 5 The three fractions 5 3, 3 2 and](https://img.pdfslide.us/doc/110x75/5ac676ca7f8b9a57528e3da9/grade-10-assessment-booklet-maths-excel-10grade-10-investigation-2-10.jpg)