Embed Size (px)
Citation preview
Council of Obstetric & Paediatric Mortality & Morbidity
Tasmania
Annual Report for 2004
Annual Perinatal Report 2004 2
Table of Contents
TABLE OF CONTENTS...............................................................................................2
INDEX OF TABLES.....................................................................................................4
INDEX OF FIGURES ...................................................................................................6
INDEX OF FIGURES ...................................................................................................6
INTRODUCTION .........................................................................................................7
ACKNOWLEDGMENTS .............................................................................................8
PERINATAL REGISTRY ACT 1994...............................................................................9
DEFINITIONS PRESCRIBED UNDER THE PERINATAL REGISTRY ACT...........................10
MEMBERS OF THE COUNCIL OF OBSTETRIC & PAEDIATRIC MORTALITY & MORBIDITY...........................................................................................................11
MEMBERS OF SUB-COMMITTEES & SUPPORT SERVICES ...........................................12
COUNCIL SUMMARY ..............................................................................................13
PERINATAL STATISTICS AT A GLANCE ......................................................................13 RECOMMENDATIONS.................................................................................................14
COMMITTEE REPORTS ...........................................................................................16
MATERNAL MORTALITY & MORBIDITY SUB-COMMITTEE........................................16 Maternal Deaths for 2004....................................................................................16 Perinatal Deaths for 2004 ...................................................................................17
PAEDIATRIC MORTALITY & MORBIDITY SUB-COMMITTEE.......................................21 PAEDIATRIC DEATHS FOR 2004.................................................................................21 DATA MANAGEMENT SUB-COMMITTEE....................................................................24
PERINATAL STATISTICS ........................................................................................25
BIRTHS AND BIRTH RATES........................................................................................25 SEX OF INFANTS........................................................................................................28 BIRTHWEIGHT ...........................................................................................................29
Low Birthweight...................................................................................................29 APGAR SCORES .........................................................................................................30 RESUSCITATION ........................................................................................................32 PRESENTATION AT DELIVERY ...................................................................................33 PERINATAL MORTALITY ...........................................................................................34
Neonatal Mortality...............................................................................................36 FOETAL .....................................................................................................................37 NEONATAL................................................................................................................37 PERINATAL ...............................................................................................................37
Autopsy Rates.......................................................................................................38 MOTHERS..................................................................................................................39
Age of Mothers.....................................................................................................39
Annual Perinatal Report 2004 3
Parity....................................................................................................................42 Indigenous Status .................................................................................................42 Breastfeeding .......................................................................................................43
MODE OF DELIVERY .................................................................................................44 CAESAREAN SECTION ...............................................................................................46 INDUCTION AND AUGMENTATION .............................................................................48
Induction ..............................................................................................................48 Augmentation .......................................................................................................49
MULTIPLE PREGNANCY.............................................................................................50 MATERNAL HYPERTENSION......................................................................................51 HAEMORRHAGE ........................................................................................................52
Postpartum Haemorrhage ...................................................................................52 Antepartum Haemorrhage ...................................................................................53
ATTACHMENT A: GUIDELINES FOR INVESTIGATION OF “UNEXPLAINED” STILLBIRTHS........................................................................54
FEEDBACK FORM ....................................................................................................56

Annual Perinatal Report 2004 4
Index of Tables Table 1: Perinatal Deaths for 2004 ..............................................................................17 Table 2: Paediatric Deaths for 2004.............................................................................21 Table 3: Births and Birth Rates for Tasmania 1992-2004 ...........................................25 Table 4: Births by Region 1997-2004..........................................................................26 Table 5: Births by Hospital 1997-2004........................................................................26 Table 6: Proportion of Public and Private Patients 1992-2004....................................26 Table 7: Sex of all Infants Born in Tasmania 1997-2004............................................28 Table 8: Incidence of Low and Very Low Birthweight 1992-2004.............................29 Table 9: Outcome by Gestation 1996-2004 .................................................................30 Table 10: Apgar Score for all Births at Five Minutes 1997-2004 ...............................30 Table 11: Intubation Rate 1992-2004 ..........................................................................32 Table 12: Resuscitation Rate 1997-2004 .....................................................................32 Table 13: Presentation at Deliver for all Births 1997-2004.........................................33 Table 14: Perinatal Outcome 1997-2004 .....................................................................34 Table 15: Perinatal Mortality Rates 1992-2004...........................................................34 Table 16: Causes of Perinatal Mortality 1996-2004 ....................................................35 Table 17: Neonatal Mortality 1992-2004 ....................................................................36 Table 18: Neonatal Mortality, per 1000 Births, in Infants over 28 weeks Gestation 1992-2004 ....................................................................................................................36 Table 19: Neonatal Mortality, per 1 000 Births, in Infants over 1 000 Grams Birthweight 1992-2004 ................................................................................................37 Table 20: Foetal, Neonatal and Perinatal Death Rate per 1 000 Births by State and Territory 1998-2003.....................................................................................................37 Table 21: Rate of Autopsies on Perinatal Deaths 1992-2004 ......................................38 Table 22: Age of Mothers 1992-2004..........................................................................39 Table 23: Rates of Birth per 1 000 Female Population by Maternal Age 1998-2004 .41 Table 24: Percentage of Births by Parity 1992-2004...................................................42 Table 25: Mother's Indigenous Status 1997-2004 .......................................................42 Table 26: All Births by Breastfeeding at Discharge 1997-2004..................................43 Table 27: Breastfeeding at Discharge by Public/Private Hospital 2000-2004 ............43 Table 28: Breastfeeding at Discharge by Parity 2000-2004 ........................................43 Table 29: Mode of Delivery 1992-2004 ......................................................................44 Table 30: Mode of Delivery for Vaginal Births 2000-2004 ........................................44 Table 31: Mode of Delivery by Gestation 1997-2004 .................................................45 Table 32: Emergency / Elective Caesarean Section Proportion 1997-2004 ................46 Table 33: Emergency/Elective Caesarean Section Proportion by Public/Private Hospitals 2000-2004 ....................................................................................................46 Table 34: Primary/Repeat Caesarean Section Proportion 1998-2004 .........................46 Table 35: Primary/Repeat Caesarean Section Proportion by Public/Private Hospitals 2000-2004 ....................................................................................................................46 Table 36: All births by Caesarean Section following Augmentation of Labour 1998 – 2004..............................................................................................................................47 Table 37: Induction Rate 1996 – 2004.........................................................................48 Table 38: Induction Rate by Public/Private Hospitals 2000 – 2004............................48 Table 39: Percentage of Caesarean Sections following Induction of Labour 1996 - 2004..............................................................................................................................48 Table 40: Augmentation of Labour 1997 – 2004.........................................................49 Table 41: All Births by Multiple Pregnancies 1997 - 2004 .........................................50

Annual Perinatal Report 2004 5
Table 42: Perinatal Mortality in Multiple Pregnancies 1997 – 2004...........................50 Table 43: Prevalence (Number) of cases of Maternal Hypertension for all Births 1996 – 2004...........................................................................................................................51 Table 44: Prevalence (Percentage) of cases of Maternal Hypertension for all births 1996 – 2004..................................................................................................................51 Table 45: Incidence of Postpartum Haemorrhage 1992 - 2004 ...................................52 Table 46: Incidence of Antepartum Haemorrhage 1992 - 2004 ..................................53 Table 47: Type of Antepartum Haemorrhage 1997 – 2004.........................................53
Annual Perinatal Report 2004 6
Index of Figures Figure 1: Birth Rate for Tasmania per 1,000 Head of Population 1992-2004.............25 Figure 2: Proportion of Public and Private Patients 1992-2004 ..................................27 Figure 3: Sex of all Infants 1997-2004 ........................................................................28 Figure 4 Percentage of all Births by Birthweight Groups 2000-2004 .........................29 Figure 5: Number of Births with a Low Apgar Score at Five Minutes 1997-2004 .....31 Figure 6: Stillbirths & Neonatal Deaths 1997-2004 ....................................................34 Figure 7: Perinatal Mortality Rate per 1 000 Births in Tasmania 1992-2004 and Australia 1998-2002.....................................................................................................35 Figure 8: Proportion of Births by Maternal Age Groups 1992-2004...........................39 Figure 9: Maternal Age in Tasmania 2004 and Australia 2003...................................40 Figure 10: Mode of Delivery in Tasmania 2004 and Australia 2003 ..........................44 Figure 11: Caesarean Section Rates 1992-2004 ..........................................................47 Figure 12: Incidence of Postpartum Haemorrhage 1992 – 2004 .................................52 Figure 13: Incidence of Antepartum Haemorrhage 1992 – 2004 ................................53

Annual Perinatal Report 2004 7
Introduction The members of the Council of Obstetric & Paediatric Mortality & Morbidity are pleased to be able to present the Annual Report for 2004. Simon Parsons Chairperson Council of Obstetric and Paediatric Mortality and Morbidity. Disclaimer: During the production of this report several issues of data accuracy and problems of database integrity were encountered. While not downgrading the value of the information contained within this report, the possibility that some inaccuracies exist in the data as presented should be noted.
Annual Perinatal Report 2004 8
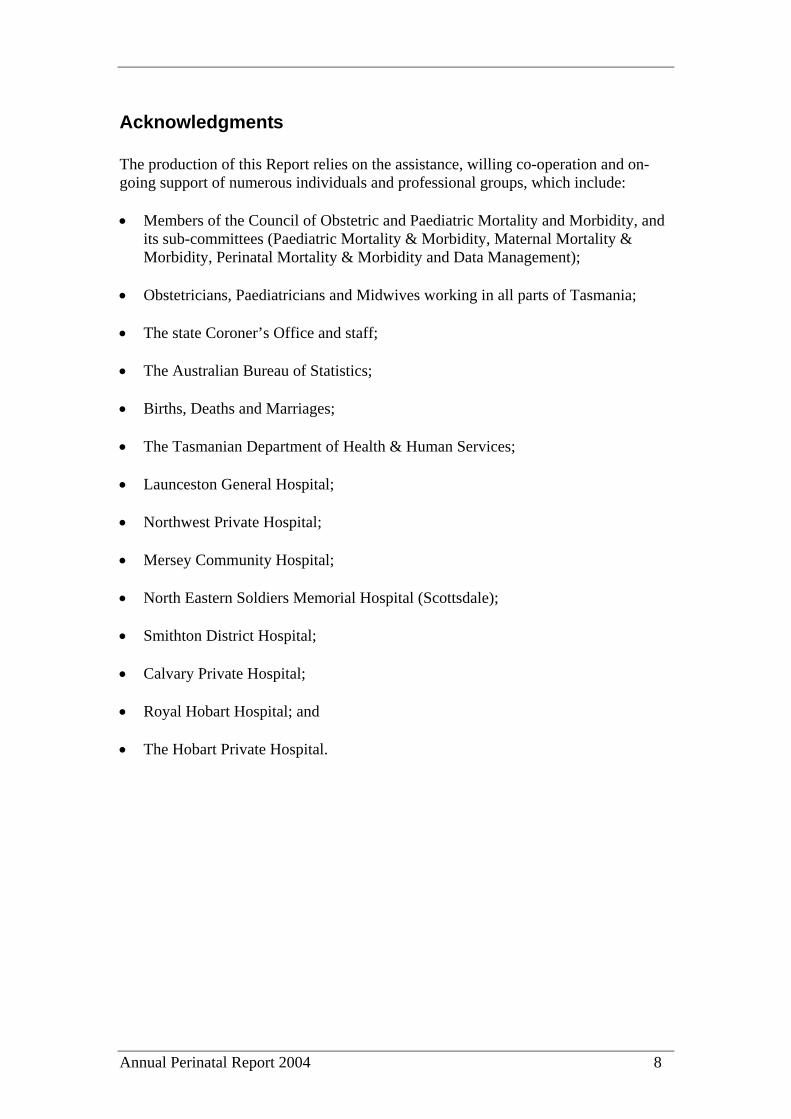
Acknowledgments The production of this Report relies on the assistance, willing co-operation and on-going support of numerous individuals and professional groups, which include: • Members of the Council of Obstetric and Paediatric Mortality and Morbidity, and
its sub-committees (Paediatric Mortality & Morbidity, Maternal Mortality & Morbidity, Perinatal Mortality & Morbidity and Data Management);
• Obstetricians, Paediatricians and Midwives working in all parts of Tasmania; • The state Coroner’s Office and staff; • The Australian Bureau of Statistics; • Births, Deaths and Marriages; • The Tasmanian Department of Health & Human Services; • Launceston General Hospital; • Northwest Private Hospital; • Mersey Community Hospital; • North Eastern Soldiers Memorial Hospital (Scottsdale); • Smithton District Hospital; • Calvary Private Hospital; • Royal Hobart Hospital; and • The Hobart Private Hospital.
Annual Perinatal Report 2004 9
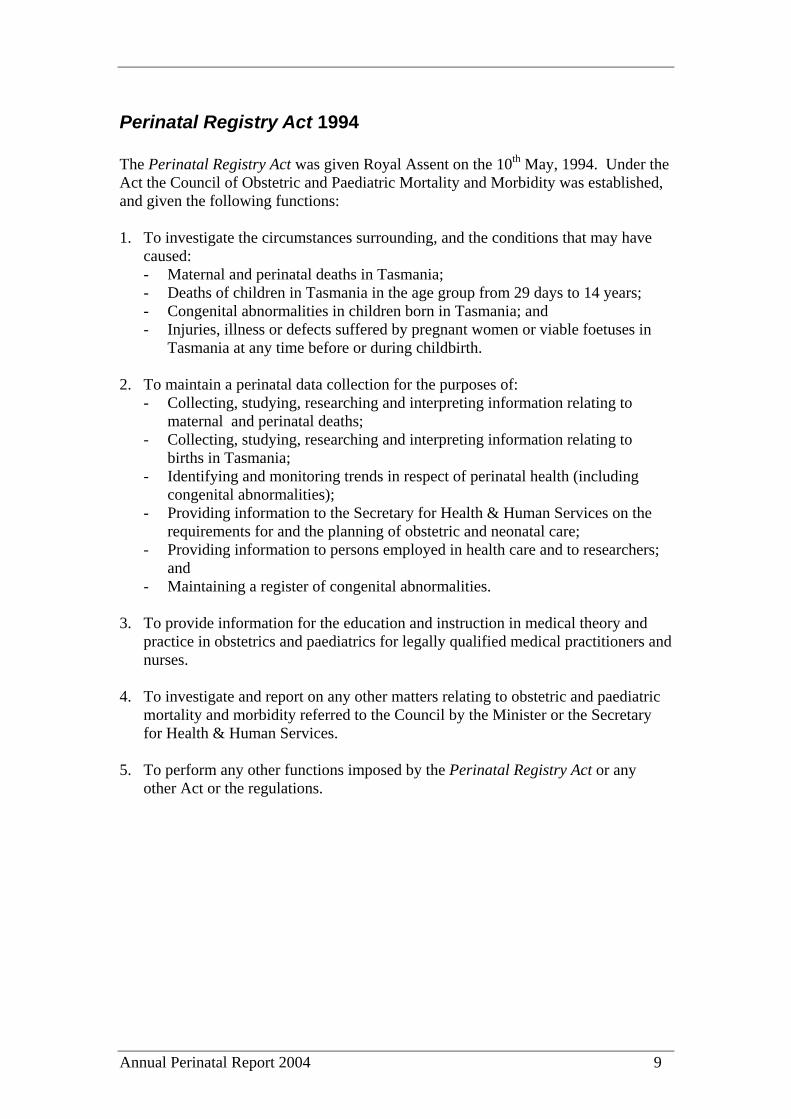
Perinatal Registry Act 1994 The Perinatal Registry Act was given Royal Assent on the 10th May, 1994. Under the Act the Council of Obstetric and Paediatric Mortality and Morbidity was established, and given the following functions: 1. To investigate the circumstances surrounding, and the conditions that may have
caused: - Maternal and perinatal deaths in Tasmania; - Deaths of children in Tasmania in the age group from 29 days to 14 years; - Congenital abnormalities in children born in Tasmania; and - Injuries, illness or defects suffered by pregnant women or viable foetuses in
Tasmania at any time before or during childbirth. 2. To maintain a perinatal data collection for the purposes of:
- Collecting, studying, researching and interpreting information relating to maternal and perinatal deaths;
- Collecting, studying, researching and interpreting information relating to births in Tasmania;
- Identifying and monitoring trends in respect of perinatal health (including congenital abnormalities);
- Providing information to the Secretary for Health & Human Services on the requirements for and the planning of obstetric and neonatal care;
- Providing information to persons employed in health care and to researchers; and
- Maintaining a register of congenital abnormalities. 3. To provide information for the education and instruction in medical theory and
practice in obstetrics and paediatrics for legally qualified medical practitioners and nurses.
4. To investigate and report on any other matters relating to obstetric and paediatric
mortality and morbidity referred to the Council by the Minister or the Secretary for Health & Human Services.
5. To perform any other functions imposed by the Perinatal Registry Act or any
other Act or the regulations.

Annual Perinatal Report 2004 10
Definitions Prescribed under the Perinatal Registry Act Abortion / Miscarriage: Spontaneous or medically induced termination of pregnancy before the foetus is viable (before 20 weeks gestation) Low birthweight: An infant born weighing less than 2500 grams Very low birthweight: An infant born weighing less than 1500 grams Extremely low birthweight: An infant born weighing less than 1000 grams Infant death: A death, occurring within 1 year of birth in a liveborn infant whose birthweight was at least 400 grams, or at least of 20 weeks gestation if the birthweight was not known. Maternal death: means:
(a) the death of a woman caused by, or that may have been cause by, her pregnancy or in which her pregnancy was, or may have been, a contributing factor; or
(b) the death of a woman that occurs before the twenty-ninth day after the day on which the woman gave birth to a child; or
(c) the death of a woman caused by, or that may have been caused by, her giving birth to a child, or in which her giving birth to a child was, or may have been, a contributing factor.
Neonatal death: A death occurring within 28 days of birth in an infant whose birthweight was at least 400 grams, or if the weight was not known, an infant born after at least 20 weeks of gestation. Preterm: An infant with a gestational age of less than 37 completed weeks. Sudden Infant Death Syndrome (SIDS): Sudden death of an infant under 1 year of age, which remains unexplained after a thorough case investigation including performance of a complete autopsy, examination of the death scene, and a review of the clinical history.1 Stillbirth: A foetal death prior to the complete expulsion or extraction from its mother of a product of conception of 20 or more completed weeks of gestation or 400 grams or more birthweight; the death is indicated by the fact that after such separation the foetus does not breathe or show any other evidence of life, such as beating of the heart, pulsation of the umbilical cord, or definite movement of voluntary muscles.2
1 Willinger, M., James, L.S. & Catz, C. Defining the Sudden Infant death Syndrome (SIDS): Deliberations of an Expert Panel convened by the National Institute of Child Health & Human Development. Paediatric Pathology 11:667-684, 1991 2 National Health Data Dictionary V10.0
Annual Perinatal Report 2004 11
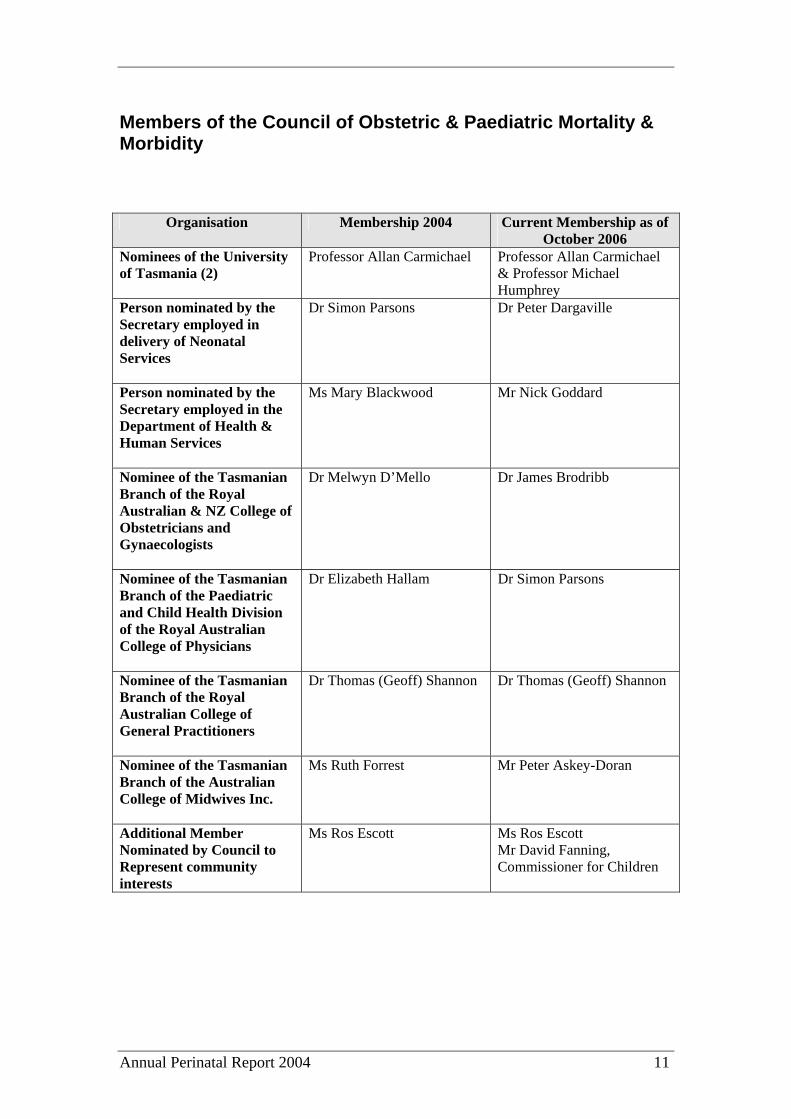
Members of the Council of Obstetric & Paediatric Mortality & Morbidity
Organisation Membership 2004 Current Membership as of October 2006
Nominees of the University of Tasmania (2)
Professor Allan Carmichael Professor Allan Carmichael & Professor Michael Humphrey
Person nominated by the Secretary employed in delivery of Neonatal Services
Dr Simon Parsons Dr Peter Dargaville
Person nominated by the Secretary employed in the Department of Health & Human Services
Ms Mary Blackwood Mr Nick Goddard
Nominee of the Tasmanian Branch of the Royal Australian & NZ College of Obstetricians and Gynaecologists
Dr Melwyn D’Mello Dr James Brodribb
Nominee of the Tasmanian Branch of the Paediatric and Child Health Division of the Royal Australian College of Physicians
Dr Elizabeth Hallam Dr Simon Parsons
Nominee of the Tasmanian Branch of the Royal Australian College of General Practitioners
Dr Thomas (Geoff) Shannon Dr Thomas (Geoff) Shannon
Nominee of the Tasmanian Branch of the Australian College of Midwives Inc.
Ms Ruth Forrest Mr Peter Askey-Doran
Additional Member Nominated by Council to Represent community interests
Ms Ros Escott Ms Ros Escott Mr David Fanning, Commissioner for Children

Annual Perinatal Report 2004 12
Members of Sub-Committees & Support Services
Name of Subcommittee Membership in 2004 *Current Membership as of Oct 2006
Maternal Mortality & Morbidity Subcommittee
Dr Shelby Jarrell (Chair) Dr Melwyn D’Mello Ms Ruth Forrest
Professor Michael Humphrey (Chair) Dr James Brodribb Mr Peter Askey-Doran
Paediatric Mortality & Morbidity Subcommittee
Dr Elizabeth Hallam (Chair) Dr Thomas (Geoff) Shannon Dr Chris Lawrence
Dr Simon Parsons (Chair) Dr Elizabeth Hallam Dr Thomas (Geoff) Shannon Mr David Fanning Dr Chris Lawrence
Perinatal Mortality & Morbidity Subcommittee
Dr Simon Parsons (Chair) Dr Melwyn D’Mello
Dr Simon Parsons (Chair) Dr James Brodribb Dr Peter Dargaville
Data Management Subcommittee
Dr Rupert Sherwood (Chair) Dr Melwyn D’Mello Dr Michelle Williams Ms Fiona French
Vacant
National Perinatal Data Development Committee-Tasmanian Representative
Ms Karen Wheeler Mr Peter Mansfield
Mr Peter Mansfield
Executive Ms Karen Wheeler Ms Jane Wood
Dr Jo Jordan
Support Staff Ms Diane Hickie (Perinatal Data) Ms Peggy Tsang (Planning & Performance Review) Ms Helen Galea (Clinical Data Services) Ms Diane Hickie (Perinatal Data)
* Due to the late release of this Report it was considered relevant to include current membership in view of their contribution to and preparation of this Report
Annual Perinatal Report 2004 13
Council Summary
Perinatal Statistics at a Glance
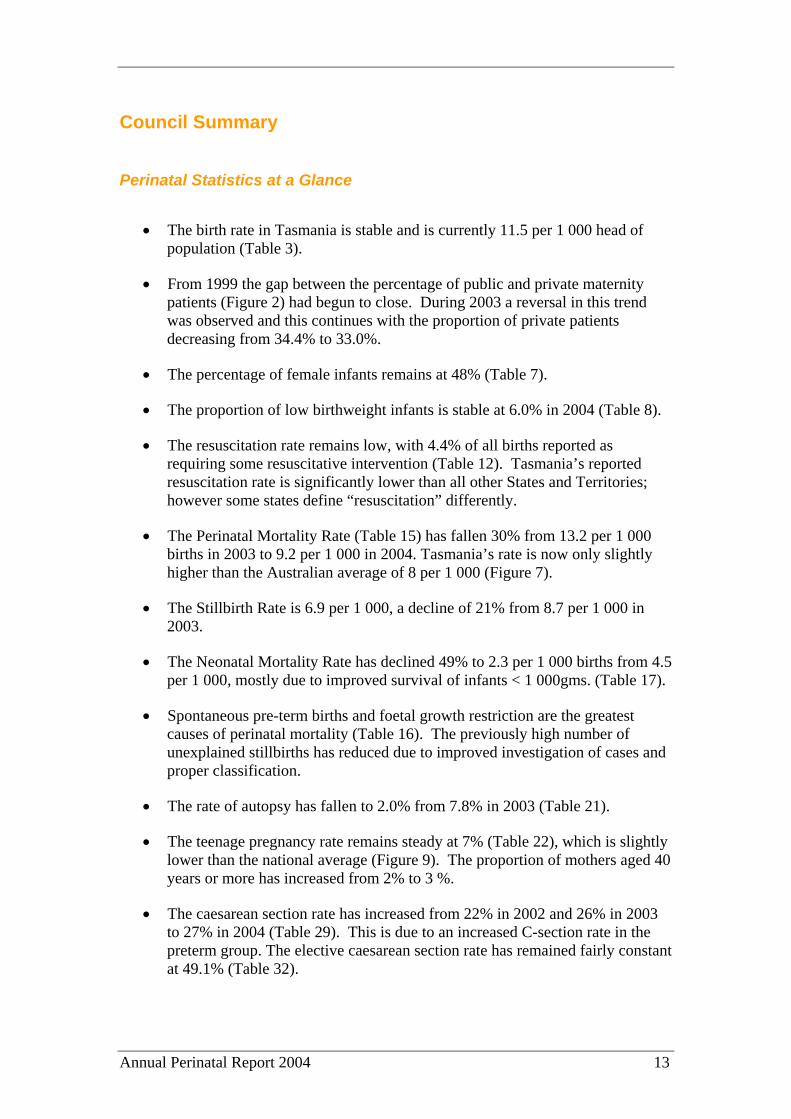
• The birth rate in Tasmania is stable and is currently 11.5 per 1 000 head of population (Table 3).
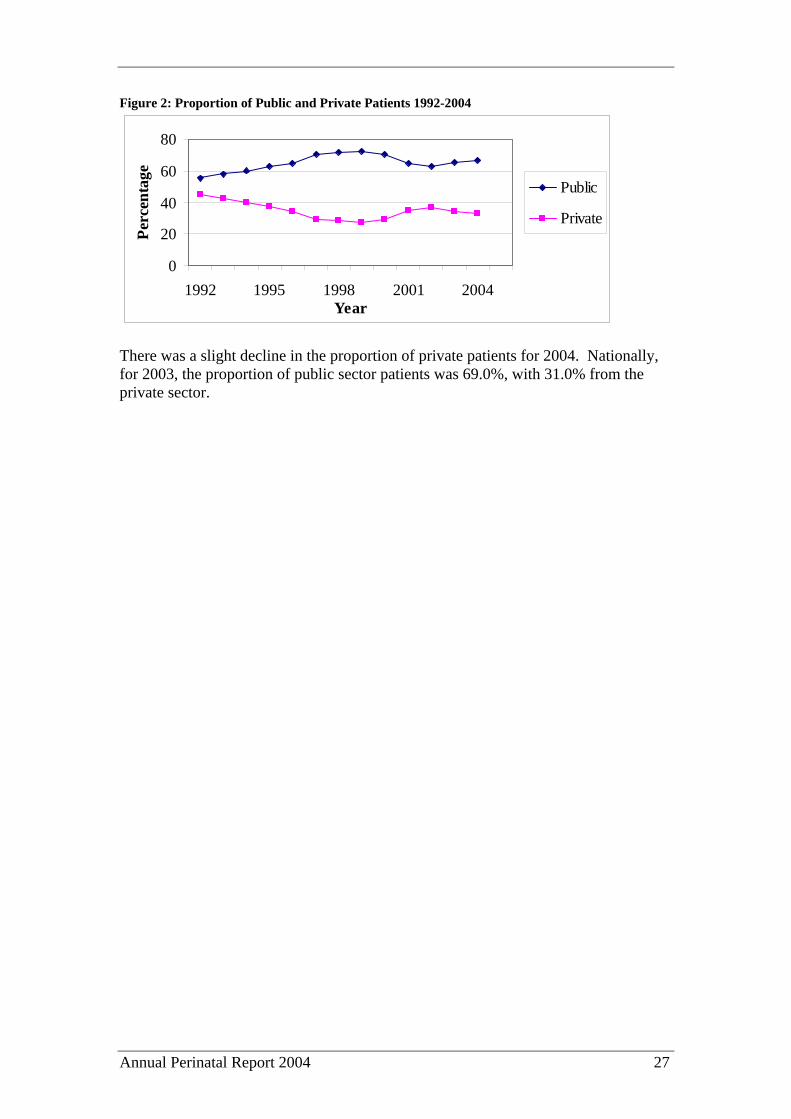
• From 1999 the gap between the percentage of public and private maternity patients (Figure 2) had begun to close. During 2003 a reversal in this trend was observed and this continues with the proportion of private patients decreasing from 34.4% to 33.0%.
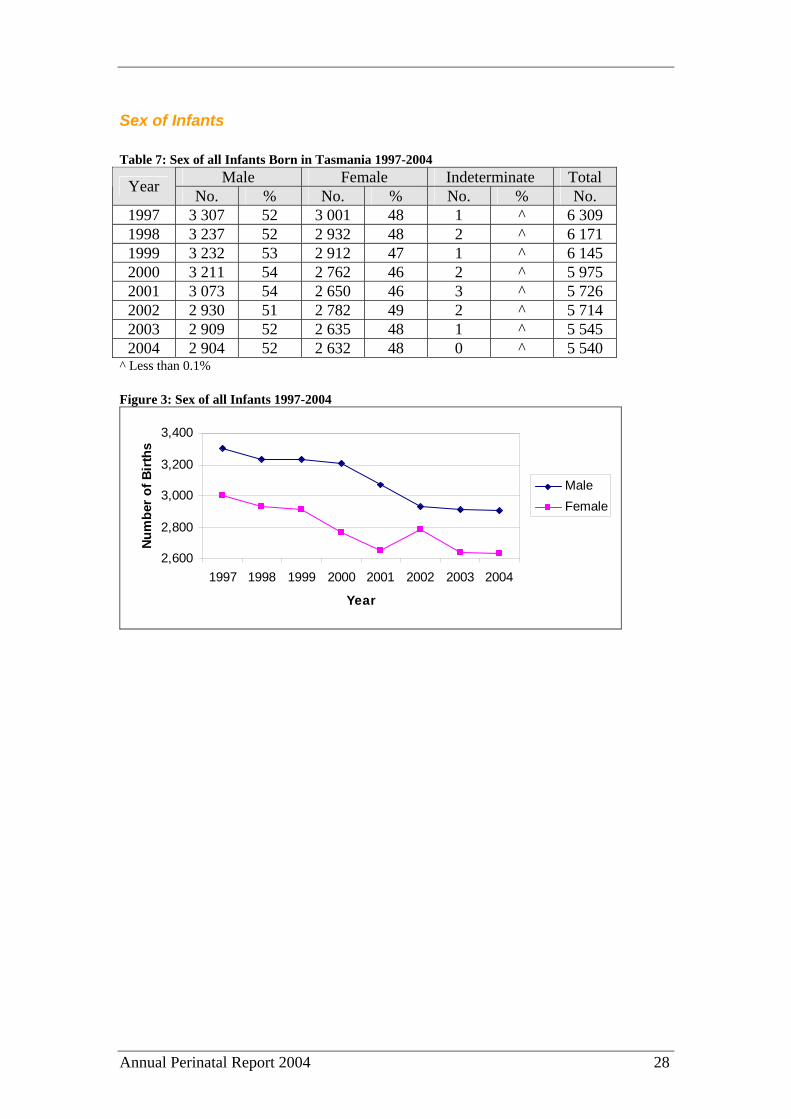
• The percentage of female infants remains at 48% (Table 7).
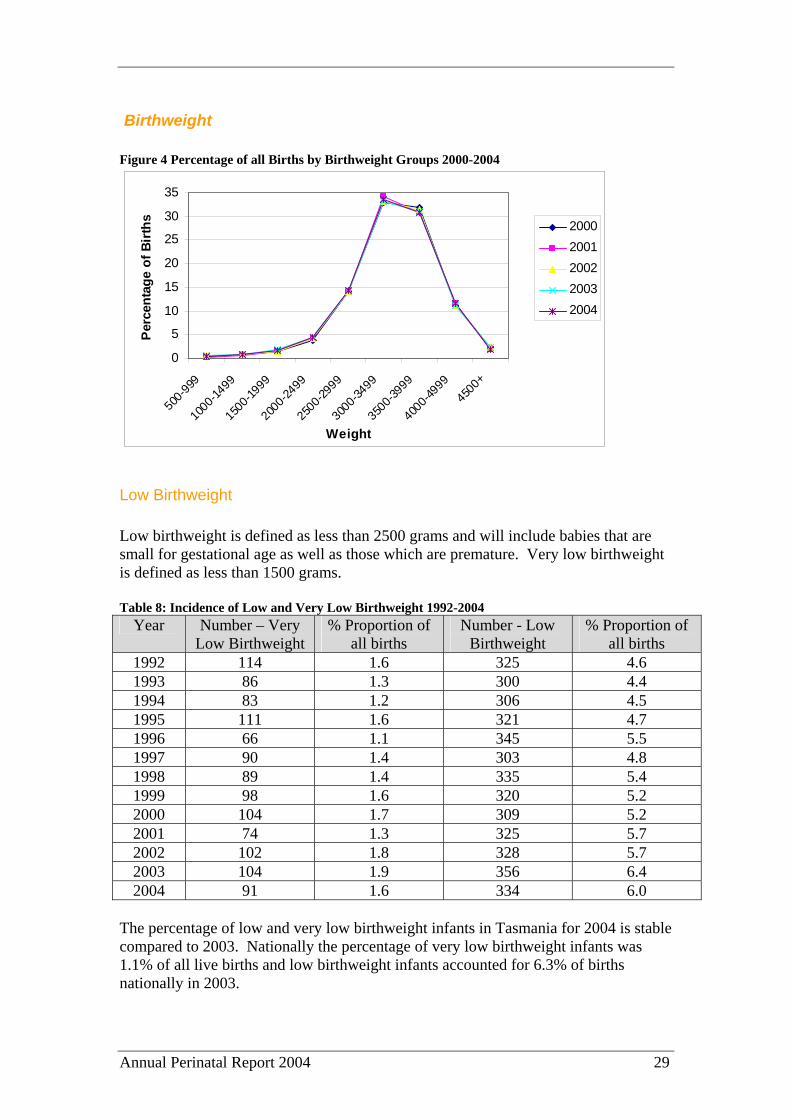
• The proportion of low birthweight infants is stable at 6.0% in 2004 (Table 8).
• The resuscitation rate remains low, with 4.4% of all births reported as requiring some resuscitative intervention (Table 12). Tasmania’s reported resuscitation rate is significantly lower than all other States and Territories; however some states define “resuscitation” differently.
• The Perinatal Mortality Rate (Table 15) has fallen 30% from 13.2 per 1 000 births in 2003 to 9.2 per 1 000 in 2004. Tasmania’s rate is now only slightly higher than the Australian average of 8 per 1 000 (Figure 7).
• The Stillbirth Rate is 6.9 per 1 000, a decline of 21% from 8.7 per 1 000 in 2003.
• The Neonatal Mortality Rate has declined 49% to 2.3 per 1 000 births from 4.5 per 1 000, mostly due to improved survival of infants < 1 000gms. (Table 17).
• Spontaneous pre-term births and foetal growth restriction are the greatest causes of perinatal mortality (Table 16). The previously high number of unexplained stillbirths has reduced due to improved investigation of cases and proper classification.
• The rate of autopsy has fallen to 2.0% from 7.8% in 2003 (Table 21).
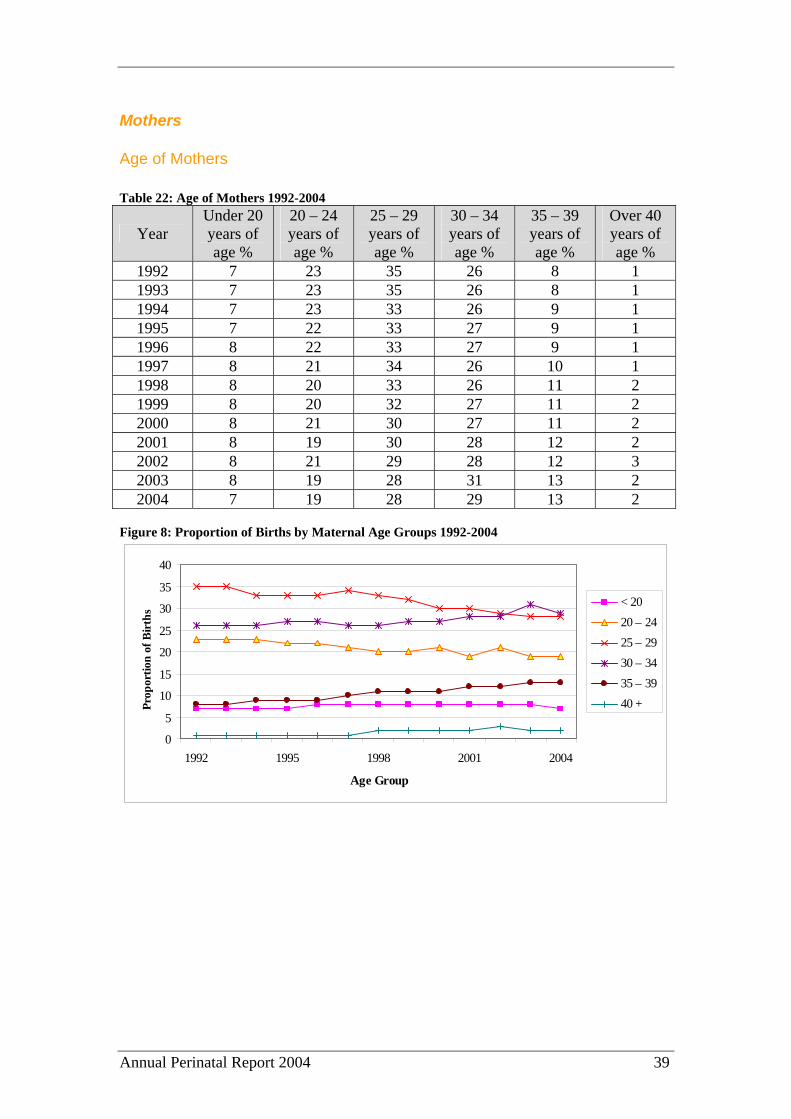
• The teenage pregnancy rate remains steady at 7% (Table 22), which is slightly lower than the national average (Figure 9). The proportion of mothers aged 40 years or more has increased from 2% to 3 %.
• The caesarean section rate has increased from 22% in 2002 and 26% in 2003 to 27% in 2004 (Table 29). This is due to an increased C-section rate in the preterm group. The elective caesarean section rate has remained fairly constant at 49.1% (Table 32).
Annual Perinatal Report 2004 14
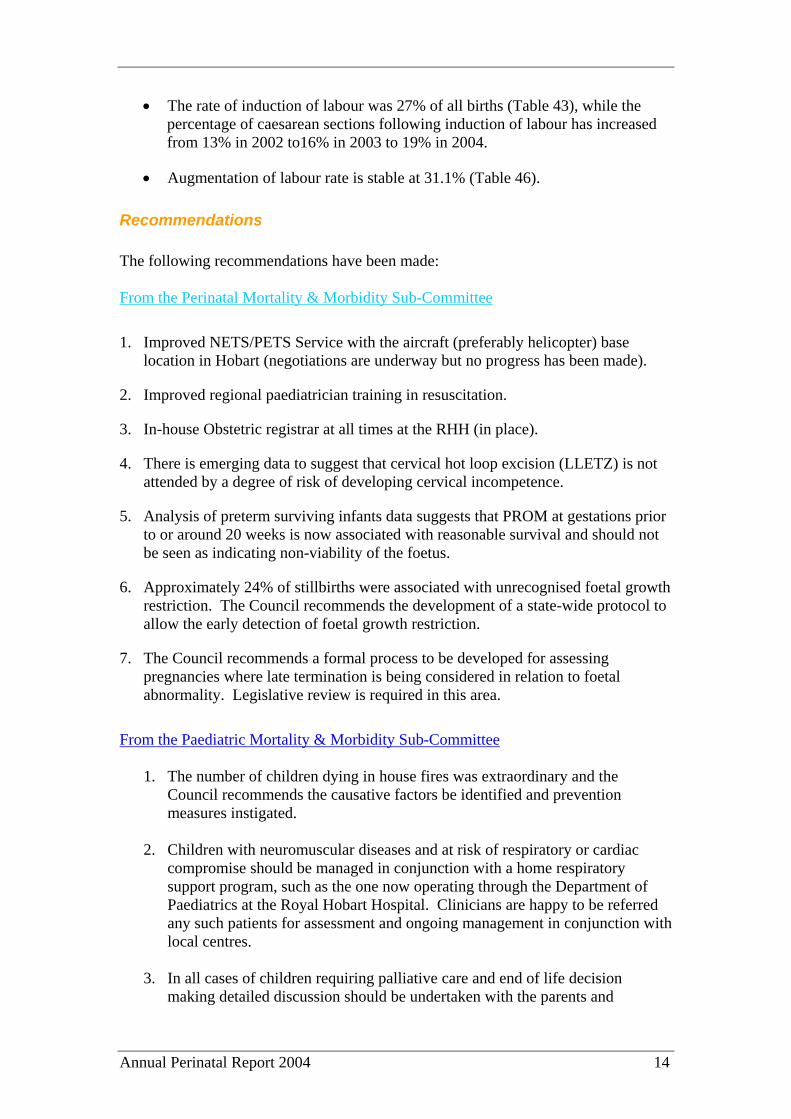
• The rate of induction of labour was 27% of all births (Table 43), while the percentage of caesarean sections following induction of labour has increased from 13% in 2002 to16% in 2003 to 19% in 2004.
• Augmentation of labour rate is stable at 31.1% (Table 46).
Recommendations The following recommendations have been made: From the Perinatal Mortality & Morbidity Sub-Committee
1. Improved NETS/PETS Service with the aircraft (preferably helicopter) base location in Hobart (negotiations are underway but no progress has been made).
2. Improved regional paediatrician training in resuscitation.
3. In-house Obstetric registrar at all times at the RHH (in place).
4. There is emerging data to suggest that cervical hot loop excision (LLETZ) is not attended by a degree of risk of developing cervical incompetence.
5. Analysis of preterm surviving infants data suggests that PROM at gestations prior to or around 20 weeks is now associated with reasonable survival and should not be seen as indicating non-viability of the foetus.
6. Approximately 24% of stillbirths were associated with unrecognised foetal growth restriction. The Council recommends the development of a state-wide protocol to allow the early detection of foetal growth restriction.
7. The Council recommends a formal process to be developed for assessing pregnancies where late termination is being considered in relation to foetal abnormality. Legislative review is required in this area.
From the Paediatric Mortality & Morbidity Sub-Committee
1. The number of children dying in house fires was extraordinary and the Council recommends the causative factors be identified and prevention measures instigated.
2. Children with neuromuscular diseases and at risk of respiratory or cardiac
compromise should be managed in conjunction with a home respiratory support program, such as the one now operating through the Department of Paediatrics at the Royal Hobart Hospital. Clinicians are happy to be referred any such patients for assessment and ongoing management in conjunction with local centres.
3. In all cases of children requiring palliative care and end of life decision
making detailed discussion should be undertaken with the parents and
Annual Perinatal Report 2004 15
appropriate others. The outcomes of these discussions should be clearly documented in the child’s medical records to provide a clear direction for the management of the case and assist in the review of such cases.
4. Road design/town planning improvements are required to establish pedestrian
and bicycle trail systems separate from our roads. From the Maternal Mortality & Morbidity Sub-Committee Nil Conclusion The Council recognises that the State’s Perinatal Mortality rate has been at similarly low levels in the 1990’s, but believes that at least part of the more recent decline in Perinatal Mortality reflects the increased survival, when compared with 2003 data, of VLBW infants as a direct result of increased resources and skill levels of staff throughout Women’s and Children’s Services, but especially at the Royal Hobart Hospital. The Councils hopes that this decline can be sustained into the future. Preliminary figures from 2005 indicate only 5 neonatal deaths (as opposed to 14 in 2004) indicating the decline in neonatal mortality will continue.

Annual Perinatal Report 2004 16
Committee Reports
Maternal Mortality & Morbidity Sub-Committee
Maternal Deaths for 2004 One maternal death occurred in Tasmania in 2004. In this case a 28 year old, G2P2, woman with known polyhydramnios was admitted to hospital with possible pre term labour at 32 weeks gestation. She had a previous history of pre term delivery of a liveborn infant via caesarean section. The woman had suffered from pre-eclampsia during that pregnancy. She also had a history of epilepsy for which she was prescribed Tegretol. Two weeks prior to this admission she had undergone drainage of 500 mls of amniotic fluid. In the early hours of the morning on the day after admission the woman notified staff that her waters had broken. The Registered Nurse on duty went to notify the delivery suite and on her return discovered the patient cyanosed and fitting with obvious respiratory distress. The Medical Emergency Team was called and the anaesthetist summoned. The patient was transferred to the delivery suite but went into cardiac arrest during transit. A code blue was called and active resuscitation commenced. An emergency caesarean section was performed to aid resuscitation and the patient was subsequently transferred to the Intensive Care Unit. The woman’s heart rate was unresponsive to increasing noradrenaline doses and satisfactory circulation was unable to be established. Further treatment efforts were ceased. The post mortem identified the cause of death as amniotic fluid embolism. The Maternal Mortality & Morbidity Committee has classified this death as a direct maternal death. Polyhydramnios is a known associated factor in amniotic fluid embolism, however it is not predictive that such an event will occur. Amniotic fluid embolism occurs once in every 80 000 pregnancies, and there is an 80% mortality rate. There were no preventable factors in this case and consequently no recommendations to be made. Recommendations: Nil
Annual Perinatal Report 2004 17
Perinatal Mortality & Morbidity Sub-Committee
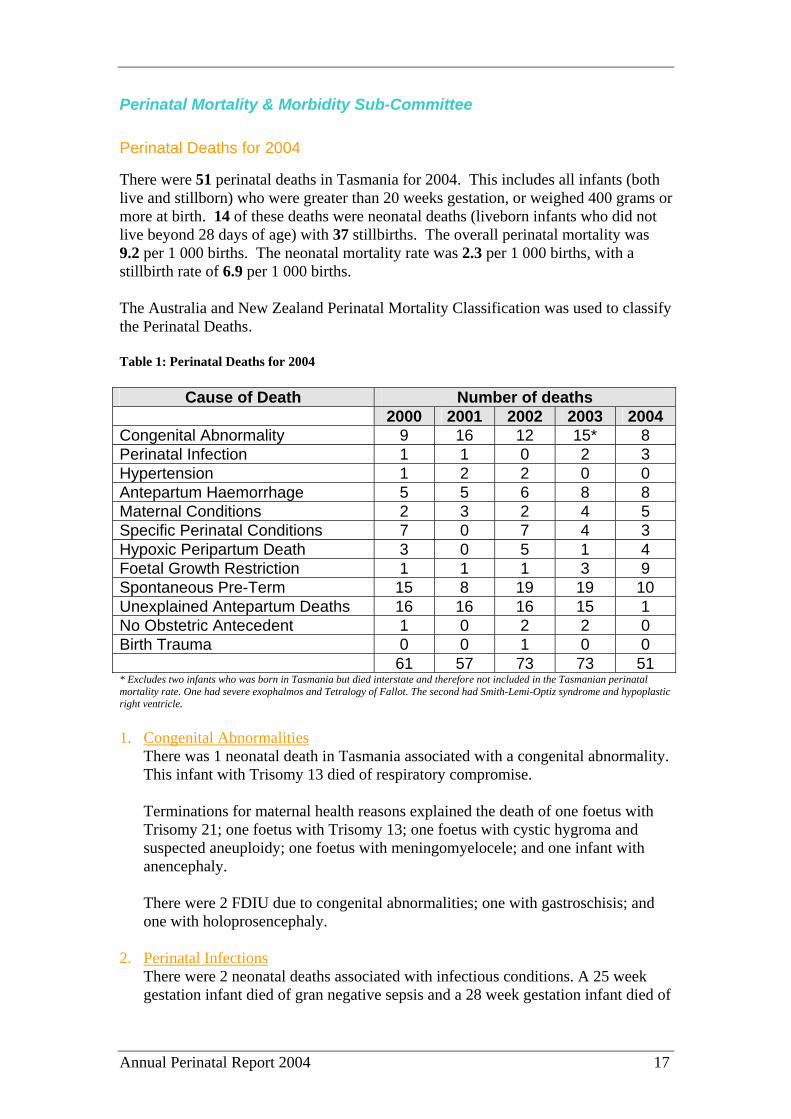
Perinatal Deaths for 2004 There were 51 perinatal deaths in Tasmania for 2004. This includes all infants (both live and stillborn) who were greater than 20 weeks gestation, or weighed 400 grams or more at birth. 14 of these deaths were neonatal deaths (liveborn infants who did not live beyond 28 days of age) with 37 stillbirths. The overall perinatal mortality was 9.2 per 1 000 births. The neonatal mortality rate was 2.3 per 1 000 births, with a stillbirth rate of 6.9 per 1 000 births. The Australia and New Zealand Perinatal Mortality Classification was used to classify the Perinatal Deaths. Table 1: Perinatal Deaths for 2004
Cause of Death Number of deaths 2000 2001 2002 2003 2004 Congenital Abnormality 9 16 12 15* 8 Perinatal Infection 1 1 0 2 3 Hypertension 1 2 2 0 0 Antepartum Haemorrhage 5 5 6 8 8 Maternal Conditions 2 3 2 4 5 Specific Perinatal Conditions 7 0 7 4 3 Hypoxic Peripartum Death 3 0 5 1 4 Foetal Growth Restriction 1 1 1 3 9 Spontaneous Pre-Term 15 8 19 19 10 Unexplained Antepartum Deaths 16 16 16 15 1 No Obstetric Antecedent 1 0 2 2 0 Birth Trauma 0 0 1 0 0 61 57 73 73 51 * Excludes two infants who was born in Tasmania but died interstate and therefore not included in the Tasmanian perinatal mortality rate. One had severe exophalmos and Tetralogy of Fallot. The second had Smith-Lemi-Optiz syndrome and hypoplastic right ventricle. 1. Congenital Abnormalities
There was 1 neonatal death in Tasmania associated with a congenital abnormality. This infant with Trisomy 13 died of respiratory compromise. Terminations for maternal health reasons explained the death of one foetus with Trisomy 21; one foetus with Trisomy 13; one foetus with cystic hygroma and suspected aneuploidy; one foetus with meningomyelocele; and one infant with anencephaly. There were 2 FDIU due to congenital abnormalities; one with gastroschisis; and one with holoprosencephaly.
2. Perinatal Infections
There were 2 neonatal deaths associated with infectious conditions. A 25 week gestation infant died of gran negative sepsis and a 28 week gestation infant died of
Annual Perinatal Report 2004 18
sepsis of unknown aetiology with associated autopsy diagnosed mild coarctation of the aorta.
There was one stillbirth at 25 weeks from infection associated with PROM.
3. Hypertension
There were no perinatal deaths related to maternal hypertension. 4. Antepartum Haemorrhage
There were 8 stillbirths due to APH. 5. Maternal Conditions
One due to trauma; two due to a termination at 20-21 weeks due to PROM; two due to cervical incompetence secondary to cervical surgery for precancerous cervical conditions.
6. Specific Perinatal Conditions
One feto-maternal haemorrhage and two incidences of in-utero cord entanglements.
7. Hypoxic Peripartum Death
There were 2 neonatal deaths resulting from hypoxic injury. One infant died at term from severe HIE after emergency delivery in the presence of maternal cardiac arrest secondary to amniotic fluid embolus. The absence of an in-house Obstetric Registrar was identified as contributing to this death.
A third infant born at 33 weeks gestation died of HIE contributed to by placenta praevia and APH. Resuscitation of the infant was not ideal, but likely did not affect the outcome.
One umbilical cord haematoma led to a FDIU.
8. Foetal Growth Restrictions
In most cases of FDIUs associated with severe IUGR, the IUGR was unrecognised prior to the foetal death.
9. Spontaneous Pre-Term
There were 9 neonatal deaths associated with prematurity. Of these neonatal deaths, 6 infants were 23 weeks or less gestation. One infant of 29 weeks gestation had associated pulmonary hypoplasia due to prolonged premature rupture of membranes. This infant died awaiting NETS transfer to Melbourne due to lack of beds at the RHH. One infant died at 29 weeks gestation with a massive unexpected intracerebral haemorrhage. One infant born at 24 weeks gestation had treatment discontinued due to bilateral grade IV intracerebral haemorrhages.

Annual Perinatal Report 2004 19
There was 1 stillbirth associated with extreme prematurity at 22 weeks. 10. Unexplained Antepartum Deaths
One case was reported as shown in Table 1. 11. No Obstetric Antecedent
There were no unexplained neonatal deaths (i.e. from SIDS). 12. Birth Trauma
There were no perinatal deaths from birth trauma. Issues: The review of neonatal mortality identified the following issues:
• Transport delays in transferring critically ill infants to the Royal Hobart Hospital and lack of neonatal and paediatric intensive care beds remain an issue. A Hobart based (both team and helicopter) paediatric and neonatal transport service is strongly recommended, but negotiations with the government have stalled. A new and enlarged neonatal and paediatric intensive care unit is currently under construction in Hobart.
• A need for the introduction of an in-house Obstetric Registrar at the RHH (now in place).
• Regional practitioners require greater experience and training in paediatric resuscitation. We again recommend that credentialing in Paediatric Advanced Life Support (and the new Neonatal Resuscitation curriculum being developed in Australia) be compulsory for all paediatricians and paediatric registrars licensed in Tasmania. The experience level of regional practitioners will always be adversely affected by low patient volumes and as such the NW community will be better served if services are centralized.
• The fall in neonatal mortality has been contributed to by the improved survival of very low birthweight infants, because of improved services at the RHH NICU, particularly the introduction of sub-specialist Neonatologists/Intensivists and High Frequency Oscillatory Ventilation. This conclusion has been reached by the Council after a direct comparison of the causes of preterm deaths from 2003 and 2004.
• The number of unexplained stillbirths has also decreased, and is now in line with other states. This apparent reduction is due to better classification of stillbirths based on more rigorous investigation of the cases by the Council.
Recommendations: 1. Improved NETS Service with aircraft (preferably helicopter) location in Hobart
(negotiations are underway).
2. Improved regional paediatrician training in resuscitation.

Annual Perinatal Report 2004 20
3. In-house Obstetric registrar at all times at the RHH (in place).
4. There is emerging data to suggest that cervical hot loop excision (LLETZ) is not attended by a degree of risk of developing cervical incompetence.
5. New survival data suggests that PROM at gestations prior to or around 20 weeks is now associated with reasonable survival and should not be seen as indicating non-viability of the foetus (reference).
6. Approximately 24% of stillbirths were associated with unrecognised foetal growth restriction. The Council recommends the development of a state-wide protocol to allow the early detection of foetal growth restriction.
7. The Council recommends a formal process to be developed for assessing pregnancies where late termination is being considered in relation to foetal abnormality. Legislative review is required in this area.
Annual Perinatal Report 2004 21
Paediatric Mortality & Morbidity Sub-Committee
Paediatric Deaths for 2004 The Council’s Terms of Reference in relation to paediatric mortality and as specified under the Perinatal Registry Act, 1994 are:
To investigate the circumstances surrounding, and the conditions that may have caused: deaths of children in Tasmania in the age group from 29 days to 14 years.
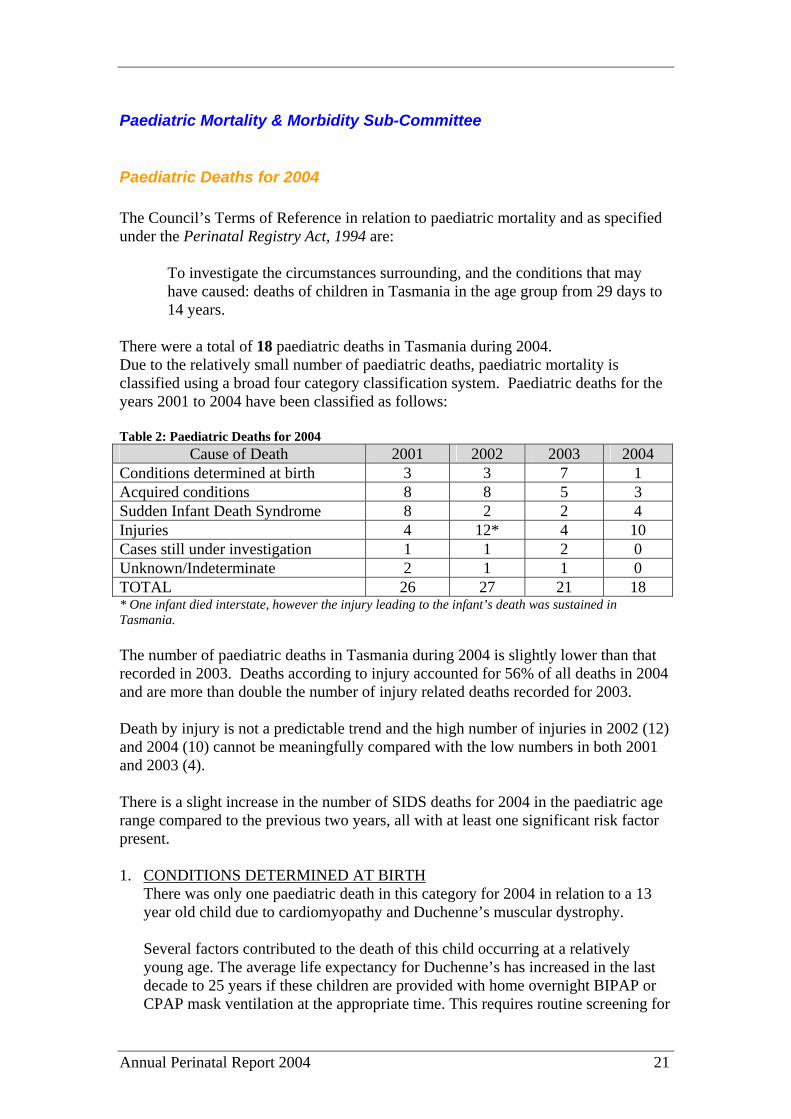
There were a total of 18 paediatric deaths in Tasmania during 2004. Due to the relatively small number of paediatric deaths, paediatric mortality is classified using a broad four category classification system. Paediatric deaths for the years 2001 to 2004 have been classified as follows: Table 2: Paediatric Deaths for 2004
Cause of Death 2001 2002 2003 2004 Conditions determined at birth 3 3 7 1 Acquired conditions 8 8 5 3 Sudden Infant Death Syndrome 8 2 2 4 Injuries 4 12* 4 10 Cases still under investigation 1 1 2 0 Unknown/Indeterminate 2 1 1 0 TOTAL 26 27 21 18 * One infant died interstate, however the injury leading to the infant’s death was sustained in Tasmania. The number of paediatric deaths in Tasmania during 2004 is slightly lower than that recorded in 2003. Deaths according to injury accounted for 56% of all deaths in 2004 and are more than double the number of injury related deaths recorded for 2003. Death by injury is not a predictable trend and the high number of injuries in 2002 (12) and 2004 (10) cannot be meaningfully compared with the low numbers in both 2001 and 2003 (4). There is a slight increase in the number of SIDS deaths for 2004 in the paediatric age range compared to the previous two years, all with at least one significant risk factor present. 1. CONDITIONS DETERMINED AT BIRTH
There was only one paediatric death in this category for 2004 in relation to a 13 year old child due to cardiomyopathy and Duchenne’s muscular dystrophy.
Several factors contributed to the death of this child occurring at a relatively young age. The average life expectancy for Duchenne’s has increased in the last decade to 25 years if these children are provided with home overnight BIPAP or CPAP mask ventilation at the appropriate time. This requires routine screening for
Annual Perinatal Report 2004 22
the onset of significant respiratory compromise and access to sleep studies. Such children should also have regular cardiac ultrasound assessments to detect early cardiomyopathy and medical therapy to prolong life instigated. The case also highlighted a shortage of intensive care beds dedicated to children in Tasmania, a situation that is being rectified with the building of a new joint neonatal and paediatric intensive care unit in Hobart.
2. ACQUIRED CONDITIONS
There were three deaths in children ranging from the ages of 5 years to 13 years where the cause of death was an acquired condition in 2004. One child suffered from Ewings Sarcoma, another of Osteosarcoma and the third suffered hypoxic brain damage of uncertain aetiology.
3. SUDDEN INFANT DEATH SYNDROME
There were four paediatric sudden infant deaths in 2004 with infants aged 3 months to 7 months. Three of these infants were male and one was female. Two of the deaths were attributable to an unsafe sleeping position while the other two deaths had multiple risk factors (at least three) present. The following risk factors were noted for both of these cases:
a. Both infants died while they were sleeping in the same bed as their parents
and possibly other children; b. There was a history of smoking in the household; c. There was evidence of alcohol consumption; and d. Infants were in unsafe bedding environments including use of a doona,
fold-up bed and an unsafe mattress.
The rate of deaths attributed to SIDS is probably high relative to our population. Recently South Australia reported only 1 death per annum from a population 3 times that of Tasmania, and Victoria reported 26 deaths from a population 10 times that of Tasmania.
4. INJURY
Ten children died as a result of injury in 2004. The age of the children ranged from two years to 15 years and involved seven females and three males. Six of the deaths were as a result of three separate house fires, one was a cyclist hit by a car, another drowned after going missing in the bush, one suffered a head injury from a tree felling incident and another died from an accidental hanging.
5. CASES STILL UNDER INVESTIGATION
There were no deaths in this category during 2004. 6. UNKNOWN/INDETERMINATE
There were no deaths during this category during 2004.

Annual Perinatal Report 2004 23
Recommendations:
1. The number of children dying in house fires was extraordinary and the Council recommends the causative factors be identified and prevention measures instigated.
2. Children with neuromuscular diseases and at risk of respiratory or cardiac
compromise should be managed in conjunction with a home respiratory support program, such as the one now operating through the Department of Paediatrics at the Royal Hobart Hospital.
3. In all cases of children requiring palliative care and end of life decision
making detailed discussion should be undertaken with the parents and appropriate others. The outcomes of these discussions should be clearly documented in the child’s medical records to provide a clear direction for the management of the case and assist in the review of such cases.
4. Road design/town planning improvements to establish pedestrian and bicycle
trail systems separate from our roads would likely reduce the small number of bicyclists’ deaths.

Annual Perinatal Report 2004 24
Data Management Sub-Committee The Data Management Sub-Committee has not met since February 2003. Subsequently no official report has been submitted from this subcommittee for this 2004 Report. 1. Data collection form:
The Perinatal Data Collection Form was revised during 2004, with a planned implementation date for the new form set for January 1, 2005. National interest has been created in a database for Congenital Anomalies, but the Council has deferred taking on this task for now due to lack of resources.
2. Re-design the database:
Progress in relation to an improved database has slowed. Much work is yet required to achieve a workable database that is accessible on-line from all centres.
3. Review the structure of the Annual Report
The 2004 report format has again been improved, with many redundant tables deleted and new more relevant tables inserted. The report still requires further simplification and more relevant data presentation.
Annual Perinatal Report 2004 25
Perinatal Statistics
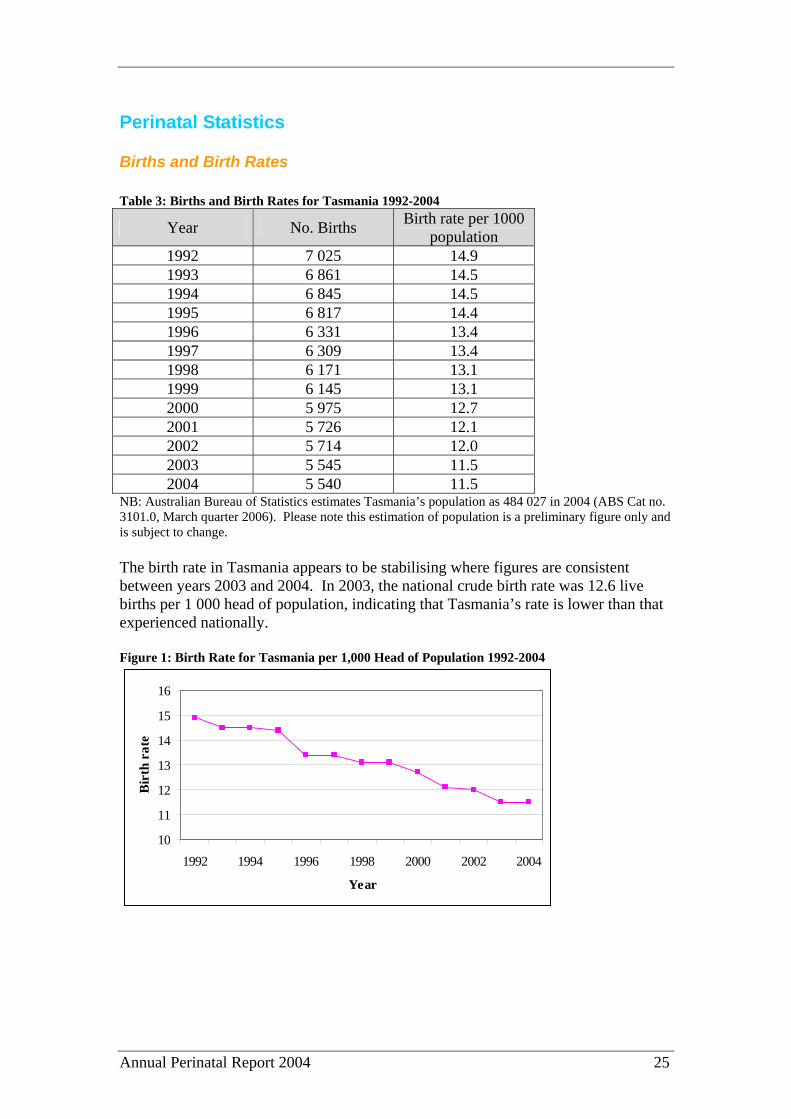
Births and Birth Rates Table 3: Births and Birth Rates for Tasmania 1992-2004
Year No. Births Birth rate per 1000 population
1992 7 025 14.9 1993 6 861 14.5 1994 6 845 14.5 1995 6 817 14.4 1996 6 331 13.4 1997 6 309 13.4 1998 6 171 13.1 1999 6 145 13.1 2000 5 975 12.7 2001 5 726 12.1 2002 5 714 12.0 2003 5 545 11.5 2004 5 540 11.5
NB: Australian Bureau of Statistics estimates Tasmania’s population as 484 027 in 2004 (ABS Cat no. 3101.0, March quarter 2006). Please note this estimation of population is a preliminary figure only and is subject to change. The birth rate in Tasmania appears to be stabilising where figures are consistent between years 2003 and 2004. In 2003, the national crude birth rate was 12.6 live births per 1 000 head of population, indicating that Tasmania’s rate is lower than that experienced nationally. Figure 1: Birth Rate for Tasmania per 1,000 Head of Population 1992-2004
10
11
12
13
14
15
16
1992 1994 1996 1998 2000 2002 2004
Year
Bir
th r
ate

Annual Perinatal Report 2004 26
Table 4: Births by Region 1997-2004 Year South North Northwest 1997 3 087 1 705 1 505 1998 3 028 1 699 1 509 1999 2 993 1 769 1 411 2000 2 922 1 692 1 357 2001 2 904 1 573 1 238 2002 2 873 1 600 1 230 2003 2 762 1 557 1 193 2004 2 753 1 567 1 161
Table 5: Births by Hospital 1997-2004
Hospital 1997 No.
1998 No.
1999 No.
2000 No.
2001 No.
2002 No.
2003 No.
2004 No.
Royal Hobart Hospital (QAH) 2 049 2 050 2 084 2 007 1 823 1 831 1 633 1 688Launceston General Hospital (QVH) 1 626 1 564 1 641 1 587 1 512 1 493 1 482 1 505District Hospitals 180 151 159 119 101 78 61 60Private Sector 2 401 2 349 2 195 2 216 2 250 2 230 2 284 2 193Others (includes homebirths) 53 57 66 46 40 82 85 94TOTAL 6 309 6 171 6 145 5 975 5 726 5 714 5 545 5 540 Table 6: Proportion of Public and Private Patients 1992-2004
Year Public % Private % 1992 55.5 44.5 1993 57.9 42.1 1994 60.0 40.0 1995 63.0 37.0 1996 64.8 34.2 1997 70.8 29.2 1998 71.5 28.5 1999 72.3 27.1 2000 70.6 28.8 2001 65.0 34.6 2002 62.7 36.6 2003 65.2 34.3 2004 66.9 33.0
Annual Perinatal Report 2004 27
Figure 2: Proportion of Public and Private Patients 1992-2004
0
20
40
60
80
1992 1995 1998 2001 2004Year
Perc
enta
ge
Public
Private
There was a slight decline in the proportion of private patients for 2004. Nationally, for 2003, the proportion of public sector patients was 69.0%, with 31.0% from the private sector.
Annual Perinatal Report 2004 28
Sex of Infants Table 7: Sex of all Infants Born in Tasmania 1997-2004
Male Female Indeterminate Total Year No. % No. % No. % No. 1997 3 307 52 3 001 48 1 ^ 6 309 1998 3 237 52 2 932 48 2 ^ 6 171 1999 3 232 53 2 912 47 1 ^ 6 145 2000 3 211 54 2 762 46 2 ^ 5 975 2001 3 073 54 2 650 46 3 ^ 5 726 2002 2 930 51 2 782 49 2 ^ 5 714 2003 2 909 52 2 635 48 1 ^ 5 545 2004 2 904 52 2 632 48 0 ^ 5 540
^ Less than 0.1% Figure 3: Sex of all Infants 1997-2004
2,600
2,800
3,000
3,200
3,400
1997 1998 1999 2000 2001 2002 2003 2004
Year
Num
ber
of B
irth
s
MaleFemale
Annual Perinatal Report 2004 29
Birthweight Figure 4 Percentage of all Births by Birthweight Groups 2000-2004
0
5
10
15
20
25
30
35
500-9
99
1000
-1499
1500
-1999
2000
-2499
2500
-2999
3000
-3499
3500
-3999
4000
-4999
4500
+
Weight
Per
cent
age
of B
irth
s 20002001200220032004
Low Birthweight Low birthweight is defined as less than 2500 grams and will include babies that are small for gestational age as well as those which are premature. Very low birthweight is defined as less than 1500 grams. Table 8: Incidence of Low and Very Low Birthweight 1992-2004
Year Number – Very Low Birthweight
% Proportion of all births
Number - Low Birthweight
% Proportion of all births
1992 114 1.6 325 4.6 1993 86 1.3 300 4.4 1994 83 1.2 306 4.5 1995 111 1.6 321 4.7 1996 66 1.1 345 5.5 1997 90 1.4 303 4.8 1998 89 1.4 335 5.4 1999 98 1.6 320 5.2 2000 104 1.7 309 5.2 2001 74 1.3 325 5.7 2002 102 1.8 328 5.7 2003 104 1.9 356 6.4 2004 91 1.6 334 6.0
The percentage of low and very low birthweight infants in Tasmania for 2004 is stable compared to 2003. Nationally the percentage of very low birthweight infants was 1.1% of all live births and low birthweight infants accounted for 6.3% of births nationally in 2003.
Annual Perinatal Report 2004 30
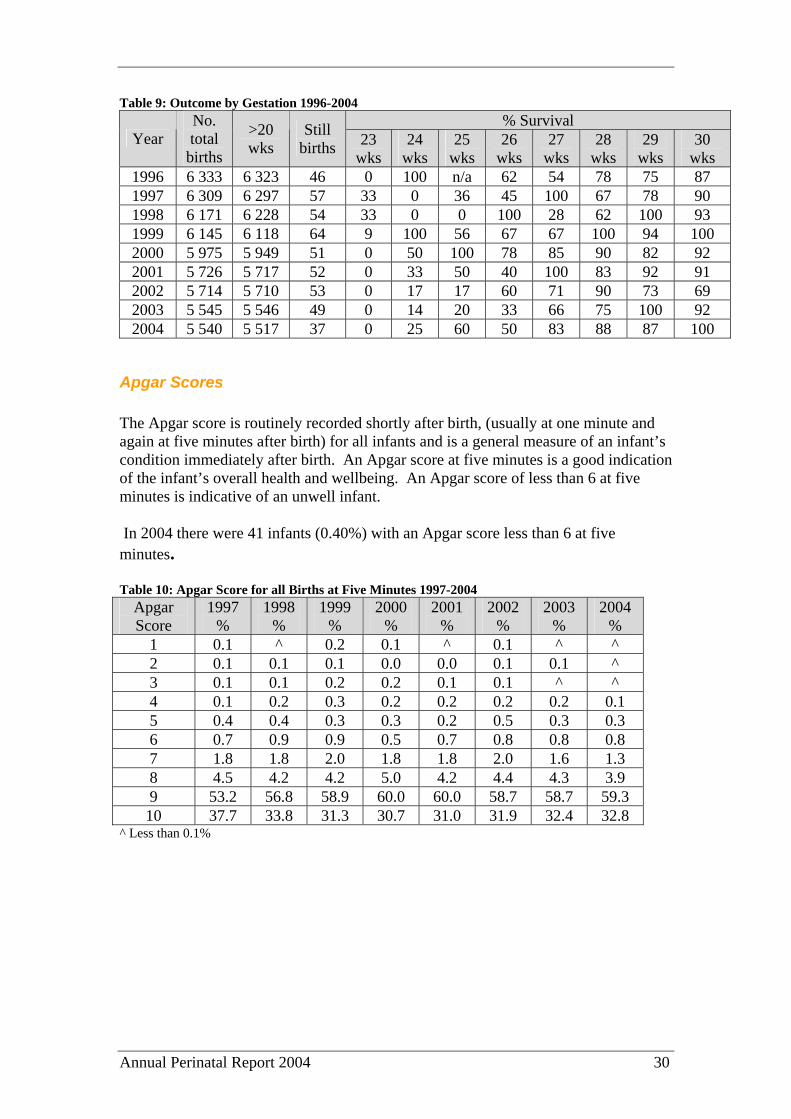
Table 9: Outcome by Gestation 1996-2004 % Survival
Year No. total
births
>20 wks
Still births 23
wks 24
wks 25
wks 26
wks 27
wks 28
wks 29
wks 30
wks 1996 6 333 6 323 46 0 100 n/a 62 54 78 75 87 1997 6 309 6 297 57 33 0 36 45 100 67 78 90 1998 6 171 6 228 54 33 0 0 100 28 62 100 93 1999 6 145 6 118 64 9 100 56 67 67 100 94 100 2000 5 975 5 949 51 0 50 100 78 85 90 82 92 2001 5 726 5 717 52 0 33 50 40 100 83 92 91 2002 5 714 5 710 53 0 17 17 60 71 90 73 69 2003 5 545 5 546 49 0 14 20 33 66 75 100 92 2004 5 540 5 517 37 0 25 60 50 83 88 87 100
Apgar Scores The Apgar score is routinely recorded shortly after birth, (usually at one minute and again at five minutes after birth) for all infants and is a general measure of an infant’s condition immediately after birth. An Apgar score at five minutes is a good indication of the infant’s overall health and wellbeing. An Apgar score of less than 6 at five minutes is indicative of an unwell infant. In 2004 there were 41 infants (0.40%) with an Apgar score less than 6 at five minutes. Table 10: Apgar Score for all Births at Five Minutes 1997-2004
Apgar Score
1997 %
1998 %
1999 %
2000 %
2001 %
2002 %
2003 %
2004 %
1 0.1 ^ 0.2 0.1 ^ 0.1 ^ ^ 2 0.1 0.1 0.1 0.0 0.0 0.1 0.1 ^ 3 0.1 0.1 0.2 0.2 0.1 0.1 ^ ^ 4 0.1 0.2 0.3 0.2 0.2 0.2 0.2 0.1 5 0.4 0.4 0.3 0.3 0.2 0.5 0.3 0.3 6 0.7 0.9 0.9 0.5 0.7 0.8 0.8 0.8 7 1.8 1.8 2.0 1.8 1.8 2.0 1.6 1.3 8 4.5 4.2 4.2 5.0 4.2 4.4 4.3 3.9 9 53.2 56.8 58.9 60.0 60.0 58.7 58.7 59.3 10 37.7 33.8 31.3 30.7 31.0 31.9 32.4 32.8
^ Less than 0.1%
Annual Perinatal Report 2004 31
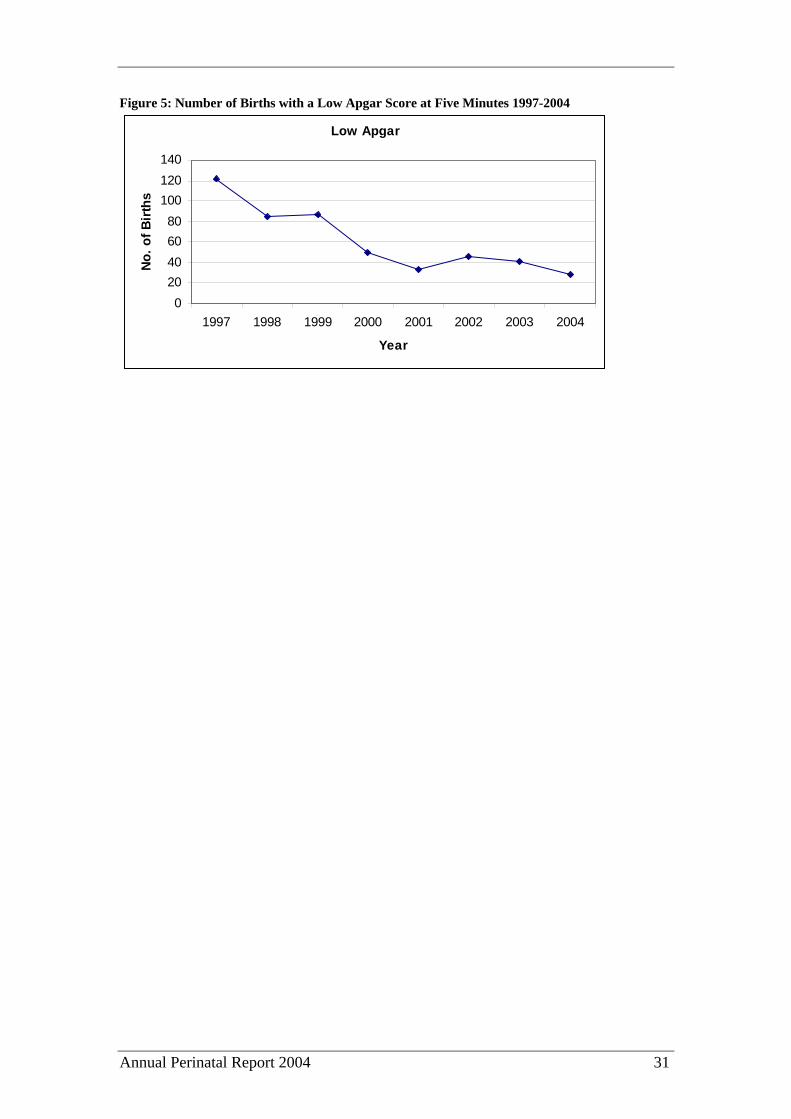
Figure 5: Number of Births with a Low Apgar Score at Five Minutes 1997-2004
Low Apgar
020406080
100120140
1997 1998 1999 2000 2001 2002 2003 2004
Year
No.
of B
irths
Annual Perinatal Report 2004 32
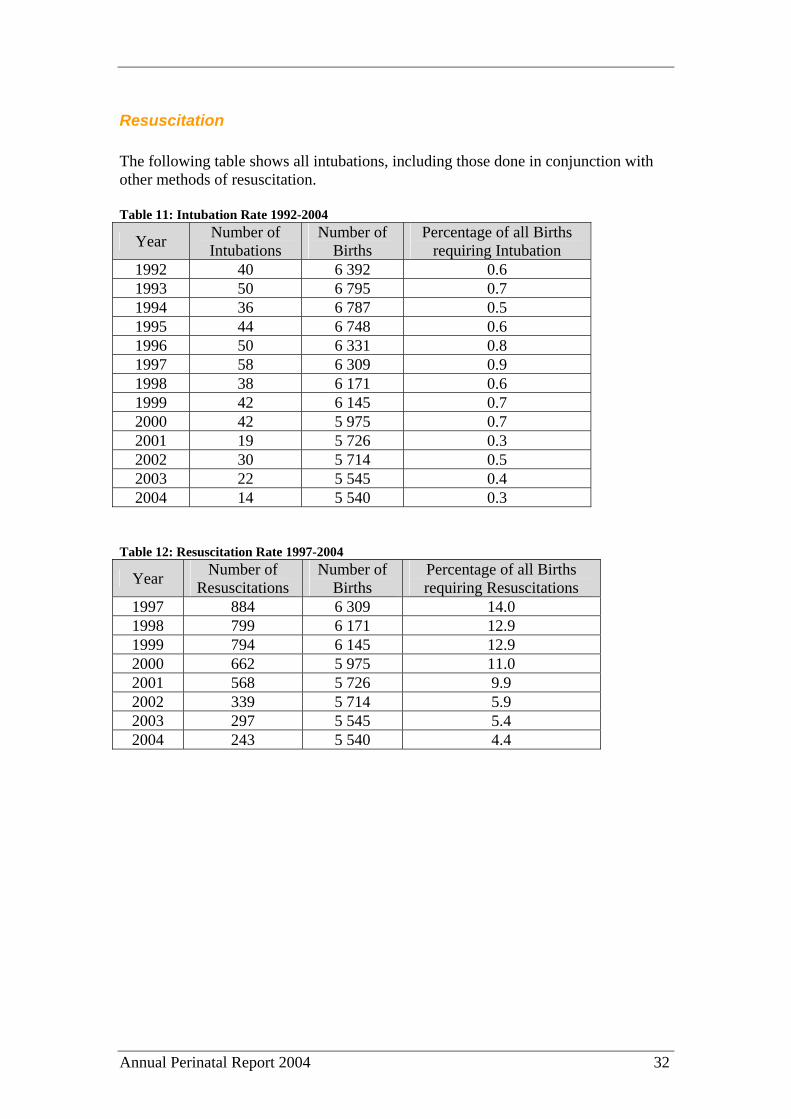
Resuscitation The following table shows all intubations, including those done in conjunction with other methods of resuscitation. Table 11: Intubation Rate 1992-2004
Year Number of Intubations
Number of Births
Percentage of all Births requiring Intubation
1992 40 6 392 0.6 1993 50 6 795 0.7 1994 36 6 787 0.5 1995 44 6 748 0.6 1996 50 6 331 0.8 1997 58 6 309 0.9 1998 38 6 171 0.6 1999 42 6 145 0.7 2000 42 5 975 0.7 2001 19 5 726 0.3 2002 30 5 714 0.5 2003 22 5 545 0.4 2004 14 5 540 0.3
Table 12: Resuscitation Rate 1997-2004
Year Number of Resuscitations
Number of Births
Percentage of all Births requiring Resuscitations
1997 884 6 309 14.0 1998 799 6 171 12.9 1999 794 6 145 12.9 2000 662 5 975 11.0 2001 568 5 726 9.9 2002 339 5 714 5.9 2003 297 5 545 5.4 2004 243 5 540 4.4
Annual Perinatal Report 2004 33
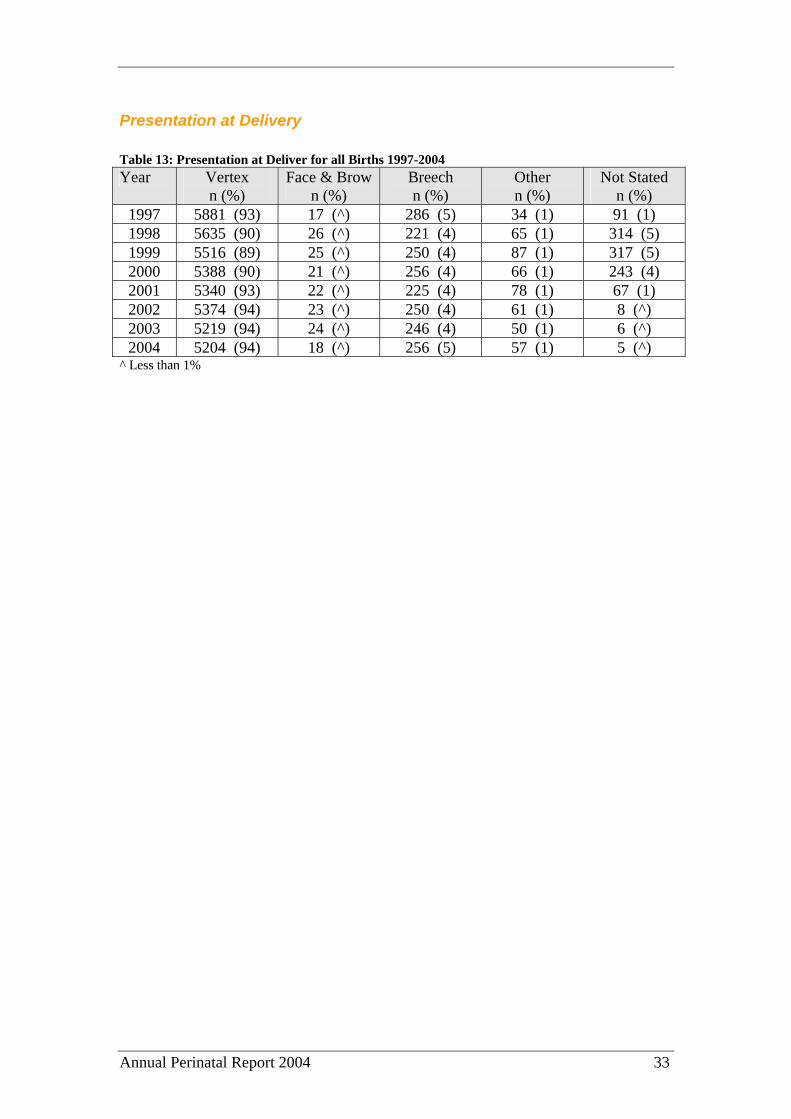
Presentation at Delivery Table 13: Presentation at Deliver for all Births 1997-2004 Year Vertex
n (%) Face & Brow
n (%) Breech n (%)
Other n (%)
Not Stated n (%)
1997 5881 (93) 17 (^) 286 (5) 34 (1) 91 (1) 1998 5635 (90) 26 (^) 221 (4) 65 (1) 314 (5) 1999 5516 (89) 25 (^) 250 (4) 87 (1) 317 (5) 2000 5388 (90) 21 (^) 256 (4) 66 (1) 243 (4) 2001 5340 (93) 22 (^) 225 (4) 78 (1) 67 (1) 2002 5374 (94) 23 (^) 250 (4) 61 (1) 8 (^) 2003 5219 (94) 24 (^) 246 (4) 50 (1) 6 (^) 2004 5204 (94) 18 (^) 256 (5) 57 (1) 5 (^)
^ Less than 1%
Annual Perinatal Report 2004 34
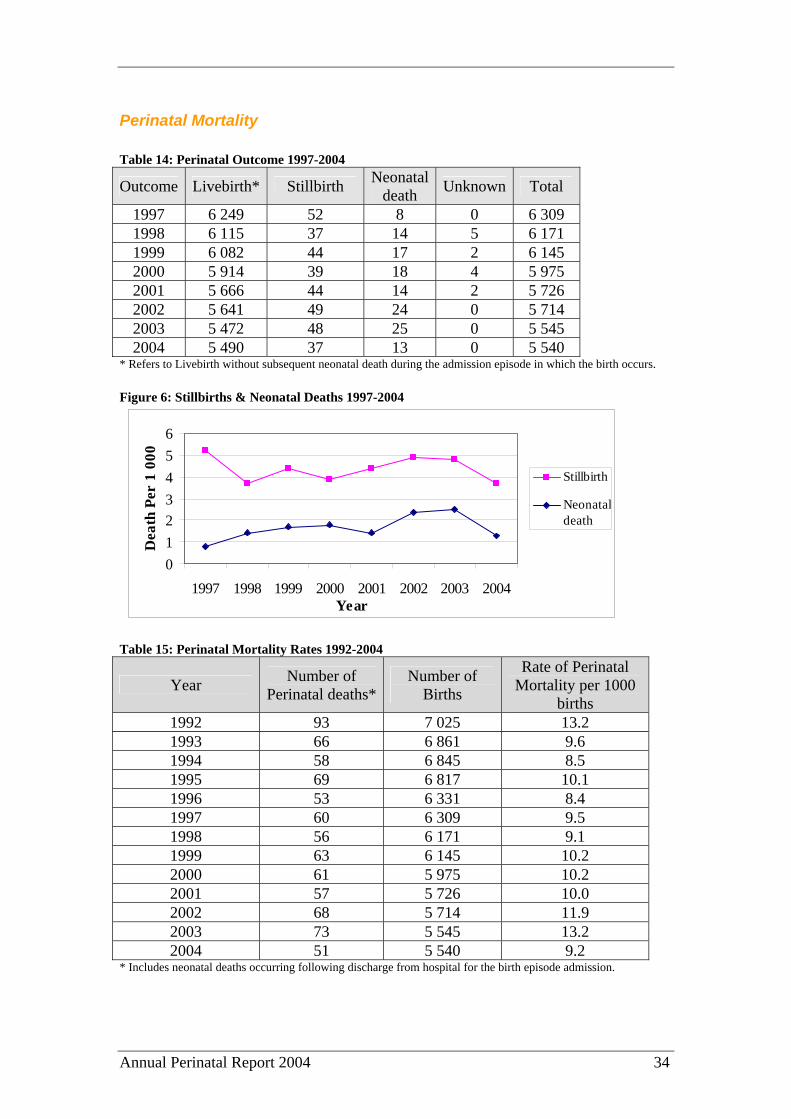
Perinatal Mortality Table 14: Perinatal Outcome 1997-2004
Outcome Livebirth* Stillbirth Neonatal death Unknown Total
1997 6 249 52 8 0 6 309 1998 6 115 37 14 5 6 171 1999 6 082 44 17 2 6 145 2000 5 914 39 18 4 5 975 2001 5 666 44 14 2 5 726 2002 5 641 49 24 0 5 714 2003 5 472 48 25 0 5 545 2004 5 490 37 13 0 5 540
* Refers to Livebirth without subsequent neonatal death during the admission episode in which the birth occurs. Figure 6: Stillbirths & Neonatal Deaths 1997-2004
0123456
1997 1998 1999 2000 2001 2002 2003 2004Year
Dea
th P
er 1
000
Stillbirth
Neonataldeath
Table 15: Perinatal Mortality Rates 1992-2004
Year Number of Perinatal deaths*
Number of Births
Rate of Perinatal Mortality per 1000
births 1992 93 7 025 13.2 1993 66 6 861 9.6 1994 58 6 845 8.5 1995 69 6 817 10.1 1996 53 6 331 8.4 1997 60 6 309 9.5 1998 56 6 171 9.1 1999 63 6 145 10.2 2000 61 5 975 10.2 2001 57 5 726 10.0 2002 68 5 714 11.9 2003 73 5 545 13.2 2004 51 5 540 9.2
* Includes neonatal deaths occurring following discharge from hospital for the birth episode admission.
Annual Perinatal Report 2004 35
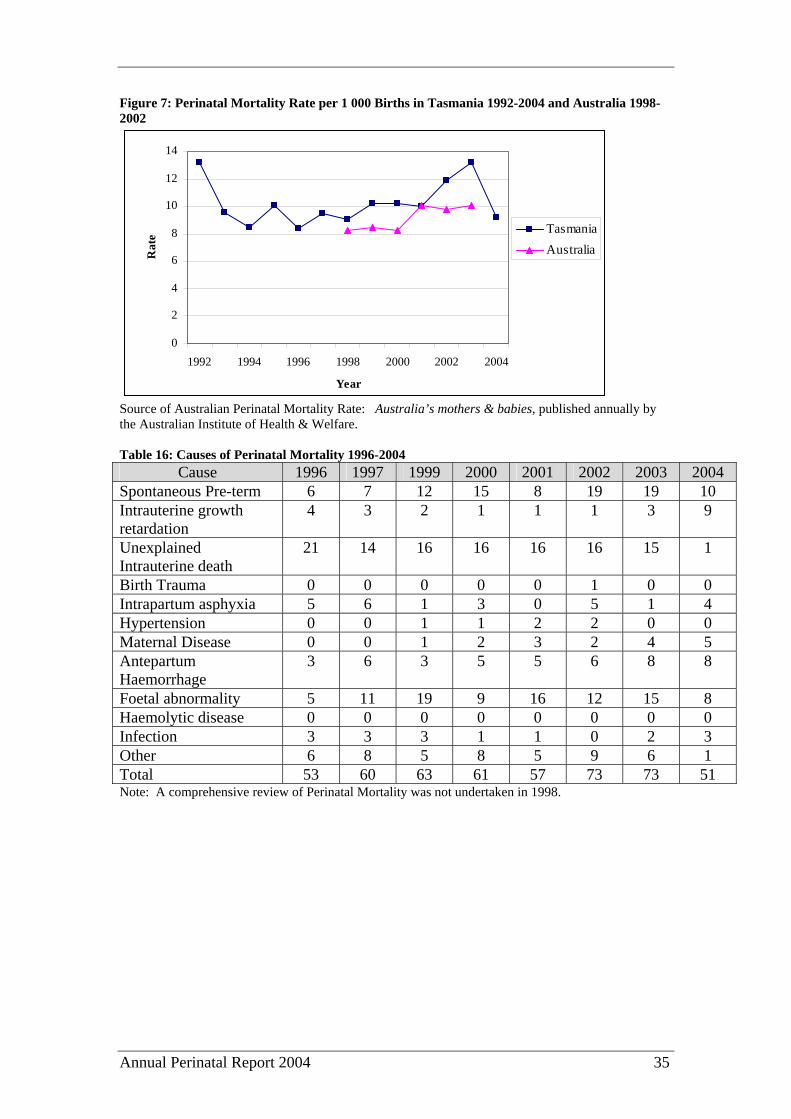
Figure 7: Perinatal Mortality Rate per 1 000 Births in Tasmania 1992-2004 and Australia 1998-2002
0
2
4
6
8
10
12
14
1992 1994 1996 1998 2000 2002 2004
Year
Rat
e TasmaniaAustralia
Source of Australian Perinatal Mortality Rate: Australia’s mothers & babies, published annually by the Australian Institute of Health & Welfare. Table 16: Causes of Perinatal Mortality 1996-2004
Cause 1996 1997 1999 2000 2001 2002 2003 2004 Spontaneous Pre-term 6 7 12 15 8 19 19 10 Intrauterine growth retardation
4 3 2 1 1 1 3 9
Unexplained Intrauterine death
21 14 16 16 16 16 15 1
Birth Trauma 0 0 0 0 0 1 0 0 Intrapartum asphyxia 5 6 1 3 0 5 1 4 Hypertension 0 0 1 1 2 2 0 0 Maternal Disease 0 0 1 2 3 2 4 5 Antepartum Haemorrhage
3 6 3 5 5 6 8 8
Foetal abnormality 5 11 19 9 16 12 15 8 Haemolytic disease 0 0 0 0 0 0 0 0 Infection 3 3 3 1 1 0 2 3 Other 6 8 5 8 5 9 6 1 Total 53 60 63 61 57 73 73 51 Note: A comprehensive review of Perinatal Mortality was not undertaken in 1998.
Annual Perinatal Report 2004 36
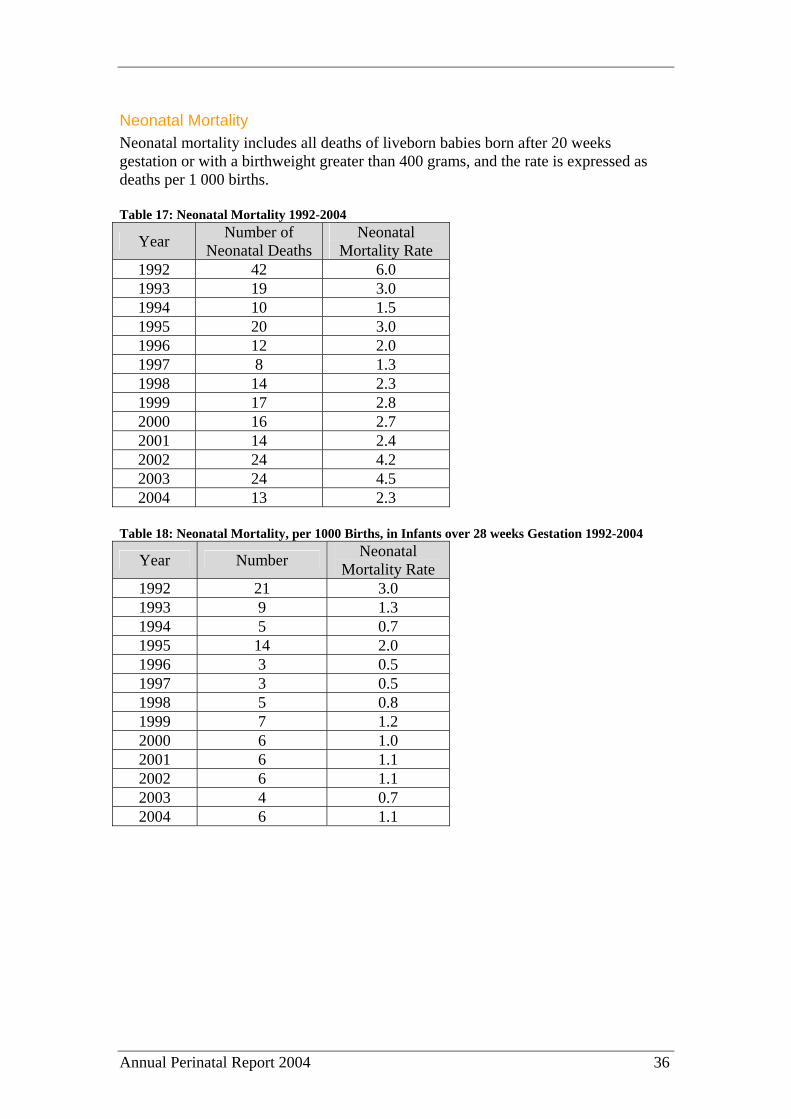
Neonatal Mortality Neonatal mortality includes all deaths of liveborn babies born after 20 weeks gestation or with a birthweight greater than 400 grams, and the rate is expressed as deaths per 1 000 births. Table 17: Neonatal Mortality 1992-2004
Year Number of Neonatal Deaths
Neonatal Mortality Rate
1992 42 6.0 1993 19 3.0 1994 10 1.5 1995 20 3.0 1996 12 2.0 1997 8 1.3 1998 14 2.3 1999 17 2.8 2000 16 2.7 2001 14 2.4 2002 24 4.2 2003 24 4.5 2004 13 2.3
Table 18: Neonatal Mortality, per 1000 Births, in Infants over 28 weeks Gestation 1992-2004
Year Number Neonatal Mortality Rate
1992 21 3.0 1993 9 1.3 1994 5 0.7 1995 14 2.0 1996 3 0.5 1997 3 0.5 1998 5 0.8 1999 7 1.2 2000 6 1.0 2001 6 1.1 2002 6 1.1 2003 4 0.7 2004 6 1.1
Annual Perinatal Report 2004 37
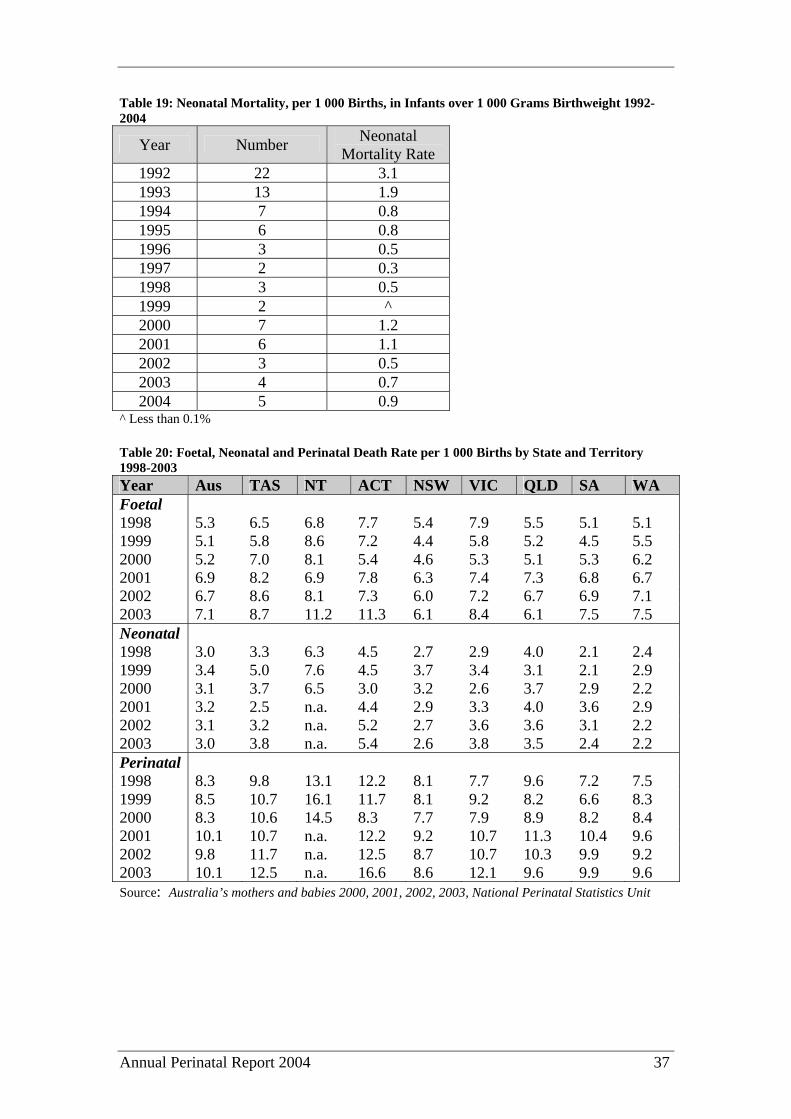
Table 19: Neonatal Mortality, per 1 000 Births, in Infants over 1 000 Grams Birthweight 1992-2004
Year Number Neonatal Mortality Rate
1992 22 3.1 1993 13 1.9 1994 7 0.8 1995 6 0.8 1996 3 0.5 1997 2 0.3 1998 3 0.5 1999 2 ^ 2000 7 1.2 2001 6 1.1 2002 3 0.5 2003 4 0.7 2004 5 0.9
^ Less than 0.1% Table 20: Foetal, Neonatal and Perinatal Death Rate per 1 000 Births by State and Territory 1998-2003 Year Aus TAS NT ACT NSW VIC QLD SA WA Foetal 1998 5.3 6.5 6.8 7.7 5.4 7.9 5.5 5.1 5.1 1999 5.1 5.8 8.6 7.2 4.4 5.8 5.2 4.5 5.5 2000 5.2 7.0 8.1 5.4 4.6 5.3 5.1 5.3 6.2 2001 6.9 8.2 6.9 7.8 6.3 7.4 7.3 6.8 6.7 2002 6.7 8.6 8.1 7.3 6.0 7.2 6.7 6.9 7.1 2003 7.1 8.7 11.2 11.3 6.1 8.4 6.1 7.5 7.5 Neonatal 1998 3.0 3.3 6.3 4.5 2.7 2.9 4.0 2.1 2.4 1999 3.4 5.0 7.6 4.5 3.7 3.4 3.1 2.1 2.9 2000 3.1 3.7 6.5 3.0 3.2 2.6 3.7 2.9 2.2 2001 3.2 2.5 n.a. 4.4 2.9 3.3 4.0 3.6 2.9 2002 3.1 3.2 n.a. 5.2 2.7 3.6 3.6 3.1 2.2 2003 3.0 3.8 n.a. 5.4 2.6 3.8 3.5 2.4 2.2 Perinatal 1998 8.3 9.8 13.1 12.2 8.1 7.7 9.6 7.2 7.5 1999 8.5 10.7 16.1 11.7 8.1 9.2 8.2 6.6 8.3 2000 8.3 10.6 14.5 8.3 7.7 7.9 8.9 8.2 8.4 2001 10.1 10.7 n.a. 12.2 9.2 10.7 11.3 10.4 9.6 2002 9.8 11.7 n.a. 12.5 8.7 10.7 10.3 9.9 9.2 2003 10.1 12.5 n.a. 16.6 8.6 12.1 9.6 9.9 9.6 Source: Australia’s mothers and babies 2000, 2001, 2002, 2003, National Perinatal Statistics Unit

Annual Perinatal Report 2004 38
Autopsy Rates Despite repeated recommendation from the Council of Obstetric & Paediatric Mortality & Morbidity on the value of autopsy as an investigation tool in cases of perinatal death, especially in cases of unexplained intrauterine death, the rate of autopsy remains low. Table 21: Rate of Autopsies on Perinatal Deaths 1992-2004
Year Autopsy Rate % 1992 43.0 1993 47.0 1994 48.0 1995 47.5 1996 66.0 1997 35.0 1998 Unknown 1999 37.0 2000 46.0 2001 23.0 2002 7.4 2003 7.8 2004 2.0
The Perinatal autopsy rate in Tasmania in 2004 (2.0%) is well below the stillbirth autopsy rate in South Australia, Victoria and Queensland with rates of 61.2%, 35.1% and 24.3% respectively.
Annual Perinatal Report 2004 39
Mothers
Age of Mothers Table 22: Age of Mothers 1992-2004
Year Under 20 years of age %
20 – 24 years of age %
25 – 29 years of age %
30 – 34 years of age %
35 – 39 years of age %
Over 40 years of age %
1992 7 23 35 26 8 1 1993 7 23 35 26 8 1 1994 7 23 33 26 9 1 1995 7 22 33 27 9 1 1996 8 22 33 27 9 1 1997 8 21 34 26 10 1 1998 8 20 33 26 11 2 1999 8 20 32 27 11 2 2000 8 21 30 27 11 2 2001 8 19 30 28 12 2 2002 8 21 29 28 12 3 2003 8 19 28 31 13 2 2004 7 19 28 29 13 2
Figure 8: Proportion of Births by Maternal Age Groups 1992-2004
0
5
10
15
20
25
30
35
40
1992 1995 1998 2001 2004
Age Group
Prop
ortio
n of
Bir
ths
< 2020 – 2425 – 29 30 – 34 35 – 39 40 +

Annual Perinatal Report 2004 40
Figure 9: Maternal Age in Tasmania 2004 and Australia 2003
0
5
10
15
20
25
30
35
40
< 20 20 – 24 25 – 29 30 – 34 35 – 39 40 +
Age Group
Prop
ortio
n of
Mot
hers
Tasmania 2004Australian 2003
Annual Perinatal Report 2004 41
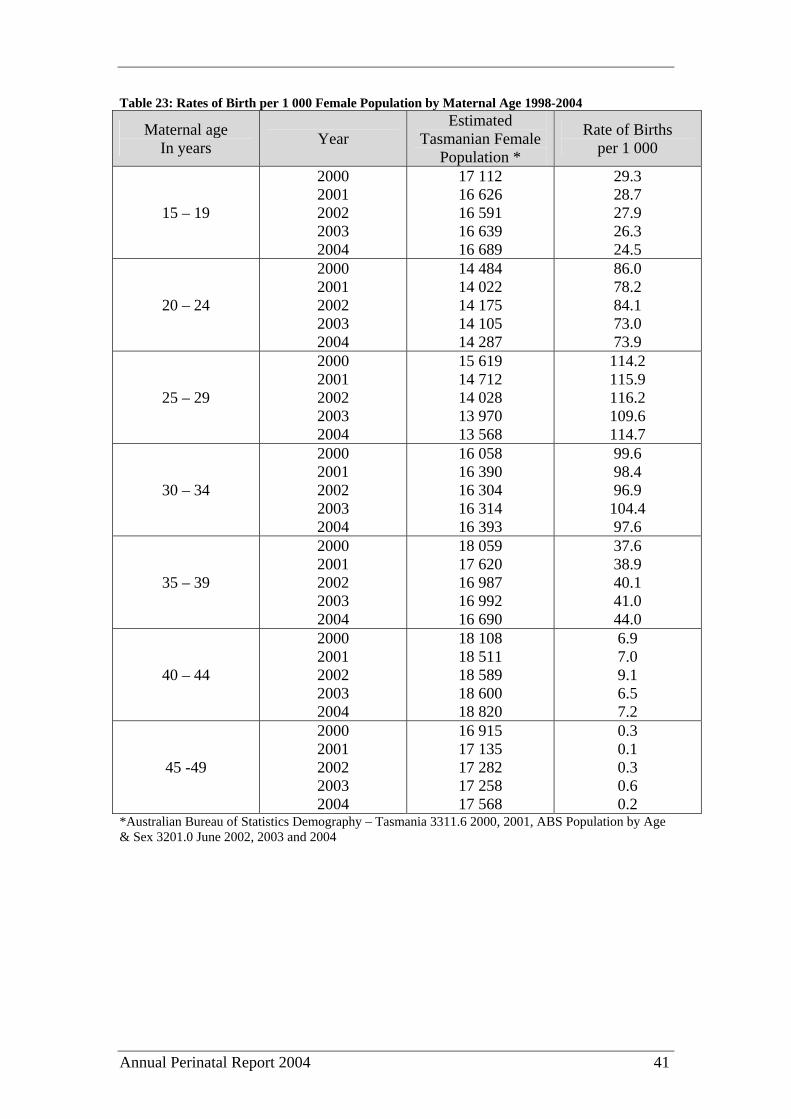
Table 23: Rates of Birth per 1 000 Female Population by Maternal Age 1998-2004
Maternal age In years Year
Estimated Tasmanian Female
Population *
Rate of Births per 1 000
15 – 19
2000 2001 2002 2003 2004
17 112 16 626 16 591 16 639 16 689
29.3 28.7 27.9 26.3 24.5
20 – 24
2000 2001 2002 2003 2004
14 484 14 022 14 175 14 105 14 287
86.0 78.2 84.1 73.0 73.9
25 – 29
2000 2001 2002 2003 2004
15 619 14 712 14 028 13 970 13 568
114.2 115.9 116.2 109.6 114.7
30 – 34
2000 2001 2002 2003 2004
16 058 16 390 16 304 16 314 16 393
99.6 98.4 96.9 104.4 97.6
35 – 39
2000 2001 2002 2003 2004
18 059 17 620 16 987 16 992 16 690
37.6 38.9 40.1 41.0 44.0
40 – 44
2000 2001 2002 2003 2004
18 108 18 511 18 589 18 600 18 820
6.9 7.0 9.1 6.5 7.2
45 -49
2000 2001 2002 2003 2004
16 915 17 135 17 282 17 258 17 568
0.3 0.1 0.3 0.6 0.2
*Australian Bureau of Statistics Demography – Tasmania 3311.6 2000, 2001, ABS Population by Age & Sex 3201.0 June 2002, 2003 and 2004
Annual Perinatal Report 2004 42
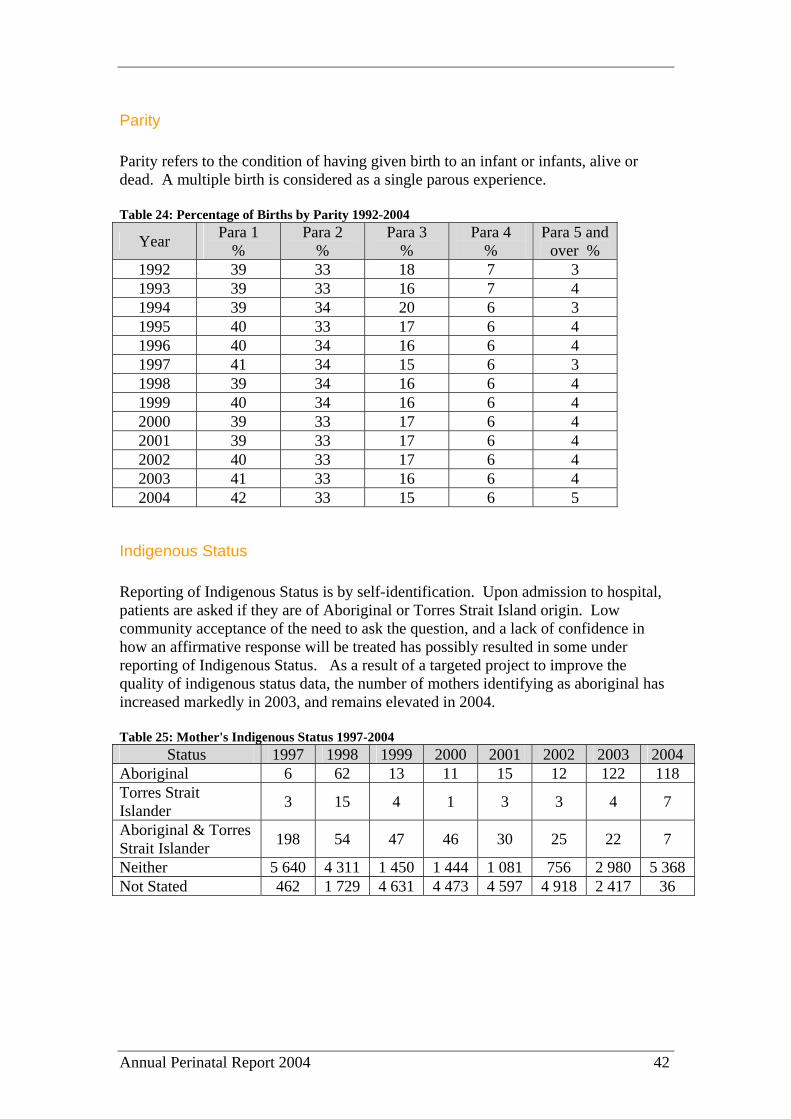
Parity Parity refers to the condition of having given birth to an infant or infants, alive or dead. A multiple birth is considered as a single parous experience. Table 24: Percentage of Births by Parity 1992-2004
Year Para 1 %
Para 2 %
Para 3 %
Para 4 %
Para 5 and over %
1992 39 33 18 7 3 1993 39 33 16 7 4 1994 39 34 20 6 3 1995 40 33 17 6 4 1996 40 34 16 6 4 1997 41 34 15 6 3 1998 39 34 16 6 4 1999 40 34 16 6 4 2000 39 33 17 6 4 2001 39 33 17 6 4 2002 40 33 17 6 4 2003 41 33 16 6 4 2004 42 33 15 6 5
Indigenous Status Reporting of Indigenous Status is by self-identification. Upon admission to hospital, patients are asked if they are of Aboriginal or Torres Strait Island origin. Low community acceptance of the need to ask the question, and a lack of confidence in how an affirmative response will be treated has possibly resulted in some under reporting of Indigenous Status. As a result of a targeted project to improve the quality of indigenous status data, the number of mothers identifying as aboriginal has increased markedly in 2003, and remains elevated in 2004. Table 25: Mother's Indigenous Status 1997-2004
Status 1997 1998 1999 2000 2001 2002 2003 2004 Aboriginal 6 62 13 11 15 12 122 118 Torres Strait Islander 3 15 4 1 3 3 4 7
Aboriginal & Torres Strait Islander 198 54 47 46 30 25 22 7
Neither 5 640 4 311 1 450 1 444 1 081 756 2 980 5 368 Not Stated 462 1 729 4 631 4 473 4 597 4 918 2 417 36
Annual Perinatal Report 2004 43
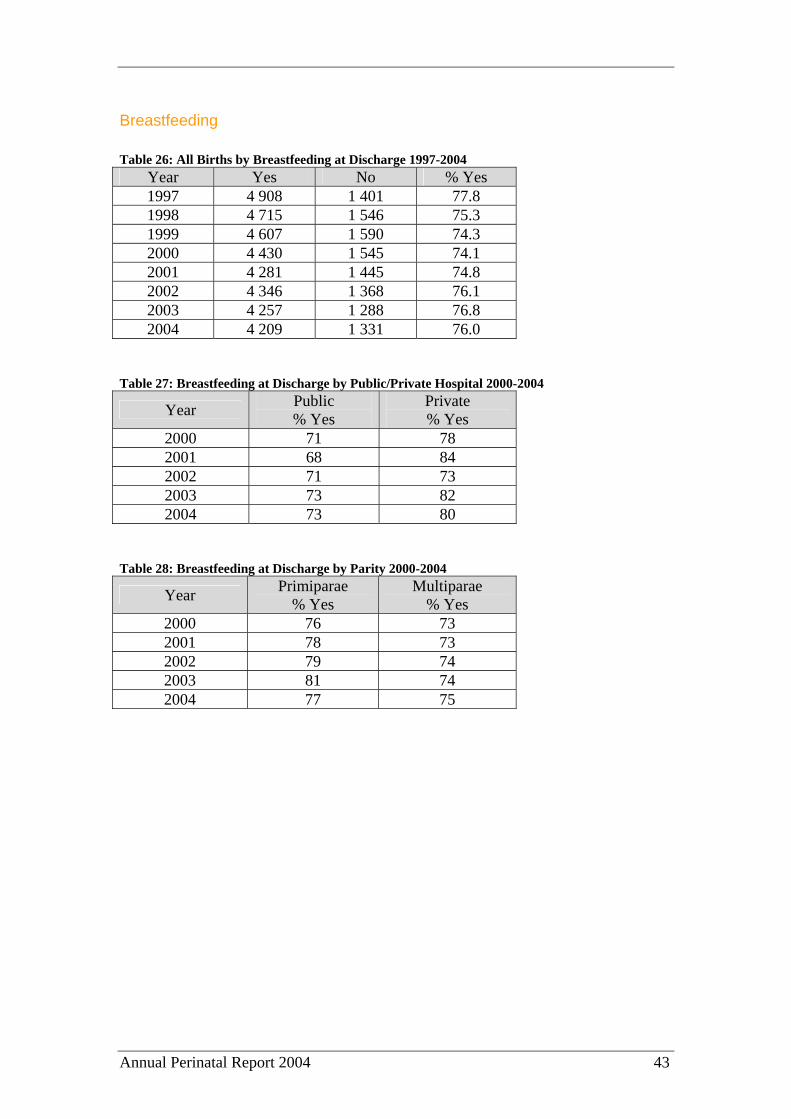
Breastfeeding Table 26: All Births by Breastfeeding at Discharge 1997-2004
Year Yes No % Yes 1997 4 908 1 401 77.8 1998 4 715 1 546 75.3 1999 4 607 1 590 74.3 2000 4 430 1 545 74.1 2001 4 281 1 445 74.8 2002 4 346 1 368 76.1 2003 4 257 1 288 76.8 2004 4 209 1 331 76.0
Table 27: Breastfeeding at Discharge by Public/Private Hospital 2000-2004
Year Public % Yes
Private % Yes
2000 71 78 2001 68 84 2002 71 73 2003 73 82 2004 73 80
Table 28: Breastfeeding at Discharge by Parity 2000-2004
Year Primiparae % Yes
Multiparae % Yes
2000 76 73 2001 78 73 2002 79 74 2003 81 74 2004 77 75

Annual Perinatal Report 2004 44
Mode of Delivery Table 29: Mode of Delivery 1992-2004
Year Vaginal Delivery Number
Vaginal Delivery %
Caesarean Sections Number
Caesarean Sections %
1992 5 881 84 1 144 16 1993 5 704 83 1 157 17 1994 5 688 83 1 157 17 1995 5 504 81 1 313 19 1996 5 140 81 1 191 19 1997 5 046 80 1 263 20 1998 4 856 78 1 315 22 1999 4 838 79 1 252 20 2000 4 640 78 1 324 22 2001 4 380 77 1 334 23 2002 4 465 78 1 246 22 2003 4 092 74 1 451 26 2004 4 030 73 1 510 27
Figure 10: Mode of Delivery in Tasmania 2004 and Australia 2003
0
10
20
30
40
50
60
70
80
Vaginal Delivery Caesarean Sections
Mode of Delivery
Perc
enta
ge o
f Del
iver
ies
Tasmania 2004Australia 2003
Table 30: Mode of Delivery for Vaginal Births 2000-2004
2000 2001 2002 2003 2004 No. % No. % No. % No. % No. %
Unassisted Vaginal 4 041 87 3 789 86 3 498 85 3 823 86 3 415 84 Forceps 277 6 249 6 155 4 234 5 166 4 Forceps Rotation 35 1 16 ^ 10 ^ 17 ^ 10 0.2 Vacuum Extraction 252 5 306 7 408 10 331 7 406 10 Vaginal Breech 35 1 20 ^ 21 1 35 1 27 0.6 Total 4 640 4 380 4 092 4 465 4 028 ^ Less than 0.1% The rate of vaginal deliveries continues to decline slightly. However, nationally for 2003 the caesarean section rate was 28.5%, well below the rate in Tasmania. Of the vaginal deliveries nationally in 2003, 60.3% were spontaneous, 3.9% forceps deliveries. 6.8% vacuum extraction and 0.4% vaginal breech.
Annual Perinatal Report 2004 45
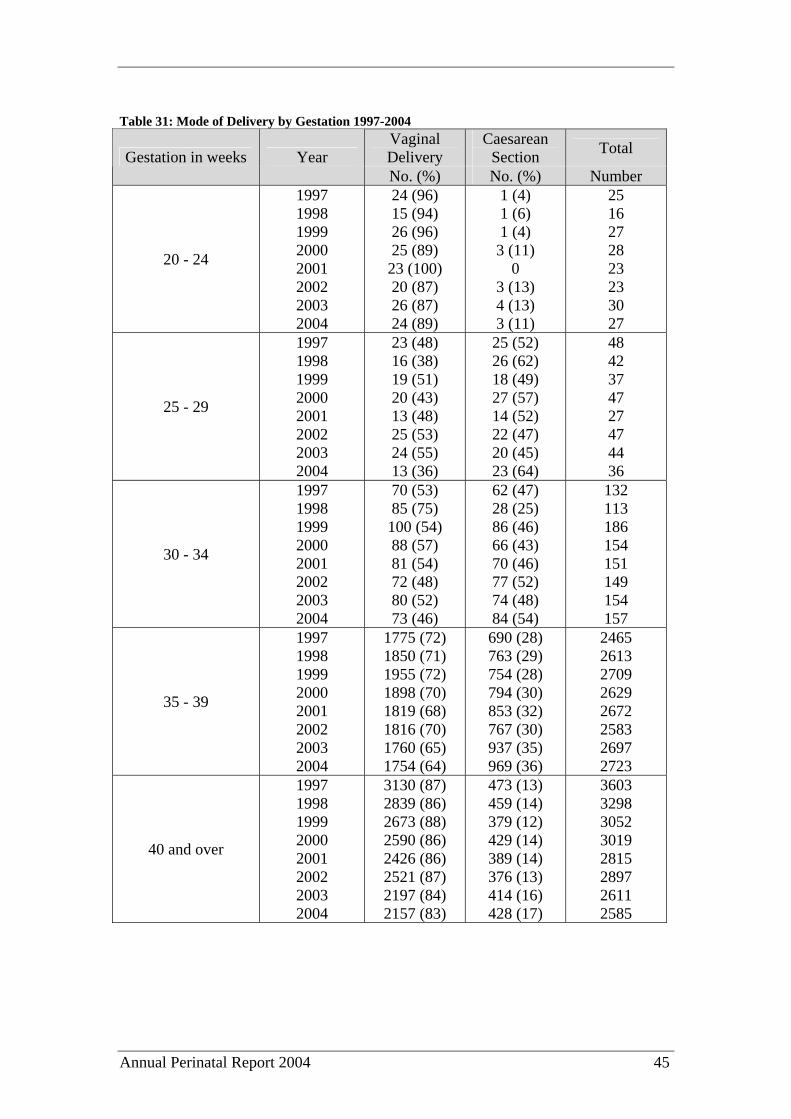
Table 31: Mode of Delivery by Gestation 1997-2004
Vaginal Delivery
Caesarean Section Total Gestation in weeks Year
No. (%) No. (%) Number
20 - 24
1997 1998 1999 2000 2001 2002 2003 2004
24 (96) 15 (94) 26 (96) 25 (89) 23 (100) 20 (87) 26 (87) 24 (89)
1 (4) 1 (6) 1 (4) 3 (11)
0 3 (13) 4 (13) 3 (11)
25 16 27 28 23 23 30 27
25 - 29
1997 1998 1999 2000 2001 2002 2003 2004
23 (48) 16 (38) 19 (51) 20 (43) 13 (48) 25 (53) 24 (55) 13 (36)
25 (52) 26 (62) 18 (49) 27 (57) 14 (52) 22 (47) 20 (45) 23 (64)
48 42 37 47 27 47 44 36
30 - 34
1997 1998 1999 2000 2001 2002 2003 2004
70 (53) 85 (75) 100 (54) 88 (57) 81 (54) 72 (48) 80 (52) 73 (46)
62 (47) 28 (25) 86 (46) 66 (43) 70 (46) 77 (52) 74 (48) 84 (54)
132 113 186 154 151 149 154 157
35 - 39
1997 1998 1999 2000 2001 2002 2003 2004
1775 (72) 1850 (71) 1955 (72) 1898 (70) 1819 (68) 1816 (70) 1760 (65) 1754 (64)
690 (28) 763 (29) 754 (28) 794 (30) 853 (32) 767 (30) 937 (35) 969 (36)
2465 2613 2709 2629 2672 2583 2697 2723
40 and over
1997 1998 1999 2000 2001 2002 2003 2004
3130 (87) 2839 (86) 2673 (88) 2590 (86) 2426 (86) 2521 (87) 2197 (84) 2157 (83)
473 (13) 459 (14) 379 (12) 429 (14) 389 (14) 376 (13) 414 (16) 428 (17)
3603 3298 3052 3019 2815 2897 2611 2585
Annual Perinatal Report 2004 46
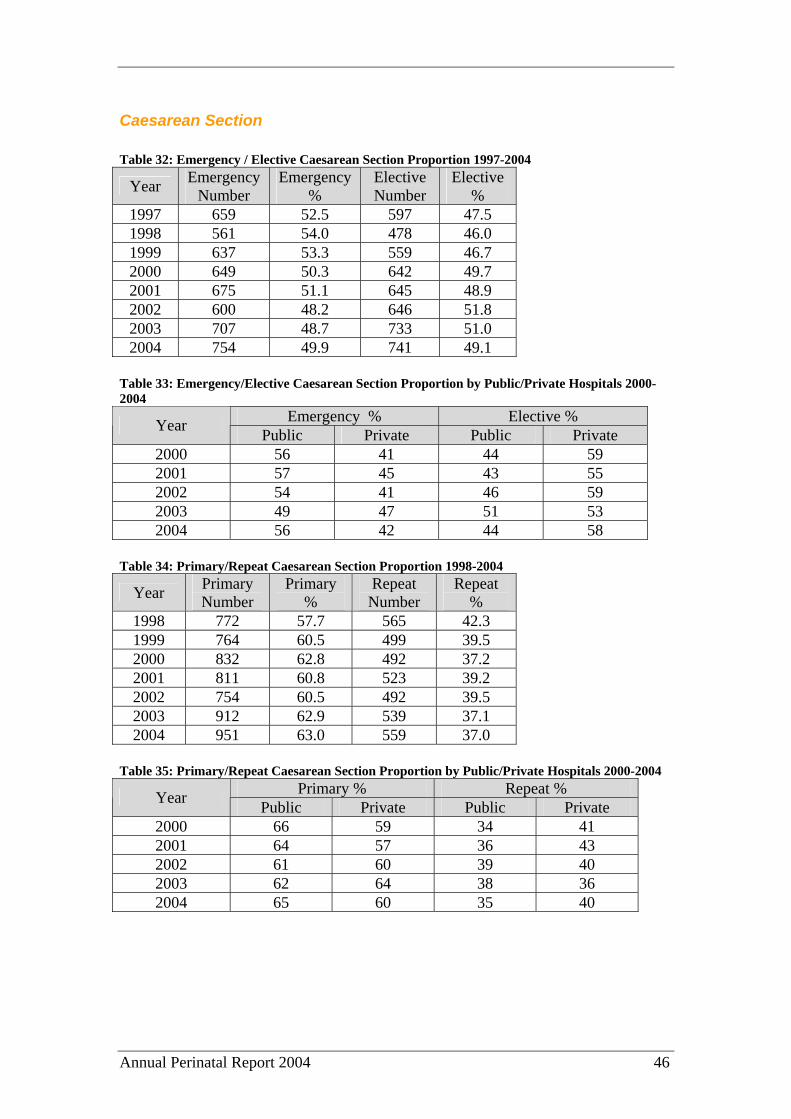
Caesarean Section Table 32: Emergency / Elective Caesarean Section Proportion 1997-2004
Year Emergency Number
Emergency %
Elective Number
Elective %
1997 659 52.5 597 47.5 1998 561 54.0 478 46.0 1999 637 53.3 559 46.7 2000 649 50.3 642 49.7 2001 675 51.1 645 48.9 2002 600 48.2 646 51.8 2003 707 48.7 733 51.0 2004 754 49.9 741 49.1
Table 33: Emergency/Elective Caesarean Section Proportion by Public/Private Hospitals 2000-2004
Emergency % Elective % Year Public Private Public Private 2000 56 41 44 59 2001 57 45 43 55 2002 54 41 46 59 2003 49 47 51 53 2004 56 42 44 58
Table 34: Primary/Repeat Caesarean Section Proportion 1998-2004
Year Primary Number
Primary %
Repeat Number
Repeat %
1998 772 57.7 565 42.3 1999 764 60.5 499 39.5 2000 832 62.8 492 37.2 2001 811 60.8 523 39.2 2002 754 60.5 492 39.5 2003 912 62.9 539 37.1 2004 951 63.0 559 37.0
Table 35: Primary/Repeat Caesarean Section Proportion by Public/Private Hospitals 2000-2004
Primary % Repeat % Year Public Private Public Private 2000 66 59 34 41 2001 64 57 36 43 2002 61 60 39 40 2003 62 64 38 36 2004 65 60 35 40
Annual Perinatal Report 2004 47
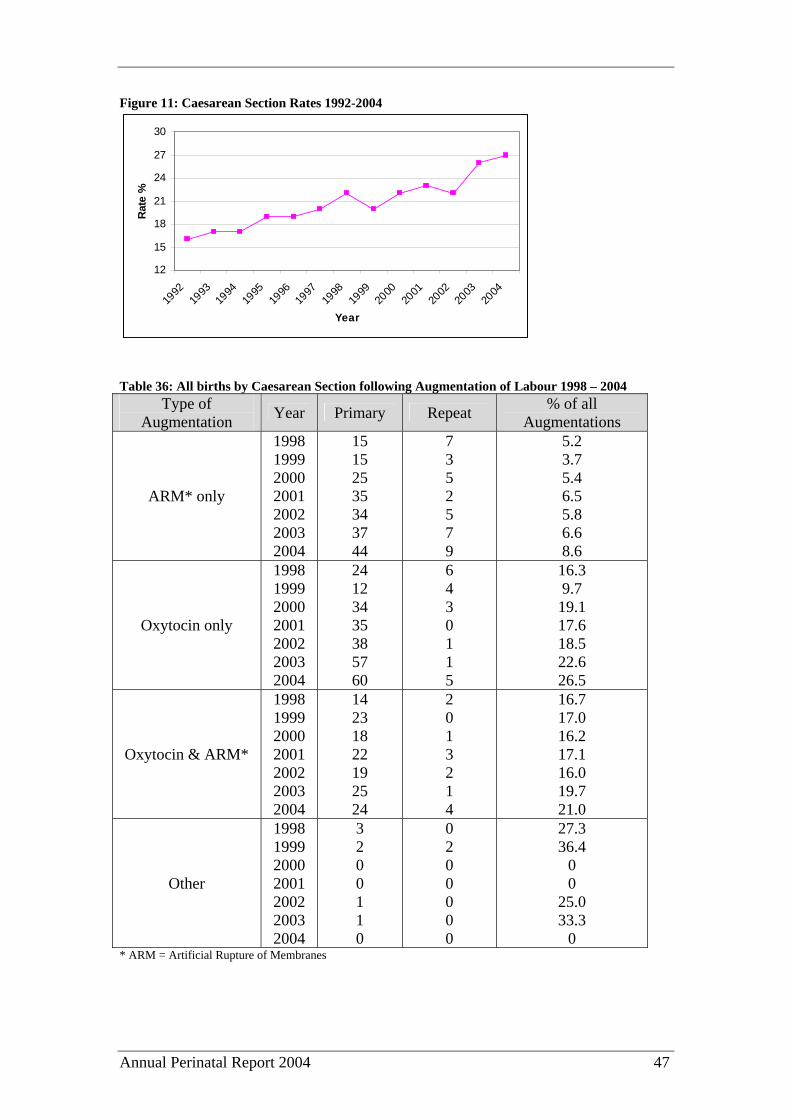
Figure 11: Caesarean Section Rates 1992-2004
12
15
18
21
24
27
30
1992
1993
1994
1995
1996
1997
1998
1999
2000
2001
2002
2003
2004
Year
Rat
e %
Table 36: All births by Caesarean Section following Augmentation of Labour 1998 – 2004
Type of Augmentation Year Primary Repeat % of all
Augmentations
ARM* only
1998 1999 2000 2001 2002 2003 2004
15 15 25 35 34 37 44
7 3 5 2 5 7 9
5.2 3.7 5.4 6.5 5.8 6.6 8.6
Oxytocin only
1998 1999 2000 2001 2002 2003 2004
24 12 34 35 38 57 60
6 4 3 0 1 1 5
16.3 9.7 19.1 17.6 18.5 22.6 26.5
Oxytocin & ARM*
1998 1999 2000 2001 2002 2003 2004
14 23 18 22 19 25 24
2 0 1 3 2 1 4
16.7 17.0 16.2 17.1 16.0 19.7 21.0
Other
1998 1999 2000 2001 2002 2003 2004
3 2 0 0 1 1 0
0 2 0 0 0 0 0
27.3 36.4
0 0
25.0 33.3
0 * ARM = Artificial Rupture of Membranes
Annual Perinatal Report 2004 48
Induction and Augmentation
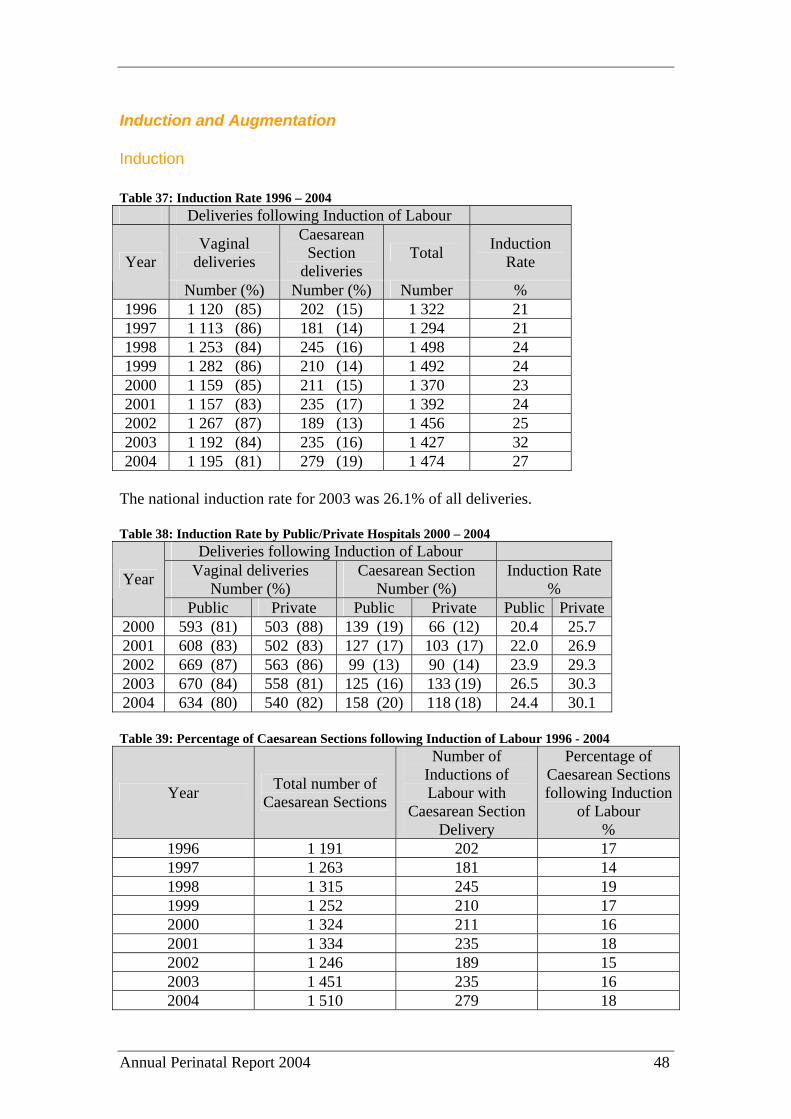
Induction Table 37: Induction Rate 1996 – 2004
Deliveries following Induction of Labour
Vaginal deliveries
Caesarean Section
deliveries Total Induction
Rate Year
Number (%) Number (%) Number % 1996 1 120 (85) 202 (15) 1 322 21 1997 1 113 (86) 181 (14) 1 294 21 1998 1 253 (84) 245 (16) 1 498 24 1999 1 282 (86) 210 (14) 1 492 24 2000 1 159 (85) 211 (15) 1 370 23 2001 1 157 (83) 235 (17) 1 392 24 2002 1 267 (87) 189 (13) 1 456 25 2003 1 192 (84) 235 (16) 1 427 32 2004 1 195 (81) 279 (19) 1 474 27
The national induction rate for 2003 was 26.1% of all deliveries. Table 38: Induction Rate by Public/Private Hospitals 2000 – 2004
Deliveries following Induction of Labour Vaginal deliveries
Number (%) Caesarean Section
Number (%) Induction Rate
% Year
Public Private Public Private Public Private 2000 593 (81) 503 (88) 139 (19) 66 (12) 20.4 25.7 2001 608 (83) 502 (83) 127 (17) 103 (17) 22.0 26.9 2002 669 (87) 563 (86) 99 (13) 90 (14) 23.9 29.3 2003 670 (84) 558 (81) 125 (16) 133 (19) 26.5 30.3 2004 634 (80) 540 (82) 158 (20) 118 (18) 24.4 30.1 Table 39: Percentage of Caesarean Sections following Induction of Labour 1996 - 2004
Year Total number of Caesarean Sections
Number of Inductions of Labour with
Caesarean Section Delivery
Percentage of Caesarean Sections following Induction
of Labour %
1996 1 191 202 17 1997 1 263 181 14 1998 1 315 245 19 1999 1 252 210 17 2000 1 324 211 16 2001 1 334 235 18 2002 1 246 189 15 2003 1 451 235 16 2004 1 510 279 18
Annual Perinatal Report 2004 49
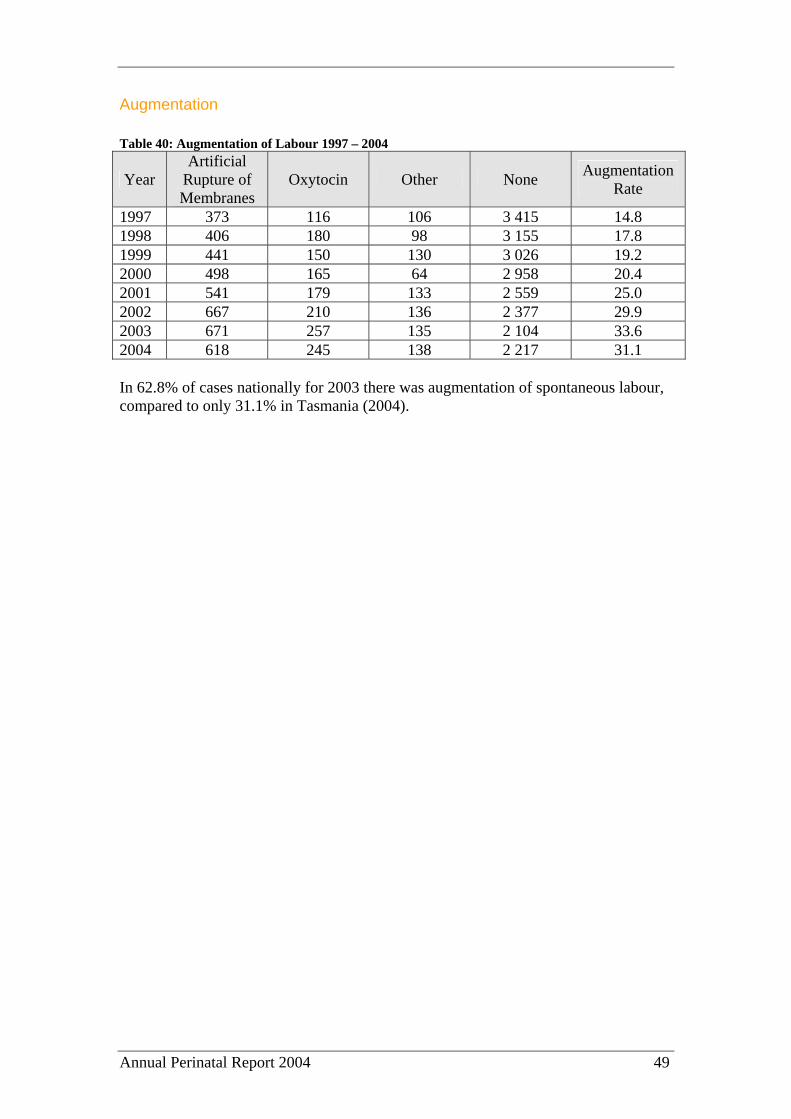
Augmentation Table 40: Augmentation of Labour 1997 – 2004
Year Artificial
Rupture of Membranes
Oxytocin Other None Augmentation Rate
1997 373 116 106 3 415 14.8 1998 406 180 98 3 155 17.8 1999 441 150 130 3 026 19.2 2000 498 165 64 2 958 20.4 2001 541 179 133 2 559 25.0 2002 667 210 136 2 377 29.9 2003 671 257 135 2 104 33.6 2004 618 245 138 2 217 31.1 In 62.8% of cases nationally for 2003 there was augmentation of spontaneous labour, compared to only 31.1% in Tasmania (2004).

Annual Perinatal Report 2004 50
Multiple Pregnancy Table 41: All Births by Multiple Pregnancies 1997 - 2004
Year Number of infants born from a Twin
pregnancy
Number of infants born from a Multiple* pregnancy
1997 152 0 1998 185 3 1999 162 3 2000 180 3 2001 180 3 2002 164 3 2003 184 3 2004 197 9
*Multiple equal 3 babies or more. Please note that infants who do not survive beyond 20 weeks of gestation, or who do not weigh more than 400 grams are not recorded as a birth, hence some odd numbers in the figures above. The proportion of multiple births in Tasmania is higher than the national average. Nationally 1.7% of births are from a multiple pregnancy (2003) compared to 3.7% in Tasmania (2004). Table 42: Perinatal Mortality in Multiple Pregnancies 1997 – 2004
Twin Deaths Triplet Deaths Year No. % No. % 1997 5 3.3 0 0 1998 7 3.8 0 0 1999 6 3.7 0 0 2000 10 5.5 1 33.3 2001 4 2.2 0 0 2002 9 5.5 0* 0 2003 9 4.9 0 0 2004 6 2.9 2 18
* One triplet died aged 51 days from complications associated with prematurity and has, therefore, been included in the paediatric mortality statistics. However, this death could equally be considered a prolonged neonatal death.
Annual Perinatal Report 2004 51
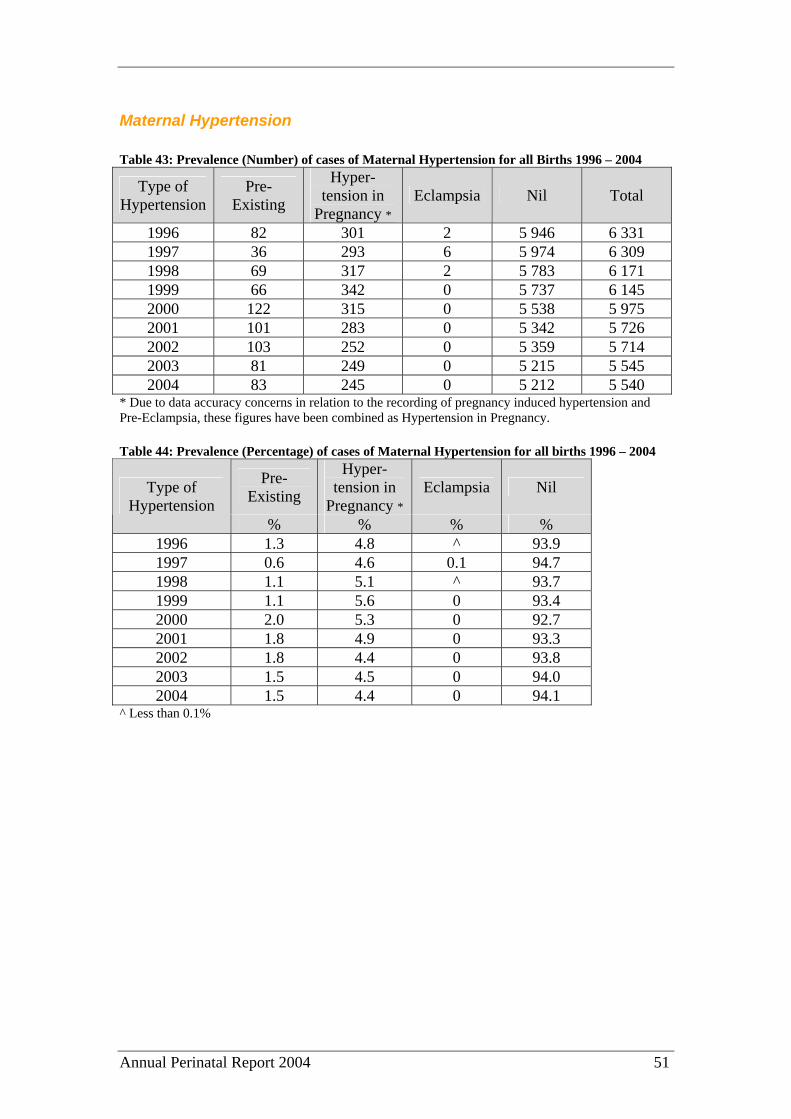
Maternal Hypertension Table 43: Prevalence (Number) of cases of Maternal Hypertension for all Births 1996 – 2004
Type of Hypertension
Pre-Existing
Hyper- tension in
Pregnancy * Eclampsia Nil Total
1996 82 301 2 5 946 6 331 1997 36 293 6 5 974 6 309 1998 69 317 2 5 783 6 171 1999 66 342 0 5 737 6 145 2000 122 315 0 5 538 5 975 2001 101 283 0 5 342 5 726 2002 103 252 0 5 359 5 714 2003 81 249 0 5 215 5 545 2004 83 245 0 5 212 5 540
* Due to data accuracy concerns in relation to the recording of pregnancy induced hypertension and Pre-Eclampsia, these figures have been combined as Hypertension in Pregnancy. Table 44: Prevalence (Percentage) of cases of Maternal Hypertension for all births 1996 – 2004
Pre-Existing
Hyper- tension in
Pregnancy * Eclampsia Nil Type of
Hypertension % % % %
1996 1.3 4.8 ^ 93.9 1997 0.6 4.6 0.1 94.7 1998 1.1 5.1 ^ 93.7 1999 1.1 5.6 0 93.4 2000 2.0 5.3 0 92.7 2001 1.8 4.9 0 93.3 2002 1.8 4.4 0 93.8 2003 1.5 4.5 0 94.0 2004 1.5 4.4 0 94.1
^ Less than 0.1%

Annual Perinatal Report 2004 52
Haemorrhage
Postpartum Haemorrhage Table 45: Incidence of Postpartum Haemorrhage 1992 - 2004
Year Number Incidence % 1992 316 4.5 1993 295 4.3 1994 239 3.5 1995 320 4.7 1996 228 3.6 1997 160 2.5 1998 251 4.1 1999 252 4.1 2000 245 4.5 2001 244 4.3 2002 246 4.3 2003 227 4.1 2004 238 4.3
Figure 12: Incidence of Postpartum Haemorrhage 1992 – 2004
2.0
2.5
3.0
3.5
4.0
4.5
5.0
1992
1993
1994
1995
1996
1997
1998
1999
2000
2001
2002
2003
2004
Year
Perc
enta
ge
Annual Perinatal Report 2004 53
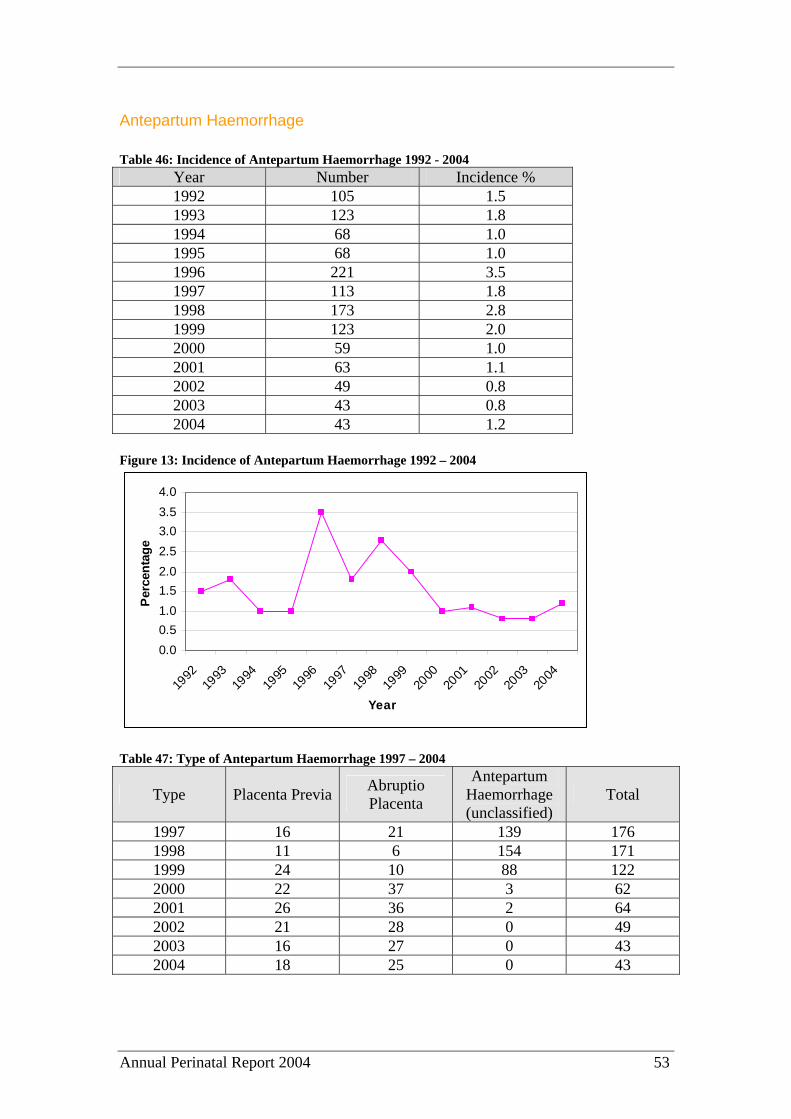
Antepartum Haemorrhage Table 46: Incidence of Antepartum Haemorrhage 1992 - 2004
Year Number Incidence % 1992 105 1.5 1993 123 1.8 1994 68 1.0 1995 68 1.0 1996 221 3.5 1997 113 1.8 1998 173 2.8 1999 123 2.0 2000 59 1.0 2001 63 1.1 2002 49 0.8 2003 43 0.8 2004 43 1.2
Figure 13: Incidence of Antepartum Haemorrhage 1992 – 2004
0.00.51.01.52.02.53.03.54.0
1992
1993
1994
1995
1996
1997
1998
1999
2000
2001
2002
2003
2004
Year
Per
cent
age
Table 47: Type of Antepartum Haemorrhage 1997 – 2004
Type Placenta Previa Abruptio Placenta
Antepartum Haemorrhage (unclassified)
Total
1997 16 21 139 176 1998 11 6 154 171 1999 24 10 88 122 2000 22 37 3 62 2001 26 36 2 64 2002 21 28 0 49 2003 16 27 0 43 2004 18 25 0 43
Annual Perinatal Report 2004 54
ATTACHMENT A: GUIDELINES FOR INVESTIGATION OF “UNEXPLAINED” STILLBIRTHS Introduction For stillbirths where the cause is obvious, investigations should be targeted towards the cause. In all other cases where no cause is determined, the following guideline should be used. A thorough and systematic approach will result in the likelihood of a cause being found and would help in counselling patients and might help prevent recurrences. While the list below is not meant to be comprehensive, it should serve as a guideline for investigation of stillbirths. All hospitals within the state are encouraged to implement the guideline. Guideline 1. Detailed medical and social history of the mother.
A possible cause for the stillbirth like intercurrent infection, cholestasis of pregnancy or drug use may be elicited by careful history taking and examination of the antenatal record.
2. Histopathology of placenta.
Whether or not an autopsy is performed, all placentas should be sent for examination. The placenta should be placed in a dry sterile container (no formalin or saline), and sent for histopathological examination.
3. External examination of the baby
In cases where parental consent for autopsy cannot be obtained, external examination of the baby should be performed preferably by a perinatal pathologist or an experienced neonatologist. In addition, clinical photographs, X-rays and if possible MRI scans should be done.
4. Autopsy of the baby
After informed parental consent, an autopsy should be conducted by an experienced perinatal pathologist. One of the senior clinicians involved with the care of the patient should counsel the couple and explain the need for autopsy. Where consent for a full autopsy cannot be obtained from the parents, efforts should be made to at least obtain consent for limited autopsy including needle biopsies of appropriate organs.
5. Karyotype
Ideally obtained by amniocentesis prior to delivery, but if consent not obtained then placental biopsy and/or cord blood (if obtainable) or foetal skin should be
Annual Perinatal Report 2004 55
sent for chromosomal analysis. Chromosomal analysis is still possible in macerated foetuses.
6. Maternal Investigations
Where there is no obvious cause for death, the following investigations should also be performed:
a) Full Blood Count b) Maternal antibody screen. c) Kleihauer Test (blood should be obtained prior to delivery) d) HbA1c (GTT if indicated) e) Liver function tests including serum bile acids f) Renal function tests including uric acid g) Thrombophilia screen including Anticardiolipin antibodies, Lupus
anticoagulant and Activated protein C resistance h) Maternal serology – CMV, Toxoplasmosis and Parvovirus (Rubella and
syphilis if not already done antenatally) i) Microbiology – foetal ear and throat swab, placental swab. j) Drug history and urine drug screen if indicated

Annual Perinatal Report 2004 56
Feedback Form The Council of Obstetric & Paediatric Mortality & Morbidity is committed to ensuring that the Annual Report is a useful tool for Obstetricians, Paediatricians and Midwives in monitoring the care and outcomes for Mothers and Babies. To this end we would welcome your feedback. Please complete the following form and return it to: Manager Clinical Data Services Acute Health Services Group Department of Health & Human Services Level 2, 10 Murray Street HOBART TAS 7000 Please circle
one option 1. Did you find the information contained within this Report useful? Yes No If no, please specify what was lacking: 2. Is there additional information you would like to routinely see included in the Report?
Yes No
If yes, please specify: 3. Are there any other suggestions you would make to assist in improving the usefulness of this Report?
Yes No
If yes, please specify: If you require further information please contact Manager, Clinical Data Services Unit on 62334016