Embed Size (px)
Citation preview

Page 1
2015
Prepared on 1/30/2014 by: Steve Strauss
Organization 306500
WSDOT Cost Recovery Plan –
Materials Laboratory Baseline Data CY 2013

Page 2
1
Cost Recovery Plan Summary
2
Organization Chart
3
Billing Methodology
4
Schedule of Proposed Rates
5
Total Revenues to Allowable Costs Analysis
6
Analysis of Change in Rates from Prior Plan
Year 7
Detail Supporting Schedules
8
Cost Recovery Center Oversight
9
Certification
Washington State
Department
Of
Transportation –
Materials
Laboratory
Cost Recovery
Rate Proposal
for FY 2015
Table of Contents:
Page 3
Section 1
Cost Recovery Plan Summary
Materials Laboratory Cost Recovery Center
MATERIAL LAB CHARTER
The State Materials Laboratory (SML), which includes the Bituminous, Chemical, Electrical, Physical Testing and
Soils Laboratories, serves as the central testing laboratory for the Washington State Department of Transportation.
These AASHTO Accredited laboratories perform various tests to ensure the materials used meet the appropriate
American Society for Testing Materials, American Association of State and Transportation Officials, or Department
specifications. The Materials Lab also provides materials testing and research to further the field of transportation
and provide new and enhanced solutions for long-lasting and cost-effective design, construction and maintenance.
FUNDING SOURCES AND CUSTOMER BASE
The Cost Recovery plan for FY15 is largely unchanged from the FY14 plan. The primary funding sources for the cost
recovery center are 59% State, 35% Federal and 6% local with State funds increasing significantly; Federal and
Local funds are declining.
Our customer base is 59% I-Program I, P-Program 35%, Local Programs 3% and all others 4%. All are showing slight
increases except for Local Programs which dropped sharply in CY 2013.
BILLING METHODOLOGY
Our billing methodology remains unchanged for FY15. The only significant change for FY15 is a cost savings
measure to reassign a portion of non-capitalized testing equipment from TEF to the materials labs. The rationale
and methodology are explained in detail below.
COST RECOVERY RATES
Although individual Cost Recovery Rates will fluctuate in FY15 due to fluctuations in equipment rental rates and
usage levels, the change in the weighted mean for all rates is a net-zero. In short, anticipated increases in the cost
of labor will be offset by decreases in the cost of Travel, Equipment, and overhead; and by an anticipated increase
in hours billed for FY15.
PROPOSED BUDGET
The Mats Lab’s proposed FY 2015 budget is $21.8 million: up $523K from the $21.3 million authorized for FY 2014.
The cost of labor and the addition of one “direct charge” FTE are the primary budget drivers. Allocations for FY15
are reduced in almost every other category.
ALLOWABLE COSTS
Labor accounts for approximately 81% of Mats Lab expenditures; Equipment and Travel constitute 12% and 2%
respectively. All other categories of expenditures comprise the remaining 5%. Based on workload estimates, we
expect to spend $459K more for Direct Labor, $165K more for Indirect Labor $625K more overall. The increases in
labor costs are primarily due to an anticipated 2% cost rate increase. Total FTEs, which includes non-perm labor
and overtime, are expected to increase by the equivalent of one “direct charge” FTE only. Non-Labor expenditures
are expected to decrease approximately $102K in FY 2015.
Page 4
RATE DRIVERS
In FY15, the AVERAGE rate will consist of: 50% direct labor, 31% indirect labor, 10% indirect non-labor, and 9%
direct travel and equipment charges.
There are offsetting pressures on the FY15 cost recovery rates. Consequently, no overall rate change is currently
being recommended for FY15.
COSTS BILLED
We expect to bill $21.8 million in FY 15 to cover our operating budget. This is up $300K from $21.5 million in CY
13. We split Costs Billed (i.e. Lab Revenue) into four separate Cost Recovery Centers: Construction Materials
($6.9 million), Geotechnical ($7.6 million), Pavement ($1.5 million) and Region Labs ($6 million). This reflects a 5%
drop in demand for Construction Materials work and an increase in Geotechnical and Regional Work of 8% and 3%
respectively.
The $21.8 in revenue is expected to come from one of four funding sources: Improvement $12.7 million,
Preservation $7.7 million, Local Programs $.7 million and Other Programs $.9 million. This is relatively unchanged
from FY 14.
FTEs
FTE levels are stable for FY15. We are holding the line at 69.8 indirect FTEs and increasing direct FTEs from 109 to
110 to handle the slight anticipated increase in demand for services.
EQUIPMENT
TEF equipment rates will fluctuate on an individual basis but overall remain relatively stable for FY15. The same
may be said for equipment utilization rates. Changes in either can affect individual rates up or down. As stated,
overall rates will remain unchanged for FY 2015.
OVERSIGHT
In FY 15, we will incorporate specific guidelines for Cost Recovery Center Oversight which will clarify the process
for reviewing expenditures, rates, potential inefficiencies, and under/over recovery balances. The Guidelines also
clarify the procedures for rate adjustments and over/under billing reconciliation.
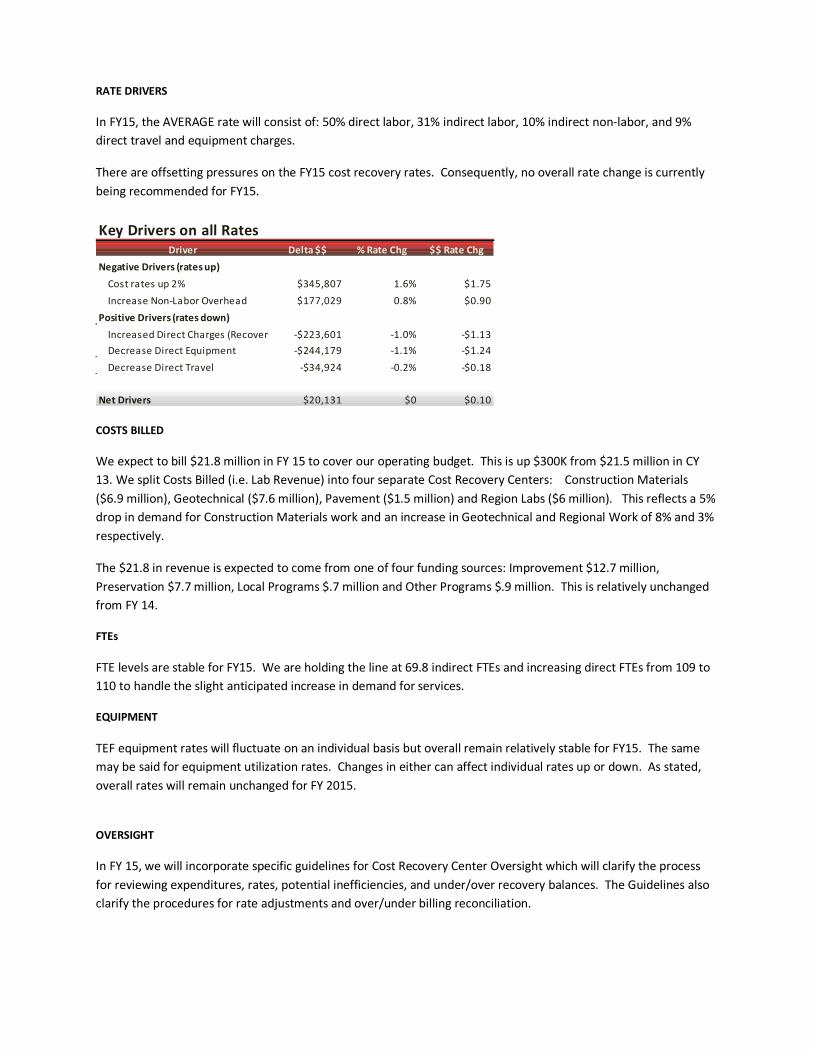
Key Drivers on all RatesDriver Delta $$ % Rate Chg $$ Rate Chg
Negative Drivers (rates up)
Cost rates up 2% $345,807 1.6% $1.75
Increase Non-Labor Overhead $177,029 0.8% $0.90
Positive Drivers (rates down)
Increased Direct Charges (Recoveries) -$223,601 -1.0% -$1.13
Decrease Direct Equipment -$244,179 -1.1% -$1.24
Decrease Direct Travel -$34,924 -0.2% -$0.18
Net Drivers $20,131 $0 $0.10
Page 5
Section 2
Organization Chart
Materials Laboratory
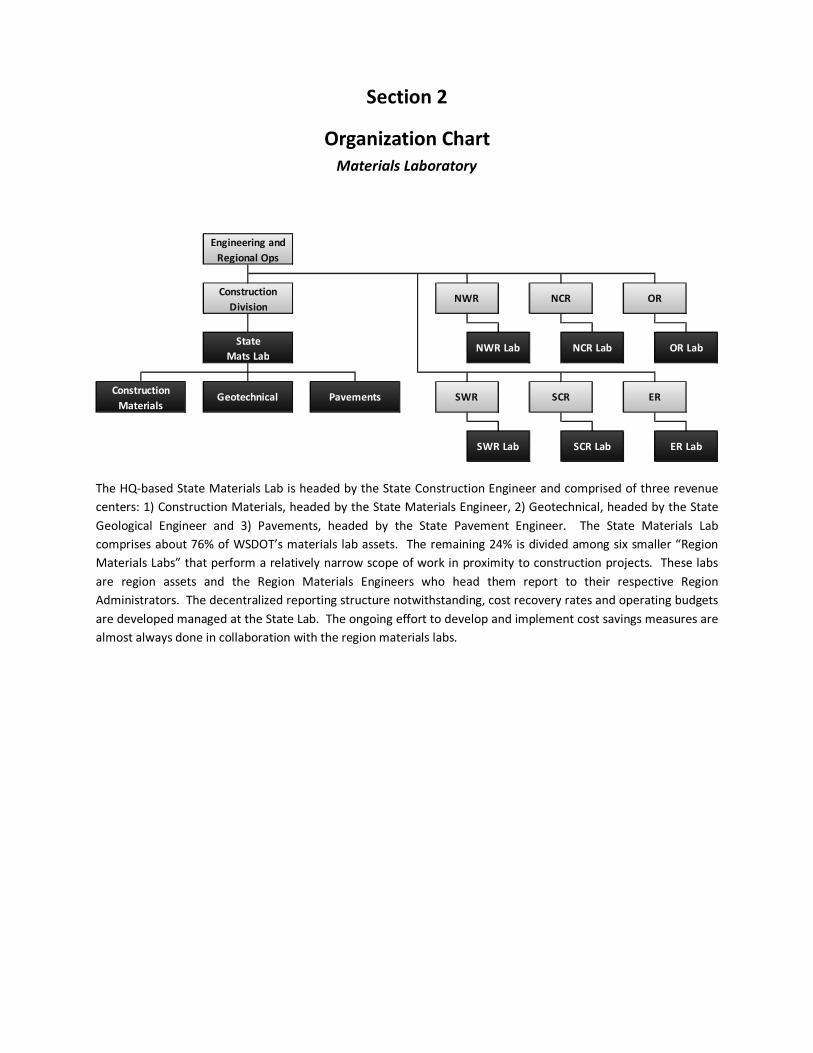
The HQ-based State Materials Lab is headed by the State Construction Engineer and comprised of three revenue
centers: 1) Construction Materials, headed by the State Materials Engineer, 2) Geotechnical, headed by the State
Geological Engineer and 3) Pavements, headed by the State Pavement Engineer. The State Materials Lab
comprises about 76% of WSDOT’s materials lab assets. The remaining 24% is divided among six smaller “Region
Materials Labs” that perform a relatively narrow scope of work in proximity to construction projects. These labs
are region assets and the Region Materials Engineers who head them report to their respective Region
Administrators. The decentralized reporting structure notwithstanding, cost recovery rates and operating budgets
are developed managed at the State Lab. The ongoing effort to develop and implement cost savings measures are
almost always done in collaboration with the region materials labs.
Construction
MaterialsER
OR
OR Lab
ER Lab
SWR
NWR Lab
NWR
SWR Lab
NCR
NCR Lab
SCR
SCR Lab
Pavements
Engineering and
Regional Ops
Construction
Division
State
Mats Lab
Geotechnical
Page 6
Section 3
Billing Methodology
Materials Laboratory
Introduction
Cost recovery rates for Materials Lab Testing and Services are developed in two phases:
• Creation of schedules, which include common factors and calculations, and
• Computation of rates, which combine the various schedules to form the final cost recovery charges.
This submission for cost recovery rates evaluated as of January 30, 2014, derives the schedules schematically and
presents the format for the rate calculations.
The overall schedule and rate structure is unchanged from the previous submittal. In the discussion which follows,
the rationale for the calculations will be presented and the sources of the particular information will be identified.
These cost recovery rates apply to all organizations within the State Materials Laboratory and to the six Region
Labs. Within this consolidated organization, many common tasks or activities are performed with different grade
levels of staff depending on the available personnel within the organization. A major functional element is the
weighted labor matrix for each activity. The information for this matrix is provided by analysis of each organization
based on its own history and practices. From this combination, a weighted labor rate is computed. This weighted
rate combined with other elements from the schedules forms the final cost recovery rate.
Summary of Cost Recovery Rates
Cost recovery rates are computed for each of a number of identified activities in the consolidated materials
organization. Some of these activities are performed at the State and Region Labs; others are performed at the
State or the Region Labs, but not both.
There is a summary of the numerical designations of the various activities and the work involved for reference at
the end of this section. Regardless of location, the basic structure is comprised of the weighted labor rate for the
activity together with the appropriate overhead and/or equipment cost factors. Three elements are common to all
rates: the weighted labor cost, the non-chargeable labor cost, and the non-labor overhead cost.
The weighted labor cost for each activity is determined using a “labor rate matrix” that combines the staff level
and classes used for each activity, wherever they are performed. This weighted labor cost is unique for each
activity, even though it may vary by only a minor amount from another activity. The non-chargeable labor cost is
the same for all activities and is itself, derived from a labor rate matrix combining all the overhead personnel for
the materials organization. The non-labor overhead is also the same for all activities and is based on the computed

Page 7
overhead items other than labor which support the total Materials organization. In compiling the various cost
recovery rates, the first three items, then, are the same throughout:
• Weighted (Direct) Labor Cost
• Non-chargeable (Indirect) Labor Costs (Schedule 1)
• Non-labor (Indirect) Overhead Cost ( Schedule 2)
A significant number of the cost recovery rates are comprised of only these three elements. The actual rates,
however, vary because the labor rate matrix which determines the labor cost is specific for each category of
service provided.
The cost recovery rates which contain only these three elements shown in the table below:
Rates Comprised Solely Of Direct and Indirect Labor and Overhead
Rate Code Service Provided and Additive
R-2 Drafting and Data Analysis (including GIS)
R-3 Analysis, Reporting and Review
R-5 Materials Inspection, Region
R-6R Prestress Inspection, Region
R-6 Prestress Inspection, Service Center, No Travel
R-7 Assurance Sampling and Inspection
R-8 Plant Inspection, Production, PCC & ACP
R-8P Plant Inspection, Preliminary, PCC & ACP
R-9 Equipment Inventory and Repair
R-10 Geotechnical Fieldwork
R-11 Field Investigation (without Equipment)
R-12 Membrane Resistivity, Soil pH & Resistivity
R-16 Traffic control
R-21 Geotechnical and Engineering Review
R-26 Pavement Rating
Page 8
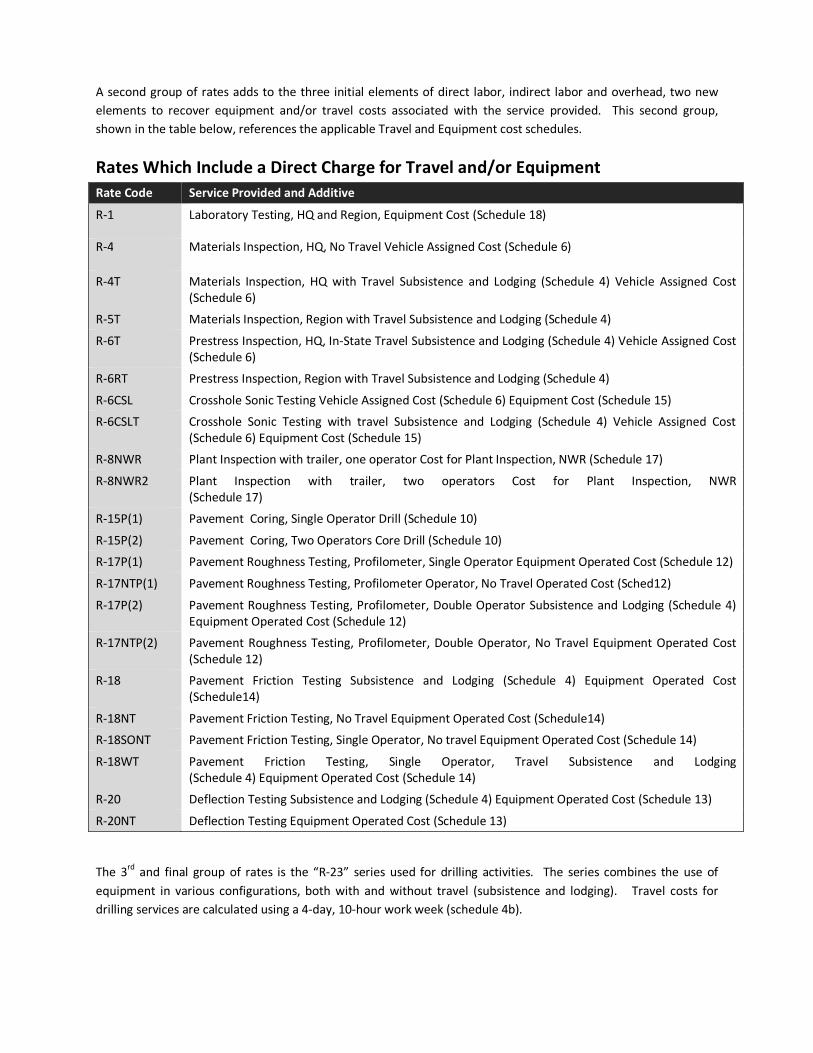
A second group of rates adds to the three initial elements of direct labor, indirect labor and overhead, two new
elements to recover equipment and/or travel costs associated with the service provided. This second group,
shown in the table below, references the applicable Travel and Equipment cost schedules.
Rates Which Include a Direct Charge for Travel and/or Equipment
Rate Code Service Provided and Additive
R-1 Laboratory Testing, HQ and Region, Equipment Cost (Schedule 18)
R-4 Materials Inspection, HQ, No Travel Vehicle Assigned Cost (Schedule 6)
R-4T Materials Inspection, HQ with Travel Subsistence and Lodging (Schedule 4) Vehicle Assigned Cost
(Schedule 6)
R-5T Materials Inspection, Region with Travel Subsistence and Lodging (Schedule 4)
R-6T Prestress Inspection, HQ, In-State Travel Subsistence and Lodging (Schedule 4) Vehicle Assigned Cost
(Schedule 6)
R-6RT Prestress Inspection, Region with Travel Subsistence and Lodging (Schedule 4)
R-6CSL Crosshole Sonic Testing Vehicle Assigned Cost (Schedule 6) Equipment Cost (Schedule 15)
R-6CSLT Crosshole Sonic Testing with travel Subsistence and Lodging (Schedule 4) Vehicle Assigned Cost
(Schedule 6) Equipment Cost (Schedule 15)
R-8NWR Plant Inspection with trailer, one operator Cost for Plant Inspection, NWR (Schedule 17)
R-8NWR2 Plant Inspection with trailer, two operators Cost for Plant Inspection, NWR
(Schedule 17)
R-15P(1) Pavement Coring, Single Operator Drill (Schedule 10)
R-15P(2) Pavement Coring, Two Operators Core Drill (Schedule 10)
R-17P(1) Pavement Roughness Testing, Profilometer, Single Operator Equipment Operated Cost (Schedule 12)
R-17NTP(1) Pavement Roughness Testing, Profilometer Operator, No Travel Operated Cost (Sched12)
R-17P(2) Pavement Roughness Testing, Profilometer, Double Operator Subsistence and Lodging (Schedule 4)
Equipment Operated Cost (Schedule 12)
R-17NTP(2) Pavement Roughness Testing, Profilometer, Double Operator, No Travel Equipment Operated Cost
(Schedule 12)
R-18 Pavement Friction Testing Subsistence and Lodging (Schedule 4) Equipment Operated Cost
(Schedule14)
R-18NT Pavement Friction Testing, No Travel Equipment Operated Cost (Schedule14)
R-18SONT Pavement Friction Testing, Single Operator, No travel Equipment Operated Cost (Schedule 14)
R-18WT Pavement Friction Testing, Single Operator, Travel Subsistence and Lodging
(Schedule 4) Equipment Operated Cost (Schedule 14)
R-20 Deflection Testing Subsistence and Lodging (Schedule 4) Equipment Operated Cost (Schedule 13)
R-20NT Deflection Testing Equipment Operated Cost (Schedule 13)
The 3rd
and final group of rates is the “R-23” series used for drilling activities. The series combines the use of
equipment in various configurations, both with and without travel (subsistence and lodging). Travel costs for
drilling services are calculated using a 4-day, 10-hour work week (schedule 4b).

Page 9
Summary of Labor Activities Associated With Individual Rates
R-1 Lab Testing - Sample determinations made in Region or Headquarters Lab. Performed by regular
testing personnel including section head and supervisor. May include sample tests performed by
progress sampler or Region Fabrication Inspector where no test report is issued.
R-2 Drafting and Data Analysis - Preparation of graphic material or computation of numerical data
directly performed by the individual to include lab supervisors or lab technicians or drafters.
R-3 Analysis, Reporting and Review - Engineering analysis and review including preparation of
engineering and Geotechnical reports, review of engineering plans and specifications, interpreting
and analyzing field data. Performed generally by engineering personnel, section heads
supervisors, Materials Engineer, and their principal assistants. May involve either office or field
work and includes preparation and presentation of training. Also includes acceptance certification
and review and Materials Engineer’s and Section Head’s activities in directing and performing field
tests and studies.
R-4 Materials Inspection (Headquarters) No Travel - In plant or onsite inspection of fabricated
materials by personnel of the Service Center inspection organization. Made within the local area
not requiring overnight travel.
R-4T Materials Inspection (Headquarters) Travel - Inspection as for rate R-4 but involving reimbursed
overnight travel either in-state or out-of -state.
R-5 Materials Inspection (Region) - Inspection of Materials for acceptance by the Region Fabrication
Inspector. Typically involves in-plant pre-cast or warehouse sampling.
R-5T Materials Inspection (Region), Travel - Inspection as for rate R-5 but involving reimbursed
overnight travel.
R-6R Prestress Inspection- Inspection of pre-stressed concrete products during fabrication. Performed
by an inspector assigned to a Region Materials Organization.
R-6RT Prestress Inspection, Travel- Inspection as for rate R-6 but involving reimbursed overnight travel.
R-6 Prestress Inspection (Headquarters) No Travel - Inspection of pre-stressed concrete products by
the staff of the HQ Fabrication Inspection section within the permanent duty station area.
R-6T Prestress Inspection with Travel - As above but on travel status. ATE CODE
R-6CSL Crosshole Sonic Logging - Inspection with CSL equipment of concrete poured shafts.
R-6CSLT Crosshole Sonic Logging with Travel - As above but on travel status.
R-7 Independent Assurance Inspection and Sampling - Activities of the Region Independent Assurance
Inspector and assistants in conducting the independent assurance sampling and inspection duties
set forth by the Construction Manual.
R-8 Plant Inspection, Production PCC and ACP - Inspection at an asphalt or concrete plant for work
assigned to a specific contract. This type work would replace an inspection directly responsible to
a specific project engineer.
R-8P Plant Inspection, Preliminary PCC and ACP - Inspection of a Concrete or asphalt plant for
qualification of the facility for acceptance for state work. Does not involve sampling and testing of
materials during production.
R-8NWR Plant Inspection with Trailer, one operator-Provide acceptance for HMA at paver’s asphalt plant
with one tester.
R-8NWR2 Plant Inspection with Trailer, two operators - Same as above except with two testers.

Page 10
R-9 Equipment Maintenance and Repair - Self-explanatory, may be chargeable directly to a
construction project in the case of excessive or unusual damage or calibration. May also be
chargeable to TEF through a specific equipment number with concurrence from Equipment Supt.
Lab Testing equipment excluded.
R-10 Geotechnical Fieldwork - Field reading observation or test of a Geotechnical nature made by
Technical level personnel.
R-11 Field Soils Investigation without Equipment - Inspection, evaluation and/or hand sampling for a
soils or pavement investigation by technician personnel.
R-12 Membrane Resistivity, Soil pH, Soil Resistivity - Self-explanatory.
R-15P(1) Pavement Coring, Single Operator - Inspection, evaluation and sampling requiring core drilling to
obtain samples and/or data.
R-15P(2) Pavement Coring, Two Operators – Same as above except with two operators.
R-16 Traffic Control - Flagging and sign erection connected with other activities such as chloride
sampling, pavement coring, drilling, or FWD operation.
R-17P2 Pavement Roughness Testing, Video/Profiler (Double Operator) - Performed by Headquarters
Pavement section using the video/ profiler unit either pre-and post-construction or statewide
inventory.
R-17P2NT Pavement Roughness Testing, Video/Profiler (Double Operator) No Travel - Same as above except
no travel.
R-17P1 Pavement Roughness Testing Video/Profiler(Single Operator ) - Same as above
R-17P1NT Pavement Roughness Testing, Video/Profiler, (Single Operator.) No Travel - Same as above, except
no travel.
R-18WT Pavement Friction Testing - Operation of friction test vehicle by HQ Pavement section either pre -
and post- construction or statewide inventory.
R18NT Pavement Friction Testing, No, Travel – Same as above except no travel.
R-18SOWT Pavement Friction Testing, Single Operator, with Travel – Same as above except with single
operator.
R-18SONT Pavement Friction Testing, Single Operator, No Travel – Same as above but no travel.
R-20 Deflection Testing - Pavement investigation using a Falling Weight Deflectometer (FWD).
R-20NT Deflection Testing, No Travel – Same as above except no travel.
R-21 Geotechnical and Engineering Review - Technical evaluation and study by the Region Materials
Engineer and Assistant involving complex study and technical details.
R-23 Drilling and Exploration Rates - Varies according to the combination of, series personnel, and
travel status.
R-26 Pavement Rating – Rating the condition of the pavement surface from digital images from the
Pavement Condition Collection Van.
Page 11
Section 4
Schedule of Proposed Rates
Materials Laboratory
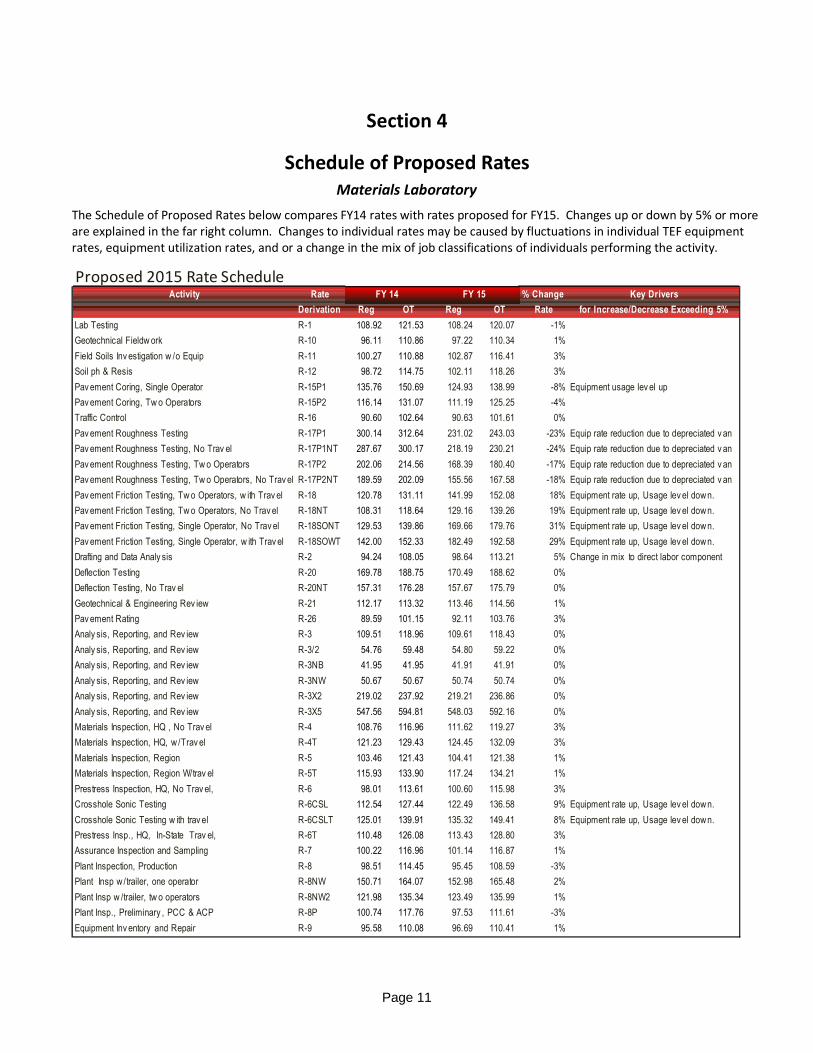
The Schedule of Proposed Rates below compares FY14 rates with rates proposed for FY15. Changes up or down by 5% or more
are explained in the far right column. Changes to individual rates may be caused by fluctuations in individual TEF equipment
rates, equipment utilization rates, and or a change in the mix of job classifications of individuals performing the activity.
Proposed 2015 Rate ScheduleActivity Rate % Change Key Drivers
Derivation Reg OT Reg OT Rate for Increase/Decrease Exceeding 5%
Lab Testing R-1 108.92 121.53 108.24 120.07 -1%
Geotechnical Fieldw ork R-10 96.11 110.86 97.22 110.34 1%
Field Soils Inv estigation w /o Equip R-11 100.27 110.88 102.87 116.41 3%
Soil ph & Resis R-12 98.72 114.75 102.11 118.26 3%
Pavement Coring, Single Operator R-15P1 135.76 150.69 124.93 138.99 -8% Equipment usage lev el up
Pavement Coring, Tw o Operators R-15P2 116.14 131.07 111.19 125.25 -4%
Traffic Control R-16 90.60 102.64 90.63 101.61 0%
Pavement Roughness Testing R-17P1 300.14 312.64 231.02 243.03 -23% Equip rate reduction due to depreciated v an
Pavement Roughness Testing, No Trav el R-17P1NT 287.67 300.17 218.19 230.21 -24% Equip rate reduction due to depreciated v an
Pavement Roughness Testing, Tw o Operators R-17P2 202.06 214.56 168.39 180.40 -17% Equip rate reduction due to depreciated v an
Pavement Roughness Testing, Tw o Operators, No Trav el R-17P2NT 189.59 202.09 155.56 167.58 -18% Equip rate reduction due to depreciated v an
Pavement Friction Testing, Tw o Operators, w ith Trav el R-18 120.78 131.11 141.99 152.08 18% Equipment rate up, Usage lev el down.
Pavement Friction Testing, Tw o Operators, No Trav el R-18NT 108.31 118.64 129.16 139.26 19% Equipment rate up, Usage lev el down.
Pavement Friction Testing, Single Operator, No Trav el R-18SONT 129.53 139.86 169.66 179.76 31% Equipment rate up, Usage lev el down.
Pavement Friction Testing, Single Operator, w ith Trav el R-18SOWT 142.00 152.33 182.49 192.58 29% Equipment rate up, Usage lev el down.
Drafting and Data Analy sis R-2 94.24 108.05 98.64 113.21 5% Change in mix to direct labor component
Deflection Testing R-20 169.78 188.75 170.49 188.62 0%
Deflection Testing, No Trav el R-20NT 157.31 176.28 157.67 175.79 0%
Geotechnical & Engineering Rev iew R-21 112.17 113.32 113.46 114.56 1%
Pavement Rating R-26 89.59 101.15 92.11 103.76 3%
Analy sis, Reporting, and Rev iew R-3 109.51 118.96 109.61 118.43 0%
Analy sis, Reporting, and Rev iew R-3/2 54.76 59.48 54.80 59.22 0%
Analy sis, Reporting, and Rev iew R-3NB 41.95 41.95 41.91 41.91 0%
Analy sis, Reporting, and Rev iew R-3NW 50.67 50.67 50.74 50.74 0%
Analy sis, Reporting, and Rev iew R-3X2 219.02 237.92 219.21 236.86 0%
Analy sis, Reporting, and Rev iew R-3X5 547.56 594.81 548.03 592.16 0%
Materials Inspection, HQ , No Trav el R-4 108.76 116.96 111.62 119.27 3%
Materials Inspection, HQ, w /Trav el R-4T 121.23 129.43 124.45 132.09 3%
Materials Inspection, Region R-5 103.46 121.43 104.41 121.38 1%
Materials Inspection, Region W/trav el R-5T 115.93 133.90 117.24 134.21 1%
Prestress Inspection, HQ, No Trav el, R-6 98.01 113.61 100.60 115.98 3%
Crosshole Sonic Testing R-6CSL 112.54 127.44 122.49 136.58 9% Equipment rate up, Usage lev el down.
Crosshole Sonic Testing w ith trav el R-6CSLT 125.01 139.91 135.32 149.41 8% Equipment rate up, Usage lev el down.
Prestress Insp., HQ, In-State Trav el, R-6T 110.48 126.08 113.43 128.80 3%
Assurance Inspection and Sampling R-7 100.22 116.96 101.14 116.87 1%
Plant Inspection, Production R-8 98.51 114.45 95.45 108.59 -3%
Plant Insp w /trailer, one operator R-8NW 150.71 164.07 152.98 165.48 2%
Plant Insp w /trailer, tw o operators R-8NW2 121.98 135.34 123.49 135.99 1%
Plant Insp., Preliminary , PCC & ACP R-8P 100.74 117.76 97.53 111.61 -3%
Equipment Inv entory and Repair R-9 95.58 110.08 96.69 110.41 1%
FY 15FY 14

Page 12
Drilling Rate Summary and Comparison
The overall rate-change percentage is calculated by applying the individual rate changes based on their proportionate share of the
total. While individual rates fluctuate up or down slightly, we do not currently recommend an overall rate adjustment for FY 15.
Proposed 2015 Rate ScheduleActivity Rate % Change Key Drivers
Derivation Reg OT Reg OT Rate for Increase/Decrease Exceeding 5%
Test Drilling, No Trav el, Truck Mounted Drill R-23NT-01 128.48 141.76 124.19 136.55 -3%
Test Drilling, No Trav el, Heav y Duty Drill R23NT-02 120.95 134.22 116.07 128.43 -4%
Test Drilling, No Trav el, Dutch Cone R23NT-03 149.68 162.96 169.68 182.04 13% Equipment rate up, Usage level dow n.
Test Drilling, No Trav el, Skid Drill R23NT-04 122.56 135.84 118.21 130.57 -4%
Test Drilling, No Trav el, Skid Drill - Water R-23NT-05 124.11 137.39 125.75 138.10 1%
Test Drilling, No Trav el, Drilling Inspector R-23NT-06 94.14 107.42 94.63 106.99 1%
Test Drilling, No Trav el, Field Exploration Superv isor R-23NT-07 98.73 112.01 98.28 110.64 0%
Test Drilling, No Trav el, Ex tra Person on Crew R-23NT-08 94.14 107.42 94.63 106.99 1%
Test Drilling, w ith Trav el, Truck Mounted Drill R-23WT-01 140.95 154.23 137.01 149.37 -3%
Test Drilling, w ith Trav el, Heav y Duty Drill R-23WT-02 133.42 146.69 128.90 141.25 -3%
Test Drilling, w ith Trav el, Dutch Cone R-23WT-03 162.15 175.43 182.50 194.86 13% Equipment rate up, Usage level dow n.
Test Drilling, w ith Trav el, Skid Drill R23WT-04 135.03 148.31 131.03 143.39 -3%
Test Drilling, w ith Trav el, Skid Drill - Water R23WT-05 136.58 149.86 138.57 150.93 1%
Test Drilling, w ith Trav el, Drilling Inspector R23WT-06 106.61 119.89 107.46 119.81 1%
Test Drilling, w ith Trav el, Field Ex ploration Superv isor R23WT-07 111.20 124.48 111.10 123.46 0%
Test Drilling, w ith Trav el, Ex tra Person on Crew R23WT-08 106.61 119.89 107.46 119.81 1%
FY 15FY 14
Approximate Weighted Mean Rate ChangeMost Representative Rates % Chg FTEs Mtplr
Lab Testing R-1 -0.6% 22.0 20% 0%
Drafting and Data Analy sis R-2 4.7% 5.0 5% 0%
Analy sis, Reporting, and Rev iew R-3 0.1% 33.2 30% 0%
Materials Inspection, HQ , No Trav el R-4 2.6% 10.2 9% 0%
Materials Inspection, Region R-5 0.9% 0.8 1% .0%
Prestress Inspection, HQ, No Trav el, R-6 2.6% 0.7 1% .0%
Assurance Inspection and Sampling R-7 0.9% 4.3 4% .0%
Plant Inspection, Production R-8 -3.1% 1.0 1% .0%
Equipment Inv entory and Repair R-9 1.2% 0.1 0% .0%
Geotechnical Fieldwork R-10 1.2% 1.7 2% .0%
Field Soils Inv estigation w /o Equip R-11 2.6% 1.0 1% .0%
Soil ph & Resis R-12 3.4% 0.0 0% .0%
Pav ement Coring R-15 -4.3% 1.2 1% .0%
Traffic Control R-16 0.0% 1.7 2% .0%
Pav ement Roughness Testing R-17 -17.9% 1.6 1% -.3%
Pav ement Friction Testing R-18 17.6% 0.6 1% .1%
Deflection Testing R-20 0.4% 0.0 0% .0%
Geotechnical & Engineering Rev iew R-21 1.2% 0.3 0% .0%
Test Drilling, w ith Trav el, Skid Drill R-23 -3.0% 17.3 16% -.5%
Pav ement Rating R-26 2.8% 1.3 1% .0%
Aggregate Rate Adjustment 110.33 0%
Extension

Section 5
Total Revenues to Allowable Costs Analysis
Materials Laboratory
Funding Sources & Customer Base
Materials Lab operations are funded with State, Federal and Local dollars. While the local funding source is small
by comparison, $1.4 million recovered in CY 2013, it creates additional revenue for the Department and reduces
the cost of Mats Lab services to WSDOT projects.
The vast majority of work performed at the Mats Labs support the Department’s Improvement (I) and
Preservation (P) programs. In CY 13, we observed a slight increase in recoveries and hours charged in both
programs. The local program customer base dropped significantly in CY 13 which is indicative of increasingly
scarce funds in the municipalities.
Increases in recoveries for CY 13 were not due to higher demand for services. Increases were due to:
• A 6% rate increase effective January 1, 2013 to avoid an end-of-biennium under-recovery situation, and;
• Termination of the TSRA as of July 1, 2013, leading to higher labor costs for the last six months of the year.
Hours direct charged by local municipalities declined by 8,241 between CY12 and CY 13. This decline was largely
offset by increases in I, P and other programs resulting in a net decrease of 3,757 in chargeable hours.
Source Recoveries Percentage Recoveries Percentage Recoveries Percentage
State 10,876,060 53% 13,097,137 59% 2,221,077 6%
Federal 7,864,752 39% 7,673,496 35% -191,255 -4%
Local 1,610,468 8% 1,402,847 6% -207,621 -2%
Total 20,351,279 100% 22,173,480 100% 1,822,201 0%
CY 12 CY 13 Delta
Material Lab Funding Sources
Material Lab Customer Base (Recoveries)% CY12 % CY 13 % Delta
By Program Total Expenditure Total Expenditure Change Expenditure
Improvement 57% 11,634,786$ 59% 13,006,766$ 2% 1,371,980$
Preservation 32% 6,609,067$ 34% 7,474,116$ 2% 865,049$
Local Programs 7% 1,471,758$ 3% 755,820$ -4% (715,938)$
Other 3% 635,669$ 4% 936,779$ 1% 301,110$
Total 100% 20,351,279$ 22,173,480$ 1,822,201$
Material Lab Customer Base (Hours Billed)% CY12 % CY 13 % Delta
By Program Total Hours Total Hours Change Hours
Improvement 57% 115,831 59% 117,678 2% 1,848
Preservation 32% 65,028 34% 67,815 2% 2,787
Local Programs 7% 14,225 3% 5,984 -4% -8,241
Other 3% 6,096 4% 7,978 1% 1,882
Total 100% 203,212 100% 199,455 -3,757
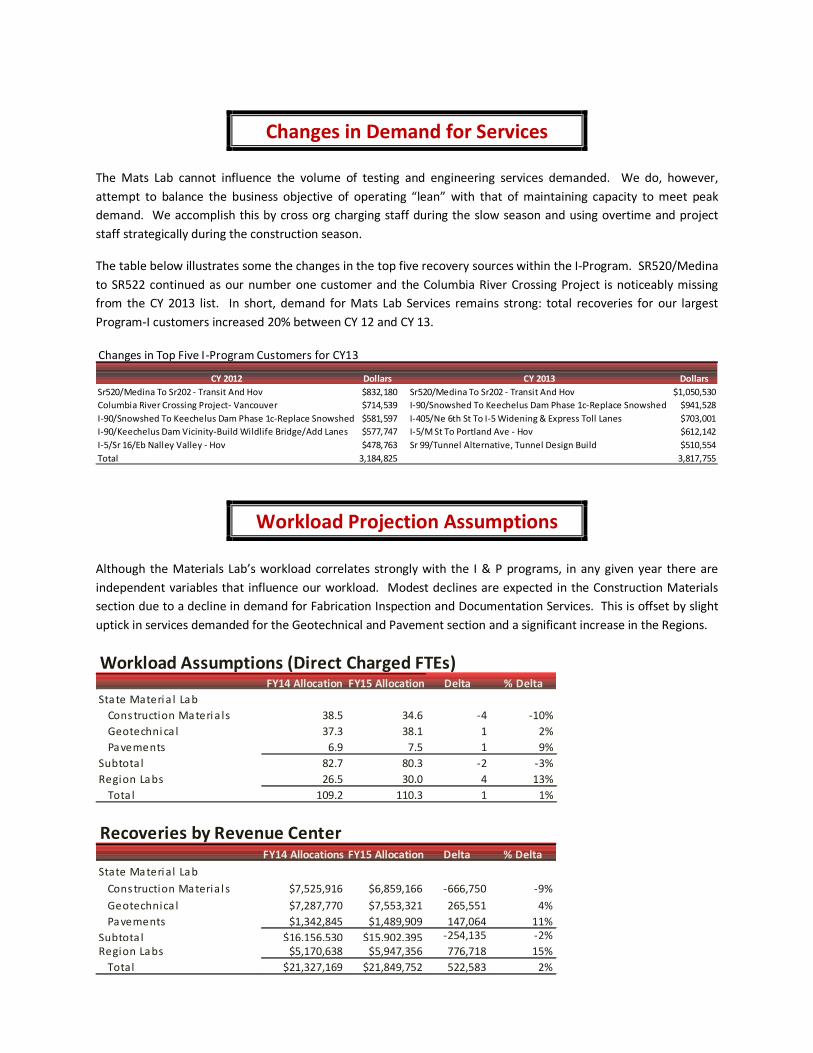
Changes in Demand for Services
The Mats Lab cannot influence the volume of testing and engineering services demanded. We do, however,
attempt to balance the business objective of operating “lean” with that of maintaining capacity to meet peak
demand. We accomplish this by cross org charging staff during the slow season and using overtime and project
staff strategically during the construction season.
The table below illustrates some the changes in the top five recovery sources within the I-Program. SR520/Medina
to SR522 continued as our number one customer and the Columbia River Crossing Project is noticeably missing
from the CY 2013 list. In short, demand for Mats Lab Services remains strong: total recoveries for our largest
Program-I customers increased 20% between CY 12 and CY 13.
Workload Projection Assumptions
Although the Materials Lab’s workload correlates strongly with the I & P programs, in any given year there are
independent variables that influence our workload. Modest declines are expected in the Construction Materials
section due to a decline in demand for Fabrication Inspection and Documentation Services. This is offset by slight
uptick in services demanded for the Geotechnical and Pavement section and a significant increase in the Regions.
Changes in Top Five I-Program Customers for CY13
CY 2012 Dollars CY 2013 Dollars
Sr520/Medina To Sr202 - Transit And Hov $832,180 Sr520/Medina To Sr202 - Transit And Hov $1,050,530
Columbia River Crossing Project- Vancouver $714,539 I-90/Snowshed To Keechelus Dam Phase 1c-Replace Snowshed $941,528
I-90/Snowshed To Keechelus Dam Phase 1c-Replace Snowshed $581,597 I-405/Ne 6th St To I-5 Widening & Express Toll Lanes $703,001
I-90/Keechelus Dam Vicinity-Build Wildlife Bridge/Add Lanes $577,747 I-5/M St To Portland Ave - Hov $612,142
I-5/Sr 16/Eb Nalley Valley - Hov $478,763 Sr 99/Tunnel Alternative, Tunnel Design Build $510,554
Total 3,184,825 3,817,755
Workload Assumptions (Direct Charged FTEs)FY14 Allocation FY15 Allocation Delta % Delta
State Materi a l Lab
Cons truction Materi a ls 38.5 34.6 -4 -10%
Geotechni ca l 37.3 38.1 1 2%
Pavements 6.9 7.5 1 9%
Subtota l 82.7 80.3 -2 -3%
Region Labs 26.5 30.0 4 13%
Tota l 109.2 110.3 1 1%
Recoveries by Revenue CenterFY14 Allocations FY15 Allocation Delta % Delta
State Materi al Lab
Cons truction Materia l s $7,525,916 $6,859,166 -666,750 -9%
Geotechnica l $7,287,770 $7,553,321 265,551 4%
Pavements $1,342,845 $1,489,909 147,064 11%
Subtota l $16,156,530 $15,902,395 -254,135 -2%
Region Labs $5,170,638 $5,947,356 776,718 15%
Total $21,327,169 $21,849,752 522,583 2%
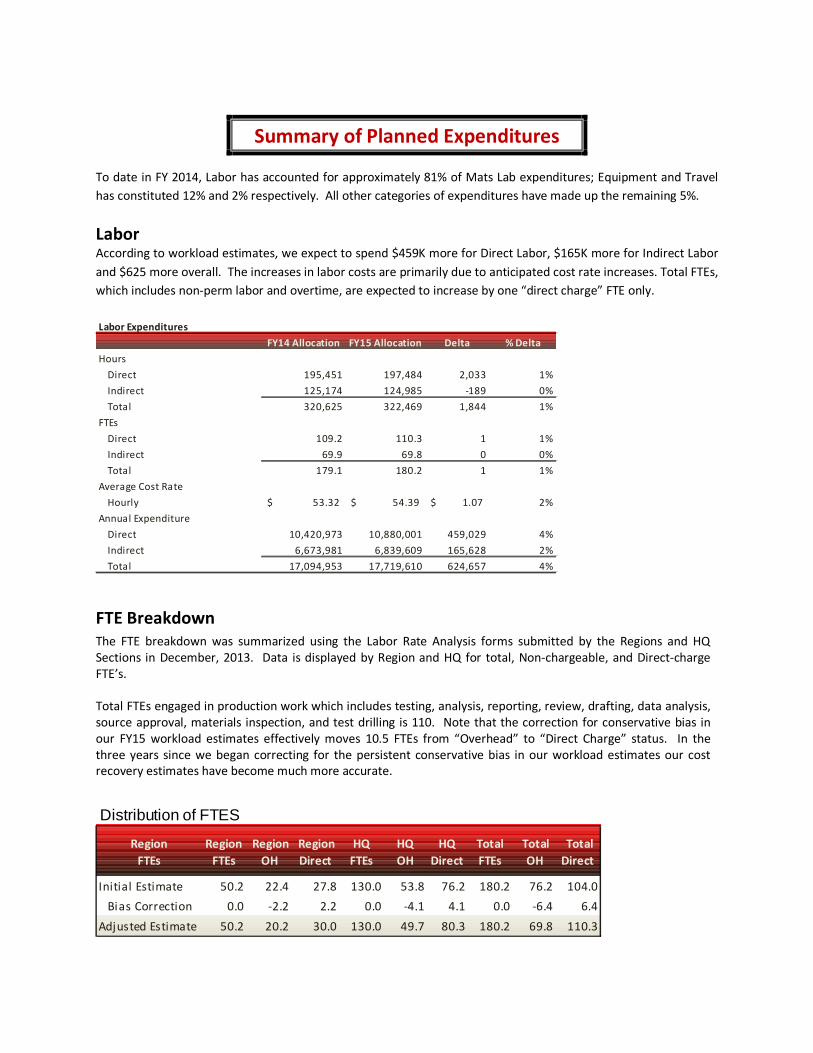
Summary of Planned Expenditures
To date in FY 2014, Labor has accounted for approximately 81% of Mats Lab expenditures; Equipment and Travel
has constituted 12% and 2% respectively. All other categories of expenditures have made up the remaining 5%.
Labor According to workload estimates, we expect to spend $459K more for Direct Labor, $165K more for Indirect Labor
and $625 more overall. The increases in labor costs are primarily due to anticipated cost rate increases. Total FTEs,
which includes non-perm labor and overtime, are expected to increase by one “direct charge” FTE only.
FTE Breakdown
The FTE breakdown was summarized using the Labor Rate Analysis forms submitted by the Regions and HQ
Sections in December, 2013. Data is displayed by Region and HQ for total, Non-chargeable, and Direct-charge
FTE’s.
Total FTEs engaged in production work which includes testing, analysis, reporting, review, drafting, data analysis,
source approval, materials inspection, and test drilling is 110. Note that the correction for conservative bias in
our FY15 workload estimates effectively moves 10.5 FTEs from “Overhead” to “Direct Charge” status. In the
three years since we began correcting for the persistent conservative bias in our workload estimates our cost
recovery estimates have become much more accurate.
Labor Expenditures
FY14 Allocation FY15 Allocation Delta % Delta
Hours
Direct 195,451 197,484 2,033 1%
Indirect 125,174 124,985 -189 0%
Total 320,625 322,469 1,844 1%
FTEs
Direct 109.2 110.3 1 1%
Indirect 69.9 69.8 0 0%
Total 179.1 180.2 1 1%
Average Cost Rate
Hourly 53.32$ 54.39$ 1.07$ 2%
Annual Expenditure
Direct 10,420,973 10,880,001 459,029 4%
Indirect 6,673,981 6,839,609 165,628 2%
Total 17,094,953 17,719,610 624,657 4%
Region
FTEs
Region
FTEs
Region
OH
Region
Direct
HQ
FTEs
HQ
OH
HQ
Direct
Total
FTEs
Total
OH
Total
Direct
Initial Estimate 50.2 22.4 27.8 130.0 53.8 76.2 180.2 76.2 104.0
Bias Correction 0.0 -2.2 2.2 0.0 -4.1 4.1 0.0 -6.4 6.4
Adjusted Estimate 50.2 20.2 30.0 130.0 49.7 80.3 180.2 69.8 110.3
Distribution of FTES
Non Labor
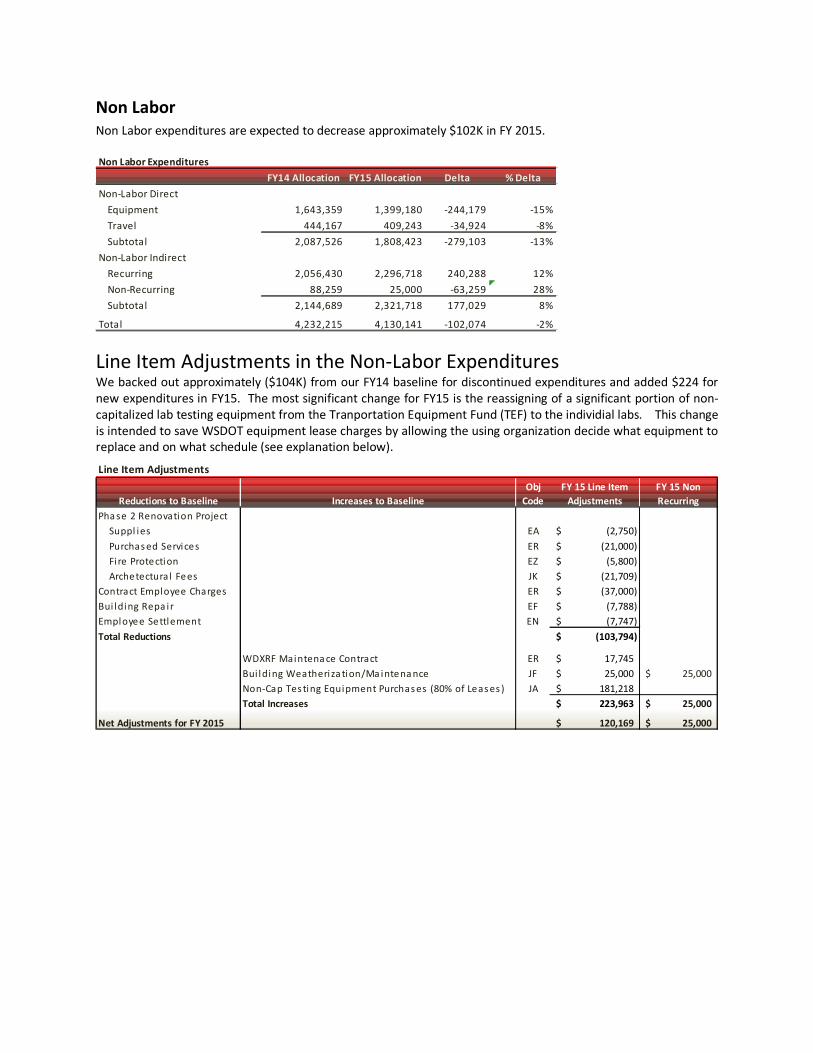
Non Labor expenditures are expected to decrease approximately $102K in FY 2015.
Line Item Adjustments in the Non-Labor Expenditures We backed out approximately ($104K) from our FY14 baseline for discontinued expenditures and added $224 for
new expenditures in FY15. The most significant change for FY15 is the reassigning of a significant portion of non-
capitalized lab testing equipment from the Tranportation Equipment Fund (TEF) to the individial labs. This change
is intended to save WSDOT equipment lease charges by allowing the using organization decide what equipment to
replace and on what schedule (see explanation below).
Non Labor Expenditures
FY14 Allocation FY15 Allocation Delta % Delta
Non-Labor Direct
Equipment 1,643,359 1,399,180 -244,179 -15%
Travel 444,167 409,243 -34,924 -8%
Subtotal 2,087,526 1,808,423 -279,103 -13%
Non-Labor Indirect
Recurring 2,056,430 2,296,718 240,288 12%
Non-Recurring 88,259 25,000 -63,259 28%
Subtotal 2,144,689 2,321,718 177,029 8%
Total 4,232,215 4,130,141 -102,074 -2%
Line Item Adjustments
Reductions to Baseline Increases to Baseline
Obj
Code
FY 15 Line Item
Adjustments
FY 15 Non
Recurring
Pha se 2 Renovation Project
Suppl ies EA (2,750)$
Purchas ed Services ER (21,000)$
Fi re Protection EZ (5,800)$
Archetectural Fees JK (21,709)$
Contract Employee Charges ER (37,000)$
Bui lding Repa ir EF (7,788)$
Employee Settlement EN (7,747)$
Total Reductions (103,794)$
WDXRF Maintena ce Contract ER 17,745$
Bui lding Weatheriza tion/Ma intena nce JF 25,000$ 25,000$
Non-Cap Tes ting Equipment Purchas es (80% of Leas es ) JA 181,218$
Total Increases 223,963$ 25,000$
Net Adjustments for FY 2015 120,169$ 25,000$

Summary of Costs Billed
Comparison with Prior Year
We expect the summary of costs billed to track fairly closely with the demand for Mats Lab services.
Costs Billed by Revenue CenterCY13 Actuals FY15 Allocation Delta % Delta Comment
State Materi a l Lab
Cons truction Materi a ls $7,219,171 $6,859,166 -360,005 -5% Doc Charges /Fab Insp.
Geotechnica l $6,989,383 $7,553,321 563,938 8% Fi s h Pas s ages
Pavements $1,551,069 $1,489,909 -61,160 -4% Res earch Dol lars
Subtota l $15,759,622 $15,902,395 142,773 1%
Region Labs $5,763,847 $5,947,356 183,509 3% Various Factors
Total $21,523,469 $21,849,752 326,282 2%
Costs Billed to Customer% CY 13 % FY 15 Est. % Delta
By Program Total Expenditure Total Expenditure Change Expenditure
Improvement 59% 13,006,766$ 58% 12,672,856$ -1% (333,910)$
Pres ervati on 34% 7,474,116$ 35% 7,647,413$ 1% 173,297$
Loca l Programs 3% 755,820$ 3% 655,493$ 0% (100,327)$
Other 4% 936,779$ 4% 873,990$ 0% (62,789)$
Tota l 22,173,480$ 21,849,752$ (323,728)$

COST RECOVERY CENTER
BUDGET FOR 2015
The Mats Lab’s proposed FY 2015 budget is $21.8 million: up $539K from the $21.3 million authorized for FY 2014.
The cost of labor is the primary budget driver. Allocations for FY15 are reduced in most other categories.
Proposed FY 2015 BudgetObj Code Description Direct Indirect Total
BE Al lowances 7,209 7,209
EA Suppl i es and Materi a ls 399,963 399,963
EB Communi cati ons 87,551 87,551
EC Uti l i ties 202,597 202,597
EE Repa irs, Al terations and Mai ntenance 29,950 29,950
EF Printi ng Servi ces 2,194 2,194
EG Empl oyee Prof Devel opment & Tra ini ng 45,798 45,798
EH Rents , Leas es, Furn, Equi p, & Software 1,533,102 574,155 2,107,257
EJ Subscripti ons 286 286
EP Insurance 46,987 46,987
ER Purchased Servi ces 157,527 157,527
ES Vehicle Maint & Operating Cos ts 6,676 6,676
EY Sofware Mai nt & Leas es 127,214 127,214
EZ Other Goods and Services 17,233 17,233
GA In-State Subs i stence and Lodgi ng 370,405 32,403 402,808
GB In-State Air Trans portation 4,329 4,329
GC Private Automobi le Mil eage 1,760 1,760
GD Other Travel Expenses 9,206 9,206
GF Out-of-State Subs is tence and Lodgi ng 38,838 8,300 47,139
GG Out-of State Ai r Transportation 3,215 3,215
GN Motor Pool Services 92,600 82,275 174,875
JA Non Capita l i zed As s ets 230,357 230,357
JB Minor Cap IT 51 51
JC Furni shi ngs , Equi pment and Software 25,339 25,339
JG Hi ghway Constructi on 6 6
TA10 Wages -Overtime 812,789 812,789
TA11 Wages -Regular 10,066,094 6,839,609 16,905,703
TA13 Wages -Pena lty 1,118 1,118
TE76 Goods and Services 9,083 9,083
TOTAL 12,914,947$ 8,951,269$ 21,866,216$

Proposed Change in
Methodology for 2015
Reassignment of Non-Capitalized Equipment from TEF to Materials Labs
RECOMMENDATION
The State Materials Lab has proposed that TEF transfer ownership of approximately $1.2 million in non-capitalized
equipment with annual lease costs of $260,000 to the Materials Labs on July 1, 2014, subject to FHWA approval of
this cost recovery plan.
We believe that we can reduce our net annual lease expenditures by 20%- 25% by assuming responsibility for the
maintenance, repair and replacement of this equipment. Mats Lab assumes an estimated net annual savings to
the Department in the range of $40 - $60 thousand, excluding potential administrative savings. Mats Lab
estimates a net-zero impact to TEF with this change. While the leases for the reassigned equipment will be
discontinued, so will TEFs responsibility for its maintenance, repair and replacement.
MATERIALS LAB ASSUMPTIONS
1) Materials Laboratories can use cost recoveries with Federal participation to replace non-capitalized equipment
because it is not depreciated. (Note that this is not the case with capitalized equipment.)
2) Equipment will be replaced only when it is no longer functional, therefore extending useful life.
3) Laboratory Managers will have maximum flexibility as to when, where, and what equipment to replace.
4) There will be no restrictions on substitution of equipment.
5) Each materials laboratory will be allocated a budget. Each will have a vested interest to manage and maintain
their equipment. The end result would be the extension of useful life for equipment owned by them.
6) The State lab has staff proficient in equipment repair. Use of this resource will lessen the need to rely on
expensive external repair services.
7) The Minor Capital inventory system can be used effectively to track and account for the reassigned testing
equipment.
BACKGROUND
According to the TEF inventory system, the Materials Laboratories across the state use approximately $4.3 million
in laboratory equipment ($1.8M capitalized /$2.5M non-capitalized).
Materials Laboratories lease this equipment from TEF. TEF lease rates are based on a set of suppositions about
operating costs, expected life of the unit, and replacement cost of non-capitalized equipment. While leasing is
effective for high-dollar capital equipment, it is less practical for low-dollar non-capitalized equipment.
Page 20
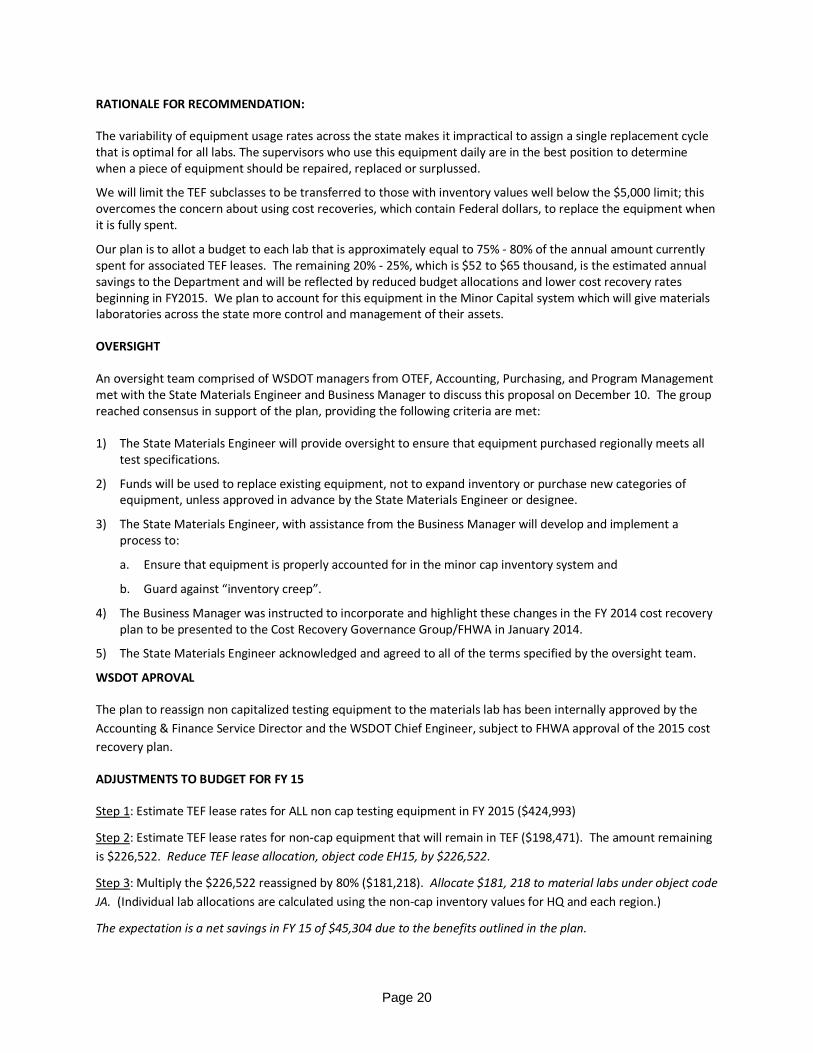
RATIONALE FOR RECOMMENDATION:
The variability of equipment usage rates across the state makes it impractical to assign a single replacement cycle
that is optimal for all labs. The supervisors who use this equipment daily are in the best position to determine
when a piece of equipment should be repaired, replaced or surplussed.
We will limit the TEF subclasses to be transferred to those with inventory values well below the $5,000 limit; this
overcomes the concern about using cost recoveries, which contain Federal dollars, to replace the equipment when
it is fully spent.
Our plan is to allot a budget to each lab that is approximately equal to 75% - 80% of the annual amount currently
spent for associated TEF leases. The remaining 20% - 25%, which is $52 to $65 thousand, is the estimated annual
savings to the Department and will be reflected by reduced budget allocations and lower cost recovery rates
beginning in FY2015. We plan to account for this equipment in the Minor Capital system which will give materials
laboratories across the state more control and management of their assets.
OVERSIGHT
An oversight team comprised of WSDOT managers from OTEF, Accounting, Purchasing, and Program Management
met with the State Materials Engineer and Business Manager to discuss this proposal on December 10. The group
reached consensus in support of the plan, providing the following criteria are met:
1) The State Materials Engineer will provide oversight to ensure that equipment purchased regionally meets all
test specifications.
2) Funds will be used to replace existing equipment, not to expand inventory or purchase new categories of
equipment, unless approved in advance by the State Materials Engineer or designee.
3) The State Materials Engineer, with assistance from the Business Manager will develop and implement a
process to:
a. Ensure that equipment is properly accounted for in the minor cap inventory system and
b. Guard against “inventory creep”.
4) The Business Manager was instructed to incorporate and highlight these changes in the FY 2014 cost recovery
plan to be presented to the Cost Recovery Governance Group/FHWA in January 2014.
5) The State Materials Engineer acknowledged and agreed to all of the terms specified by the oversight team.
WSDOT APROVAL
The plan to reassign non capitalized testing equipment to the materials lab has been internally approved by the
Accounting & Finance Service Director and the WSDOT Chief Engineer, subject to FHWA approval of the 2015 cost
recovery plan.
ADJUSTMENTS TO BUDGET FOR FY 15
Step 1: Estimate TEF lease rates for ALL non cap testing equipment in FY 2015 ($424,993)
Step 2: Estimate TEF lease rates for non-cap equipment that will remain in TEF ($198,471). The amount remaining
is $226,522. Reduce TEF lease allocation, object code EH15, by $226,522.
Step 3: Multiply the $226,522 reassigned by 80% ($181,218). Allocate $181, 218 to material labs under object code
JA. (Individual lab allocations are calculated using the non-cap inventory values for HQ and each region.)
The expectation is a net savings in FY 15 of $45,304 due to the benefits outlined in the plan.

Page 21
Reassigning Subset of Non-Cap Equipment to the Materials Labs
Non-Cap Equipment Budget for FY15
Lab
2015 Leases
Obj EH15
2015 Leases
Obj EH15
2015 Budget
Obj JA
2015
Combined
Annual
Savings
SML 78,874$ 52,369$ 21,204$ 73,573$ 5,301$
NWR 111,083$ 39,377$ 57,365$ 96,741$ 14,341$
NCR 26,385$ 11,466$ 11,936$ 23,401$ 2,984$
OR 62,208$ 23,212$ 31,196$ 54,409$ 7,799$
SWR 56,505$ 29,638$ 21,494$ 51,132$ 5,373$
SCR 44,256$ 19,919$ 19,470$ 39,389$ 4,867$
ER 45,682$ 22,490$ 18,554$ 41,044$ 4,638$
424,993$ 198,471$ 181,218$ 379,689$ 45,304$

Page 22
Section 6
Analysis of Change in Rates from Prior Plan Year
Materials Laboratory
As stated before, all rates contain three elements: 1) direct labor to cover the employee’s time to perform the
work, 2) indirect labor to cover a portion of time of employees who are unable to charge their work to specific
projects and 3) indirect non-labor for goods and services not attributable to specific tests or services. The indirect
charges, both labor and non-labor are charged evenly to ALL the rates and comprise only 10% of the most common
hourly rate. Direct labor is also charged to ALL rates however, the amount of direct labor charged to an individual
rate varies with the mix of classifications of the employees performing that activity. Currently, the direct labor
component ranges from $48.22 to $75.83 per hour. Individual rates may vary from year to year when the mix of
classifications for the people performing the service fluctuates.
Certain rates have additional charges for equipment leases and travel. When travel is applied to rates, it is applied
uniformly to all the rates which include a travel component. When equipment is applied to rates variability
typically exists. Year-to-year variability may be due to fluctuating TEF lease rates OR to changes in the number of
hours that a piece of equipment is used, OR both.
In FY15, the AVERAGE rate will consist of: 50% direct labor, 31% indirect labor, 10% indirect non-labor, and 9%
direct travel and equipment charges.
Factors that Affect the Rates
Key Drivers to the FY 2015 Rate Changes
There are offsetting pressures on the cost recovery rates and the net effect is that no overall rate change is
currently recommended for FY15 at the time of plan submission.
Key Drivers on all RatesDriver Delta $$ % Rate Chg $$ Rate Chg
Negative Drivers (rates up)
Cost rates up 2% $345,807 1.6% $1.75
Increase Non-Labor Overhead $177,029 0.8% $0.90
Positive Drivers (rates down)
Increased Direct Charges (Recoveries) -$223,601 -1.0% -$1.13
Decrease Direct Equipment -$244,179 -1.1% -$1.24
Decrease Direct Travel -$34,924 -0.2% -$0.18
Net Drivers $20,131 $0 $0.10
Page 23
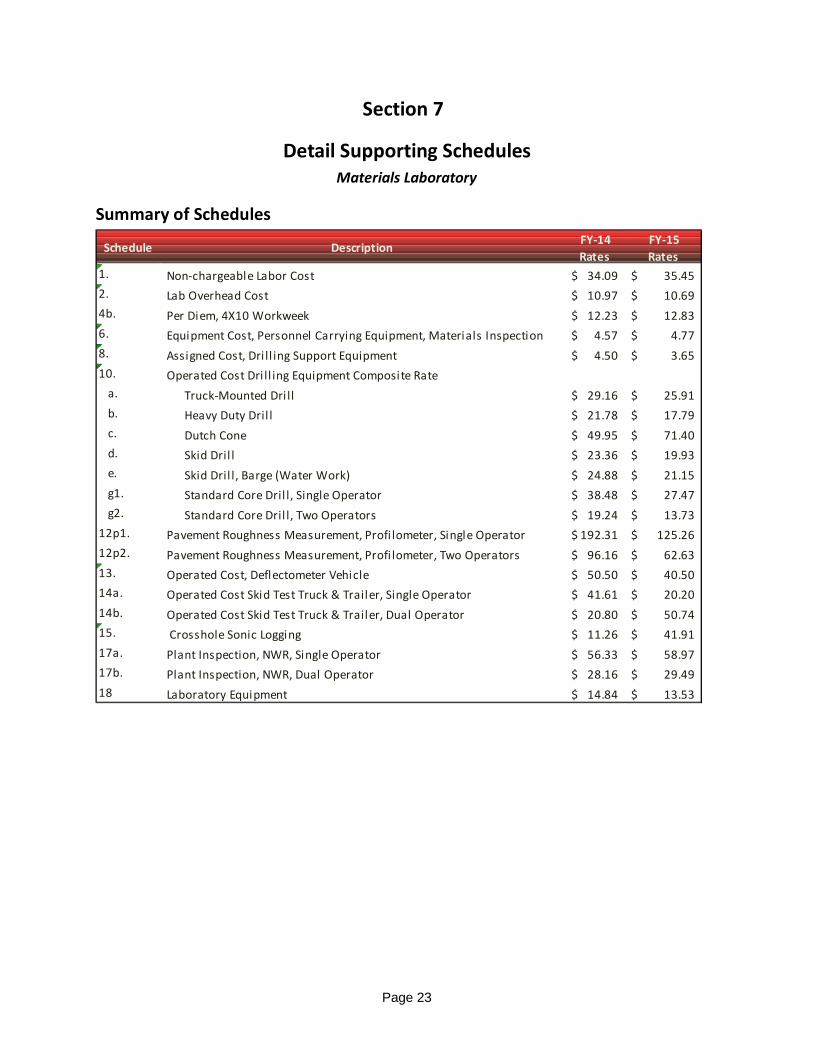
Section 7
Detail Supporting Schedules
Materials Laboratory
Summary of Schedules
Schedule Description FY-14
Rates
FY-15
Rates
1. Non-chargeable Labor Cost 34.09$ 35.45$
2. Lab Overhead Cost 10.97$ 10.69$
4b. Per Diem, 4X10 Workweek 12.23$ 12.83$
6. Equipment Cost, Personnel Carrying Equipment, Materials Inspection 4.57$ 4.77$
8. Assigned Cost, Dri ll ing Support Equipment 4.50$ 3.65$
10. Operated Cost Dri ll ing Equipment Composite Rate
a. Truck-Mounted Dri ll 29.16$ 25.91$
b. Heavy Duty Dril l 21.78$ 17.79$
c. Dutch Cone 49.95$ 71.40$
d. Skid Dril l 23.36$ 19.93$
e. Skid Dril l, Barge (Water Work) 24.88$ 21.15$
g1. Standard Core Dril l, Single Operator 38.48$ 27.47$
g2. Standard Core Dril l, Two Operators 19.24$ 13.73$
12p1. Pavement Roughness Measurement, Profi lometer, Single Operator 192.31$ 125.26$
12p2. Pavement Roughness Measurement, Profi lometer, Two Operators 96.16$ 62.63$
13. Operated Cost, Deflectometer Vehicle 50.50$ 40.50$
14a. Operated Cost Skid Test Truck & Trailer, Single Operator 41.61$ 20.20$
14b. Operated Cost Skid Test Truck & Trailer, Dual Operator 20.80$ 50.74$
15. Crosshole Sonic Logging 11.26$ 41.91$
17a. Plant Inspection, NWR, Single Operator 56.33$ 58.97$
17b. Plant Inspection, NWR, Dual Operator 28.16$ 29.49$
18 Laboratory Equipment 14.84$ 13.53$

Page 24
Equipment Rate Summary
Class Description FY 2014 FY 2015
01 C 10 Caravan $ 2.91 $ 2.94
01 C 30 Es cape $ 4.22 $ 3.60
02 C 04 Express $ 4.46 $ 4.58
02 C 40 Van w/Road Profi lometer $ 28.90 $ 40.71
05 C 08 F250 4x4 $ 6.53 $ 6.50
05 C 08 F350 4x4 $ 6.53 $ 6.50
05 C 11 Colorado $ 3.60 $ 3.54
05 C 20 F150 4x4 $ 4.57 $ 4.58
05 C 32 2500 Quadcab $ 5.24 $ 5.31
8-1 Truck and Trai ler; Skid Tester $ 25.51 $ 25.67
8-23 Truck; Flatbed; Single Axle, without Crane $ 7.51 $ 7.33
8-25 Truck, Flatbed; Tandem Axle, with Crane (currently d-final status) $ 9.65 $ 9.28
8-53 Boom Truck $ 12.33 $ 12.33
9-1 Truck, w/Earth Dril ling Unit $ 19.69 $ 19.76
9-2 Dril l Unit; Track Mounted $ 22.83 $ 22.87
9-3 Dril l Unit, Trai ler Mounted $ 3.79 $ 4.12
9-4 Dril l Unit; Skid Mounted $ 10.62 $ 10.11
9-7 Dril l Unit; Track Mounted $ 16.59 $ 16.78
9-22 Truck; Dri ll Unit Support $ 13.25 $ 12.30
9-30 Truck; Electronic Cone Penetrometer, $ 7.08 $ 7.14
10-5 Tilt Trailer, 2 Axle, 40,000 Lbs $ 1.95 $ 2.02
10-12 Tilt Trailer, 2 Axle, 24,000 Lbs $ 1.48 $ 1.52
10-14 Util ity Trailer, 3,000 GVW $ 0.68 $ 0.76
20-11 Outboard Boat, $ 1.83 $ 1.88
20-13 Barge Dril l w/Pusher Skiff $ 2.37 $ 2.41
21-26 Deflectometer, Trai ler Mounted (currently in d-final status) $ 0.77 $ 0.81
Page 25
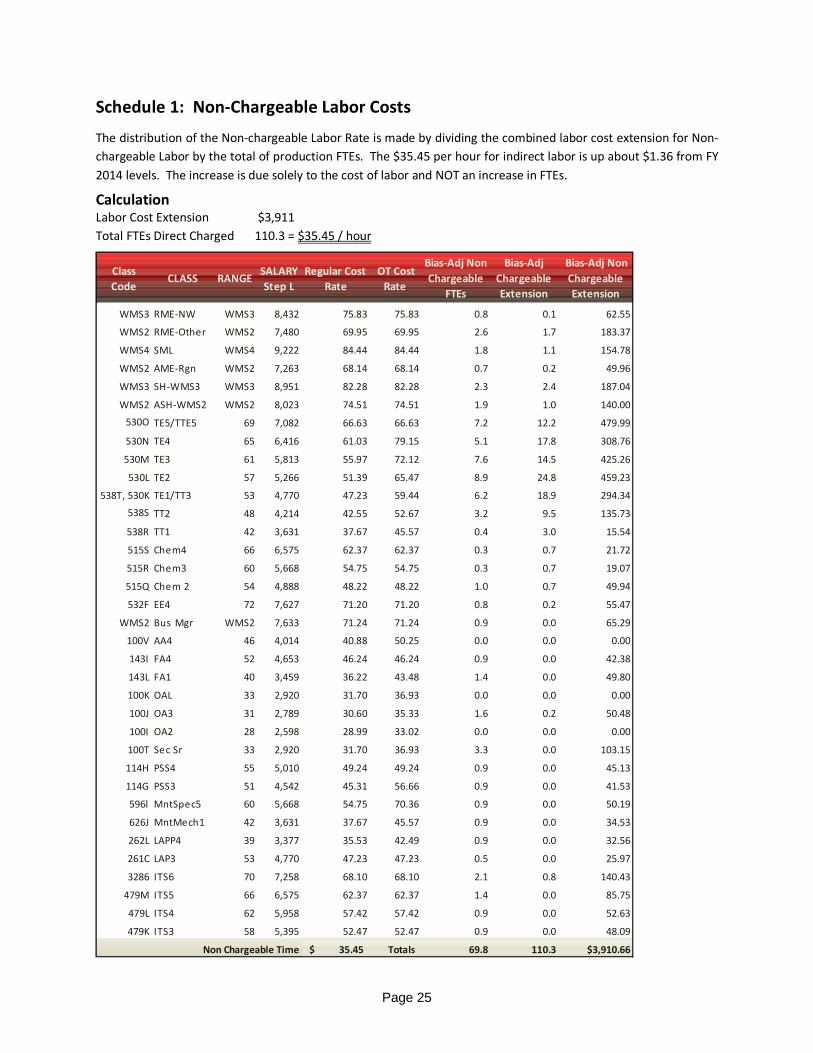
Schedule 1: Non-Chargeable Labor Costs
The distribution of the Non-chargeable Labor Rate is made by dividing the combined labor cost extension for Non-
chargeable Labor by the total of production FTEs. The $35.45 per hour for indirect labor is up about $1.36 from FY
2014 levels. The increase is due solely to the cost of labor and NOT an increase in FTEs.
Calculation Labor Cost Extension $3,911
Total FTEs Direct Charged 110.3 = $35.45 / hour
Class
Code CLASS RANGE
SALARY
Step L
Regular Cost
Rate
OT Cost
Rate
Bias-Adj Non
Chargeable
FTEs
Bias-Adj
Chargeable
Extension
Bias-Adj Non
Chargeable
Extension
WMS3 RME-NW WMS3 8,432 75.83 75.83 0.8 0.1 62.55
WMS2 RME-Other WMS2 7,480 69.95 69.95 2.6 1.7 183.37
WMS4 SML WMS4 9,222 84.44 84.44 1.8 1.1 154.78
WMS2 AME-Rgn WMS2 7,263 68.14 68.14 0.7 0.2 49.96
WMS3 SH-WMS3 WMS3 8,951 82.28 82.28 2.3 2.4 187.04
WMS2 ASH-WMS2 WMS2 8,023 74.51 74.51 1.9 1.0 140.00
530O TE5/TTE5 69 7,082 66.63 66.63 7.2 12.2 479.99
530N TE4 65 6,416 61.03 79.15 5.1 17.8 308.76
530M TE3 61 5,813 55.97 72.12 7.6 14.5 425.26
530L TE2 57 5,266 51.39 65.47 8.9 24.8 459.23
538T, 530K TE1/TT3 53 4,770 47.23 59.44 6.2 18.9 294.34
538S TT2 48 4,214 42.55 52.67 3.2 9.5 135.73
538R TT1 42 3,631 37.67 45.57 0.4 3.0 15.54
515S Chem4 66 6,575 62.37 62.37 0.3 0.7 21.72
515R Chem3 60 5,668 54.75 54.75 0.3 0.7 19.07
515Q Chem 2 54 4,888 48.22 48.22 1.0 0.7 49.94
532F EE4 72 7,627 71.20 71.20 0.8 0.2 55.47
WMS2 Bus Mgr WMS2 7,633 71.24 71.24 0.9 0.0 65.29
100V AA4 46 4,014 40.88 50.25 0.0 0.0 0.00
143I FA4 52 4,653 46.24 46.24 0.9 0.0 42.38
143L FA1 40 3,459 36.22 43.48 1.4 0.0 49.80
100K OAL 33 2,920 31.70 36.93 0.0 0.0 0.00
100J OA3 31 2,789 30.60 35.33 1.6 0.2 50.48
100I OA2 28 2,598 28.99 33.02 0.0 0.0 0.00
100T Sec Sr 33 2,920 31.70 36.93 3.3 0.0 103.15
114H PSS4 55 5,010 49.24 49.24 0.9 0.0 45.13
114G PSS3 51 4,542 45.31 56.66 0.9 0.0 41.53
596l MntSpec5 60 5,668 54.75 70.36 0.9 0.0 50.19
626J MntMech1 42 3,631 37.67 45.57 0.9 0.0 34.53
262L LAPP4 39 3,377 35.53 42.49 0.9 0.0 32.56
261C LAP3 53 4,770 47.23 47.23 0.5 0.0 25.97
3286 ITS6 70 7,258 68.10 68.10 2.1 0.8 140.43
479M ITS5 66 6,575 62.37 62.37 1.4 0.0 85.75
479L ITS4 62 5,958 57.42 57.42 0.9 0.0 52.63
479K ITS3 58 5,395 52.47 52.47 0.9 0.0 48.09
35.45$ Totals 69.8 110.3 $3,910.66Non Chargeable Time

Page 26
Schedule 2: Laboratory Overhead
Materials lab overhead is defined as expenditures, other than labor, that cannot be directly charged to projects.
The steps for determining Materials Lab overhead is summarized as follows:
1. Determine non-labor expenditures for the baseline year.
2. Subtract equipment and travel costs that were recovered through the rates in the baseline year.
3. Make line item adjustments for significant changes to the plan year from the baseline year.
4. Apply the Implicit Price Deflator (IPD) to expenditures carried forward from the previous fiscal year (i.e.
excludes expenditures from step 2 & 3).
5. Add up the total annual overhead (i.e. inflation adjusted expenditures and line items).
6. Divide the total by the number of production FTEs (per schedule 1).
7. Divide the result by number production hours in a year (1,790) to determine the hourly overhead rate.
Lab overhead is down approximately $.30 from FY14 levels.
Lab Overhead Calculation
Schedule 5: Per Diem
Overhead Calculation
Previous Year Expenditures (Basel ine) 4,203,285
Less Equip & Travel Recovered Through Rates 2,236,627
Unadjusted Overhead Costs 1,966,658
Plus/Minus Net Line Item Adjustments: 120,169
Adjusted Overhead Costs 2,086,827
Inflation (ECRF IPD, 1.19% for FY 2015) 24,833
Inflation Adjusted Overhead Costs 2,111,660
Divided by Number of Production FTEs 110.3
Overhead Cost per Production FTE 19,145
Divided by Production Hours in Year 1,790
Hourly Lab Overhead Rate $10.69
Schedule 5 Per Diem for Traveling Crews, (four ten-hour days)
Breakfast Lunch DinnerTotal
Subsistence# Nights
Cost Per
Night
Total
LodgingTotal Nightly Hourly
Monday 18 28 46
Tue - Wed 15 18 28 122
Thurs day 15 18 33
201.00 3.00 104 312 513 171 12.83$

Page 27
Schedule 6: Materials Inspector Vehicles Materials and Prestress Inspection Equipment rates have assigned cost for class 1 thru 5. Rate for cost recovery
can be obtained by factoring assigned cost against expected work time and weighting based on the units assigned
to inspector use.
Calculation Assigned rate x number units x 2,000 hours:
1. Based on 2,000 hr./year/piece equipment.
2. Personnel engaged in materials and pre-stress inspection
3. Number of hours per labor-year.
Schedule 8: Drill Crew Support Vehicles
Calculation
Cost per labor hour equals assigned rate x number of units x 2,000 hours, based on 2,000 hour/ year assigned time.
Drilling rates calculated on basis of cost recovery for 2-person crew with inspector as separate charge.
1. Based on 2,000 hr./year/piece equipment.
2. Total personnel involved in test drilling (5 crews, driller and helper only, 3 Field Exploration Supervisors)
3. Number of hours per labor-year.
Schedule 6, Materials Inspector's Vehicles
Status Class Make ModelNo. Rigs
FY14
No. Rigs
FY15
2013
Rate
2014
Rate
Assigned
FY13 Rate
Assigned
FY14 Rate
Cost Per
Labor Hour
Active 01 C 10 Dodge Caravan 4 2 2.91 2.94 23,280 11,760
Active 01 C 30 Ford Escape 9 9 3.54 3.6 63,720 64,800
Active 05 C 11 Chev Colorado 1 1 3.6 3.54 7,200 7,080
Active 02 C 04 Chev Express 1 1 4.46 4.48 8,920 8,960
Total Annual Lease Costs 103,120 92,600 4.33$
Schedule 8, Drill Crew Pickups
Status Class Make Model No. 2014 2015Assigned
Yearly Rate
FTEs Direct
Charged
Cost Per
FTE
Cost Per
Labor Hour
Active 05 C 08 Ford F250 4x4 1 6.53 6.50 13,000
Active 05 C 08 Ford F350 4x4 5 6.53 6.50 65,000
Active 05 C 11 Chev Colora do 1 3.60 3.54 7,080
Active 05 C 20 Ford F150 4x4 1 4.57 4.58 9,160
Active 05 C 32 Dodge 2500 Qua dca b 1 5.24 5.31 10,620
Total Annual Lease Costs 105,180 104,860 104,860 14.56 7,202 4.02$
Page 28
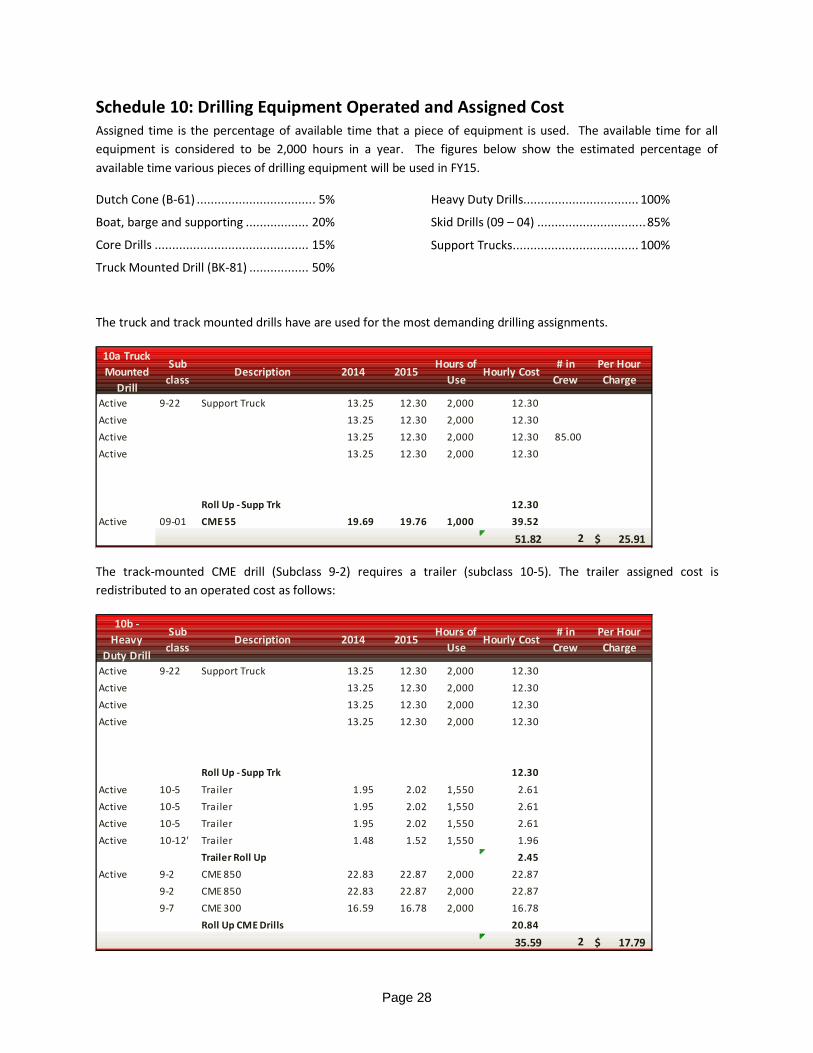
Schedule 10: Drilling Equipment Operated and Assigned Cost
Assigned time is the percentage of available time that a piece of equipment is used. The available time for all
equipment is considered to be 2,000 hours in a year. The figures below show the estimated percentage of
available time various pieces of drilling equipment will be used in FY15.
Dutch Cone (B-61) .................................. 5%
Boat, barge and supporting .................. 20%
Core Drills ............................................ 15%
Truck Mounted Drill (BK-81) ................. 50%
Heavy Duty Drills................................. 100%
Skid Drills (09 – 04) ............................... 85%
Support Trucks .................................... 100%
The truck and track mounted drills have are used for the most demanding drilling assignments.
The track-mounted CME drill (Subclass 9-2) requires a trailer (subclass 10-5). The trailer assigned cost is
redistributed to an operated cost as follows:
10a Truck
Mounted
Drill
Sub
classDescription 2014 2015
Hours of
UseHourly Cost
# in
Crew
Per Hour
Charge
Active 9-22 Support Truck 13.25 12.30 2,000 12.30
Active 13.25 12.30 2,000 12.30
Active 13.25 12.30 2,000 12.30 85.00
Active 13.25 12.30 2,000 12.30
Roll Up - Supp Trk 12.30
Active 09-01 CME 55 19.69 19.76 1,000 39.52
51.82 2 25.91$
10b -
Heavy
Duty Drill
Sub
classDescription 2014 2015
Hours of
UseHourly Cost
# in
Crew
Per Hour
Charge
Active 9-22 Support Truck 13.25 12.30 2,000 12.30
Active 13.25 12.30 2,000 12.30
Active 13.25 12.30 2,000 12.30
Active 13.25 12.30 2,000 12.30
Roll Up - Supp Trk 12.30
Active 10-5 Trailer 1.95 2.02 1,550 2.61
Active 10-5 Trailer 1.95 2.02 1,550 2.61
Active 10-5 Trailer 1.95 2.02 1,550 2.61
Active 10-12' Trailer 1.48 1.52 1,550 1.96
Trailer Roll Up 2.45
Active 9-2 CME 850 22.83 22.87 2,000 22.87
9-2 CME 850 22.83 22.87 2,000 22.87
9-7 CME 300 16.59 16.78 2,000 16.78
Roll Up CME Drills 20.84
35.59 2 17.79$

Page 29
The Dutch Cone is a self-contained unit and is only used for Dutch Cone work. Redistribution of the Dutch Cone
assigned cost is based on 5% usage.
While capable of significantly different production rates, the skid drill has costs similar to the truck mounted and
heavy drills. It is used in terrain that is not conducive to vehicles with wheels.
10c - Dutch
Cone
Sub
classDescription 2014 2015
Hours of
UseHourly Cost
# in
Crew
Per Hour
Charge
Active 09-30 Dutch Cone 7.08 7.14 100 142.80
142.80 2 71.40$
10d - Skid
Drill
Sub
classDescription 2014 2015
Hours of
UseHourly Cost
# in
Crew
Per Hour
Charge
Active 9-4 Drill 10.62 10.11 1,700 11.89
Active 10.62 10.11 1,700 11.89
Active 10.62 10.11 1,700 11.89
Roll Up - Drill 11.89
Active 9-22 Support Truck 13.25 12.30 2,000 12.30
Active 13.25 12.30 2,000 12.30
Active 13.25 12.30 2,000 12.30
Active 13.25 12.30 2,000 12.30
Roll Up - Supp Trk 12.30
Active 8-53 Boom Truck 12.33 12.33 1,700 14.51
Active 9-23 Boom Truck 13.91 13.81 1,700 16.25
Active 9-23 Boom Truck 13.91 13.81 1,700 16.25
Roll Up - Boom Trk 15.67
39.86 2 19.93$

Page 30
Water work activities require auxiliary floating and support equipment in addition to the drill unit. Estimated
usage is 400 hours per year. This configuration was used extensively on I-520 and CRC but that work is beginning
to subside.
10e - Tripod or
Skid Drill, Water
Work
Sub
classDescription 2014 2015
Hours of
Use
Adjusted
Rate
# in
Crew
Per Hour
Charge
Active 9-4 Drill 10.62 10.11 1,700 11.89
Active 10.62 10.11 1,700 11.89
Active 10.62 10.11 1,700 11.89
Roll Up - Drill 11.89
Active 9-22 Support Truck 13.25 12.30 2,000 12.30
Active 13.25 12.30 2,000 12.30
Active 13.25 12.30 2,000 12.30
Active 13.25 12.30 2,000 12.30
Roll Up - Supp Trk 12.30
Active 20-11 Outboard boat 1.83 1.88 400 9.40
Active 8-23 Flatbed truck w/o crane 7.51 7.33 400 36.65
Active 25-2 Generator 1.81 1.88 400 9.40
Active 20-13 Barge, Pontoon 2.37 2.41 400 12.05
Roll Up - Water Wrk Eqp 16.88
Active 10-5 Trailer 1.95 2.02 1,550 2.61
Active 10-5 Trailer 1.95 2.02 1,550 2.61
Active 10-5 Trailer 1.95 2.02 1,550 2.61
Active 10-12' Trailer 1.48 1.52 1,550 1.96
Trailer Roll Up 2.45
Active 8-53 Boom Truck 12.33 12.33 1,700 14.51
Active 9-23 Boom Truck 13.91 13.81 1,700 16.25
Active 9-23 Boom Truck 13.91 13.81 1,700 16.25
Roll Up - Boom Trk 15.67
42.31 2 21.15$

Page 31
Schedule 10G: Incidental Drilling - Region Pavement Coring
The Class 5 vehicles used to transport the core drills are distributed over the laboratory overhead leaving the
recovered cost item to be the core drill itself. Depending on the operation, the core drill can be operated by either
a single operator or with two operators. Core drill usage will increase in FY 15.
Schedule 12: Pavement Roughness Measurement
As with Core Drilling, the Profilometer vehicles can be operated by either one or two operators. These vans are
extremely expensive so we have them specially insured at the full replacement cost of $800K, subject to a $100K
deductible. The rate increase for FY15 is due to the anticipated replacement of a fully depreciated van with a new
one, which will increase the TEF rates significantly.
Schedule 13: Falling Weight Deflectometer Vehicle (FWD)
10g1 - Standard
Core Drill
Sub
classDescription 2014 2015
Hours of
Use
Adjusted
Rate
# in
Crew
Per Hour
Charge
9-3 Trailer Mounted Drill 3.79 4.12 300 27.47 1.00
27.47 1 27.47$
10g2 - Standard
Core Drill
Sub
classDescription 2014 2015
Hours of
Use
Adjusted
Rate
No in
Crew
Per Hour
Charge
9-3 Trailer Mounted Drill 3.79 4.12 300 27.47 2.00
27.47 2 13.73$
Schedule 12 P-1, Pavement Roughness Measurement Profilometer Equipment, Single Operator
Status Subclass Description 2014 2015Estimated
Hours of Use
Adjusted
Rate
No in
Crew
Per Hour
Charge
Acti ve 02-40 Profi lometer 28.9 40.71 500 162.84 1 162.84
Acti ve 02-40 Profi lometer 28.9 40.71 500 162.84 1 162.84
Total Annual Lease Costs 115,600 162,840 162.84$
Schedule 12 P-2, Pavement Roughness Measurement Profilometer Equipment, Dual Operator
Status Subclass Description 2014 2015Estimated
Hours of Use
Adjusted
Rate
No in
Crew
Per Hour
Charge
Acti ve 02-40 Profi lometer 28.9 40.71 500 162.84 2 81.42
Acti ve 02-40 Profi lometer 28.9 40.71 500 162.84 2 81.42
Total Annual Lease Costs 115,600 162,840 81.42$
Schedule 13, FWD
Status Subclass Description 2012 2013Hours of
Use
Adjusted
Rate
No in
Crew
Per Hour
Charge
D Fina l 21-26 FWD 0.77 0.81 40 40.50 1 40.50Total Annual
Lease Costs 40.50$
Page 32
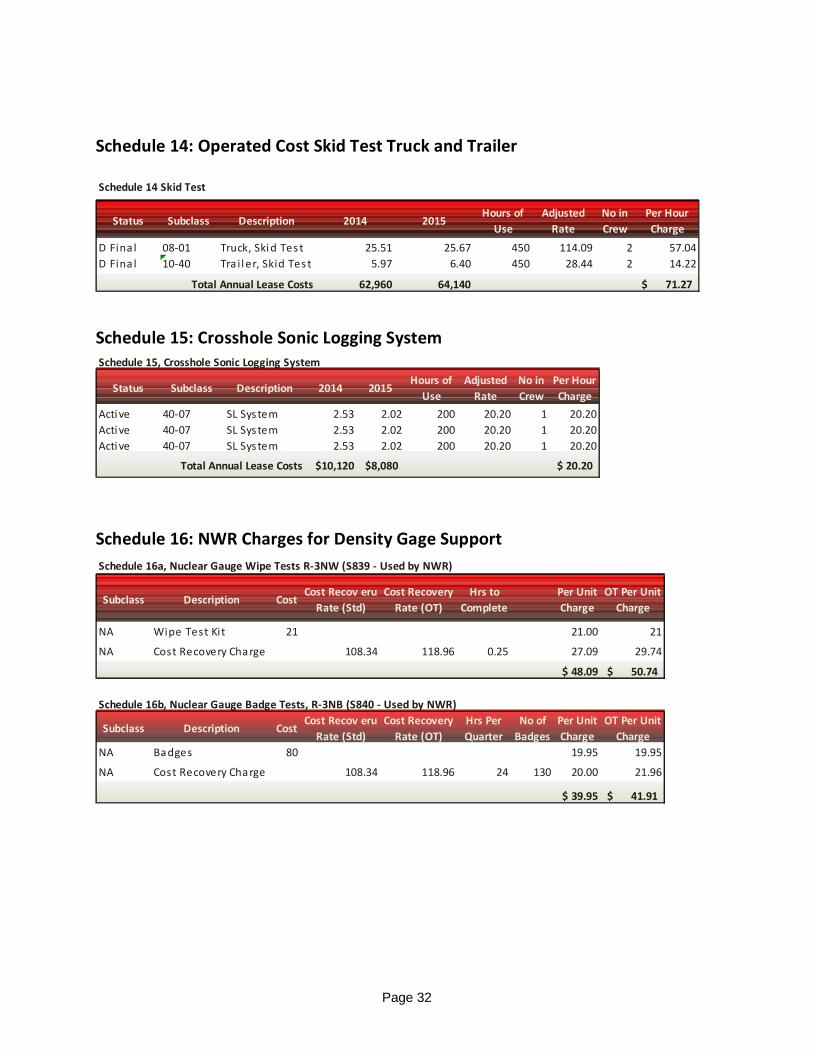
Schedule 14: Operated Cost Skid Test Truck and Trailer
Schedule 15: Crosshole Sonic Logging System
Schedule 16: NWR Charges for Density Gage Support
Schedule 14 Skid Test
Status Subclass Description 2014 2015Hours of
Use
Adjusted
Rate
No in
Crew
Per Hour
Charge
D Fina l 08-01 Truck, Ski d Tes t 25.51 25.67 450 114.09 2 57.04
D Fina l 10-40 Tra i l er, Skid Tes t 5.97 6.40 450 28.44 2 14.22
Total Annual Lease Costs 62,960 64,140 71.27$
Schedule 15, Crosshole Sonic Logging System
Status Subclass Description 2014 2015Hours of
Use
Adjusted
Rate
No in
Crew
Per Hour
Charge
Acti ve 40-07 SL Sys tem 2.53 2.02 200 20.20 1 20.20
Acti ve 40-07 SL Sys tem 2.53 2.02 200 20.20 1 20.20
Acti ve 40-07 SL Sys tem 2.53 2.02 200 20.20 1 20.20
Total Annual Lease Costs $10,120 8,080$ 20.20$
Schedule 16a, Nuclear Gauge Wipe Tests R-3NW (S839 - Used by NWR)
Subclass Description CostCost Recov eru
Rate (Std)
Cost Recovery
Rate (OT)
Hrs to
Complete
Per Unit
Charge
OT Per Unit
Charge
NA Wipe Test Kit 21 21.00 21
NA Cost Recovery Charge 108.34 118.96 0.25 27.09 29.74
$ 48.09 50.74$
Schedule 16b, Nuclear Gauge Badge Tests, R-3NB (S840 - Used by NWR)
Subclass Description CostCost Recov eru
Rate (Std)
Cost Recovery
Rate (OT)
Hrs Per
Quarter
No of
Badges
Per Unit
Charge
OT Per Unit
Charge
NA Badges 80 19.95 19.95
NA Cost Recovery Charge 108.34 118.96 24 130 20.00 21.96
$ 39.95 41.91$
Page 33
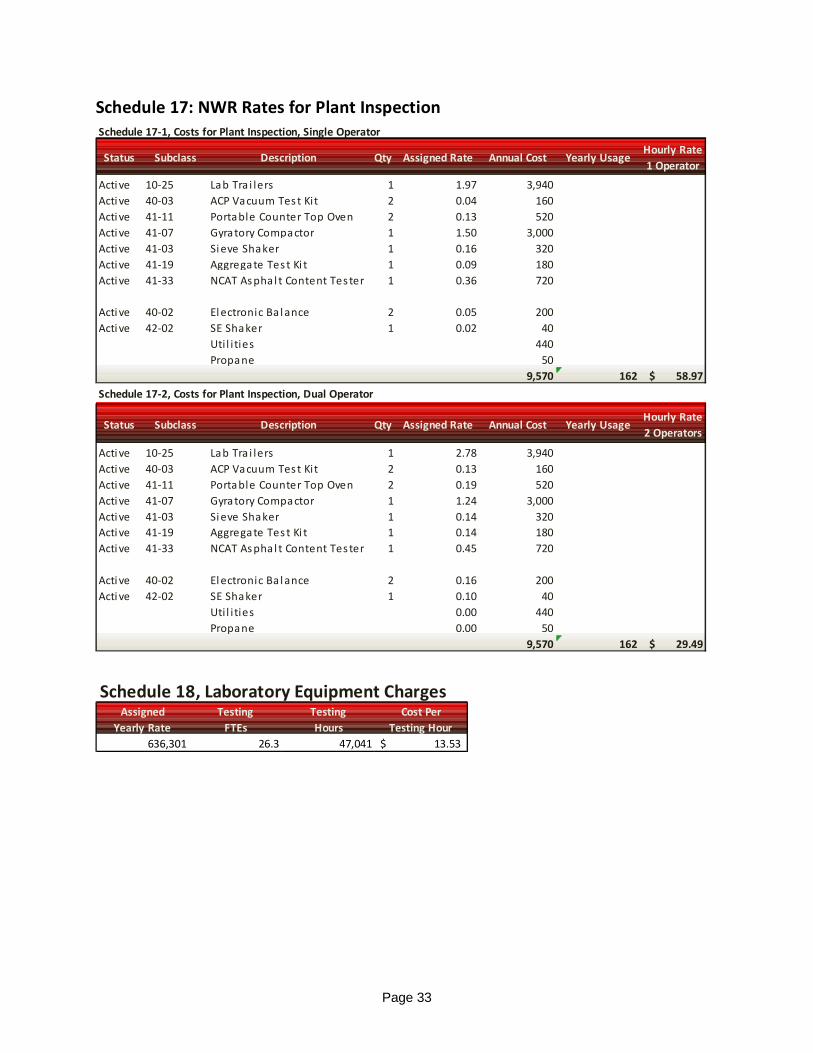
Schedule 17: NWR Rates for Plant Inspection
Schedule 17-1, Costs for Plant Inspection, Single Operator
Status Subclass Description Qty Assigned Rate Annual Cost Yearly UsageHourly Rate
1 Operator
Acti ve 10-25 Lab Tra i lers 1 1.97 3,940
Acti ve 40-03 ACP Vacuum Tes t Kit 2 0.04 160
Acti ve 41-11 Portable Counter Top Oven 2 0.13 520
Acti ve 41-07 Gyratory Compactor 1 1.50 3,000
Acti ve 41-03 Si eve Shaker 1 0.16 320
Acti ve 41-19 Aggregate Tes t Ki t 1 0.09 180
Acti ve 41-33 NCAT As pha l t Content Tes ter 1 0.36 720
Acti ve 40-02 El ectronic Ba l ance 2 0.05 200
Acti ve 42-02 SE Shaker 1 0.02 40
Uti l i ties 440
Propane 50
9,570 162 $ 58.97
Schedule 17-2, Costs for Plant Inspection, Dual Operator
Status Subclass Description Qty Assigned Rate Annual Cost Yearly UsageHourly Rate
2 Operators
Acti ve 10-25 Lab Tra i lers 1 2.78 3,940
Acti ve 40-03 ACP Vacuum Tes t Kit 2 0.13 160
Acti ve 41-11 Portable Counter Top Oven 2 0.19 520
Acti ve 41-07 Gyratory Compactor 1 1.24 3,000
Acti ve 41-03 Si eve Shaker 1 0.14 320
Acti ve 41-19 Aggregate Tes t Ki t 1 0.14 180
Acti ve 41-33 NCAT As pha l t Content Tes ter 1 0.45 720
Acti ve 40-02 El ectronic Ba l ance 2 0.16 200
Acti ve 42-02 SE Shaker 1 0.10 40
Uti l i ties 0.00 440
Propane 0.00 50
9,570 162 $ 29.49
Schedule 18, Laboratory Equipment ChargesAssigned
Yearly Rate
Testing
FTEs
Testing
Hours
Cost Per
Testing Hour
636,301 26.3 47,041 $ 13.53

Page 34
Section 8
Cost Recovery Center Oversight
Materials Laboratory
WDSOT’s State Materials Lab cost recovery centers will be operated out of subprogram P5, Fund 108,
Appropriation A10 without expenditure authority. Quarterly meetings will be held to review the cost recovery
performance including monitoring for ineligible charges, areas of inefficiencies, current over and under balances
and appropriate rate adjustments.
The State Materials Lab cost recovery management team, Program Analysis and Management Services (PAMS),
Budget and AFS will determine if the remaining anticipated expenditures and revenue is on track to bring
over/under balances within a reasonable amount before fiscal year close. At the earliest point possible, If it is
anticipated that the remaining activity is not enough to close the gap, a rate adjustment in an amount necessary to
bring the gap within an acceptable amount will be immediately enacted upon formal approval from the Director of
Budget and Financial Analysis. All rate adjustments will not require a formal re-approval by FHWA of the original
plan if there is no change to methodology or unallowable costs.
At the end of each fiscal year of the State Materials Lab cost recovery center’s billing cycle, any over or under
balance will be reviewed with Capital Program Development and Management Office’s (CPDM) PAMS organization
and the Materials Lab cost recovery center management team. All under recoveries will reviewed with the director
of CPDM (or delegate) and they will provide the appropriate charge codes within the Preservation program
(Program P) to support the clearing of any remaining balance. The same process will be followed for any over
recoveries. AFS will provide FHWA with a yearly federal over/under billing reconciliation for each cost recovery
center detailing the total over/under billed amounts to all funding sources and amounts billed to the Federal
Government. No FHWA adjustment or repayment will be required for the over/under payments.

Page 35
Section 9
Certification of Cost Recovery Plan
Materials Laboratory
This is to certify that I have reviewed the cost allocation plan submitted herewith and to the best of my knowledge
and belief:
1. All costs included in this proposal are used to establish cost allocations or billings for Fiscal Year
2015 are allowable in accordance with the requirements of the Federal award(s) to which they
apply and 2 CFR Part 225, “Cost Principles for State and Local Governments.” Unallowable costs
have been adjusted for in allocating costs as indicated in the cost allocation plan.
2. All costs included in this proposal are properly allocable to Federal awards on the basis of a
beneficial or causal relationship between the expenses incurred and the agreements to which
they are allocated in accordance with applicable requirements. Further, the same costs that
have been treated as indirect costs have not been claimed as direct costs. Similar types of costs
have been accounted for consistently.
I declare that the foregoing is true and correct:
Governmental Unit: Washington State Department of Transportation
Signature:___________________________________
Name of Official: Bob Covington, CPA
Title: Director, Division of Accounting and Financial Services
Date of Execution: Month, Day, Year