Embed Size (px)
Citation preview

Market Guide for Augmented Analytics ToolsPublished: 30 October 2019 ID: G00433836
Analyst(s): Austin Kronz
Augmented analytic capabilities are disrupting analytics and BI and datascience and machine learning markets. Tools leverage ML/AI to transformhow analytics content is developed, consumed and shared. Data andanalytics leaders should plan to adopt augmented analytics as capabilitiesmature.
Key Findings■ Augmented analytics use machine learning (ML) to automate data preparation, insight
discovery, model development and insight sharing for a broad range of business users,operational workers and citizen data scientists.
■ Augmented analytics tools can identify the most important insights, based on statisticalsignificance, and, in more advanced tools, users’ preferences and business context/relevancy(location, role, time, etc.).
■ Analytics and business intelligence (ABI) and data science and machine learning (DSML)solutions and platforms often complement augmented capabilities with natural languageprocessing (NLP) and conversational interfaces, allowing all users to interact with data andinsights without requiring advanced skills.
■ Augmented analytics will make DSML model building accessible to new citizen data scienceroles (business analysts, developers and others) while making expert data scientists moreproductive, collaborative and less biased, freeing them for high-value tasks.
RecommendationsAs a data and analytics leader planning to use augmented analytics to modernize solutions, youshould:
■ Explore opportunities to complement existing data and analytics initiatives by pilotingaugmented analytics for business extension projects, tasks that currently involve time-consuming manual analysis and high-value business problems.
■ Observe the augmented analytics capabilities and roadmaps of established data and analyticsproviders, enterprise application vendors and startups. Assess the upfront setup, data
preparation, openness and explainability of models, as well as the number of variablessupported, the range of algorithms and model accuracy.
■ Develop a strategy to improve cross-skill-set collaboration which includes evolving roles,responsibilities and skills, and increase investments in data literacy, being cognizant of yourorganization’s perceptions and appetite for things like AI.
Strategic Planning AssumptionsBy 2021, augmented analytics will be a dominant driver of new purchases of analytics and businessintelligence (BI) as well as data science and machine learning (DSML) platforms, and of embeddedanalytics.
By 2021, NLP and conversational analytics will boost analytics and BI adoption from 35% ofemployees to over 50%, including new classes of users, particularly front-office workers.
By 2021, 50% of analytical queries will be generated via search, NLP or voice, or will beautomatically generated.
By 2025, a scarcity of data scientists will no longer hinder the adoption of data science andmachine learning in organizations.
By 2021, automation of data science tasks will enable citizen data scientists to produce a highervolume of advanced analysis than specialized data scientists.
Market DefinitionAugmented analytics is the use of machine learning (ML) automation and artificial intelligence (AI)techniques to augment human intelligence and contextual awareness. This is achieved byautomating pieces of data preparation tasks, data analysis, insight generation and explanationwithin analytics and BI platforms (ABI), as well as many aspects of data science and machinelearning (DSML) model development and consumption. As businesses become inundated with data,augmented analytics becomes crucial for presenting to users across the business only the insightsimportant for them to make a decision or take an action at that moment. It drives less-biaseddecisions and more-impartial contextual awareness — transforming how users interact with data,make decisions and act on insights. It expands who has access to insights from analytics bydelivering analytics anywhere and to everyone in the organization, and does so with less time, skilland interpretation bias than current manual approaches.
A similar trend involves augmented data management where AI and ML techniques are automatingmany aspects of database management, data quality, data integration, data cataloging, etc. Thismarket guide focuses on vendors providing augmented analytics capabilities — specificallyaugmented ABI and augmented DSML tools.
Page 2 of 27 Gartner, Inc. | G00433836
Market Description
Augmented analytics capabilities will rapidly achieve mainstream adoption as a key feature of datapreparation, modern analytics and BI and data science and machine learning platforms. Moreimportantly, automated insights will also be embedded in enterprise applications and conversationalanalytics — and thereby reach beyond citizen and expert data scientists to augment the capabilitiesof operational workers to make better decisions by leveraging insights from advanced analytics.
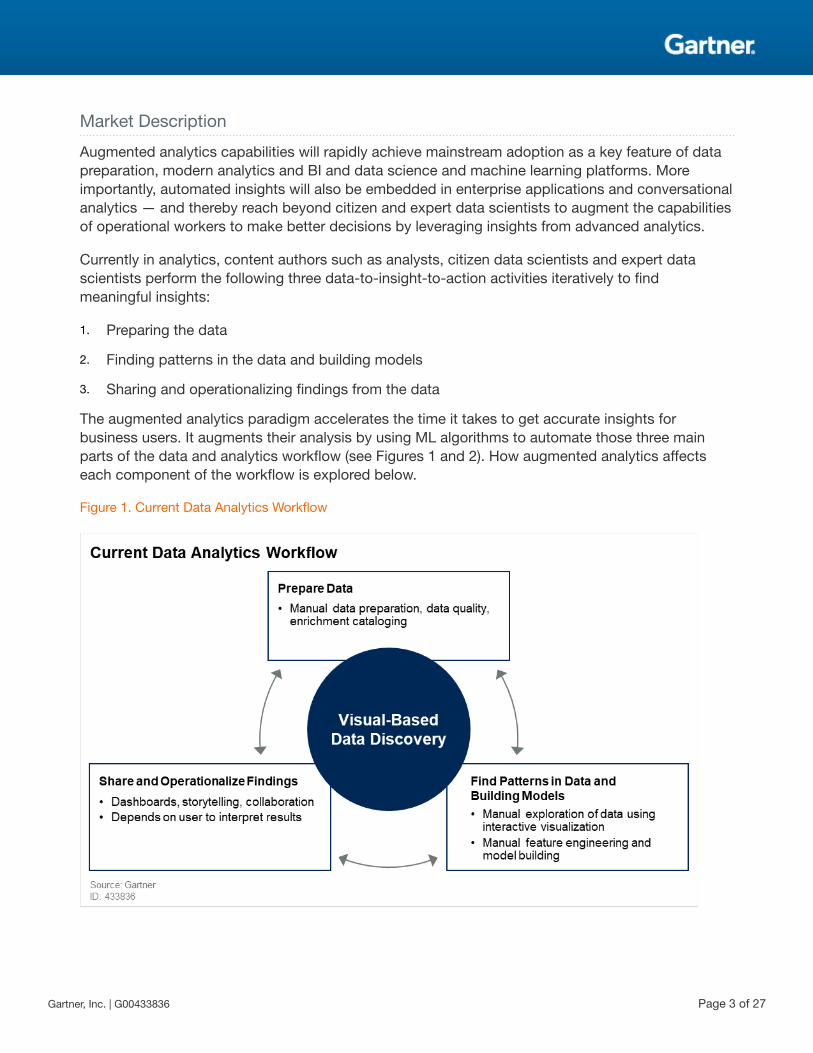
Currently in analytics, content authors such as analysts, citizen data scientists and expert datascientists perform the following three data-to-insight-to-action activities iteratively to findmeaningful insights:
1. Preparing the data
2. Finding patterns in the data and building models
3. Sharing and operationalizing findings from the data
The augmented analytics paradigm accelerates the time it takes to get accurate insights forbusiness users. It augments their analysis by using ML algorithms to automate those three mainparts of the data and analytics workflow (see Figures 1 and 2). How augmented analytics affectseach component of the workflow is explored below.
Figure 1. Current Data Analytics Workflow
Gartner, Inc. | G00433836 Page 3 of 27

Figure 2. Augmented Analytics Workflow
Market DirectionOver the past 10 years, visual-based data discovery tools have disrupted the traditional BI market.Visual-based data discovery capabilities have become the defining feature of modern analytics andBI platforms. These easy-to-use tools enable users to assemble data rapidly, explore hypothesesvisually and find new insights in data. They have transformed how business users explore data, incomparison with the IT-centric, semantic-layer-based approach of traditional BI platforms.
Page 4 of 27 Gartner, Inc. | G00433836

Visual-based data discovery features — now standard features of modern analytics and BIplatforms — are easy to use, because users analyze data by creating visual queries to investigatehypotheses. But when data sizes and the number of variables is large, it is not possible for users toexplore every possible pattern and combination, let alone determine whether their findings are themost relevant, significant and actionable. As a result, augmented analytics and business intelligence(BI) platforms are now the primary driver of the modern analytics and BI market (see “Forecast:Modern Business Intelligence Platforms by Selected Functionality, Worldwide, 2017-2022”).
Moreover, the idea that “a picture is worth a thousand words” has long been assumed in the field ofdata and analytics. And rightly so, as visualizations are a powerful and consumable way to find andcommunicate patterns in data (more so than tables or lists). However, they only highlight visualrelationships; they do not identify statistically significant findings. For example, a user may be ableto see visual differences between bars on a bar chart, but unless the size differences are stark itwould require further analysis to determine whether the differences are relevant, statisticallysignificant and actionable. Moreover, finding insights from advanced analytics — a key aspirationalgoal for most companies, particularly those facing rapid digital and industry change — requiresexpert data science skills, which are extremely scarce.
Visual-based data discovery with manual interactive explorationusing visualizations has been the defining feature of modernanalytics and BI platforms. Now, however, augmented analyticscharacterized by ML/AI automation of the insight discovery,exploration, explanation, prediction and prescription process isa defining feature of new-generation analytics and BI platforms(see Figure 3).
Augmented analytics can reduce time-consuming exploration and the identification of false andirrelevant insights. Applying a range of algorithms and ensemble learning to data in parallel, andexplaining actionable findings to users, reduces the risk of missing important insights in the data,when compared to manual exploration. It also can help optimize resulting decisions and actions byincluding in-line descriptions of underlying factors — or key drivers — causing a particular metric todeviate from a predetermined or statistical norm. This paradigm shift requires investment in dataliteracy throughout organizations, as insights are distributed to all employees (see “Toolkit: EnablingData Literacy and Information as a Second Language”).
Gartner, Inc. | G00433836 Page 5 of 27

Figure 3. Disruption Points in the Analytics and BI Market
Market AnalysisAugmented analytics includes augmented data preparation, augmented analytics and businessintelligence (augmented ABI), and augmented data science and machine learning (augmentedDSML) segments. Table 1 contains a list of key capabilities seen in each segment — while thismarket guide is focused on the augmented ABI and augmented DSML segments, the tools may(and typically do) have some or all of the capabilities in one or multiple segments listed. For a more
Page 6 of 27 Gartner, Inc. | G00433836

detailed analysis, examples and use cases, see “Augmented Analytics Is the Future of Data andAnalytics.”
Table 1. Augmented Analytics Capabilities
Category Example Capabilities Additional Information
AugmentedData Prep
■ Automated matching, joining,profiling, tagging and annotatingdata prior to data prep
■ Sensitive attribute recognition
■ Automate repetitivetransformations and integrations
■ Data quality and enrichmentrecommendations
Uses ML/AI automation to augment and accelerate dataprofiling and data quality, harmonization, modeling,manipulation, enrichment/inference, metadatadevelopment, and data cataloging (see “Market Guide forData Preparation Tools”). This augmentation trend is alsotransforming all aspects of data management, includingautomating data integration and database/data lakeadministration.
AugmentedABI
■ Automated descriptive insights
■ Key driver analysis
■ Segment and cluster identification
■ Anomaly/outlier detection
■ Forecasts/predictions
■ Contextualized/relevant insights
Automatically finds, visualizes and narrates importantfindings (such as correlations, exceptions, clusters, driversand predictions) in data that are relevant to users withoutrequiring them to build models or write algorithms. Usersmay explore data via visualizations and conversationalinterfaces, including natural language query (NLQ)technologies, supported by natural language generation(NLG) narration and interpretation of results or the moststatistically important findings in the user’s context.
AugmentedDSML
■ Automated feature generation/selection
■ Automated algorithm selection
■ Automated model-tuning
■ Automated model deployment andmonitoring
Uses ML/AI to automate key aspects of data science andML/AI modeling. Users may be business users or citizendata scientists looking to quickly prototype an idea. Highlyskilled data scientists can also be more productive withless bias and have more time to focus on creative tasksand on building and operationalizing the most relevantmodels (see “How Augmented Machine Learning IsDemocratizing Data Science”).
Source: Gartner (October 2019)
Representative VendorsThe vendors listed in this Market Guide do not imply an exhaustive list. This section is intended toprovide more understanding of the market and its offerings.
Market Introduction
The vendors and products listed and analyzed in this section are represented because they haveachieved some level of visibility and traction in this market (see Note 1). Vendors are widely diversein their capabilities. Gartner encourages data and analytics leaders to inspect the products under
Gartner, Inc. | G00433836 Page 7 of 27

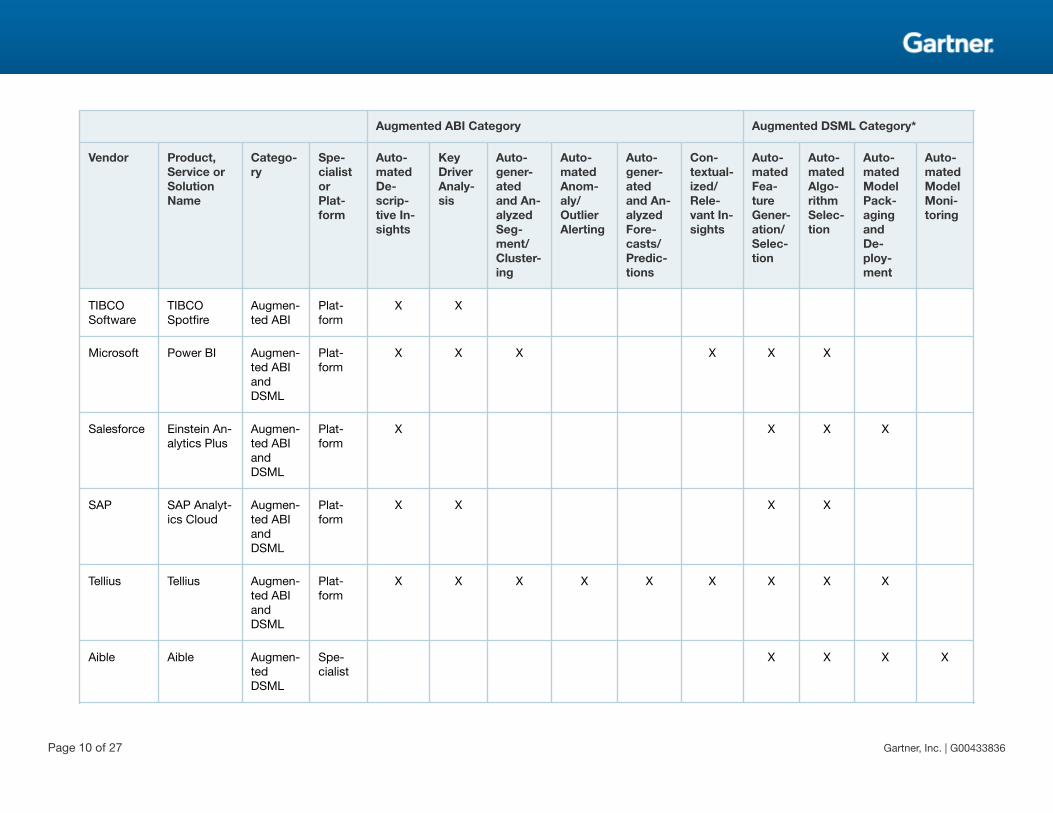
consideration for the detailed functionalities included in each of the core capabilities as well as thepotential broader capabilities outside the scope of this report (see “Critical Capabilities for Analyticsand Business Intelligence Platforms” and “Critical Capabilities for Data Science and MachineLearning Platforms”). Table 2 contains an example list of vendors and the augmented capabilitiesthey deliver by their respective product categories. It is possible, and increasingly common, forproducts to span both categories. See Note 3 for detailed definitions of each capability for thisMarket Guide.
Page 8 of 27 Gartner, Inc. | G00433836

Table 2. Augmented Analytics Capabilities by Vendor and Product Category
Augmented ABI Category Augmented DSML Category*
Vendor Product,Service orSolutionName
Catego-ry
Spe-cialistorPlat-form
Auto-matedDe-scrip-tive In-sights
KeyDriverAnaly-sis
Auto-gener-atedand An-alyzedSeg-ment/Cluster-ing
Auto-matedAnom-aly/OutlierAlerting
Auto-gener-atedand An-alyzedFore-casts/Predic-tions
Con-textual-ized/Rele-vant In-sights
Auto-matedFea-tureGener-ation/Selec-tion
Auto-matedAlgo-rithmSelec-tion
Auto-matedModelPack-agingandDe-ploy-ment
Auto-matedModelMoni-toring
Answer-Rocket
Answer-Rocket
Augmen-ted ABI
Plat-form
X X X X X
IBM IBM Cog-nos Analyt-ics
Augmen-ted ABI
Plat-form
X X
Oracle Oracle Ana-lytics Cloud
Augmen-ted ABI
Plat-form
X X X X
Outlier Outlier Augmen-ted ABI
Spe-cialist
X X X X X
Qlik Qlik Sense Augmen-ted ABI
Plat-form
X X X
SAS SAS VisualAnalytics
Augmen-ted ABI
Plat-form
X X X
Sisense Sisense Augmen-ted ABI
Plat-form
X X
Thought-Spot
Thought-Spot
Augmen-ted ABI
Plat-form
X X X X X
Gartner, Inc. | G00433836 Page 9 of 27
Augmented ABI Category Augmented DSML Category*
Vendor Product,Service orSolutionName
Catego-ry
Spe-cialistorPlat-form
Auto-matedDe-scrip-tive In-sights
KeyDriverAnaly-sis
Auto-gener-atedand An-alyzedSeg-ment/Cluster-ing
Auto-matedAnom-aly/OutlierAlerting
Auto-gener-atedand An-alyzedFore-casts/Predic-tions
Con-textual-ized/Rele-vant In-sights
Auto-matedFea-tureGener-ation/Selec-tion
Auto-matedAlgo-rithmSelec-tion
Auto-matedModelPack-agingandDe-ploy-ment
Auto-matedModelMoni-toring
TIBCOSoftware
TIBCOSpotfire
Augmen-ted ABI
Plat-form
X X
Microsoft Power BI Augmen-ted ABIandDSML
Plat-form
X X X X X X
Salesforce Einstein An-alytics Plus
Augmen-ted ABIandDSML
Plat-form
X X X X
SAP SAP Analyt-ics Cloud
Augmen-ted ABIandDSML
Plat-form
X X X X
Tellius Tellius Augmen-ted ABIandDSML
Plat-form
X X X X X X X X X
Aible Aible Augmen-tedDSML
Spe-cialist
X X X X
Page 10 of 27 Gartner, Inc. | G00433836

Augmented ABI Category Augmented DSML Category*
Vendor Product,Service orSolutionName
Catego-ry
Spe-cialistorPlat-form
Auto-matedDe-scrip-tive In-sights
KeyDriverAnaly-sis
Auto-gener-atedand An-alyzedSeg-ment/Cluster-ing
Auto-matedAnom-aly/OutlierAlerting
Auto-gener-atedand An-alyzedFore-casts/Predic-tions
Con-textual-ized/Rele-vant In-sights
Auto-matedFea-tureGener-ation/Selec-tion
Auto-matedAlgo-rithmSelec-tion
Auto-matedModelPack-agingandDe-ploy-ment
Auto-matedModelMoni-toring
Big Squid Kraken Augmen-tedDSML
Spe-cialist
X X X
DataRobot DataRobot Augmen-tedDSML
Plat-form
X X X X
DataSto-ries Inter-national
DataStoriesPlatform
Augmen-tedDSML
Spe-cialist
X X X
dotData dotData En-terprise
Augmen-tedDSML
Plat-form
X X X
H2O.ai H2O Driver-less AI
Augmen-tedDSML
Plat-form
X X X X
IBM WatsonStudio
Augmen-tedDSML
Plat-form
X X X
Gartner, Inc. | G00433836 Page 11 of 27

Augmented ABI Category Augmented DSML Category*
Vendor Product,Service orSolutionName
Catego-ry
Spe-cialistorPlat-form
Auto-matedDe-scrip-tive In-sights
KeyDriverAnaly-sis
Auto-gener-atedand An-alyzedSeg-ment/Cluster-ing
Auto-matedAnom-aly/OutlierAlerting
Auto-gener-atedand An-alyzedFore-casts/Predic-tions
Con-textual-ized/Rele-vant In-sights
Auto-matedFea-tureGener-ation/Selec-tion
Auto-matedAlgo-rithmSelec-tion
Auto-matedModelPack-agingandDe-ploy-ment
Auto-matedModelMoni-toring
Prevedere ERIN Augmen-tedDSML
Spe-cialist
X X X
SAS VisualData Miningand Ma-chineLearning
Augmen-tedDSML
Plat-form
X X
TIBCO DataScience
Augmen-tedDSML
Plat-form
X X X
*Note that many products delivering in the augmented DSML category may come with reports or explanations to assist citizen data scientists or even data scientists to better under-stand their data and automated predictive model outputs, but these are with respect to a predictive model building process (DSML) and therefore Xs will not be present under theaugmented ABI capabilities category.
Source: Gartner (October 2019)
Page 12 of 27 Gartner, Inc. | G00433836

Vendor Profiles
Aible
Product: Aible
Category: Augmented DSML
Focus: Contextualized augmented DSML via business-user input optimized for business value,augmented data preperation
Website: www.aible.com
Aible enables business people to build machine learning models and to take into account the factthat all costs and benefits are not equal when assessing which model is best. Aible starts with howthe model will impact your business and then assesses, ranks and allows for sensitive analysis ofvariables affecting the models based on business impact. The system uses business-orientedinputs given by a user to create the most impactful models based on those constraints, which userscan adjust for what-if analysis after the models are built.
Aible has also introduced blueprints for common types of analyses — such as: maximize sales winrate, optimize marketing campaigns, predict customer churn, and predict inventory stock-out — tomake it easier and quicker for business people to build and select models. Aible can also performautomated feature engineering to find new relationships in the data.
Once the Aible model is trained, it is then dockerized and can be deployed anywhere — in anyapplication, on any cloud platform or on-premises, at the user’s discretion. Aible can writepredictions back to enterprise applications, such as Salesforce, for users to consume in thebusiness applications which they work in.
AnswerRocket
Product: AnswerRocket
Category: Augmented ABI
Focus: Natural language search and automated insight generation combined with natural languagegeneration (NLG)
Website: www.answerrocket.com
AnswerRocket is an augmented data discovery platform with native capabilities in NLQ, NLG andautomated generation of insights. It enables users to ask questions and analyze data in naturallanguage and then generates insights and a narration to explain the findings. Users can askquestions or enter keywords in a search box, or via voice. It delivers drill-down and full, advanceddata exploration capabilities that can be shared or saved as a PDF, spreadsheet, or PowerPoint. Asthe user asks a question, AnswerRocket presents suggestions and surfaces relevant stories related
Gartner, Inc. | G00433836 Page 13 of 27

to the search topic. The queries can be sophisticated; for example, “How did my brand perform?”will automatically run a gradient boost algorithm to analyze and determine brand performancedrivers. Dashboards can also be scheduled and refreshed on demand.
AnswerRocket can be run on-premises or in the cloud via major public cloud providers, and anumber of supported data management solutions. The platform also supports the ability to plug inthird-party AI and ML frameworks such as scikit-learn and TensorFlow. AnswerRocket has a focus(tailored content) around the consumer-packaged goods, and also supports the retail andwholesale, financial services, media and entertainment, and e-commerce verticals.
Big Squid
Product: Kraken
Category: Augmented DSML
Focus: Augmented DSML for business users, integrated what-if scenarios
Website: www.bigsquid.com
Big Squid’s Kraken product augments many pieces of the machine learning model creation process,traditionally only able to be executed by expert-level data scientists. With Kraken, citizen datascientists and analysts can quickly connect to data and even other BI tools to begin buildingmodels.
Once connected, users simply have to choose a variable of interest and Kraken will handle thealgorithm selection, model training and testing. Kraken supports univariate time series, regressionand classification models. A visual representation of key drivers affecting the target variable isautomatically displayed in rank order, allowing business users and other non-data scientists toquickly see what has the greatest impact on the target variable.
Data scientists have the ability to dive deeper into the analysis to see which algorithms and modelswere attempted, their model score and other model performance statistics.
DataRobot
Product: DataRobot
Category: Augmented DSML
Focus: Augmented DSML for citizen data scientists and data scientists
Website: www.datarobot.com/platform
DataRobot is an augmented data science and machine learning platform that automates key tasksacross the end-to-end data science pipeline. The platform not only enables data scientists to workefficiently, but also enables citizen data scientists to build models quickly and easily.
Page 14 of 27 Gartner, Inc. | G00433836

DataRobot can connect to a multitude of data formats both on-premises and in the cloud andautomatically visualize things like descriptive statistics and missing values. The platform willautomatically perform operations like one-hot encoding, missing value imputation, text mining,standardization, and data partitioning. The platform transforms data into features that are optimizedfor each algorithm, and also allows users to include their own custom features if they have builtthem. DataRobot Automated Time Series integrates best practices in time series modeling, and canautomatically detect stationarity and seasonality, as well as transform the target and implementback-testing to achieve the highest possible accuracy.
Operationalization of ML models is delivered through DataRobot MLOps. The solution allows foreasy deployment on modern architectures like Kubernetes and Spark. DataRobot MLOps monitorsfor data drift, various ML model metrics, and infrastructure monitoring/alerting. Additionalcapabilities allow users to frequently update models, test new or competitive models and changeapplications on the fly without disrupting business applications or sacrificing governance bestpractices.
DataStories International
Product: DataStories
Category: Augmented DSML
Focus: Automated insight generation in the form of an interactive narrative
Website: datastories.com
DataStories leverages ML and AI techniques to automatically generate insights communicatedthrough interactive stories. DataStories is an augmented DSML vendor that allows business domainexperts, scientists and engineers to automatically analyze sensor and enterprise data to optimizecomplex R&D and manufacturing processes and performance. Whereas most augmented DSMLplatforms return models, DataStories takes a different approach — automatically generatinginteractive data stories so that domain experts can explore automated insights, key drivers of a KPI,and correlations and summary statistics of a data source. Data scientists can also leverage theunderlying autogenerated predictive model.
Once data is loaded into the system, DataStories automatically runs a range of algorithms on thedata. Model accuracy metrics and visualizations are displayed, along with the ability to upload newtest data to see how the model performs. Results are presented in an interactive narrative that canbe used to further explore and run sensitivity analyses on variables to optimize KPIs, or the storycan be exported to Microsoft PowerPoint. The models can be exported to C/C++, Excel, Matlab,Python or R. Interactive reports can be shared through the organization, and interactive graphicscan be exported as browser (HTML) files. DataStories SDK integrates with the Jupyter Notebookenvironment.
dotData
Product: dotData Enterprise
Gartner, Inc. | G00433836 Page 15 of 27

Category: Augmented DSML
Focus: AI-powered feature engineering including the ability to connect to multiple types of databeyond tabular datasets
Website: dotdata.com/dotdata-enterprise
The dotData Platform automates the entire data science process, by supporting multiple dataformats, including relational data sources, and allowing for automation of 100% of the data sciencecycle. This includes automated generation of features as well as automated selection & optimizationof machine learning models. ML models can be deployed into production using API-basedintegration.
dotData’s AI-powered feature engineering derives features based not only on mathematicaltransformations, but also by blending domain expertise to maximize the feature importance andincrease both model accuracy and relevancy. It automatically transforms source tables withcomplex relationships into a single “feature” table and makes the table ready for machine learning— typically exploring millions of features for predictive modeling.
The platform tests a multitude of different algorithms and automatically ranks the models based oneither predictive power or various accuracy metrics. Easy-to-understand visualizations aregenerated for users to help them understand the importance and impact of the features in themodel. API templates are automatically created to help easily move selected models to production.
H2O.ai
Product: H2O Driverless AI
Category: Augmented DSML
Focus: Ability to deploy explainable feature engineering and model selection pipeline in compactproduction-ready code, time series modeling, and NLP
Website: www.h2o.ai
H2O.ai offers the open-source H2O platform, along with additional open-source componentsincluding Sparkling Water for Spark integration, H2O4GPU and H2O AutoML. H2O.ai also offers acommercial product called H2O Driverless AI that uses automated machine learning.
H2O Driverless AI can automatically engineer new features for a given dataset. H2O Driverless AIcan also automatically generate both Python scoring pipelines and new ultra-low-latency automaticscoring pipelines. The new automatic scoring pipeline is a unique technology that deploys allfeature engineering and the winning machine learning model in a highly optimized, low-latencyproduction-ready Java code or C++ (with Python & R runtimes) that can be deployed anywhere.
H2O Driverless AI delivers time series capabilities to optimize for almost any prediction timewindow. It incorporates data from numerous predictors, handles structured character data as wellas high-cardinality categorical variables, and handles gaps in time series data and other missing
Page 16 of 27 Gartner, Inc. | G00433836

values. It also offers full explainability for every model produced using Shapley, K-LIME, PDP,disparate impact analysis and more.
IBM
Product: IBM Cognos Analytics; IBM Watson Studio
Category: Augmented ABI: Augmented DSML
Focus: Key driver analysis, natural language query with native NLG (IBM Cognos Analytics). RapidML experimentation for citizen data scientists (IBM Watson Studio)
Website: www.ibm.com/products/cognos-analytics
IBM Cognos Analytics combines production reporting capabilities with self-service dashboards andad hoc analysis within one modern analytics and BI platform. IBM Cognos Analytics version 11.1brought the former augmented analytics capabilities of IBM Watson Analytics into IBM CognosAnalytics. IBM Cognos Analytics is available both on-premises or as a hosted solution on the IBMCloud.
The latest release brings augmented analytics capabilities, with the ability to explore what drives aparticular metric. A unique network chart will display the relative importance of each driver. An AIassistant provides a conversational interface for users to pose questions, and to suggest other datasources and insights. An NLG capability has also been implemented.
The new AutoAI feature in IBM Watson Studio allows citizen data scientists to connect .csv files andautomatically build a series of machine learning models. The AutoAI feature currently only supportsclassification and regression models. Models can be packaged and accessed via other IBM sourcessuch as IBM Watson Machine Learning and IBM Watson OpenScale.
Microsoft
Product: Power BI
Category: Augmented ABI and DSML
Focus: Key driver analysis, augmented DSML via point and click ML model building available withinPower BI
Website: powerbi.microsoft.com
Microsoft offers data preparation, visual-based data discovery, interactive dashboards andaugmented analytics via a single product in Power BI.
Power BI Quick Insights can be run to automatically identify basic insights, correlations andpotential outliers via a set of visualizations. AI visualizations in Power BI automatically surface keydrivers affecting a given metric as well as segment data into interesting groups using decision trees.
Gartner, Inc. | G00433836 Page 17 of 27

Analysts are able to enhance their visualizations with forecasting and clustering. The Q&A featurealso allows users to explore data in natural language.
Power BI integrates with Python, R and Azure ML. Power BI now also includes augmented DSMLfeatures including point and click options to build and use regression and classification modelsinside Power BI via dataflows. Features are automatically generated and up to 50 iterations ofdifferent models are tested and scored to find the best one for that use case. A report is created todisplay key model metrics and make the models more transparent. The model can be used to scorenew data in Power BI on a schedule and provide predictions as well as row-level explanations.
Oracle
Product: Oracle Analytics Cloud
Category: Augmented ABI
Focus: Integrated augmented analytics and NLG via an OEM of Yseop as well as an augmentedanalytics mobile application
Website: www.oracle.com/solutions/business-analytics/analytics-cloud.html
Oracle Analytics Cloud (OAC) includes integrated data preparation, data discovery (with advancedexploration and augmented analytics), interactive dashboards and scenario/what-if planningoptions. Oracle added augmented visualization using ML to uncover what drives results forattributes and measures, and to identify key statistical correlations and anomalies.
Augmented analytics features include automated insight generation and robust NLG. Within a viewor dashboard, when selecting a variable in the query panel, insights are automatically generated viathe “explain” feature to identify significant segments, clusters, drivers, outliers and anomalies. Thisalso includes NLQ and narration of findings. These autogenerated insights can be added to adashboard or explored further.
Oracle has recently announced availability of OAC with Autonomous Data Warehouse, whichdelivers in-database analytics and machine learning through Oracle Machine Learning (OML). OMLprovides capabilities for building, training, deploying and managing machine learning models and,through the upcoming OML for Python API, will also include advanced AutoML capabilities forfeature and algorithm selection, and hyperparameter tuning. OML capabilities can be consumeddirectly from Oracle Analytics via SQL or REST APIs.
Outlier
Product: Outlier
Category: Augmented ABI
Focus: Autonomous anomaly detection
Website: outlier.ai
Page 18 of 27 Gartner, Inc. | G00433836

Outlier is an augmented analytics platform that monitors business data for unexpected changes andimportant patterns such as anomalies, trends, relationships and emerging behaviors. Instead ofpreparing dashboards or running queries when questions arise, Outlier combines automated patterndetection across any metrics or data with NLG. This alerts users to insights specific to their needsand provides an NLQ interface for further exploration of relationships and patterns.
Unlike traditional anomaly detection software, which identifies relevant spikes over time in a specificmetric, Outlier also identifies emerging trends and patterns. For example, Outlier is able to look fornew relationships across thousands of dimensions such as revenue, customer interest, websitetraffic, ad word spend, and warehouse demands across product lines to find opportunities andproblems. Outlier learns user preferences based on their behavior and shares only the mostimportant findings or stories (out of thousands of possible patterns) with each user.
Prevedere
Product: ERIN Predictive Analytics Cloud
Category: Augmented DSML
Focus: Time series modeling and forecasting, automatically identify correlations among internal andexternal data for predictive models
Website: www.prevedere.com
Prevedere is a time series modeling and forecasting platform that leverages augmented analytics toautomate correlation, modeling and back-testing. The External Real-Time Insights (ERIN) Engineconstantly monitors curated global external datasets — including government, consumer andpurchasing indicators — as well as internal data brought from organizations to identify eachcompany’s unique set of leading indicators.
The service allows users to narrow the suggested list of indicators to the ones with the best fit,based on correlation thresholds as well as category tags associated with each indicator. Users canthen automatically generate a forecasting model. Visualizations and metrics for model accuracy, andcomponent contribution and relative importance of the explanatory variables are displayed as partof the output.
The platform has its own visualization capabilities and has a web API for use with Microsoft PowerBI, Salesforce and Tableau, as well as an API for planning tools such as those from Oracle and SAP.There are plans to include proactive model monitoring to alert users when models may havedegraded. Common customer use cases include strategic planning, marketing planning, salesplanning, financial planning, demand planning and complex analyses involving internal and externaldata.
Qlik
Product: Qlik Sense
Gartner, Inc. | G00433836 Page 19 of 27

Category: Augmented ABI
Focus: Automated insight generation, conversational chatbot
Website: www.qlik.com/us/products/qlik-sense
Qlik Sense is a modern analytics and BI platform continuing to expand its augmented capabilities.Qlik Insight Advisor uses the Qlik Cognitive Engine to automatically create a set of visualizations.This was further improved with the added ability for users to adjust the autogenerated visualizationsand the option for the Cognitive engine to learn from users’ interactions with the product. Newerfeatures include visual indicators for the expected degree of relevancy of an autogeneratedvisualization.
Qlik’s Qlik Insight Bot is the result of their acquisition of CrunchBot, extending their augmentedfunctionality to include conversational interfaces using NLP/NLG. Users are able to ask questions innatural language and the system will respond with autogenerated charts, dimension or measurelists, forecasts or predictions. Selections made via Qlik Insight Bot are persisted to the Qlikenvironment, and each new question maintains the context of the ongoing conversation.
Salesforce
Product: Einstein Analytics Plus
Category: Augmented ABI and DSML
Focus: Automated insights on datasets and Salesforce reports, transparent augmented DSML opento multiple user personas
Website: www.salesforce.com/products/einstein-analytics/overview
Salesforce offers Einstein Analytics Plus which includes the Einstein Analytics Platform, EinsteinPrediction Builder and Discovery, and Data Insights (AI-automated insights for Salesforce reports).Einstein Analytics Plus uses AI and machine learning to generate suggestions for how to clean andprepare data.
Data Insights can automatically visualize and narrate important insights about a Salesforce reportsuch as descriptive analytics, variances and correlations. This is also available to any datasets inEinstein Analytics Plus via the Einstein Discovery capabilities. Users can generate predictive modelswithout requiring them to manually build models or write algorithms. This augmented DSMLcapability handles feature and model selection, and it also adds an additional tab to the automatedinsights explaining “why” that metric has changed. This includes key driver visualizations for themost important variables affecting the target with additional natural language explanation.
The underlying model is also open to data scientists via R code to validate. Salesforce is extendingthese capabilities by adding AI model bias detection and model explainability and accountabilityfeatures. With the recent acquisition of Tableau, Salesforce will have access to additional naturallanguage search functionality via Tableau’s Ask Data offering.
Page 20 of 27 Gartner, Inc. | G00433836

SAP
Product: SAP Analytics Cloud
Category: Augmented ABI and DSML
Focus: Automated insight generation, key driver analysis, and augmented DSML
Website: www.sap.com/products/cloud-analytics.html
SAP Analytics Cloud is a purely cloud-based deployment running on SAP HANA within the widerSAP Cloud Platform, which is the underlying architecture. SAP Analytics Cloud combines datadiscovery, predictive analytics and planning and budgeting in an integrated package.
SAP Analytics Cloud’s Smart Insights feature enables business users to gain insights automatically,including basic variances, correlations and the identification of key contributors. The insights arevisualized with automatically selected graphs and explain the most important drivers of a particularmetric. There is an “unexpected values” tab for outliers that have been identified, once the SmartDiscovery feature has been activated. SAP has also added a natural language Q&A feature calledSearch to Insight.
SAP Smart Predict allows business users or citizen data scientists to build predictive modelswithout being a data science expert. Users can select whether they are solving a classification,regression, or time series question, and Smart Predict will automatically generate the appropriatefeatures and algorithm needed to solve that use case.
SAS
Product: SAS Visual Analytics; Visual Data Mining and Machine Learning
Category: Augmented ABI; Augmented DSML
Focus: Automated insight generation including key driver analysis and natural language generation(SAS Visual Analytics), template-based ML model creation for citizen data scientists and datascientists (SAS Visual Data Mining and Machine Learning)
Website: www.sas.com/en_us/software/visual-analytics.html
SAS Visual Analytics on SAS Viya combines reporting, data preparation, visual exploration anddashboards in a single product. SAS Visual Analytics is the core of SAS solutions and thecompany’s data science product: SAS Visual Data Mining and Machine Learning (VDMML).
SAS has added automated insight generation via their Automated Explanation feature. Here, theproduct displays the most important variables influencing a metric with native NLG. AutomatedExplanation surfaces basic insights, variances, and trends, as well as using a series of machinelearning models including decision trees to look for statistically relevant segments found in the data.Menu-driven advanced analytics, such as forecasting, clustering, correlation matrices and decisiontrees, have been core to the product since its first release. The underlying models used to
Gartner, Inc. | G00433836 Page 21 of 27

automatically generate visual representations of clusters, forecasts and predictions can be exportedas code to be transferred to a data science environment or via an API for operationalization.
VDMML allows citizen data scientists and data scientists to take advantage of templates thatautomatically execute feature engineering and model selection for predictive model building. OtherSAS offerings such as SAS Model Manager assist organizations with the deployment and ongoingmonitoring of predictive models.
Sisense
Product: Sisense
Category: Augmented ABI
Focus: Automated anomaly detection
Website: www.sisense.com
Sisense offers data preparation, analytics and visual exploration of complex data mashups.
Augmented capabilities, such as Sisense Pulse, continue to make the Sisense user experiencesimple while analytically relevant, allowing a broader range of users to interact with the tool. SisensePulse is an alerting engine that uses ML techniques to detect anomalies and notify users whensomething needs their attention.
Sisense suggests possible relevant dimensions and measures that users may want to analyze. Inaddition, their Insight Miner feature allows users to automatically uncover relationships orcorrelations among their data with a single click.
Tellius
Product: Tellius
Category: Augmented ABI and DSML
Focus: Automated insight generation (including key driver analysis), natural language searchcombined with NLG, augmented DSML including predictive model selection
Website: www.tellius.com
Tellius is an augmented analytics platform that combines natural language search andconversational interface, automated discovery of insights, and augmented DSML with NLGexplanation of results. The system supports complex analytical search terms such as “on the fly”comparisons; calculations; trends; growth; ranking, such as top and bottom performers; andinsights such as “drivers” and “why” analyses.
Tellius leverages ML to automatically generate visual insights that highlight anomalies, correlations,underlying trends and change drivers. Recommendations are based on the user’s question, what’sstatistically important in the data, and the user’s learned behavior.
Page 22 of 27 Gartner, Inc. | G00433836

Tellius also has features that enable the citizen data scientist to create, train, modify andoperationalize predictive models with APIs using augmented DSML features. Explainable AI is oneof the core focus areas for Tellius. The platform will show which attributes (or features) mostimpacted a particular insight and model. Insights can be placed on a dashboard for furtherexploration, using typical interactivity approaches such as filtering, sorting, drilling and others, or viaadditional questioning and automated insight generation iteration.
ThoughtSpot
Product: ThoughtSpot
Category: Augmented ABI
Focus: Natural language search, automated insight generation
Website: www.thoughtspot.com
ThoughtSpot provides visual exploration, dashboards and augmented analytics in a single platform.Data is loaded in-memory into a massively parallel processing (MPP) engine and indexed for fastquery performance. The search-based interface was an initial differentiator, but this has expandedto include automatic insight generation via SpotIQ, proactive alerting, and voice-driven queries viaSearchIQ.
SpotIQ is pervasive throughout ThoughtSpot and can be invoked from entire datasets to specificcharts or even specific subsets of data within a chart. The system will automatically generateinsights and visualizations such as correlations, trends, and segments within the data, based onstatistical relevancy and contextualization from prior user feedback and usage behavior. Thesevisualizations can be pinned to dashboards. A new snapshotting feature will also compare howresults may have changed over time to identify changes in behavior (such as a spike in sales ordefects), with an alert sent via email or mobile message.
ThoughtSpot’s platform allows users to indicate whether an autogenerated insight was beneficial orinteresting using thumbs up/down icons. The system will learn from this feedback and better tailorthe automated insights for that particular user in the future.
TIBCO Software
Product: TIBCO Spotfire; TIBCO Data Science
Category: Augmented ABI; Augmented DSML
Focus: Automated insight generation and some augmented data preparation capabilities (TIBCOSpotfire)
Website: www.tibco.com/products/tibco-spotfire
Gartner, Inc. | G00433836 Page 23 of 27

TIBCO Spotfire offers extensive capabilities for analytics dashboards, interactive visualization anddata preparation in a single design tool and workflow. It also offers flexible processing options,either in-memory or in-database. Through acquisitions and OEM relationships, TIBCO Software hasexpanded its capabilities to include data science, ML and streaming analytics, location intelligence,data cataloging, and data virtualization. Its latest release has added automated insight generation,NLQ and augmented visual data preparation. It also includes enhancements to real-time analytics,and a single, simplified user interface.
TIBCO Spotfire will automatically analyze a user’s data and suggest visualizations that are mostrelevant, based on the distributions and correlations of the data in the system. Users can drill into asuggested visualization of interest to have TIBCO Spotfire generate similar analyses. The samecapability exists when searching the data via natural language.
TIBCO Data Science offers an AutoML node available as part of a ML pipeline interface that allowscitizen data scientists to connect to modeled data (or as the next step in a data prep pipeline) thatwill automatically generate features, tune and select the best model of the multiple options the toolhas run.
Market Recommendations■ Familiarize yourself with and monitor the augmented analytics capabilities and roadmaps of
your analytics and BI, data science and ML, and self-service data preparation platform vendors,as well as emerging startups as they mature. Do so particularly in terms of the upfront setuprequired, the data preparation required, the types of data that can be analyzed, the types andrange of algorithms supported, and the accuracy and explainability of the findings.
■ Launch an augmented analytics pilot to assess viability and prove value. Start with a small list ofspecific business problems that are currently tackled manually and are time-intensive or proneto bias.
■ Look for opportunities to use sandboxing and free trials to test and explore how augmentedanalytics complements existing data integration, analytics and BI, and data science initiatives.
■ Investigate your current offerings being utilized today in the ABI and DSML space, asaugmented analytics is here and will continue to be rolled out in the platforms you already havedeployed over the next one to three years. Plan and invest in upskilling business people withdata literacy.
■ Engage both business analysts and data scientists in learning about and incorporatingaugmented analytics tools into the analytic process, in an effort to identify the best division ofresponsibility between the roles.
■ Recognize that these tools will mature and evolve over the next couple of years. Consult “CoolVendors in Analytics” and “Cool Vendors in Data Science and Machine Learning” and “OtherVendors to Consider for Modern Analytics and BI.” Also, monitor moves by the vendors in“Magic Quadrant for Analytics and Business Intelligence Solutions” and “Magic Quadrant forData Science and Machine Learning Platforms”
Page 24 of 27 Gartner, Inc. | G00433836

Gartner Recommended ReadingSome documents may not be available as part of your current Gartner subscription.
“Augmented Analytics Is the Future of Data and Analytics”
“Build a Comprehensive Ecosystem for Citizen Data Science to Drive Impactful Analytics”
“Augmented Analytics Feature Definition Framework”
“Cool Vendors in Analytics”
“Cool Vendors in Data Science and Machine Learning”
“Hype Cycle for Analytics and Business Intelligence, 2019”
“Hype Cycle for Data Science and Machine Learning, 2019”
“Magic Quadrant for Analytics and Business Intelligence Solutions”
“Magic Quadrant for Data Science and Machine Learning Platforms”
Note 1 Representative Vendor Selection
The 20 vendors named in this guide were selected to represent two of the three key pillars ofaugmented analytics solutions, as discussed in the Market Analysis section: augmented analyticsand BI (augmented ABI) and augmented data science and machine learning (augmented DSML).The vendors selected best demonstrate the breadth of possible capabilities offered in the currentmarket, both by vendors adding augmented capabilities to existing ABI or DSML platforms, as wellas those building entire platforms around augmentation.
Note 2 Gartner’s Initial Market Coverage
This Market Guide provides Gartner’s initial coverage of the augmented analytics tools market andfocuses on market definition, rationale and dynamics.
Note 3 Capability Definition
Augmented ABI and DSML tools can automatically or seamlessly deliver the following:
Gartner, Inc. | G00433836 Page 25 of 27

Table 3. Augmented Analytics Market Guide Capabilities Definitions
Category Capability Definition
AugmentedABI
AutomatedDescriptive Insights
The platform automatically surfaces basic insights such as variances,associations, correlations, or trends from a column or dataset before acontent author begins actively exploring the data. Typically displayed as abrief natural language description or sample visualizations.
AugmentedABI
Key Driver Analysis As part of a business user or business analyst workflow, the platform canautomatically identify the most important key drivers (or most importantattributes) of a given metric in a dataset.
AugmentedABI
Automated Anomaly/Outlier Alerting
Automated alerting, notification or proactive display of outliers/anomaliesbased on changes in the business and data, in context of their role andbusiness process. This is not manual threshold-based alerting or visualdepiction of statistical outliers within a dashboard object.
AugmentedABI
Autogenerated andAnalyzed Segments/Cluster
The platform automatically finds new segments or clusters in a dataset.Menu-driven clustering as part of the visual data discovery process wouldnot be included under this feature.
AugmentedABI
AutogeneratedForecasts/Predictions
The platform automatically creates a forecast or prediction. Menu-drivenforecasting as part of the visual data discovery process would not beincluded under this feature.
AugmentedABI
Contextualized/Relevant Insights
Automated insight generation that incorporates explicit and/or implicitusage and feedback data from users to display content that is mostrelevant for their role and use cases.
AugmentedDSML
Automated FeatureGeneration/Selection
Automatically identifying the best types of data or variables to be used aspart of the predictive model building process. Performing featuretransformation, combinations, and creation automatically.
AugmentedDSML
Automated AlgorithmSelection
The process of selecting the appropriate algorithm to fit a given use case.Multiple algorithms may be tested, scored and ranked, ultimately choosingthe most accurate model. Adjusting the hyperparameters of an algorithm toimprove accuracy and optimize the predictive model.
AugmentedDSML
Automated ModelPackaging/Deployment
The ease and speed with which the user can move models from adeveloper environment to a production environment or embed them in abusiness process. Platforms should support the ability to create APIs orcontainers (such as code, PMML and packaged apps) that can be used forfaster deployment in business scenarios.
AugmentedDSML
Automated ModelMonitoring
The ability to track the performance of models in production to ensure therelationships found during development are still valid, and that the model ispredicting well.
Source: Gartner (October 2019)
Page 26 of 27 Gartner, Inc. | G00433836

GARTNER HEADQUARTERS
Corporate Headquarters56 Top Gallant RoadStamford, CT 06902-7700USA+1 203 964 0096
Regional HeadquartersAUSTRALIABRAZILJAPANUNITED KINGDOM
For a complete list of worldwide locations,visit http://www.gartner.com/technology/about.jsp
© 2019 Gartner, Inc. and/or its affiliates. All rights reserved. Gartner is a registered trademark of Gartner, Inc. and its affiliates. Thispublication may not be reproduced or distributed in any form without Gartner's prior written permission. It consists of the opinions ofGartner's research organization, which should not be construed as statements of fact. While the information contained in this publicationhas been obtained from sources believed to be reliable, Gartner disclaims all warranties as to the accuracy, completeness or adequacy ofsuch information. Although Gartner research may address legal and financial issues, Gartner does not provide legal or investment adviceand its research should not be construed or used as such. Your access and use of this publication are governed by Gartner Usage Policy.Gartner prides itself on its reputation for independence and objectivity. Its research is produced independently by its researchorganization without input or influence from any third party. For further information, see "Guiding Principles on Independence andObjectivity."
Gartner, Inc. | G00433836 Page 27 of 27