Embed Size (px)
Citation preview

March 31, 2011
ICICIdirect.com | Equity Research
Initiating Coverage
ICICI Securities Limited
World class facilities but execution yet to gather pace… Pipavav Shipyard (Pipavav) is one of the largest shipbuilding yards in the world, capable of constructing vessels up to 400000 dwt. Superior infrastructure, modular construction technology, strategic tie-ups and a strong and diversified order book of ~ | 6300 crore is expected to result in CAGR of 48.8% over FY10-FY13. However, concerns such as challenges on the execution side and rich valuation compared to established global shipyards make the risk-reward ratio unfavourable in the medium term. World class infrastructure set-up with modular construction technology Pipavav operates one of the largest shipyard facilities in the world capable of constructing vessels up to 400000 dwt. The facilities include shipbuilding, ship repair and fabrication complex. Pipavav has adopted modular construction technology used by the best shipyards i.e. Samsung and Hyundai, which would enable the company to reduce the construction time of vessels. Execution remains a key concern There was a delay of ~15 months in the construction of the shipyard and the facility became fully operational only in December 2010 with the installation of Goliath cranes. The delay in construction of the shipyard has, in turn, led to significant delay in the delivery schedule of vessels. Although Pipavav has a strong and diversified order book valued at | 6300 crore, the first deliveries of panamax and offshore vessels is likely only from Q2FY12 onwards i.e. delay of ~18 and ~3 months respectively.
Valuation At the CMP of | 79, Pipavav is trading at 19.5xFY13E EPS of | 4.1 and 2.5xFY13E P/BV of | 31.7 i.e. 65.5% & 32.2% higher respectively than the best and established global shipyards. Although Pipavav is in a growth phase, significant premium over global shipyards would not be justified until execution improves. We have valued the stock at 2.0xFY13E P/BV and are initiating coverage with SELL rating and a price target of | 63. Exhibit 1: Key Financials (| crore)
FY09 FY10 FY11E FY12E FY13E
Net Sales 0.0 629.4 882.7 1598.5 2073.7
EBITDA -18.3 -1.2 76.1 295.5 511.1
EBITDA Margin (%) - - 8.6% 18.5% 24.6%
PAT 4.2 -48.2 -1.7 126.1 269.6
EPS 0.1 - - 1.9 4.1
P/E (x) - - - 41.7 19.5
P/BV (x) 3.7 3.2 3.1 2.9 2.5
EV/EBITDA (x) - - 80.3 20.6 11.3
RONW (%) - - - 6.9 12.8ROCE (%) - - 2.5 10.2 17.8
Source: Company, ICICIdirect.com Research
Pipavav Shipyard Ltd (PIPSHI) | 79
Rating Matrix RATING : Sell
TARGET : | 63
TARGET PERIOD : 12 Months
POTENTIAL UPSIDE : - 20%
YoY Growth (%)
FY10 FY11E FY12E FY13ETotal Revenue - 40 81 30EBITDA - - 288 73
Net Profit - - - 114
Stock Data
Bloomberg Code PIPV.IN
Reuters Code PIPA.BO
Face Value (Rs.) 10
Promoters Holding 45
Market Cap (Rs Cr) 5260
52 week H/L 120/58
Sensex 18194
Average Volumes 2605639
Comparative Return Matrix (%)
1M 3M 6M 12MPipavav Shipyard 3.8 17.6 -24.1 34.4
ABG Shipyard 7.1 -3.2 38.3 33.5
Bharati Shipyard 10.3 -28.8 -37.3 -43.9
Price Movement
01000200030004000500060007000
Mar-10 Jun-10 Sep-10 Dec-10 Mar-110255075
100125150
NIFTY (LHS) Pipavav Shipyard Ltd (RHS)
Analyst’s Name
Bharat Chhoda [email protected]
Jehangir Master [email protected]
ICICIdirect.com | Equity Research Page 2
ICICI Securities Limited
Company Background Pipavav is promoted by the SKIL Group and was incorporated as Pipavav Ship Dismantling and Engineering Ltd on October 17, 1997. The SKIL group has a long operational history and has been instrumental in setting up key infrastructure projects such as Pipavav Port, which was later acquired by the AP Moller-Maersk Group. In 2005 the name was changed to Pipavav Shipyard Limited. The shipyard is located about 130 km from Bhavnagar in Gujarat and is spread over an aggregate area of 491 acres, comprising an SEZ unit spread over 235 acres and an EOU spread over 257 acres with dry dock of 662 metre in length and 65 metre in width. It operates the largest shipyard facility at a single location in India and is also among the largest in the world with the capability of constructing vessels up to 400000 dwt. It can construct dry bulk vessels, tankers, offshore vessels and defence vessels. Pipavav commenced commercial operations in April 2009. The shipyard was constructed at a total cost of ~ | 3000 crore, which was financed through ~ | 1200 crore of promoter equity, ~ | 500 crore raised through IPO and ~ | 1300 crore of debt.
Increase in promoter stake
SKIL Infrastructure, the promoter of Pipavav, increased its stake in the company from 24.6% in Q4FY10 to 45.0% in Q3FY11. The stake was increased after SKIL Infrastructure acquired the stake of Punj Lloyd and followed it up with an open offer. In addition, SKIL Infrastructure has been allotted convertible share warrants at | 99.1, which would be converted into equity shares at a similar rate. Post conversion, the stake of the promoters is expected to rise to 47.0% Exhibit 2: Institutional holding in Pipavav Key Institutional Investors % Holding
IL & FS 5.4
Smallcap World Fund 5.1
New York Life Investment Management India Fund 2.8
Sembcorp Marine Ltd. 2.6
EXIM Bank 2.6
IDBI Bank Ltd. 2.2
IL & FS Financial Services Ltd 1.7
LIC 1.5 Source: BSE, ICICIdirect.com Research
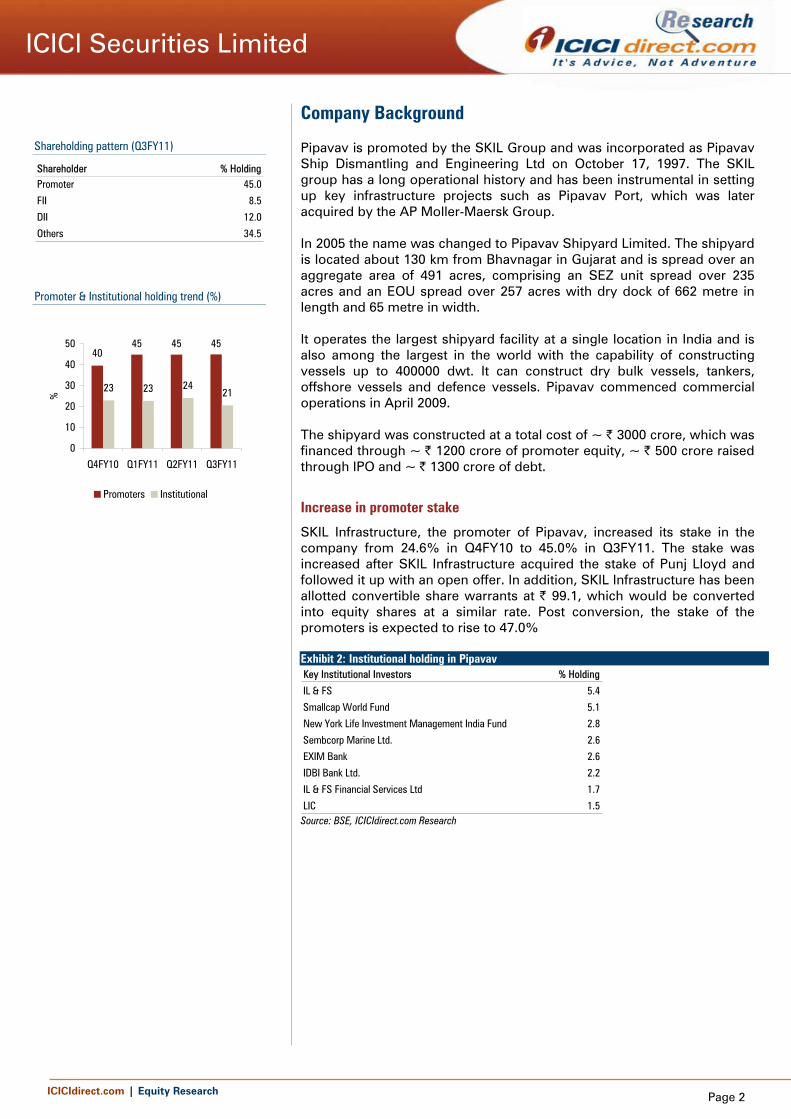
Shareholding pattern (Q3FY11)
Shareholder % HoldingPromoter 45.0
FII 8.5
DII 12.0
Others 34.5
Promoter & Institutional holding trend (%)
4045 45 45
23 23 2421
0
10
20
30
40
50
Q4FY10 Q1FY11 Q2FY11 Q3FY11
%
Promoters Institutional

ICICIdirect.com | Equity Research Page 3
ICICI Securities Limited
Investment Rationale Pipavav operates one of the largest shipyards in the world capable of constructing vessels up to 400000 dwt. The facilities include shipbuilding, ship repair and offshore fabrication complex. Pipavav uses modular construction technology which would enable Pipavav to reduce the construction and delivery time of vessels. Pipavav also has an order book comprising defence, offshore and dry bulk vessels valued at | 6300 crore, which provides good earnings visibility. With the pick up in execution, we expect Pipavav to report a CAGR growth of 48.8% over FY10-FY13. Despite superior infrastructure set-up, execution remains a key concern for the shipyard. There was a delay of ~ 15 months in the construction of the shipyard and the facility became fully operational only in December 2010. A delay in the installation of Goliath cranes has led to a significant delay in the delivery schedule of vessels. Delivery of the first Panamax vessel is likely only from Q2FY12 onwards i.e. delay of ~ 18 months and execution remains a key concern for the shipyard. At the CMP of | 79 Pipavav is trading at 19.5xFY13E EPS of | 4.05 and 2.5xFY13E P/BV of | 31.7 i.e. significantly higher than even the best and established global shipyards. Although Pipavav is in a growth phase, the significant premium over global shipyards would not be justified until execution improves. We have valued the stock at 2.0x FY13E P/BV and are initiating coverage with a SELL rating and a price target of | 63. Exhibit 3: Comparative valuation (P/BV)
1.17
0.46
2.86
2.24
2.25
1.65
0.00 0.50 1.00 1.50 2.00 2.50 3.00
ABG
Pipavav
Samsung
FY12E P/BV
Source: Company, ICICIdirect.com Research Exhibit 4: Comparative valuation (EV/EBITDA)
6.78
9.12
20.61
8.9
8.9
6.3
0.00 5.00 10.00 15.00 20.00 25.00
ABG
Pipavav
Samsung
FY12E EV/EBITDA
Source: Company, ICICIdirect.com Research

ICICIdirect.com | Equity Research Page 4
ICICI Securities Limited
Largest single location shipyard facility in India
Pipavav operates the largest shipyard facility at a single location in India and is also among the largest in the world. The dry dock is 662 metre in length and 65 metre in width and is capable of constructing vessels up to 400000 dwt. Pipavav is spread over an aggregate area of 491 acres, comprising an SEZ unit spread over 235 acres and an EOU spread over 257 acres. The facilities include shipbuilding, ship repair and offshore fabrication complex. It also has the capability to construct offshore platforms, SBMs, rigs, jackets, vessels, etc. for upstream oil & gas sector companies both in India and abroad. It has also installed two Goliath cranes, each with a lifting capacity of 600 tonnes to facilitate modular construction of vessels.
ABG Shipyard and Bharati Shipyard, the two largest shipyards in India operate through multiple locations as against Pipavav which operates from a single location. As fabrication and dry dock facilities are located at a single location it offers economies of scale to Pipavav over other domestic yards.
Exhibit 5: Capability comparison
Hyundai Heavy Pipavav ABG Bharati CochinDry Dock Length (metres) 672 662 155 176 270Width (metres) 92 65 30 33 45
Commercial Vessels(max vessel size)Dry Bulk Carrier 1000000 dwt 400000 dwt 120000 dwt 100000 dwt 110000 dwtCrude Tanker 1000000 dwt 400000 dwt 120000 dwt 100000 dwt 110000 dwtProduct Tanker 1000000 dwt 400000 dwt 120000 dwt 100000 dwt 110000 dwt
Offshore VesselsRig √ √ √ √ xAHTS/PSV √ √ √ √ √
Dredgers √ √ √ √ x
Defence/Coast GuardSubmarine √ √ x x xFrigate √ √ x x xCoastal Patrol Vessels √ √ √ √ √Speed Boat √ √ √ √ √
Ship Repair √ √ √ √ √ Source: Company, ICICIdirect.com Research
Modular construction – Provides edge along with faster turnaround
Pipavav has employed modular process of building ships, which breaks down a complete ship into internal parts and then simultaneously fabricates various parts of the ship in fabrication workshops. This method allows Pipavav to build several ships simultaneously. Construction of blocks, which includes steel stacking, treatment, cutting, forming, blasting, painting, welding and sub assembly of panels followed by assembly of blocks and outfitting is carried out at the fabrication complex. When ready, the blocks are moved to the dry dock for pre-erection of mega giga-blocks of ~600 tonnes each followed by lowering them on the dock floor for final assembly and vessel launching. This method ensures that the dry dock is occupied by new build vessel for the minimum possible time thereby reducing the construction time of vessels.
Pipavav is one of the largest shipyards in the world,
which is capable of constructing vessels up to 400000
dwt along with the latest construction technology
Single location facility and modular construction technology would provide economies of scale
Pipavav has adopted the modular construction technology, which is currently used by Korean and Chinese shipyard which allows speedier and cost efficient construction of vessels

ICICIdirect.com | Equity Research Page 5
ICICI Securities Limited
India has a number of shipyards but both PSU as well as private shipyards operate on a slightly dated construction technology as against the modular shipbuilding technology adopted by Pipavav. Further, both public and private sector shipyards do not have the size to construct or repair large sized vessels. This forces Indian shipping companies to place orders with foreign shipyards for larger sized vessels.
Strong and diversified order book provides good earnings visibility
Pipavav has a strong order book comprising defence, offshore and dry bulk vessels which provide good earnings visibility. It also has the second largest order book amongst Indian shipbuilding companies with a gross order book of | 6330 crore and net order book of | 5326 crore. Pipavav is expected to generate a turnover of | 1598 crore in FY12 and is likely to overtake Bharati Shipyard to emerge as the second largest shipbuilding company in India in terms of revenue.
Exhibit 6: Order book composition client wise Client Vessel Type Quantity Order ValueDefenceIndian Navy Offshore Patrol Vessels 5 | 2700 crore
Offshore
ONGC Offshore Support Vessels 12 | 480 crore
Dry Bulk
AVGI Panamax Vessels 12Golden Ocean Panamax Vessels 5Setaf Panamax Vessels 4Total | 6330 crore
| 3150 crore
Source: Company, ICICIdirect.com Research
Exhibit 7: Peer revenue and net order book
2596
1284
1598
8242
1408
5326
0 1000 2000 3000 4000 5000 6000 7000 8000 9000
ABG
Bharati
Pipavav
Revenue FY12E Net order book*
Source: Company, ICICIdirect.com Research * Net order book denotes order book pending execution as on FY11E
Indian shipyards, except Pipavav, lack world class
infrastructure facilities which is an added advantage for
Pipavav
Pipavav has a gross order book of | 6330 crore and a
net order book of | 5326 crore which provides good
earnings visibility
Pipavav has the second largest order book size after
ABG Shipyard and would overtake Bharati Shipyard in
FY12 in terms of revenue
ICICIdirect.com | Equity Research Page 6
ICICI Securities Limited
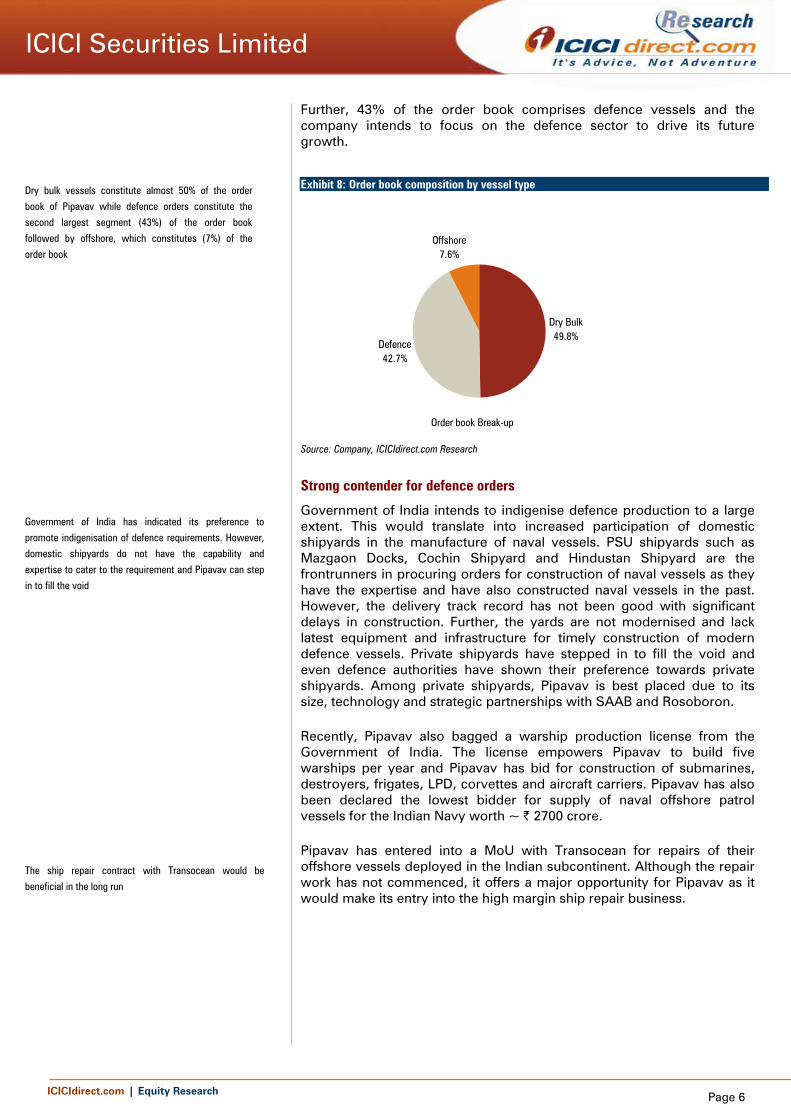
Further, 43% of the order book comprises defence vessels and the company intends to focus on the defence sector to drive its future growth.
Exhibit 8: Order book composition by vessel type
Order book Break-up
Dry Bulk49.8%
Defence42.7%
Offshore7.6%
Source: Company, ICICIdirect.com Research
Strong contender for defence orders
Government of India intends to indigenise defence production to a large extent. This would translate into increased participation of domestic shipyards in the manufacture of naval vessels. PSU shipyards such as Mazgaon Docks, Cochin Shipyard and Hindustan Shipyard are the frontrunners in procuring orders for construction of naval vessels as they have the expertise and have also constructed naval vessels in the past. However, the delivery track record has not been good with significant delays in construction. Further, the yards are not modernised and lack latest equipment and infrastructure for timely construction of modern defence vessels. Private shipyards have stepped in to fill the void and even defence authorities have shown their preference towards private shipyards. Among private shipyards, Pipavav is best placed due to its size, technology and strategic partnerships with SAAB and Rosoboron.
Recently, Pipavav also bagged a warship production license from the Government of India. The license empowers Pipavav to build five warships per year and Pipavav has bid for construction of submarines, destroyers, frigates, LPD, corvettes and aircraft carriers. Pipavav has also been declared the lowest bidder for supply of naval offshore patrol vessels for the Indian Navy worth ~ | 2700 crore.
Pipavav has entered into a MoU with Transocean for repairs of their offshore vessels deployed in the Indian subcontinent. Although the repair work has not commenced, it offers a major opportunity for Pipavav as it would make its entry into the high margin ship repair business.
Dry bulk vessels constitute almost 50% of the order
book of Pipavav while defence orders constitute the
second largest segment (43%) of the order book
followed by offshore, which constitutes (7%) of the
order book
Government of India has indicated its preference to
promote indigenisation of defence requirements. However,
domestic shipyards do not have the capability and
expertise to cater to the requirement and Pipavav can step
in to fill the void
The ship repair contract with Transocean would be
beneficial in the long run
ICICIdirect.com | Equity Research Page 7
ICICI Securities Limited
Key technical tie-ups/arrangements
Pipavav has entered into tie-up with some of the best technology providers. Their expertise and vast experience would enable Pipavav to scale up its operations without many glitches and also enable the shipyard to bid for high end and technically advanced orders for defence vessels.
Sembcorp Marine - Singapore
Sembcorp Marine is a leading global marine engineering and shipyard group, specialising in a full spectrum of integrated solutions in ship repair, shipbuilding, ship conversion, rig building, topsides fabrication and offshore engineering. Sembcorp has been advising Pipavav on yard layout and manufacturing processes.
KOMAC – Korea
Korea Maritime Consultants Co Ltd was established in 1969 as Korea’s first and only private organisation of naval architects and marine engineers. KOMAC has designed more than 1,200 different classes and type of ships. Pipavav has a technical services agreement with KOMAC to source designs as well as assist in procurement of equipment and materials for commercial shipbuilding.
SAAB Dynamics AB, Wallenberg Group – Sweden
SAAB is a global leader for products, services and solutions from military defence to civil security. Pipavav has entered into an MoU with SAAB Dynamics AB and the tie-up would offer access to cutting edge technology for building naval vessels.
Rosoboron Export - Russian
Pipavav has entered into a protocol with Rosoboron Export, which is a Russian government arm for defence cooperation with foreign governments. This protocol is for building four additional stealth frigates under Russian collaboration at Pipavav. The Russians have delivered three stealth frigates while balance four are under construction at a Russian yard and an additional four are expected to be built in India. The protocol would help Pipavav to develop state-of-the-art technology to build frontline warships on a cost effective and time bound basis. The protocol covers mid life updates, dry docking, repairs and modernisation of submarines of Russian origin in use by the Indian Navy.
Northrop Grumman - US
Northrop Grumman is one of the largest defence companies globally and has expertise in defence systems, airspace management systems, navigation systems, precision weapons and marine systems. Pipavav has signed an MoU with Northrop Grumman, which would give access to technology and expertise possessed by Northrop.
Strategic tie-up with companies such as Sembcorp
Marine, KOMAC, SAAB Dynamics, Rosoboron and
Northrop would be of immense help in securing new
build orders, especially defence.
ICICIdirect.com | Equity Research Page 8
ICICI Securities Limited
Industry outlook
Commercial shipbuilding business
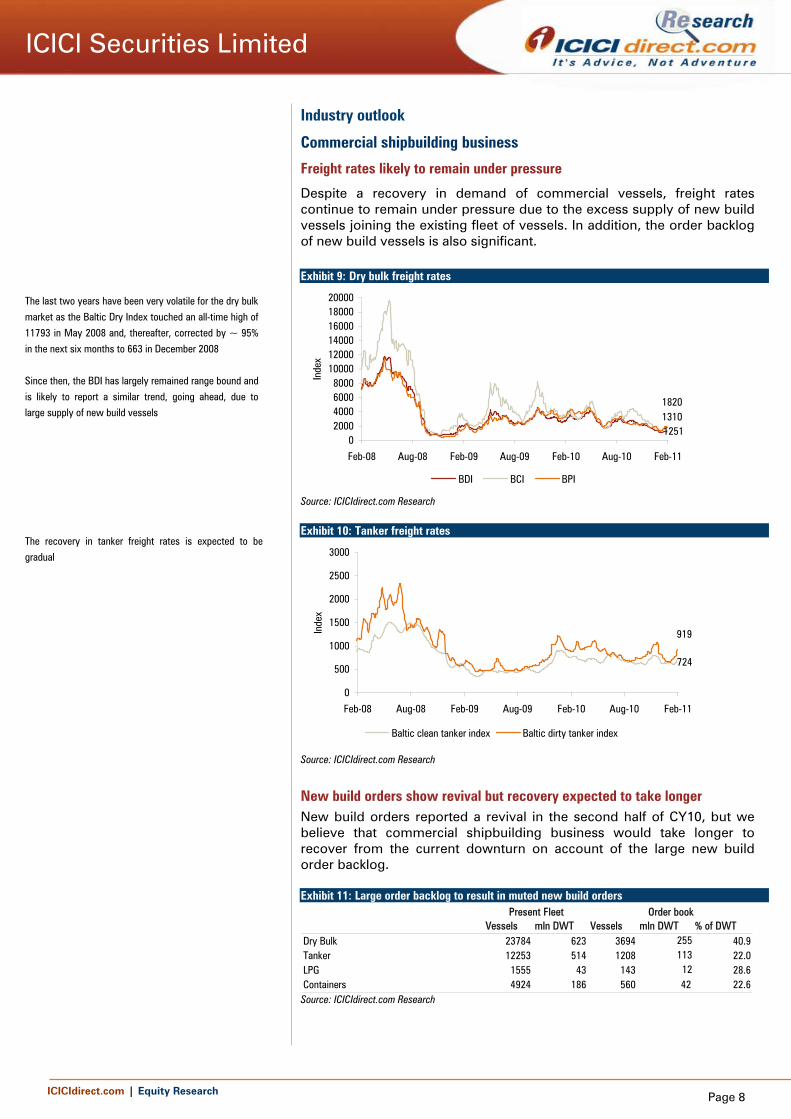
Freight rates likely to remain under pressure
Despite a recovery in demand of commercial vessels, freight rates continue to remain under pressure due to the excess supply of new build vessels joining the existing fleet of vessels. In addition, the order backlog of new build vessels is also significant. Exhibit 9: Dry bulk freight rates
125113101820
02000400060008000
100001200014000160001800020000
Feb-08 Aug-08 Feb-09 Aug-09 Feb-10 Aug-10 Feb-11
Inde
x
BDI BCI BPI
Source: ICICIdirect.com Research Exhibit 10: Tanker freight rates
724
919
0
500
1000
1500
2000
2500
3000
Feb-08 Aug-08 Feb-09 Aug-09 Feb-10 Aug-10 Feb-11
Inde
x
Baltic clean tanker index Baltic dirty tanker index
Source: ICICIdirect.com Research
New build orders show revival but recovery expected to take longer New build orders reported a revival in the second half of CY10, but we believe that commercial shipbuilding business would take longer to recover from the current downturn on account of the large new build order backlog. Exhibit 11: Large order backlog to result in muted new build orders
Vessels mln DWT Vessels mln DWT % of DWTDry Bulk 23784 623 3694 255 40.9Tanker 12253 514 1208 113 22.0LPG 1555 43 143 12 28.6Containers 4924 186 560 42 22.6
Present Fleet Order book
Source: ICICIdirect.com Research
The last two years have been very volatile for the dry bulk
market as the Baltic Dry Index touched an all-time high of
11793 in May 2008 and, thereafter, corrected by ~ 95%
in the next six months to 663 in December 2008
Since then, the BDI has largely remained range bound and
is likely to report a similar trend, going ahead, due to large supply of new build vessels
The recovery in tanker freight rates is expected to be
gradual

ICICIdirect.com | Equity Research Page 9
ICICI Securities Limited
Exhibit 12: Revival observed in new build orders but recovery still distant Dry Bulk Tankers Containers LPG/LNG Others Total
Jan-10 53 12 0 6 8 79
Feb-10 33 18 0 4 18 73
Mar-10 104 36 5 8 18 171
Apr-10 28 16 0 1 0 45
May-10 63 20 0 2 3 88
Jun-10 75 32 1 0 14 122
Jul-10 70 48 15 8 15 156
Aug-10 91 32 8 8 6 145
Sep-10 68 38 22 0 10 138
Oct-10 93 56 43 0 24 216
Nov-10 128 27 35 13 40 243
Dec-10 159 44 37 13 39 292
Total 965 379 166 63 195 1768 Source:ICICIdirect.com Research
Offshore shipbuilding business
Sustained rise in crude oil demand along with firm prices
Crude oil demand is likely to remain strong on account of consumption growth from China and India leading to firm crude oil prices. Exhibit 13: Crude oil demand and supply forecast
Q1CY11E Q2CY11E Q3CY11E Q4CY11E Q1CY12E Q2CY12E Q3CY12E Q4CY12E
SupplyOPEC 35.6 35.8 36.4 36.4 37.3 37.4 37.7 37.8
Non-OPEC 52.2 52.0 51.1 51.4 51.9 51.7 51.5 51.8
Total Supply 87.8 87.8 87.5 87.8 89.1 89.1 89.3 89.6
DemandOECD 46.6 45.0 45.7 46.3 46.6 45.1 45.8 46.5
Non-OECD 41.5 42.5 42.5 42.0 43.0 44.0 44.1 43.5
Total Demand 88.1 87.5 88.2 88.3 89.6 89.1 89.9 90.0 Source: Bloomberg
Exhibit 14: Crude oil prices trend
115.61
0
20
40
60
80
100
120
140
160
Mar-08 Sep-08 Mar-09 Sep-09 Mar-10 Sep-10 Mar-11
$/ba
rrel
Source: ICICIdirect.com Research, Bloomberg
Rise in new build orders was observed in the second half
of CY10 with dry bulk vessel orders reporting the highest
activity
Crude oil demand and prices have reported remarkable
strength over the last one year
ICICIdirect.com | Equity Research Page 10
ICICI Securities Limited
Offshore shipbuilding business offers good potential
Strength in crude oil prices is likely to result in a rise in exploration/drilling spend. This would lead to demand for offshore drilling vessels such as jack-up rigs and support vessels such as AHTS and PSVs. Hence, we believe that offshore shipbuilding business would continue to show strength.
Defence shipbuilding business
High value and potential to provide steady business Private domestic shipyards have in the past couple of years bagged small sized orders for coastal patrol vessels and speed boats. This has also opened up opportunities for private domestic shipyards to build larger sized defence vessels. The defence sector has the potential to provide regular business to and can also provide an effective hedge from the volatility of the commercial shipbuilding business.
Ship repair business
Growing opportunity for specialised players The ship repair business in India offers good potential as there are few ship repair facilities in India. The shipbuilding business globally is passing through a downturn with a slowdown in new build orders. However, ship repair is an evergreen industry as irrespective of market conditions, ship repair activities continue on account of regular dry docking requirements. Further, stringent International Maritime Organisation (IMO) regulations mandate that vessels need to be sent for dry docking every 2.5 years and a special survey has to be carried out once in five years. There is no specialised ship repair yard in India except Western India Shipyard. Indian shipping companies send their shipping vessels to yards in Singapore, Dubai and Sri Lanka to carry out ship repairs and Indian vessel owners would prefer to get their vessels repaired in India if specialised repair facilities are offered.
With the recovery in crude oil prices, offshore
drilling/exploration is expected to pick up pace resulting in
new build orders
Domestic shipyards could benefit from defence orders, which could provide regular and substantial business
The ship repair business offers good growth potential as currently there are very few ship repair facilities in India

ICICIdirect.com | Equity Research Page 11
ICICI Securities Limited
Risks and concerns
Company Specific
Delay of 15 months in construction of shipyard facility
There has been considerable delay in the commissioning of the shipyard. As per the DRHP filed by the company at the time of the IPO, the shipyard was expected to get completed by October 2009 but got completed only in December 2010 i.e. delay of ~ 15 months. The main reason for the delay was the non-availability of key personnel for the installation of Goliath cranes.
Exhibit 15: Delay in shipyard construction Original completion date
Fabrication yard, dry dock and installation of Goliath cranes Oct-09
Offshore yard Mar-10
Actual completion date Dec-10
Delay of 15 months Source: Company, DRHP, ICICIdirect.com Research,
Considerable delay in delivery of vessels
Goliath cranes need to be operational to lower and assemble the ship modules. The delay in their installation has resulted in delay in the delivery schedule of vessels. Currently, two Panamax vessels are being assembled in dry dock (area circled in chart below) and each are 50% assembled. The assembly of the complete vessel would require at least another three months after which painting, fitting, launching and sea trials would be carried out before the final delivery of the vessels. Hence, we believe the final delivery of the first two vessels would require at least another six months and delivery is likely only from Q2FY12 onwards i.e. a delay of at least 18 months.
Exhibit 16: Current status of shipbuilding activity at the shipyard
Contract signing
Raw material and equipment procurement
Fabrication and modular assembly
Vessel Assembly
Painting and Fitting
Launching
Sea Trials
Delivery Source: Company, DRHP, ICICIdirect.com Research
There has been a delay of ~ 15 months in construction of shipyard facility
A delay of at least 18 months is likely in the delivery of
the first Panamax vessel while a delay of at least three
months is likely in the delivery of the first offshore
support vessel

ICICIdirect.com | Equity Research Page 12
ICICI Securities Limited
Exhibit 17: Original delivery schedule and current status of vessel construction Original delivery schedule
Dry bulk vessels
Delivery date of first panamax vessel Apr-10
Subsequent deliveries Every three months
Offshore
Delivery date of first offshore support vessel Jun-11
Final delivery of 12 offshore vessels Dec-11
Expected delivery scheduleDry bulk vesselsDelivery date of first panamax vessel Sep-11Delay of 18 months
OffshoreDelivery date of first offshore support vessel Sep-11Delay of 3 months
Source: Company, DRHP, ICICIdirect.com Research
Delay in payment by clients
Construction of Panamax as well as offshore vessels is running behind schedule. Further, a delay in the initial deliveries would derail the delivery schedule of the remaining vessels leading to considerable slippages. This in turn, would lead to delay in payments from the clients and could also lead to invocation of performance guarantee.
Revision in dry bulk order book contract value
The initial dry bulk order book size of Pipavav was 22 Panamax vessels with contract value of ~ US$819 million. However, Pipavav was in discussions with its clients with regards to amendment/cancellation of its firm order book.
After negotiations, the order book size has been reduced to 21 Panamax vessels and the contract value has been finally re-negotiated at ~ US$700 million.
Exhibit 18: Original order book size vs. revised order book size
Panamax Vessels mn $Original order book 10 vessels 373
Original order book 2 vessels 71
Original order book 6 vessels 231
Original order book 4 vessels 144
22 vessels 819
Revised order book 21 vessels 700 Source: Company, DRHP, ICICIdirect.com Research
Order cancellation
Pipavav is currently executing orders worth | 6330 crore for its various clients. Till date, there has been a cancellation of just one Panamax bulk carrier. We do not expect any more cancellations, going ahead. However, any unfavourable development could be a major setback for the shipyard
With the delay in the delivery of the first vessel,
subsequent deliveries are also likely to get delayed
The original dry bulk order book value has been re
negotiated to | 700 crore from the earlier | 819 crore
Order cancellation could be a major setback for Pipavav

ICICIdirect.com | Equity Research Page 13
ICICI Securities Limited
Non allotment of defence orders Pipavav has constructed a modern and state of the art yard, which is capable of catering to defence requirements of high-end modern and sophisticated defence vessels. It has also bid for defence orders and expects to bag them on account of its infrastructure capabilities. However, if the orders do not materialise it could lead to under utilisation of yard capacity, going ahead, as we expect sluggishness in the commercial shipbuilding business.
Rise in steel prices may further dampen new build orders
Steel prices, which constitute a major portion of the total vessel cost, have been steadily rising over the last two years. After touching a low of US$370 per tonne in June 2009, prices have since increased to US$900 per tonne and are approaching peak prices of US$1080 per tonne in June 2008. The rise in steel prices would lead to a direct rise in new build asset prices, which is a serious concern for shipbuilding sector. During 2008, high steel prices resulted in a rise in new build prices but it did not lead to drop in demand for new vessel orders as freight rates remained firm. However, the current environment is very different as freight rates are barely above operating costs for most ship owners. In such a scenario, even a small increase in asset prices could lead to a significant demand contraction and lead to a decline in new build orders that have just started to gain traction.
Exhibit 19: US HRC prices trend
900.0
0
200
400
600
800
1000
1200
Sep-08 Mar-09 Sep-09 Mar-10 Sep-10 Mar-11
US $
/tonn
e
Source: Company, ICICIdirect.com Research
Availability and retention of skilled manpower a concern
Availability of skilled manpower is also a key concern but the company has made considerable efforts to develop the basic infrastructure facilities such as housing at the shipyard site.
Pledge of shares by promoter The promoters have pledged their entire holding in Pipavav.
Implementation of new tax provisions to result in higher tax outgo Under the new tax provisions, even companies located in SEZs are required to pay MAT while they were earlier exempt.
Pipavav is banking on defence orders to drive growth but if the company fails to bag defence orders it could lead to under utilisation in the long-term
Steel prices, which are a major cost component, have
increased in the last two years. This would lead to a rise
in new build prices which is likely to further dampen the demand for new build vessels
Availability and retention of key skilled manpower could
be a problem in the initial stages for the shipyard
Implementation of new tax provisions would result in higher tax outgo although it can be set off in later years

ICICIdirect.com | Equity Research Page 14
ICICI Securities Limited
Industry specific
Sluggish demand for merchant vessels The global economy, especially of developed countries, has managed to emerge out of the recession on account of exceptional measures such as quantitative easing and stimulus support by the respective governments. However, any slowdown in economic recovery in the US and Europe could lead to a decline in demand for crude oil as developed countries are the main demand drivers. Similarly, China is the main demand driver of dry bulk commodities such as iron ore and coal. China is making efforts to moderate its growth, which is likely to result in an easing in demand for commodities. The above factors could lead to a decline in demand for commercial vessels.
Large supply of new vessels to cap new build orders Exceptionally large supply of new build vessels are expected to join the global shipping fleet over the next two years. Currently, 40.9% of the existing dry bulk fleet is on order while 22.0% crude oil tanker fleet is on order. Despite a modest rise in demand for vessels, exceptionally large supply of vessels is likely to result in depressed levels of freight rates. This, in turn, would result in very few new build orders for shipyards. Exhibit 20: Large supply pipeline
Vessels mln DWT Vessels mln DWT % of DWTDry Bulk 23784 623 3694 255 40.9Tanker 12253 514 1208 113 22.0LPG 1555 43 143 12 28.6Containers 4924 186 560 42 22.6
Present Fleet Order book
Source: ICICIdirect.com Research
Risk aversion by financial institutions may lead to funding options drying up Global financial institutions are risk averse in funding new vessel purchases as the shipping industry is currently passing through a downturn. Further, depressed freight rates have also affected the viability for new proposals. As shipping is a capital intensive as well as highly leveraged industry, the lack of debt funding would result in a decline in new build orders for the next couple of years.
Drop in vessel scrapping Scrapping of vessels continued unabated throughout 2009 as depressed freight rates and high scrap metal prices forced many ship owners to scrap their vessels before the end of their useful life. However, if scrapping activity slows down it could result in higher available tonnage leading to pressure on freight rates.
Decline in crude oil prices Crude oil prices have stayed above $70/barrel over the last one year. Firmness in crude oil prices has led to a rise in exploration and drilling spend necessitating demand for diving support vessels and services. However, conversely, a decline in crude oil prices below $70/barrel could lead to a slowdown in exploration and drilling activities, thereby adversely affecting the offshore shipbuilding business.
A slowdown in the US and Europe and moderation of
growth in China could lead to sluggish demand for
commodities, resulting in a drop in demand for
commercial vessels
Exceptionally large supply of new build vessels are expected to enter the market over the next two years. This would result in reduced new build orders
Shortage of liquidity and risk aversion by financial institutions could lead to a lack of debt funding options for new shipbuilding
Decline in vessel scrapping may lead to further pressure on freight rates
Decline in crude oil prices is likely to result in a slowdown in exploration activities, thereby adversely affecting the demand for diving support vessels

ICICIdirect.com | Equity Research Page 15
ICICI Securities Limited
Non revival of subsidy scheme The Shipping Ministry has proposed the revival of the erstwhile subsidy scheme, which had lapsed in 2007. The proposal is pending for the last three years and various options are being explored to revive the scheme. However, non renewal of the scheme could be a major setback as it would make it difficult for domestic shipyards to compete with global shipyards especially in the current downturn.
Aggressive pricing by Chinese and Korean shipyards A major factor contributing to the rise in order book size of Indian shipyards was the order backlog with global shipyards, which resulted in a delivery time of vessels in excess of four years. This prompted shipping companies to place orders with Indian shipyards, which offered to provide delivery of vessels with a lesser lead time. Hence, Indian shipyards benefited from the spill over of orders from the Japanese and Korean shipyards. As new build orders have slowed down considerably in the last two years, Japanese and Korean shipyards have spare capacity. Hence, we believe they would offer aggressive pricing to bag new build orders to enhance their capacity utilisation levels. Even the recent data suggests that majority of the new build orders in the last one year have been bagged by Korean shipyards such as Hyundai and Samsung and the trend is likely to continue in the medium term as well. Further, in the absence of a subsidy scheme, Indian shipyards would lack the competitive price advantage earlier enjoyed by them.
Non revival of subsidy scheme would make it difficult for domestic shipyards to compete with global players
Aggressive pricing by Korean and Chinese shipyards to bag new orders could hurt the interests of Indian shipyards

ICICIdirect.com | Equity Research Page 16
ICICI Securities Limited
Financials
Revenue growth at 48.8% CAGR for FY10-FY13 as execution gathers speed Pipavav has an order book of | 6330 crore comprising 21 Panamax bulk carriers, 12 offshore support vessels and five offshore patrol vessels. The company has completed the capex and the dry dock and the Goliath cranes are fully operational. We expect the revenue booking to rise substantially in FY12 as execution gathers pace with the shipyard expected to report 48.8% CAGR growth over FY10-FY13. We expect revenues from shipbuilding to grow by 123% to | 1244 crore along with a similar rise in subsidy booking to | 187 crore while we have factored in a decline in trade sales to | 168 crore over the same period. Revenues for FY12 are expected to rise by 81% to | 1599 crore and rise further by 30% to | 2074 crore in FY13. The EBITDA margin is likely to improve from 18.5% in FY12 to 24.6% in FY13. Pipavav is expected to report a PAT of | 126 crore in FY12 and | 270 crore in FY13. Exhibit 21: Revenue/EBITDA/PAT projections
629.4882.7
1598.5
2073.7
-1.2 76.1295.5
511.1
-1.7 126.1269.6
-48.2
-500
0
500
1000
1500
2000
2500
FY10 FY11E FY12E FY13E
| cr
Revenue EBITDA Net profit
Source: Company, ICICIdirect.com Research
Exhibit 22: Shipbuilding and subsidy projections
1701
1244
559
255
187
84
0
500
1000
1500
2000
2500
FY11E FY12E FY13E
| cr
Shipbuilding Subsidy
Source: Company, ICICIdirect.com Research
Revenues are expected to rise as execution gathers
pace. Pipavav is expected to report positive PAT from FY12 onwards
The core shipbuilding business is expected to rise by
123% to | 1244 crore in FY12 and 37% to | 1701 crore in
FY13 as executions gathers pace.

ICICIdirect.com | Equity Research Page 17
ICICI Securities Limited
Debt levels to ease as execution picks up Debt levels are expected to drop from | 1340 crore in FY11 to | 760 crore in FY13. This would also result in a decline in the debt-equity ratio to a modest 0.36. Exhibit 23: Debt/equity ratio trend
1329.9 1339.9
1049.9
759.9
0.80 0.780.57
0.36
0
200
400
600
800
1000
1200
1400
1600
FY10 FY11E FY12E FY13E
| cr
0.00
0.50
1.00
1.50
2.00
2.50
Debt Debt-Equity
Source: Company, ICICIdirect.com Research
Debt equity ratio
Pipavav has one of the best debt equity ratios in the industry. Pipavav had a debt equity ratio of 0.8 in FY10 as compared to a debt equity ratio of 2.6 for ABG Shipyard and 2.8 for Bharati Shipyard. The debt-equity ratio for Pipavav is expected to drop further to a very modest 0.6 in FY12. This provides sufficient room to Pipavav to raise further debt if required to carry out any additional capex.
Exhibit 24: Best debt-equity ratio in the industry
0.6
1.6
1.9
0.8 0.8
2.1
2.62.4
2.8
0.0
0.5
1.0
1.5
2.0
2.5
3.0
FY10 FY11E FY12E
Pipavav ABG Bharati
Source: Company, ICICIdirect.com Research,
The debt equity level is expected to drop as execution
gathers pace. The debt-equity ratio is expected to drop to a modest 0.36 in FY13
Pipavav has a very conservative debt-equity ratio as compared to ABG Shipyard and Bharati Shipyard

ICICIdirect.com | Equity Research Page 18
ICICI Securities Limited
Subsidies: Dry bulk order book eligible for subsidy
Pipavav has till date booked subsidies of | 157 crore. However, it has not received any subsidy from the government as subsidies are payable only on delivery of vessels and Pipavav would commence delivery from Q2FY12 onwards. Pipavav is expected to receive subsidies worth | 945 crore with respect to its commercial vessel order book, which amounts to | 3150 crore. Timely payment of subsidies would further improve the cash position of the company and also facilitate faster execution of its order book.
Exhibit 25: Estimates of subsidy likely to be booked
88 84
187
255
206
81
39
0
50
100
150
200
250
300
FY10 FY11E FY12E FY13E FY14E FY15E FY16E
Subsidy
Source: Company, ICICIdirect.com Research,
Capex completed: Free cash flow to improve as debt comes down
Pipavav has completed the capex spend and its shipyard complex is fully operational with fabrication yard, dry dock and Goliath cranes installed. It will not need to incur any more capex unless it plans to convert its existing wet dock into a dry dock, which would require additional capex spend of ~ | 900 crore. As execution gathers pace, we expect an increase in stage wise payment from clients resulting in rise in cash flow.
Almost 50% of the order book of Pipavav i.e. | 3150 crore that consists of dry bulk Panamax vessels is eligible for subsidy and the total subsidy amount is | 945 crore

ICICIdirect.com | Equity Research Page 19
ICICI Securities Limited
Valuation
Pipavav has set up world class infrastructure facilities, which are not comparable with any other domestic shipyard such as ABG Shipyard, Bharati Shipyard or Cochin Shipyard. Hence, it would command a higher multiple compared to domestic shipyards and more in line with international shipyards that have a similar infrastructure facility. At CMP of | 79 Pipavav is trading at 19.5xFY13E EPS of | 4.1 and 2.5xFY13E P/BV of | 31.7 i.e. i.e. 65% and 32% higher than even the best and established global shipyards. Although Pipavav is in a growth phase, the significant premium over global shipyards would not be justified until execution improves. We have valued the stock at 2.0x FY13E P/BV and are initiating coverage with a SELL rating and a price target of | 63. Exhibit 26: Valuation Parameters Valuation based on Global average Target multiple Target price (|)
PE multiple (x) 11.79 - -
Price to book value (x) 1.89 2.00 63
Average target price (|) 63
Current market price (|) 79
Upside (%) (20.3) Source: ICICIdirect.com Research

ICICIdirect.com | Equity Research Page 20
ICICI Securities Limited
Exhibit 27: Global peer valuation
CY10E CY11E CY12E CY10E CY11E CY12E CY10E CY11E CY12E CY10E CY11E CY12EShipbuildingDaewoo Shipbuilding* South Korea 1.4 1.2 1.1 7.3 7.6 8.6 5.8 6.1 7.2 20.9 17.6 13.5
Hyundai Heavy Industries* South Korea 2.0 1.6 1.4 8.0 8.5 8.9 8.0 8.2 8.7 29.4 21.8 17.8Keppel Corp. Ltd* Singapore 2.5 2.3 2.1 13.3 14.8 14.8 11.9 12.8 12.5 19.7 16.0 15.3Samsung Heavy Industries* South Korea 2.0 1.7 1.5 8.4 8.6 9.1 7.0 7.0 7.7 27.5 21.8 17.4Sembcorp Marine* Singapore 4.4 3.9 3.4 14.0 17.4 17.5 8.7 10.6 10.6 34.2 23.9 20.9ABG Shipyard# India 1.6 1.4 1.2 8.0 8.9 7.6 9.8 8.1 6.8 19.6 15.4 15.5Bharati Shipyard# India 0.5 0.5 0.5 3.4 3.9 5.7 7.8 6.2 9.1 15.6 11.9 7.6Pipavav Shipyard# India 3.2 3.1 2.9 - - 41.7 - 80.3 20.6 - - 6.9*consensus# With regards to ABG, Bharati and Pipavav, three year data represents FY10, FY11 and FY12 (financial year ending in March)
EV/EBITDA (x) ROE (%)Company Country
P/BV (x) P/E (x)
Source: Company, ICICIdirect.com Research
Exhibit 28: Domestic peer valuation
ABG Shipyard Sales (| Crore) EPS (|) PE (x) EV/EBITDA (x) RoNW (%) RoCE (%)Idirect Code ABGSHI CMP (|) 351 FY10 1812.4 42.8 8.0 9.8 19.6 10.9
Target (|) 302 FY11E 2191.3 42.2 8.9 8.1 15.4 12.9MCap 1787 % Upside -14 FY12E 2505.4 55.3 7.6 6.8 15.5 14.1
Bharati Shipyard Sales (| Crore) EPS (|) PE (x) EV/EBITDA (x) RoNW (%) RoCE (%)Idirect Code BHASHI CMP (|) 146 FY10 1348.0 47.1 3.4 7.8 15.6 9.9
Target (|) 172 FY11E 1561.8 40.3 3.9 6.2 11.9 12.7MCap 426 % Upside 18 FY12E 1284.1 27.6 5.7 9.1 7.6 8.8Pipavav Shipyard Sales (| Crore) EPS (|) PE (x) EV/EBITDA (x) RoNW (%) RoCE (%)Idirect Code PIPSHI CMP (|) 79 FY10 629.4 - - - - -
Target (|) 63 FY11E 882.7 - - 80.3 - 2.5MCap 5260 % Upside -20 FY12E 1598.5 1.9 41.7 20.6 6.9 10.2
Source: Company, ICICIdirect.com Research

ICICIdirect.com | Equity Research Page 21
ICICI Securities Limited
Exhibit 29:Profit and loss account (| Crore) FY09 FY10 FY11E FY12E FY13ESales 0.0 629.4 882.7 1598.5 2073.7Growth (%) - - 40.2 81.1 29.7Op. Expenditure 18.3 630.6 806.6 1303.0 1562.6EBITDA -18.3 -1.2 76.1 295.5 511.1Growth (%) - - - 288.3 73.0Other Income 61.8 38.3 38.4 34.1 15.3Depreciation 0.2 37.7 49.4 77.5 119.4EBIT 43.3 -0.7 65.1 252.1 407.1Interest 13.0 73.0 106.8 95.6 72.4PBT 30.4 -73.7 -41.7 156.6 334.7Tax 4.7 1.6 0.0 30.4 65.0Extraordinary Item -21.5 27.1 40.0 0.0 0.0Rep. PAT before MI 4.2 -48.2 -1.7 126.1 269.6Minority interest (MI) 0.0 0.0 0.0 0.0 0.0Rep. PAT after MI 4.2 -48.2 -1.7 126.1 269.6Adj. Net Profit 4.2 -48.2 -1.7 126.1 269.6Growth (%) - - - - 113.8
Source: Company, ICICIdirect.com Research
Exhibit 30:Balance sheet (| Crore) FY09 FY10 FY11E FY12E FY13EEquity Capital 580.4 665.8 665.8 665.8 665.8Share Warrants 0.0 0.0 62.6 62.6 62.6Reserves & Surplus 674.4 988.2 986.5 1112.7 1382.3Shareholder's Fund 1254.7 1654.0 1714.9 1841.0 2110.7Secured Loans 774.6 1131.1 1181.1 931.1 681.1Unsecured Loans 379.0 198.8 158.8 118.8 78.8Deferred Tax Liability 0.0 1.5 1.5 1.5 1.5Source of Funds 2408.3 2985.4 3056.2 2892.4 2872.0
Gross Block 71.8 1187.3 1637.3 2237.3 2537.3Less: Acc. Depreciation 8.2 45.9 95.3 172.8 292.2Net Block 63.6 1141.4 1542.0 2064.5 2245.1Capital WIP 2273.7 1441.6 1091.6 491.6 191.6Net Fixed Assets 2337.3 2583.0 2633.6 2556.1 2436.7Investments 48.5 7.8 7.8 7.8 7.8Inventory 318.3 133.0 193.5 306.6 340.9Trade Receivables 0.0 7.0 96.7 175.2 227.3Cash 661.8 640.2 487.4 219.0 257.1Other Current Assets 0.0 348.4 362.8 569.3 568.1Loans & Advances/Others 160.5 190.2 338.6 481.7 511.3Total Current Asset 1140.6 1318.9 1478.9 1751.8 1904.6Current Liab. & Prov. 1118.0 924.3 1064.1 1423.3 1477.1Net Current Asset 22.6 394.6 414.9 328.5 427.5Application of funds 2408.3 2985.4 3056.3 2892.4 2872.0
Source: Company, ICICIdirect.com Research

ICICIdirect.com | Equity Research Page 22
ICICI Securities Limited
Exhibit 31:Cash flow statement (| Crore) FY10 FY11E FY12E FY13ENet Profit Before Tax -46.5 -1.7 156.6 334.7Depreciation 37.7 49.4 77.5 119.4Direct Tax Paid 1.6 0.0 30.4 65.0CF before change in WC -10.4 47.7 203.6 389.0Increase in Current Liabilities 169.8 139.8 359.2 53.8Increase in Current Assets 199.9 312.8 541.3 114.8CF from operations -40.6 -125.3 21.6 328.1Pur. of Fix Assets -283.5 -100.0 0.0 0.0Income from Inv 40.7 0.0 0.0 0.0CF from Investing -242.8 -100.0 0.0 0.0
Inc./(Dec.) in Debt 176.3 10.0 -290.0 -290.0Inc./(Dec.) in Equity Capital 85.4 62.6 0.0 0.0CF from Financing 261.8 72.6 -290.0 -290.0Opening Cash balance 661.8 640.2 487.4 219.0Closing Cash balance 640.2 487.4 219.0 257.1
Source: Company, ICICIdirect.com Research
Exhibit 32: YoY Growth (%)
FY09 FY10 FY11E FY12E FY13ENet sales - - 40.2 81.1 29.7EBITDA - - - 288.3 73.0Adj. net profit - - - - 113.8Cash EPS - - - 326.6 91.0Net worth 21.4 31.8 3.7 7.4 14.6
Source: Company, ICICIdirect.com Research
Exhibit 33: Key ratios Cost ratios (%) FY09 FY10 FY11E FY12E FY13EConsumption of Raw Materials - 38.0 52.0 51.0 50.0Manufacturing Expenses - 35.2 35.0 33.0 30.0Employee Cost - 4.9 4.5 3.5 3.0Administrative, Selling and other Expenses - 16.8 15.0 8.0 6.5
Profitability ratios (%)EBITDA Margin - - 8.6 18.5 24.6PAT Margin - - - 7.9 13.0
Per share data (|)Revenue per share 0.0 9.5 13.3 24.0 31.1EV per share 87.5 89.4 91.8 91.5 86.6Book Value 21.6 24.8 25.8 27.7 31.7Cash per share 11.4 9.6 7.3 3.3 3.9EPS - - - 1.9 4.1Cash EPS - - 0.7 3.1 5.8DPS - - - - -
Source: Company, ICICIdirect.com Research

ICICIdirect.com | Equity Research Page 23
ICICI Securities Limited
Exhibit 34: Key ratios Return ratios % FY09 FY10 FY11E FY12E FY13ERoNW - - - 6.9 12.8ROCE - - 2.5 10.2 17.8ROIC - - - 4.4 9.4Financial health ratioOperating CF (| Cr) - -40.6 -125.3 21.6 328.1FCF (| Cr) - 110.8 36.3 -94.1 392.3Cap. Emp. (| Cr) 1290.3 2061.1 1992.2 1469.1 1394.9Debt to equity (x) 0.9 0.8 0.8 0.6 0.4Debt to cap. emp. (x) 0.9 0.6 0.7 0.7 0.5Interest Coverage (x) 3.3 0.0 0.6 2.6 5.6Debt to EBITDA (x) -63.1 -1071.6 17.6 3.6 1.5DuPont ratio analysisPAT/PBT - - - 0.8 0.8PBT/EBIT - - - 0.6 0.8EBIT/Net sales - - 0.1 0.2 0.2Net Sales/ Tot. Asset 0.0 0.2 0.2 0.4 0.5Total Asset/ NW 2.8 2.4 2.4 2.3 2.1
Source: Company, ICICIdirect.com Research
Exhibit 35: Turnover ratios
FY09 FY10 FY11E FY12E FY13EWorking cap./Sales ratio - - - - -Inventory turnover in days - 77.1 80.0 70.0 60.0Debtor turnover in days - 4.1 40.0 40.0 40.0Creditor turnover in days - 449.9 350.0 250.0 200.0Current Ratio 1.0 1.7 2.5 2.0 2.0
Source: Company, ICICIdirect.com Research
Exhibit 36: FCF calculation (| Crore) FY10 FY11E FY12E FY13EEBITDA -1.2 76.1 295.5 511.1Less: Tax 1.6 0.0 30.4 65.0NOPLAT -2.9 76.1 265.1 446.1Capex -283.5 -100.0 0.0 0.0Change in working cap. 169.8 139.8 359.2 53.8FCF 110.8 36.3 -94.1 392.3
Source: Company, ICICIdirect.com Research
Exhibit 37: Valuation ratios (x times) FY09 FY10 FY11E FY12E FY13EPE (x) - - - 41.7 19.5EV/EBITDA (x) - - 80.3 20.6 11.3EV/Sales (x) - 9.5 6.9 3.8 2.8Dividend Yield (%) - - - - -Price/BV (x) 3.7 3.2 3.1 2.9 2.5
Source: Company, ICICIdirect.com Research
ICICIdirect.com | Equity Research Page 24
ICICI Securities Limited
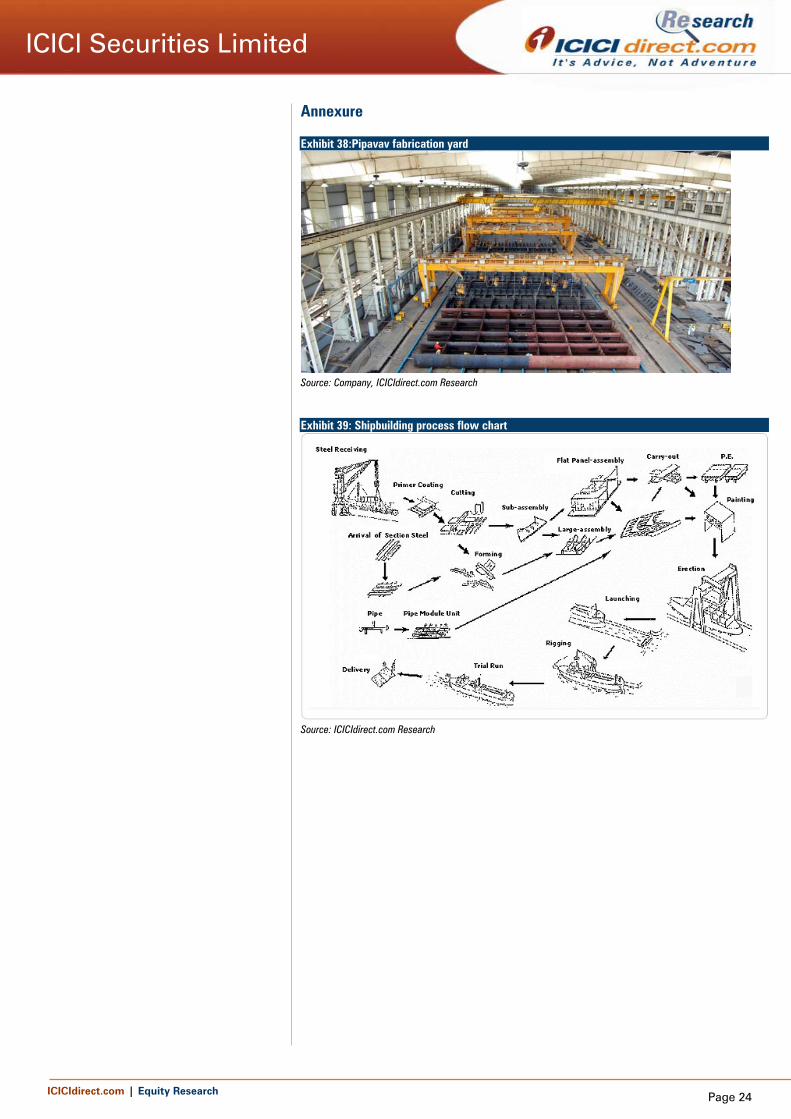
Annexure Exhibit 38:Pipavav fabrication yard
Source: Company, ICICIdirect.com Research
Exhibit 39: Shipbuilding process flow chart
Source: ICICIdirect.com Research

ICICIdirect.com | Equity Research Page 25
ICICI Securities Limited
RATING RATIONALE ICICIdirect.com endeavours to provide objective opinions and recommendations. ICICIdirect.com assigns ratings to its stocks according to their notional target price vs. current market price and then categorises them as Strong Buy, Buy, Add, Reduce and Sell. The performance horizon is two years unless specified and the notional target price is defined as the analysts' valuation for a stock. Strong Buy: 20% or more; Buy: Between 10% and 20%; Add: Up to 10%; Reduce: Up to -10% Sell: -10% or more;
Pankaj Pandey Head – Research [email protected]
ICICIdirect.com Research Desk, ICICI Securities Limited, 7th Floor, Akruti Centre Point, MIDC Main Road, Marol Naka, Andheri (East) Mumbai – 400 093
[email protected] ANALYST CERTIFICATION We /I, Bharat Chhoda MBA and Jehangir Master ACA, research analysts, authors and the names subscribed to this report, hereby certify that all of the views expressed in this research report accurately reflect our personal views about any and all of the subject issuer(s) or securities. We also certify that no part of our compensation was, is, or will be directly or indirectly related to the specific recommendation(s) or view(s) in this report. Analysts aren't registered as research analysts by FINRA and might not be an associated person of the ICICI Securities Inc.
Disclosures: ICICI Securities Limited (ICICI Securities) and its affiliates are a full-service, integrated investment banking, investment management and brokerage and financing group. We along with affiliates are leading underwriter of securities and participate in virtually all securities trading markets in India. We and our affiliates have investment banking and other business relationship with a significant percentage of companies covered by our Investment Research Department. Our research professionals provide important input into our investment banking and other business selection processes. ICICI Securities generally prohibits its analysts, persons reporting to analysts and their dependent family members from maintaining a financial interest in the securities or derivatives of any companies that the analysts cover.
The information and opinions in this report have been prepared by ICICI Securities and are subject to change without any notice. The report and information contained herein is strictly confidential and meant solely for the selected recipient and may not be altered in any way, transmitted to, copied or distributed, in part or in whole, to any other person or to the media or reproduced in any form, without prior written consent of ICICI Securities. While we would endeavour to update the information herein on reasonable basis, ICICI Securities, its subsidiaries and associated companies, their directors and employees (“ICICI Securities and affiliates”) are under no obligation to update or keep the information current. Also, there may be regulatory, compliance or other reasons that may prevent ICICI Securities from doing so. Non-rated securities indicate that rating on a particular security has been suspended temporarily and such suspension is in compliance with applicable regulations and/or ICICI Securities policies, in circumstances where ICICI Securities is acting in an advisory capacity to this company, or in certain other circumstances.
This report is based on information obtained from public sources and sources believed to be reliable, but no independent verification has been made nor is its accuracy or completeness guaranteed. This report and information herein is solely for informational purpose and may not be used or considered as an offer document or solicitation of offer to buy or sell or subscribe for securities or other financial instruments. Though disseminated to all the customers simultaneously, not all customers may receive this report at the same time. ICICI Securities will not treat recipients as customers by virtue of their receiving this report. Nothing in this report constitutes investment, legal, accounting and tax advice or a representation that any investment or strategy is suitable or appropriate to your specific circumstances. The securities discussed and opinions expressed in this report may not be suitable for all investors, who must make their own investment decisions, based on their own investment objectives, financial positions and needs of specific recipient. This may not be taken in substitution for the exercise of independent judgment by any recipient. The recipient should independently evaluate the investment risks. The value and return of investment may vary because of changes in interest rates, foreign exchange rates or any other reason. ICICI Securities and affiliates accept no liabilities for any loss or damage of any kind arising out of the use of this report. Past performance is not necessarily a guide to future performance. Investors are advised to see Risk Disclosure Document to understand the risks associated before investing in the securities markets. Actual results may differ materially from those set forth in projections. Forward-looking statements are not predictions and may be subject to change without notice.
ICICI Securities and its affiliates might have managed or co-managed a public offering for the subject company in the preceding twelve months. ICICI Securities and affiliates might have received compensation from the companies mentioned in the report during the period preceding twelve months from the date of this report for services in respect of public offerings, corporate finance, investment banking or other advisory services in a merger or specific transaction. ICICI Securities and affiliates expect to receive compensation from the companies mentioned in the report within a period of three months following the date of publication of the research report for services in respect of public offerings, corporate finance, investment banking or other advisory services in a merger or specific transaction. It is confirmed that Bharat Chhoda MBA and Jehangir Master ACA, research analysts and the authors of this report have not received any compensation from the companies mentioned in the report in the preceding twelve months. Our research professionals are paid in part based on the profitability of ICICI Securities, which include earnings from Investment Banking and other business.
ICICI Securities or its subsidiaries collectively do not own 1% or more of the equity securities of the Company mentioned in the report as of the last day of the month preceding the publication of the research report.
It is confirmed that Bharat Chhoda MBA, and Jehangir Master ACA, research analysts and the authors of this report or any of their family members does not serve as an officer, director or advisory board member of the companies mentioned in the report.
ICICI Securities may have issued other reports that are inconsistent with and reach different conclusion from the information presented in this report. ICICI Securities and affiliates may act upon or make use of information contained in the report prior to the publication thereof.
This report is not directed or intended for distribution to, or use by, any person or entity who is a citizen or resident of or located in any locality, state, country or other jurisdiction, where such distribution, publication, availability or use would be contrary to law, regulation or which would subject ICICI Securities and affiliates to any registration or licensing requirement within such jurisdiction. The securities described herein may or may not be eligible for sale in all jurisdictions or to certain category of investors. Persons in whose possession this document may come are required to inform themselves of and to observe such restriction.