Embed Size (px)
Citation preview
March 16, 2017
Initiating Coverage
ICICI Securities Ltd | Retail Equity Research
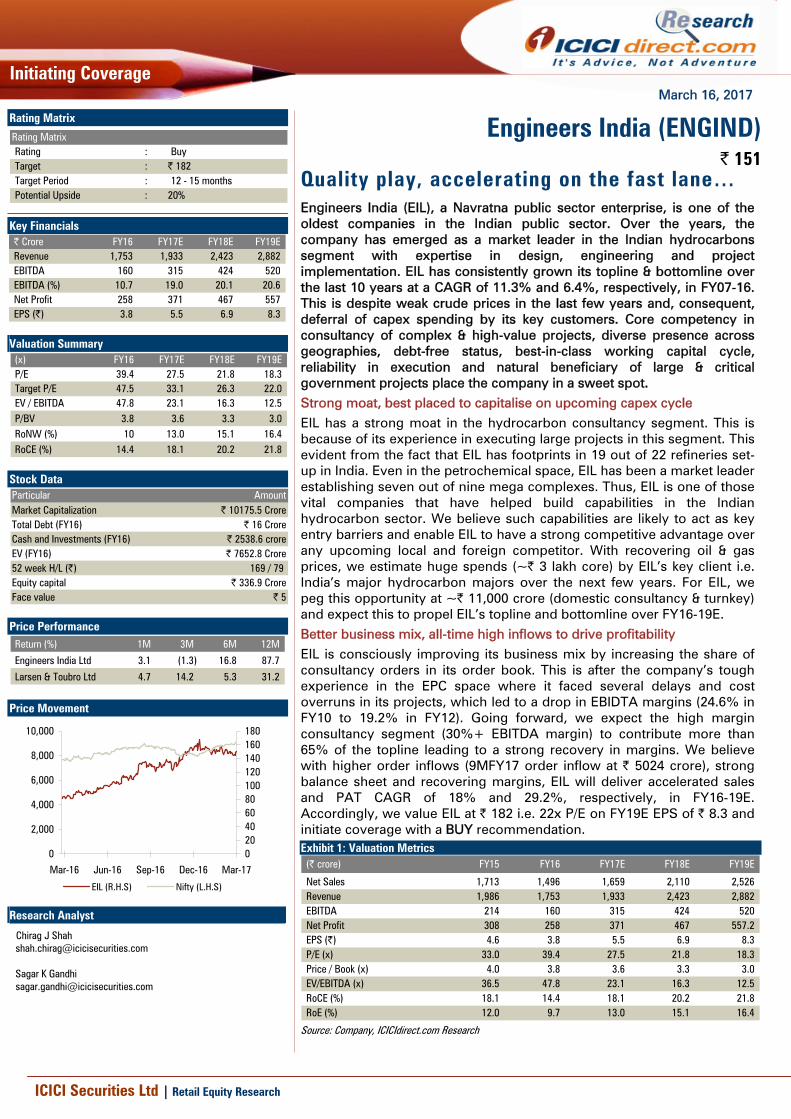
Quality play, accelerating on the fast lane… Engineers India (EIL), a Navratna public sector enterprise, is one of the oldest companies in the Indian public sector. Over the years, the company has emerged as a market leader in the Indian hydrocarbons segment with expertise in design, engineering and project implementation. EIL has consistently grown its topline & bottomline over the last 10 years at a CAGR of 11.3% and 6.4%, respectively, in FY07-16. This is despite weak crude prices in the last few years and, consequent, deferral of capex spending by its key customers. Core competency in consultancy of complex & high-value projects, diverse presence across geographies, debt-free status, best-in-class working capital cycle, reliability in execution and natural beneficiary of large & critical government projects place the company in a sweet spot. Strong moat, best placed to capitalise on upcoming capex cycle EIL has a strong moat in the hydrocarbon consultancy segment. This is because of its experience in executing large projects in this segment. This evident from the fact that EIL has footprints in 19 out of 22 refineries set-up in India. Even in the petrochemical space, EIL has been a market leader establishing seven out of nine mega complexes. Thus, EIL is one of those vital companies that have helped build capabilities in the Indian hydrocarbon sector. We believe such capabilities are likely to act as key entry barriers and enable EIL to have a strong competitive advantage over any upcoming local and foreign competitor. With recovering oil & gas prices, we estimate huge spends (~| 3 lakh core) by EIL’s key client i.e. India’s major hydrocarbon majors over the next few years. For EIL, we peg this opportunity at ~| 11,000 crore (domestic consultancy & turnkey) and expect this to propel EIL’s topline and bottomline over FY16-19E. Better business mix, all-time high inflows to drive profitability EIL is consciously improving its business mix by increasing the share of consultancy orders in its order book. This is after the company’s tough experience in the EPC space where it faced several delays and cost overruns in its projects, which led to a drop in EBIDTA margins (24.6% in FY10 to 19.2% in FY12). Going forward, we expect the high margin consultancy segment (30%+ EBITDA margin) to contribute more than 65% of the topline leading to a strong recovery in margins. We believe with higher order inflows (9MFY17 order inflow at | 5024 crore), strong balance sheet and recovering margins, EIL will deliver accelerated sales and PAT CAGR of 18% and 29.2%, respectively, in FY16-19E. Accordingly, we value EIL at | 182 i.e. 22x P/E on FY19E EPS of | 8.3 and initiate coverage with a BUY recommendation.
Exhibit 1: Valuation Metrics (| crore) FY15 FY16 FY17E FY18E FY19E
Net Sales 1,713 1,496 1,659 2,110 2,526 Revenue 1,986 1,753 1,933 2,423 2,882 EBITDA 214 160 315 424 520 Net Profit 308 258 371 467 557.2 EPS (|) 4.6 3.8 5.5 6.9 8.3 P/E (x) 33.0 39.4 27.5 21.8 18.3 Price / Book (x) 4.0 3.8 3.6 3.3 3.0 EV/EBITDA (x) 36.5 47.8 23.1 16.3 12.5 RoCE (%) 18.1 14.4 18.1 20.2 21.8 RoE (%) 12.0 9.7 13.0 15.1 16.4
Source: Company, ICICIdirect.com Research
Engineers India (ENGIND)| 151
Rating Matrix
Rating MatrixRating : BuyTarget : | 182Target Period : 12 - 15 monthsPotential Upside : 20%
Key Financials | Crore FY16 FY17E FY18E FY19ERevenue 1,753 1,933 2,423 2,882 EBITDA 160 315 424 520 EBITDA (%) 10.7 19.0 20.1 20.6 Net Profit 258 371 467 557 EPS (|) 3.8 5.5 6.9 8.3
Valuation Summary
(x) FY16 FY17E FY18E FY19EP/E 39.4 27.5 21.8 18.3 Target P/E 47.5 33.1 26.3 22.0 EV / EBITDA 47.8 23.1 16.3 12.5 P/BV 3.8 3.6 3.3 3.0 RoNW (%) 10 13.0 15.1 16.4 RoCE (%) 14.4 18.1 20.2 21.8
Stock Data Particular AmountMarket Capitalization | 10175.5 CroreTotal Debt (FY16) | 16 CroreCash and Investments (FY16) | 2538.6 croreEV (FY16) | 7652.8 Crore52 week H/L (|) 169 / 79 Equity capital | 336.9 CroreFace value | 5
Price Performance Return (%) 1M 3M 6M 12M
Engineers India Ltd 3.1 (1.3) 16.8 87.7
Larsen & Toubro Ltd 4.7 14.2 5.3 31.2
Price Movement
020406080100120140160180
Mar-17Dec-16Sep-16Jun-16Mar-16
0
2,000
4,000
6,000
8,000
10,000
EIL (R.H.S) Nifty (L.H.S)
Research Analyst
Chirag J Shah [email protected] Sagar K Gandhi [email protected]
Page 2ICICI Securities Ltd | Retail Equity Research
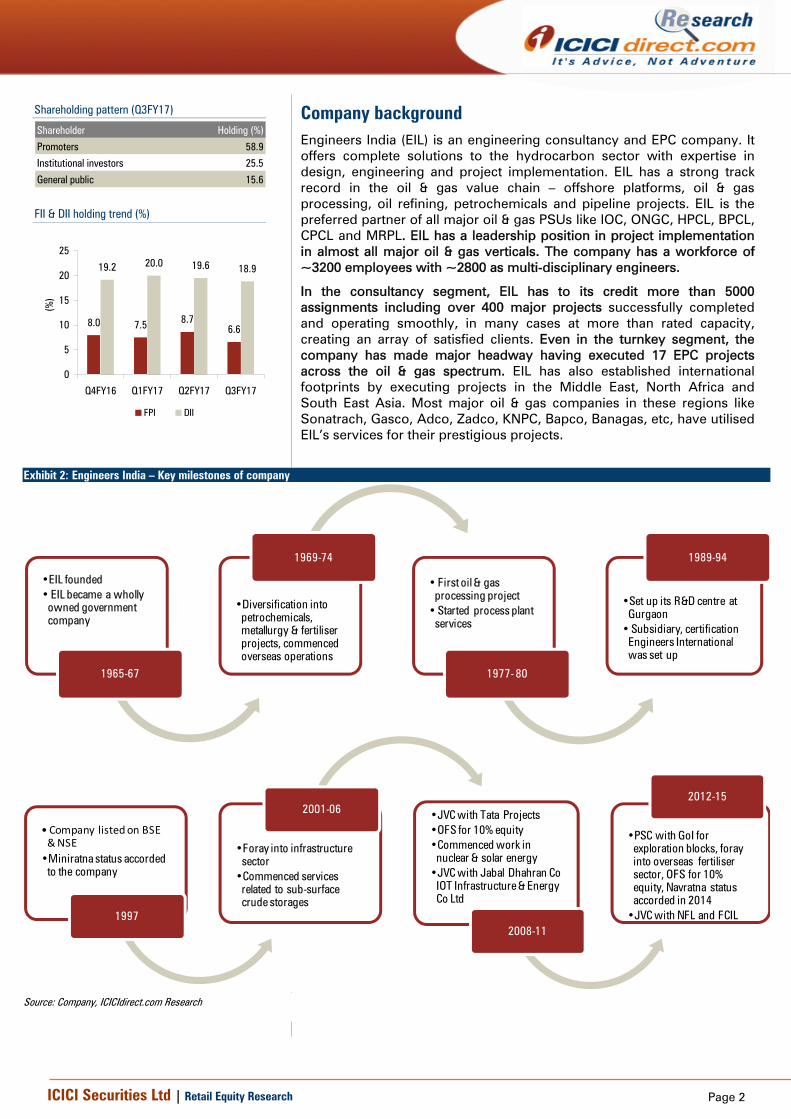
Company background Engineers India (EIL) is an engineering consultancy and EPC company. It offers complete solutions to the hydrocarbon sector with expertise in design, engineering and project implementation. EIL has a strong track record in the oil & gas value chain – offshore platforms, oil & gas processing, oil refining, petrochemicals and pipeline projects. EIL is the preferred partner of all major oil & gas PSUs like IOC, ONGC, HPCL, BPCL, CPCL and MRPL. EIL has a leadership position in project implementation in almost all major oil & gas verticals. The company has a workforce of ~3200 employees with ~2800 as multi-disciplinary engineers.
In the consultancy segment, EIL has to its credit more than 5000 assignments including over 400 major projects successfully completed and operating smoothly, in many cases at more than rated capacity, creating an array of satisfied clients. Even in the turnkey segment, the company has made major headway having executed 17 EPC projects across the oil & gas spectrum. EIL has also established international footprints by executing projects in the Middle East, North Africa and South East Asia. Most major oil & gas companies in these regions like Sonatrach, Gasco, Adco, Zadco, KNPC, Bapco, Banagas, etc, have utilised EIL’s services for their prestigious projects.
Exhibit 2: Engineers India – Key milestones of company
•EIL founded• EIL became a wholly
owned government company
1965-67
•Diversification into petrochemicals, metallurgy & fertiliser projects, commenced overseas operations
1969-74
• First oil & gas processing project
• Started process plant services
1977- 80
•Set up its R&D centre at Gurgaon
• Subsidiary, certification Engineers International was set up
1989-94
• Company listed on BSE & NSE
•Miniratna status accorded to the company
1997
•Foray into infrastructure sector
•Commenced services related to sub-surface crude storages
2001-06 •JVC with Tata Projects•OFS for 10% equity•Commenced work in
nuclear & solar energy •JVC with Jabal Dhahran Co
IOT Infrastructure & Energy Co Ltd
2008-11
•PSC with GoI for exploration blocks, foray into overseas fertiliser sector, OFS for 10% equity, Navratna status accorded in 2014
•JVC with NFL and FCIL
2012-15
Source: Company, ICICIdirect.com Research
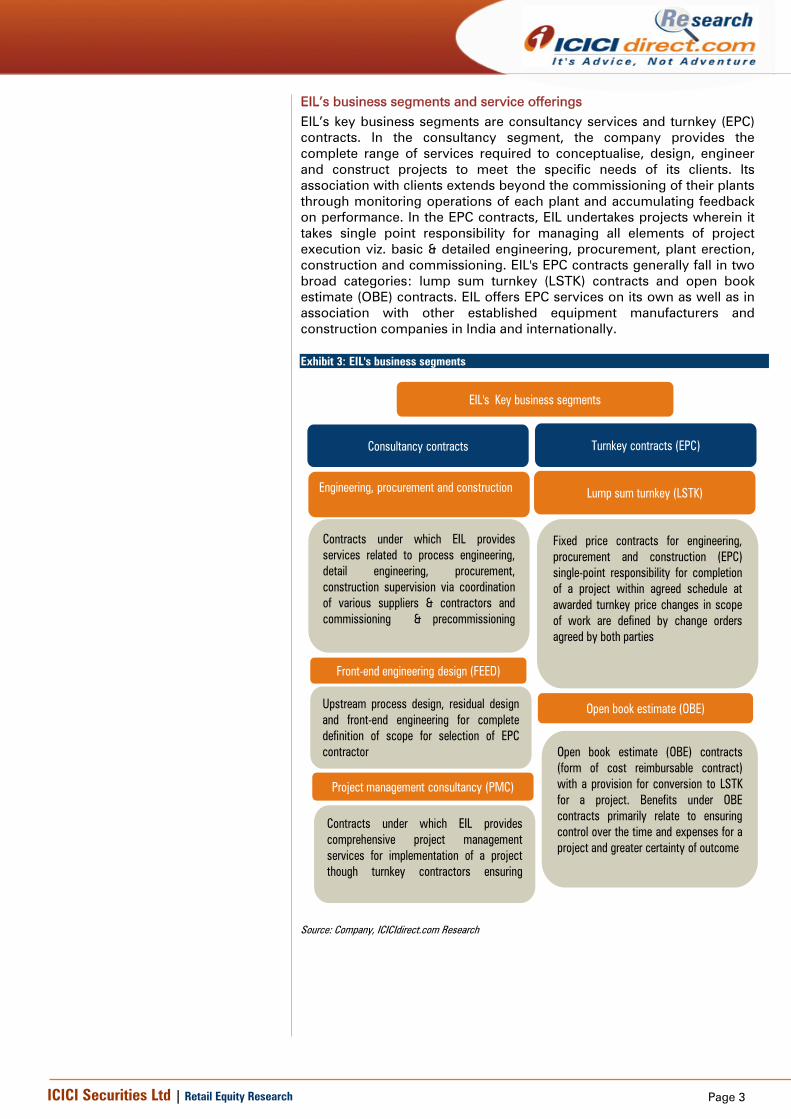
Shareholding pattern (Q3FY17)
Shareholder Holding (%)
Promoters 58.9
Institutional investors 25.5
General public 15.6
FII & DII holding trend (%)
8.0 7.5 8.76.6
19.2 20.0 19.6 18.9
0
5
10
15
20
25
Q4FY16 Q1FY17 Q2FY17 Q3FY17
(%)
FPI DII
Page 3ICICI Securities Ltd | Retail Equity Research
EIL’s business segments and service offerings EIL’s key business segments are consultancy services and turnkey (EPC) contracts. In the consultancy segment, the company provides the complete range of services required to conceptualise, design, engineer and construct projects to meet the specific needs of its clients. Its association with clients extends beyond the commissioning of their plants through monitoring operations of each plant and accumulating feedback on performance. In the EPC contracts, EIL undertakes projects wherein it takes single point responsibility for managing all elements of project execution viz. basic & detailed engineering, procurement, plant erection, construction and commissioning. EIL's EPC contracts generally fall in two broad categories: lump sum turnkey (LSTK) contracts and open book estimate (OBE) contracts. EIL offers EPC services on its own as well as in association with other established equipment manufacturers and construction companies in India and internationally. Exhibit 3: EIL's business segments
Fixed price contracts for engineering,procurement and construction (EPC)single-point responsibility for completionof a project within agreed schedule atawarded turnkey price changes in scopeof work are defined by change ordersagreed by both parties
Lump sum turnkey (LSTK)
Turnkey contracts (EPC)
Open book estimate (OBE)
Open book estimate (OBE) contracts(form of cost reimbursable contract)with a provision for conversion to LSTKfor a project. Benefits under OBEcontracts primarily relate to ensuringcontrol over the time and expenses for aproject and greater certainty of outcome
Contracts under which EIL providesservices related to process engineering,detail engineering, procurement,construction supervision via coordinationof various suppliers & contractors andcommissioning & precommissioning
Engineering, procurement and construction
Consultancy contracts
Upstream process design, residual designand front-end engineering for completedefinition of scope for selection of EPCcontractor
Front-end engineering design (FEED)
Contracts under which EIL providescomprehensive project managementservices for implementation of a projectthough turnkey contractors ensuring
Project management consultancy (PMC)
EIL's Key business segments
Source: Company, ICICIdirect.com Research
Page 4ICICI Securities Ltd | Retail Equity Research
EIL sector-wise revenue, geographical split, various areas of operations
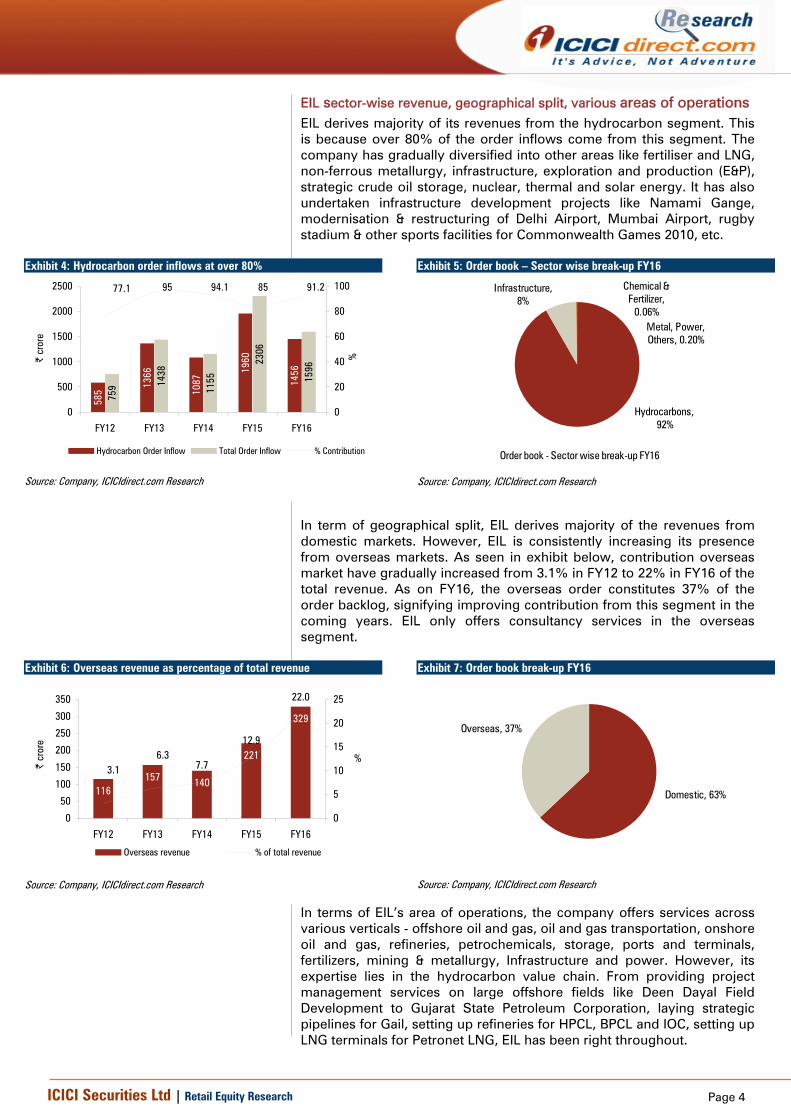
EIL derives majority of its revenues from the hydrocarbon segment. This is because over 80% of the order inflows come from this segment. The company has gradually diversified into other areas like fertiliser and LNG, non-ferrous metallurgy, infrastructure, exploration and production (E&P), strategic crude oil storage, nuclear, thermal and solar energy. It has also undertaken infrastructure development projects like Namami Gange, modernisation & restructuring of Delhi Airport, Mumbai Airport, rugby stadium & other sports facilities for Commonwealth Games 2010, etc.
Exhibit 4: Hydrocarbon order inflows at over 80%
585
1366
1087
1960
1456
759 14
38
1155
2306
1596
77.1 95 94.1 85 91.2
0
500
1000
1500
2000
2500
FY12 FY13 FY14 FY15 FY16
| cr
ore
0
20
40
60
80
100
%
Hydrocarbon Order Inflow Total Order Inflow % Contribution
Source: Company, ICICIdirect.com Research
Exhibit 5: Order book – Sector wise break-up FY16
Hydrocarbons, 92%
Infrastructure, 8%
Metal, Power, Others, 0.20%
Chemical & Fertilizer,
0.06%
Order book - Sector wise break-up FY16
Source: Company, ICICIdirect.com Research
In term of geographical split, EIL derives majority of the revenues from domestic markets. However, EIL is consistently increasing its presence from overseas markets. As seen in exhibit below, contribution overseas market have gradually increased from 3.1% in FY12 to 22% in FY16 of the total revenue. As on FY16, the overseas order constitutes 37% of the order backlog, signifying improving contribution from this segment in the coming years. EIL only offers consultancy services in the overseas segment.
Exhibit 6: Overseas revenue as percentage of total revenue
116157 140
221
329
7.7
12.9
22.0
3.16.3
0
50
100
150
200
250
300
350
FY12 FY13 FY14 FY15 FY16
| cr
ore
0
5
10
15
20
25
%
Overseas revenue % of total revenue
Source: Company, ICICIdirect.com Research
Exhibit 7: Order book break-up FY16
Domestic, 63%
Overseas, 37%
Source: Company, ICICIdirect.com Research
In terms of EIL’s area of operations, the company offers services across various verticals - offshore oil and gas, oil and gas transportation, onshore oil and gas, refineries, petrochemicals, storage, ports and terminals, fertilizers, mining & metallurgy, Infrastructure and power. However, its expertise lies in the hydrocarbon value chain. From providing project management services on large offshore fields like Deen Dayal Field Development to Gujarat State Petroleum Corporation, laying strategic pipelines for Gail, setting up refineries for HPCL, BPCL and IOC, setting up LNG terminals for Petronet LNG, EIL has been right throughout.
Page 5ICICI Securities Ltd | Retail Equity Research
The exhibits below highlight EIL’s expertise in various verticals by enumerating key projects that it has executed in these domains.
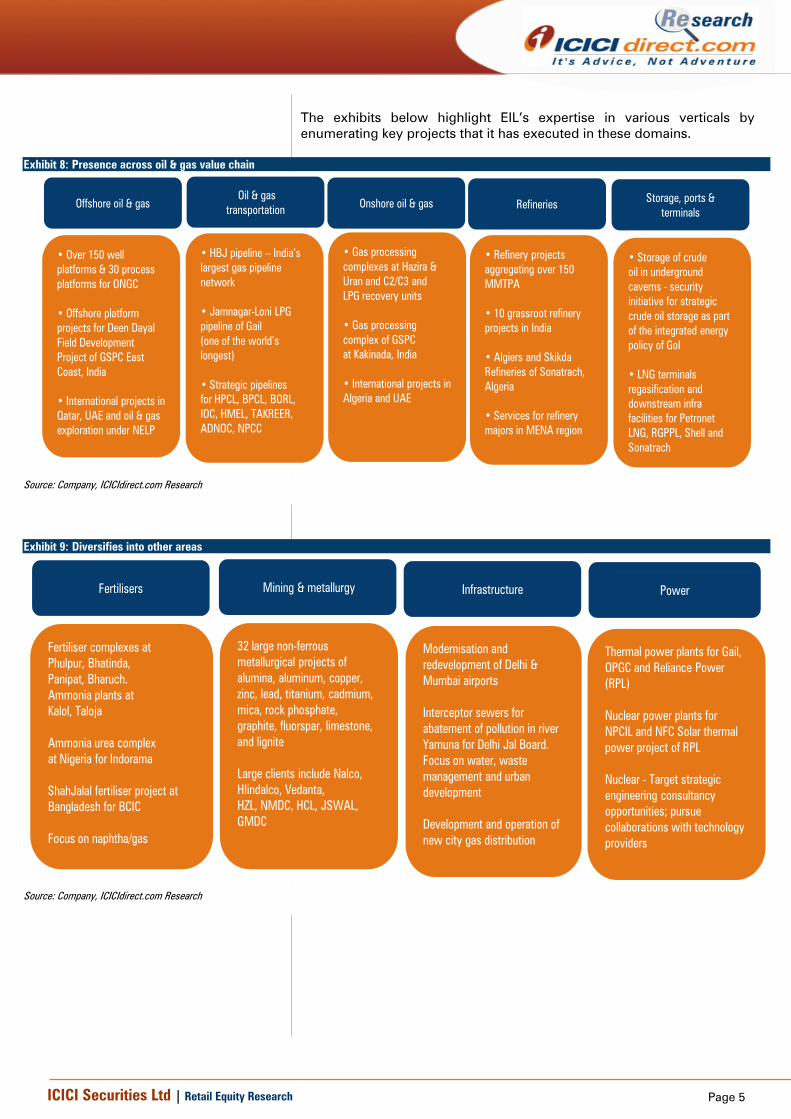
Exhibit 8: Presence across oil & gas value chain
Offshore oil & gas
• Over 150 well platforms & 30 process platforms for ONGC
• Offshore platform projects for Deen Dayal Field Development Project of GSPC East Coast, India
• International projects in Qatar, UAE and oil & gas exploration under NELP
Storage, ports &terminals
• Storage of crudeoil in undergroundcaverns - securityinitiative for strategic crude oil storage as part of the integrated energy policy of GoI
• LNG terminalsregasification anddownstream infrafacilities for Petronet LNG, RGPPL, Shell andSonatrach
Oil & gastransportation
• HBJ pipeline – India’s largest gas pipeline network
• Jamnagar-Loni LPGpipeline of Gail(one of the world’slongest)
• Strategic pipelinesfor HPCL, BPCL, BORL, IOC, HMEL, TAKREER,ADNOC, NPCC
Onshore oil & gas
• Gas processingcomplexes at Hazira & Uran and C2/C3 andLPG recovery units
• Gas processingcomplex of GSPCat Kakinada, India
• International projects in Algeria and UAE
Refineries
• Refinery projects aggregating over 150 MMTPA
• 10 grassroot refinery projects in India
• Algiers and SkikdaRefineries of Sonatrach, Algeria
• Services for refinerymajors in MENA region
Source: Company, ICICIdirect.com Research
Exhibit 9: Diversifies into other areas
Fertilisers
Fertiliser complexes atPhulpur, Bhatinda,Panipat, Bharuch.Ammonia plants atKalol, Taloja
Ammonia urea complexat Nigeria for Indorama
ShahJalal fertiliser project at Bangladesh for BCIC
Focus on naphtha/gas
Mining & metallurgy
32 large non-ferrousmetallurgical projects ofalumina, aluminum, copper, zinc, lead, titanium, cadmium, mica, rock phosphate, graphite, fluorspar, limestone, and lignite
Large clients include Nalco, HIindalco, Vedanta,HZL, NMDC, HCL, JSWAL, GMDC
Infrastructure
Modernisation and redevelopment of Delhi & Mumbai airports
Interceptor sewers forabatement of pollution in river Yamuna for Delhi Jal Board. Focus on water, waste management and urban development
Development and operation of new city gas distribution
Power
Thermal power plants for Gail, OPGC and Reliance Power (RPL)
Nuclear power plants for NPCIL and NFC Solar thermal power project of RPL
Nuclear - Target strategic engineering consultancy opportunities; pursue collaborations with technology providers
Source: Company, ICICIdirect.com Research
Page 6ICICI Securities Ltd | Retail Equity Research
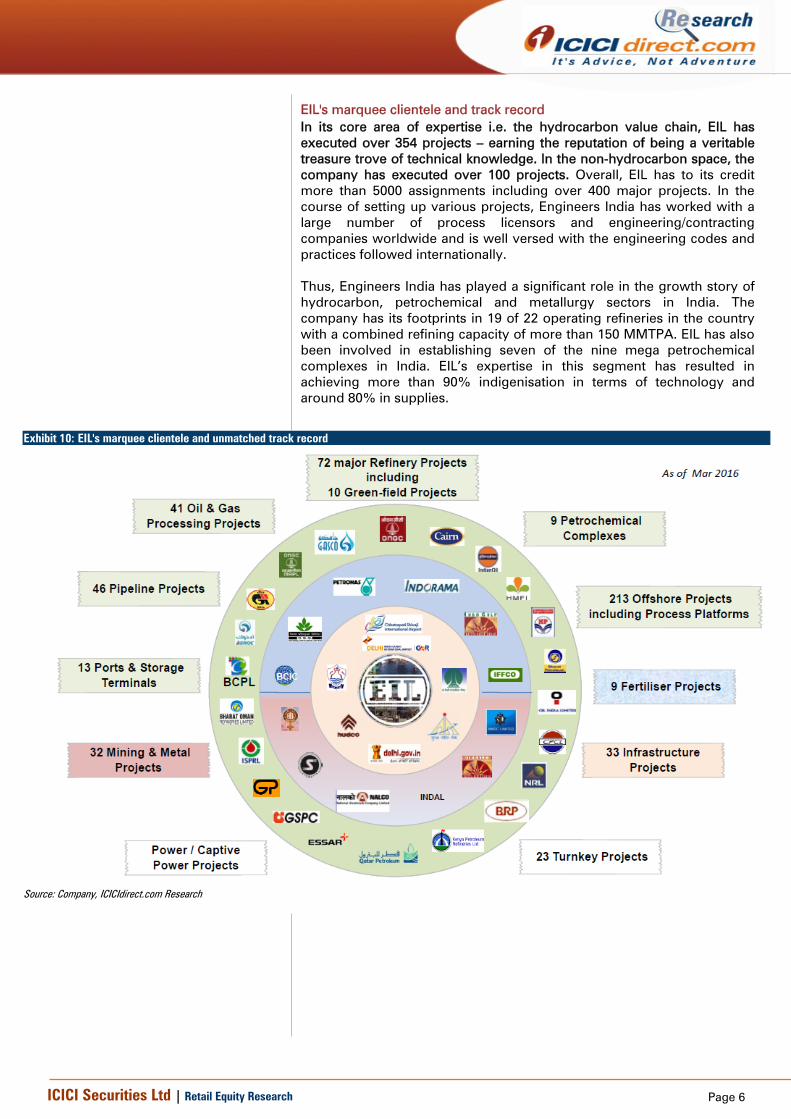
EIL's marquee clientele and track record In its core area of expertise i.e. the hydrocarbon value chain, EIL has executed over 354 projects – earning the reputation of being a veritable treasure trove of technical knowledge. In the non-hydrocarbon space, the company has executed over 100 projects. Overall, EIL has to its credit more than 5000 assignments including over 400 major projects. In the course of setting up various projects, Engineers India has worked with a large number of process licensors and engineering/contracting companies worldwide and is well versed with the engineering codes and practices followed internationally. Thus, Engineers India has played a significant role in the growth story of hydrocarbon, petrochemical and metallurgy sectors in India. The company has its footprints in 19 of 22 operating refineries in the country with a combined refining capacity of more than 150 MMTPA. EIL has also been involved in establishing seven of the nine mega petrochemical complexes in India. EIL’s expertise in this segment has resulted in achieving more than 90% indigenisation in terms of technology and around 80% in supplies.
Exhibit 10: EIL's marquee clientele and unmatched track record
Source: Company, ICICIdirect.com Research
Page 7ICICI Securities Ltd | Retail Equity Research
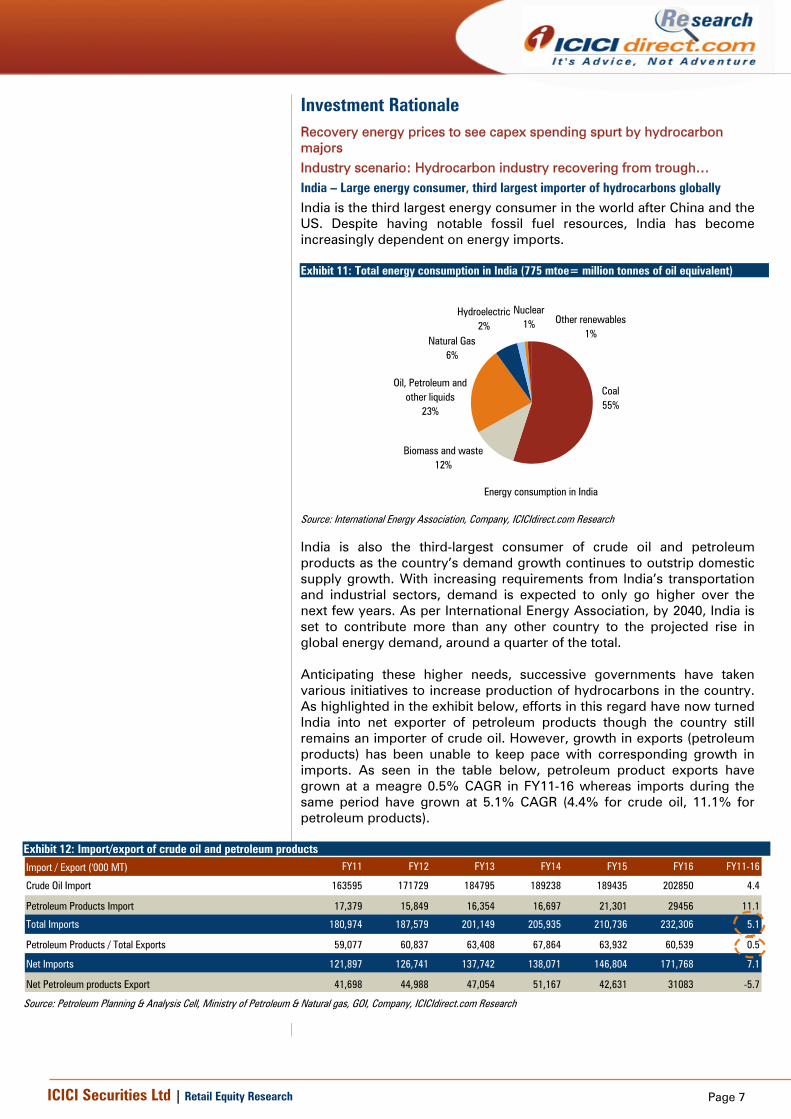
Investment Rationale Recovery energy prices to see capex spending spurt by hydrocarbon majors Industry scenario: Hydrocarbon industry recovering from trough… India – Large energy consumer, third largest importer of hydrocarbons globally India is the third largest energy consumer in the world after China and the US. Despite having notable fossil fuel resources, India has become increasingly dependent on energy imports. Exhibit 11: Total energy consumption in India (775 mtoe= million tonnes of oil equivalent)
Energy consumption in India
Coal55%
Biomass and waste12%
Oil, Petroleum and other liquids
23%
Natural Gas6%
Hydroelectric2%
Nuclear1% Other renewables
1%
Source: International Energy Association, Company, ICICIdirect.com Research
India is also the third-largest consumer of crude oil and petroleum products as the country’s demand growth continues to outstrip domestic supply growth. With increasing requirements from India’s transportation and industrial sectors, demand is expected to only go higher over the next few years. As per International Energy Association, by 2040, India is set to contribute more than any other country to the projected rise in global energy demand, around a quarter of the total. Anticipating these higher needs, successive governments have taken various initiatives to increase production of hydrocarbons in the country. As highlighted in the exhibit below, efforts in this regard have now turned India into net exporter of petroleum products though the country still remains an importer of crude oil. However, growth in exports (petroleum products) has been unable to keep pace with corresponding growth in imports. As seen in the table below, petroleum product exports have grown at a meagre 0.5% CAGR in FY11-16 whereas imports during the same period have grown at 5.1% CAGR (4.4% for crude oil, 11.1% for petroleum products).
Exhibit 12: Import/export of crude oil and petroleum products
Import / Export ('000 MT) FY11 FY12 FY13 FY14 FY15 FY16 FY11-16
Crude Oil Import 163595 171729 184795 189238 189435 202850 4.4
Petroleum Products Import 17,379 15,849 16,354 16,697 21,301 29456 11.1
Total Imports 180,974 187,579 201,149 205,935 210,736 232,306 5.1
Petroleum Products / Total Exports 59,077 60,837 63,408 67,864 63,932 60,539 0.5
Net Imports 121,897 126,741 137,742 138,071 146,804 171,768 7.1
Net Petroleum products Export 41,698 44,988 47,054 51,167 42,631 31083 -5.7
Source: Petroleum Planning & Analysis Cell, Ministry of Petroleum & Natural gas, GOI, Company, ICICIdirect.com Research
Page 8ICICI Securities Ltd | Retail Equity Research
Increasing India’s hydrocarbon production, through large spending by Oil PSUs
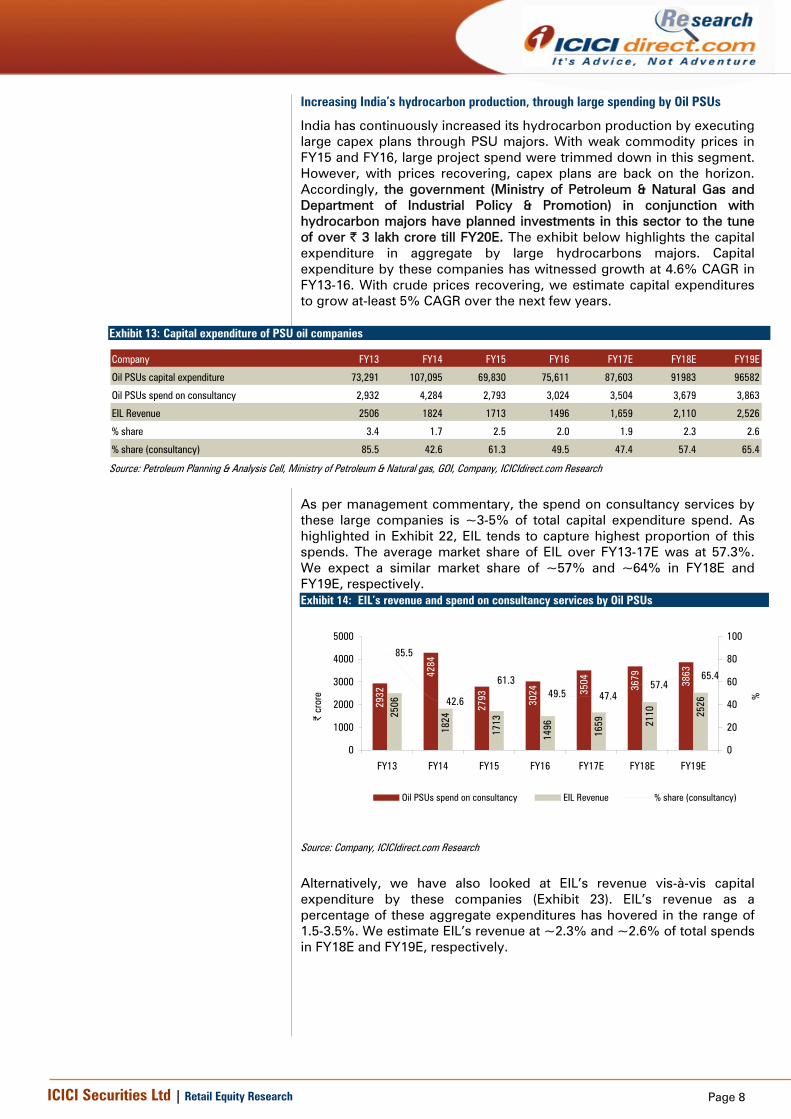
India has continuously increased its hydrocarbon production by executing large capex plans through PSU majors. With weak commodity prices in FY15 and FY16, large project spend were trimmed down in this segment. However, with prices recovering, capex plans are back on the horizon. Accordingly, the government (Ministry of Petroleum & Natural Gas and Department of Industrial Policy & Promotion) in conjunction with hydrocarbon majors have planned investments in this sector to the tune of over | 3 lakh crore till FY20E. The exhibit below highlights the capital expenditure in aggregate by large hydrocarbons majors. Capital expenditure by these companies has witnessed growth at 4.6% CAGR in FY13-16. With crude prices recovering, we estimate capital expenditures to grow at-least 5% CAGR over the next few years.
Exhibit 13: Capital expenditure of PSU oil companies
Company FY13 FY14 FY15 FY16 FY17E FY18E FY19E
Oil PSUs capital expenditure 73,291 107,095 69,830 75,611 87,603 91983 96582
Oil PSUs spend on consultancy 2,932 4,284 2,793 3,024 3,504 3,679 3,863
EIL Revenue 2506 1824 1713 1496 1,659 2,110 2,526
% share 3.4 1.7 2.5 2.0 1.9 2.3 2.6
% share (consultancy) 85.5 42.6 61.3 49.5 47.4 57.4 65.4
Source: Petroleum Planning & Analysis Cell, Ministry of Petroleum & Natural gas, GOI, Company, ICICIdirect.com Research
As per management commentary, the spend on consultancy services by these large companies is ~3-5% of total capital expenditure spend. As highlighted in Exhibit 22, EIL tends to capture highest proportion of this spends. The average market share of EIL over FY13-17E was at 57.3%. We expect a similar market share of ~57% and ~64% in FY18E and FY19E, respectively. Exhibit 14: EIL’s revenue and spend on consultancy services by Oil PSUs
2932
4284
2793 30
24 3504 3679 3863
2506
1824
1713
1496
1659 21
10 2526
85.5
42.6
61.349.5 47.4
57.465.4
0
1000
2000
3000
4000
5000
FY13 FY14 FY15 FY16 FY17E FY18E FY19E
| cr
ore
0
20
40
60
80
100
%
Oil PSUs spend on consultancy EIL Revenue % share (consultancy)
Source: Company, ICICIdirect.com Research
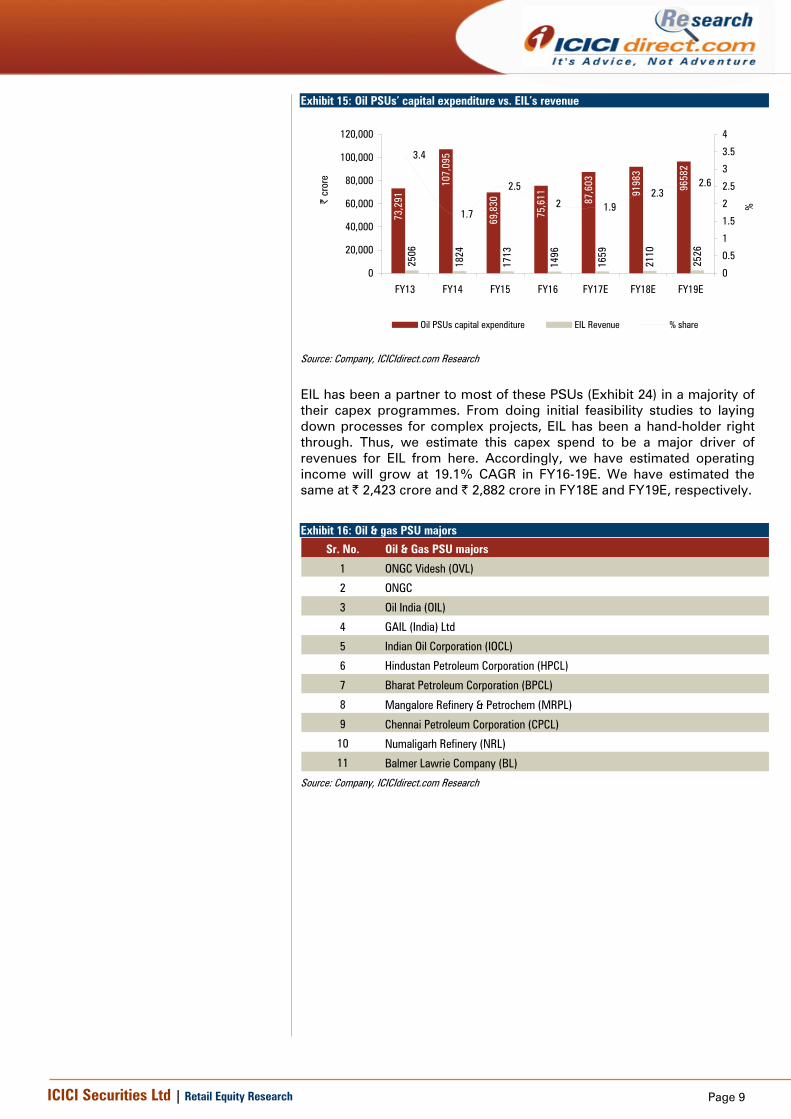
Alternatively, we have also looked at EIL’s revenue vis-à-vis capital expenditure by these companies (Exhibit 23). EIL’s revenue as a percentage of these aggregate expenditures has hovered in the range of 1.5-3.5%. We estimate EIL’s revenue at ~2.3% and ~2.6% of total spends in FY18E and FY19E, respectively.
Page 9ICICI Securities Ltd | Retail Equity Research
Exhibit 15: Oil PSUs’ capital expenditure vs. EIL’s revenue
73,2
91
107,
095
69,8
30
75,6
11 87,6
03
9198
3
9658
2
2506
1824
1713
1496
1659
2110
2526
3.4
1.7
2.5
2 1.92.3
2.6
0
20,000
40,000
60,000
80,000
100,000
120,000
FY13 FY14 FY15 FY16 FY17E FY18E FY19E
| cr
ore
0
0.5
1
1.5
2
2.5
3
3.5
4
%
Oil PSUs capital expenditure EIL Revenue % share
Source: Company, ICICIdirect.com Research
EIL has been a partner to most of these PSUs (Exhibit 24) in a majority of their capex programmes. From doing initial feasibility studies to laying down processes for complex projects, EIL has been a hand-holder right through. Thus, we estimate this capex spend to be a major driver of revenues for EIL from here. Accordingly, we have estimated operating income will grow at 19.1% CAGR in FY16-19E. We have estimated the same at | 2,423 crore and | 2,882 crore in FY18E and FY19E, respectively.
Exhibit 16: Oil & gas PSU majors
Sr. No. Oil & Gas PSU majors
1 ONGC Videsh (OVL)
2 ONGC
3 Oil India (OIL)
4 GAIL (India) Ltd
5 Indian Oil Corporation (IOCL)
6 Hindustan Petroleum Corporation (HPCL)
7 Bharat Petroleum Corporation (BPCL)
8 Mangalore Refinery & Petrochem (MRPL)
9 Chennai Petroleum Corporation (CPCL)
10 Numaligarh Refinery (NRL)
11 Balmer Lawrie Company (BL)
Source: Company, ICICIdirect.com Research
Page 10ICICI Securities Ltd | Retail Equity Research
Overseas hydrocarbon capex: Storehouse of opportunity
EIL’s overseas presence
Engineers India has a significant overseas presence with offices in the UK, UAE, Malaysia, China & Italy. EIL is continuously expanding its international operations to establish a global execution platform. The company is seeking to identify markets where it can provide cost and operational advantages to clients and distinguish itself from other competitors. EIL is particularly focused on regions where it has previously implemented projects like in the Middle East, North Africa and South East Asia to capitalise on its local experience, established contacts with local clients & suppliers and familiarity of the local working conditions. It has executed some major projects that led EIL to emerge as a global player. Exhibit 17: Major projects executed in overseas markets
Sr. No. Major projects executed in overseas markets
1
Dangote Refinery and Petrochemical Project comprising a 460,000 bpsd grassroot petroleum refinery & 690,000 TPA petrochemical complex at Lekki Free Trade Zone, Nigeria for Dangote oil refining company
2Liwa Plastics Project in Sohar, Oman for Oman Refineries and Petroleum Industries Company (Orpic)
3 Qusahwira Field Development of ADCO, Abu Dhabi
4 Pipeline Projects (five) of Abu Dhabi Gas Industries (Gasco), Abu Dhabi
5 Rehabilitation & Adaptation of Algiers & Skikda Refineries of Sonatrach, Algeria
6Olefins conversion unit and Polypropylene Unit of Abu Dhabi Polymer Company (Borouge) at Ruwais, Abu Dhabi
7 Replacement of NGL Pipeline Network of Gasco, Abu Dhabi
8 Development of engineering capabilities for Sonatrach, Algeria
9Integrity enhancement of fire protection system for Abu Dhabi Refinery Ph-II & Ph-III of Abu Dhabi Oil Refining Company (Takreer), Abu Dhabi
10Ethylbenzene and styrene monomer plant at Bandar Assaluyeh Petrochemical Industries Development Company (PIDMCO), Iran
11 ABBR modification project of Gasco, Abu Dhabi
12 Aromatics complex in Kuwait for Technimont, Italy13 Mumbasa refinery upgrade project of Kenya Petroleum Refineries (KPRL), Kenya14 Engineering Services to Qatar Petrochemical Company (QAPCO), Qatar
15Design & engineering of water injection plant and cathodic protection system for pipelines of Petro Venezolana SA, Venezuela
Source: Company, ICICIdirect.com Research
Targeting regions with high spending power – Middle East & North Africa According to the International Energy Agency (IEA), global investments in the oil & gas space witnessed cuts for three consecutive years of 2014, 2015 and 2016, the first time since the mid-1980s. Against this trend, the Middle East & North Africa (MENA) region saw heavy investments as major energy-exporting countries in this region wanted to expand their size and, consequently, strengthen their positions in global markets. The Gulf Cooperation Council (GCC), an alliance of six Middle Eastern countries (Saudi Arabia, Kuwait, the United Arab Emirates, Qatar, Bahrain and Oman) as well as Iran and Iraq, made regular investments so as to be well positioned when prices take an upturn.
Planned investments in the hydrocarbon sector in the MENA region are estimated at $417 billion for the five-year period 2016-20. Within the hydrocarbon space, the oil & gas sector’s planned spend is at $190 billion and $149 billion, respectively, whereas the same is at $78 billion in the petrochemical sector in 2016-20.
Page 11ICICI Securities Ltd | Retail Equity Research
Exhibit 18: Planned MENA investments in hydrocarbon sector in FY16-20
Planned expendiutre in hydrocarbon sector $ bn In | crore
Oil & Gas 339 2271300
Petroleum chemicals 78 522600
Total spend 417 2793900
Source: EPICORP Energy Research, Company, ICICIdirect.com Research
Committed investments This includes investments in projects currently being executed, that is, contracts for these projects have been signed. Total committed investment is the sum of the estimated cost over the five-year period based on the contract value. Of the planned investments of $417 billion, investments in projects under execution are at $208 billion. The oil sector accounts for the largest share of investments at $110 billion, with the majority in upstream projects. Total committed gas investments are at $76 billion, followed by petrochemicals at $22 billion. In rupee terms, this number is at | 13, 93,600 crore. Exhibit 19: Committed MENA investments in hydrocarbon sector
Committed investments in hydrocarbon sector $ bn In | crore
Oil & gas 186 1246200
Petroleum chemicals 22 147400
Total spend 208 1393600 Source: EPICORP Energy Research, Company, ICICIdirect.com Research
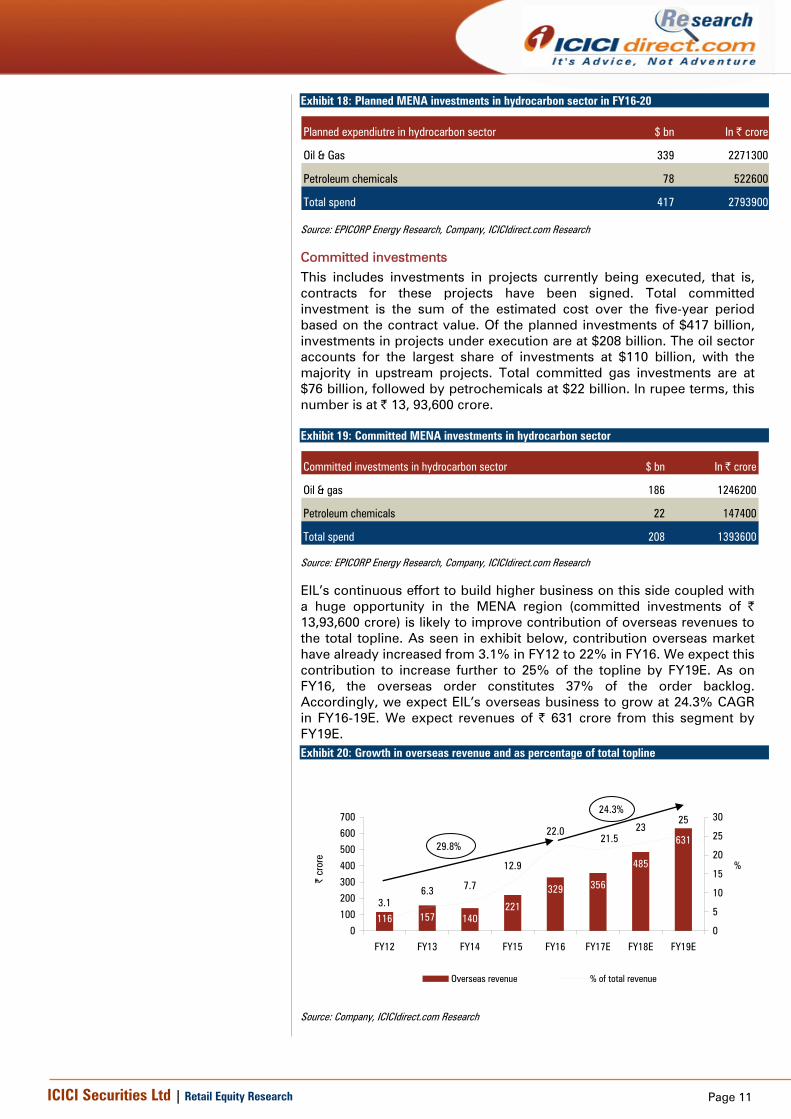
EIL’s continuous effort to build higher business on this side coupled with a huge opportunity in the MENA region (committed investments of | 13,93,600 crore) is likely to improve contribution of overseas revenues to the total topline. As seen in exhibit below, contribution overseas market have already increased from 3.1% in FY12 to 22% in FY16. We expect this contribution to increase further to 25% of the topline by FY19E. As on FY16, the overseas order constitutes 37% of the order backlog. Accordingly, we expect EIL’s overseas business to grow at 24.3% CAGR in FY16-19E. We expect revenues of | 631 crore from this segment by FY19E. Exhibit 20: Growth in overseas revenue and as percentage of total topline
116 157 140221
329 356
485
631
3.16.3 7.7
12.9
22.0 2325
21.5
0
100
200
300
400
500
600
700
FY12 FY13 FY14 FY15 FY16 FY17E FY18E FY19E
| cr
ore
0
5
10
15
20
25
30
%
Overseas revenue % of total revenue
29.8%
24.3%
Source: Company, ICICIdirect.com Research
Page 12ICICI Securities Ltd | Retail Equity Research
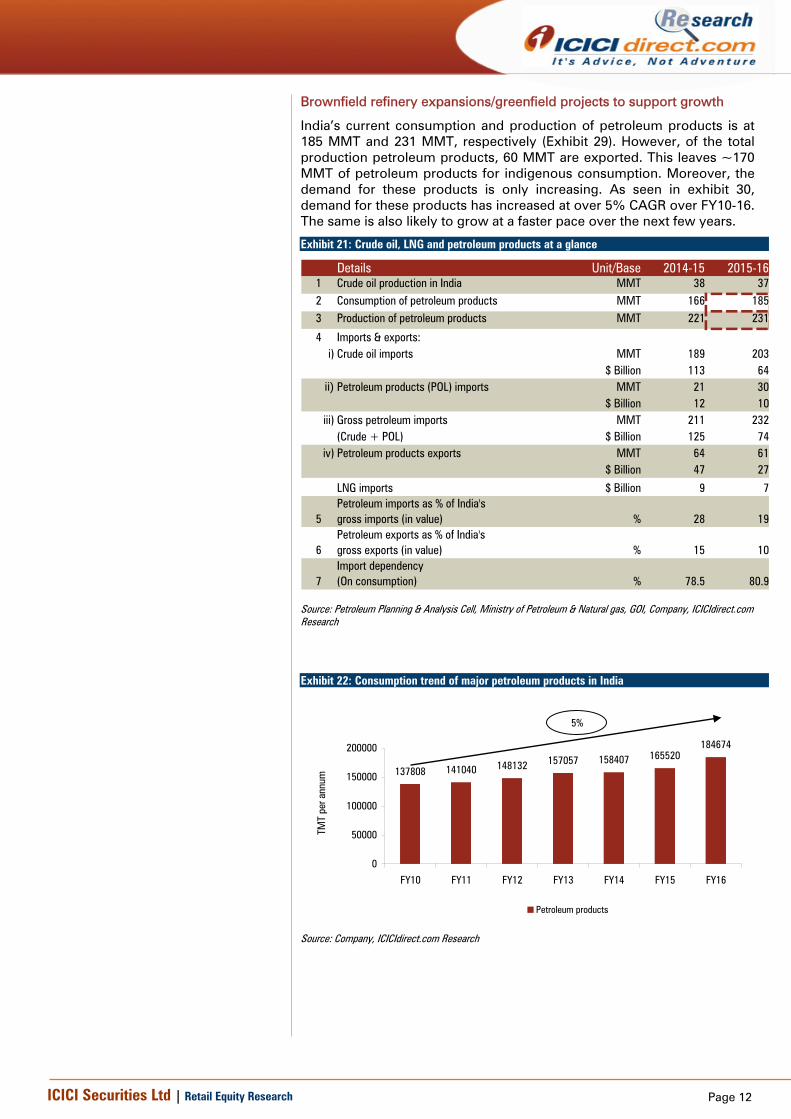
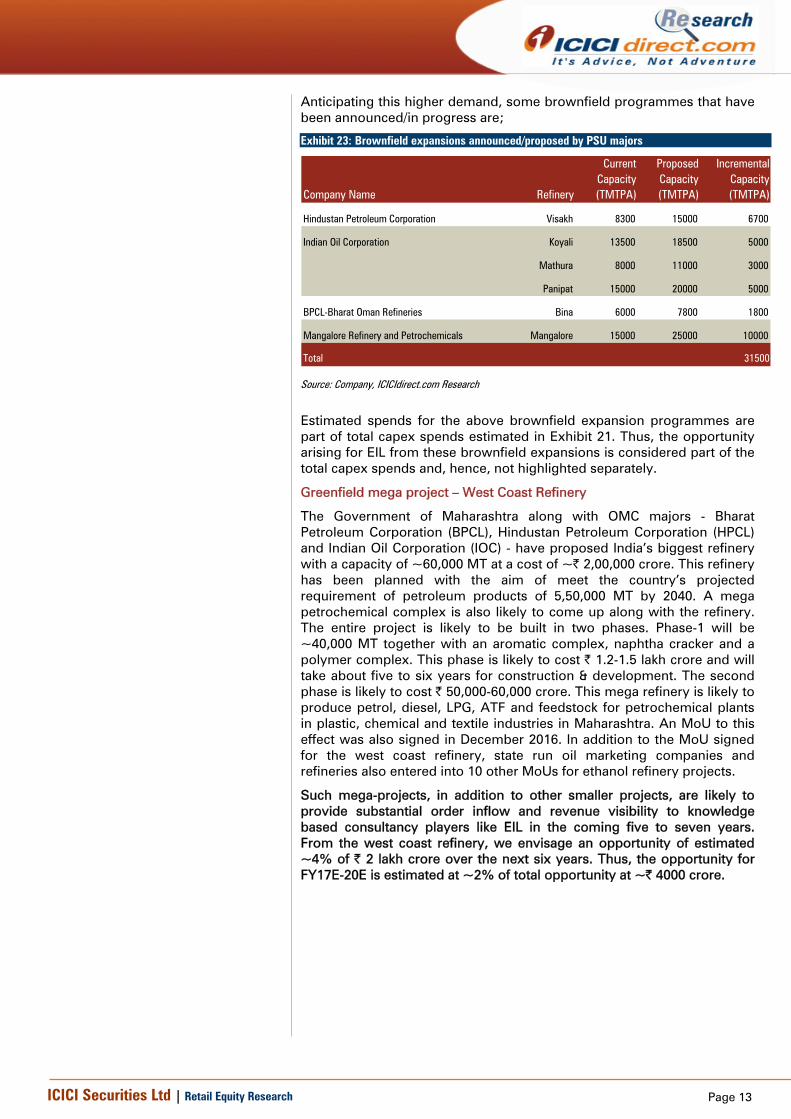
Brownfield refinery expansions/greenfield projects to support growth
India’s current consumption and production of petroleum products is at 185 MMT and 231 MMT, respectively (Exhibit 29). However, of the total production petroleum products, 60 MMT are exported. This leaves ~170 MMT of petroleum products for indigenous consumption. Moreover, the demand for these products is only increasing. As seen in exhibit 30, demand for these products has increased at over 5% CAGR over FY10-16. The same is also likely to grow at a faster pace over the next few years.
Exhibit 21: Crude oil, LNG and petroleum products at a glance
Details Unit/Base 2014-15 2015-161 Crude oil production in India MMT 38 372 Consumption of petroleum products MMT 166 1853 Production of petroleum products MMT 221 231
4 Imports & exports:i) Crude oil imports MMT 189 203
$ Billion 113 64ii) Petroleum products (POL) imports MMT 21 30
$ Billion 12 10iii) Gross petroleum imports MMT 211 232
(Crude + POL) $ Billion 125 74iv) Petroleum products exports MMT 64 61
$ Billion 47 27
LNG imports $ Billion 9 7
5Petroleum imports as % of India'sgross imports (in value) % 28 19
6Petroleum exports as % of India'sgross exports (in value) % 15 10
7Import dependency(On consumption) % 78.5 80.9
Source: Petroleum Planning & Analysis Cell, Ministry of Petroleum & Natural gas, GOI, Company, ICICIdirect.com Research
Exhibit 22: Consumption trend of major petroleum products in India
137808 141040 148132 157057 158407 165520184674
0
50000
100000
150000
200000
FY10 FY11 FY12 FY13 FY14 FY15 FY16
TMT
per a
nnum
Petroleum products
5%
Source: Company, ICICIdirect.com Research
Page 13ICICI Securities Ltd | Retail Equity Research
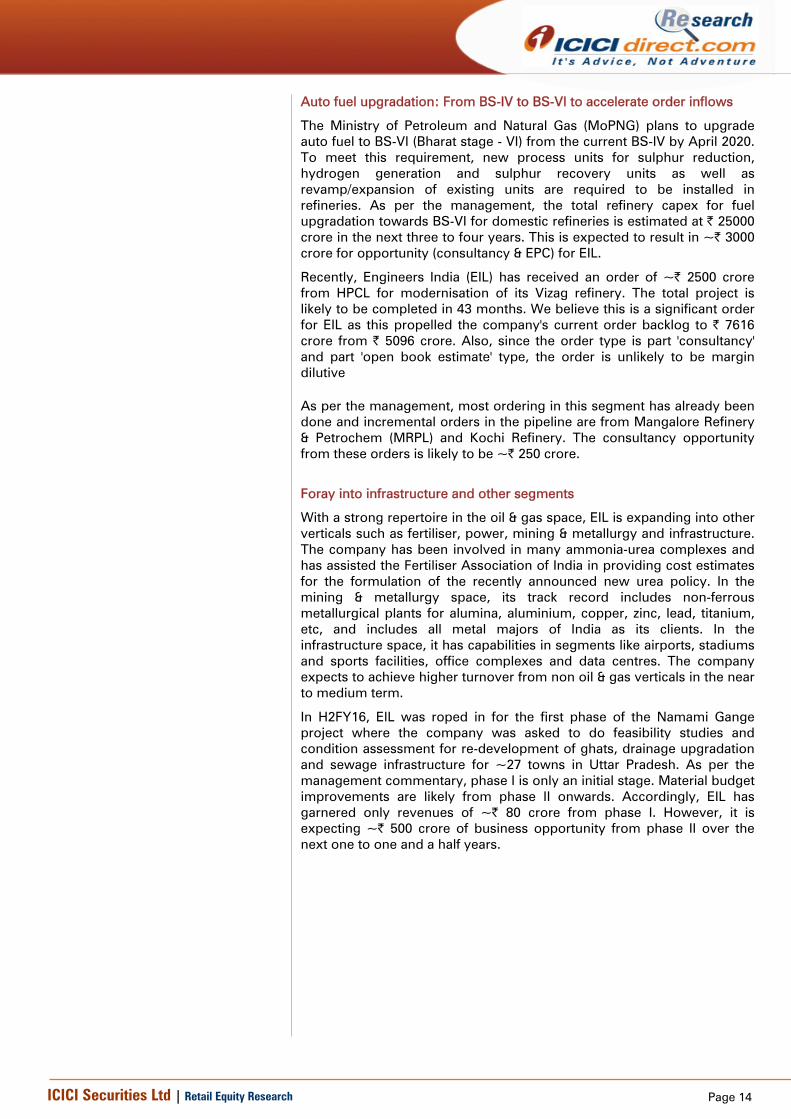
Anticipating this higher demand, some brownfield programmes that have been announced/in progress are;
Exhibit 23: Brownfield expansions announced/proposed by PSU majors
Company Name Refinery
Current Capacity (TMTPA)
Proposed Capacity (TMTPA)
Incremental Capacity (TMTPA)
Hindustan Petroleum Corporation Visakh 8300 15000 6700
Indian Oil Corporation Koyali 13500 18500 5000
Mathura 8000 11000 3000
Panipat 15000 20000 5000
BPCL-Bharat Oman Refineries Bina 6000 7800 1800
Mangalore Refinery and Petrochemicals Mangalore 15000 25000 10000
Total 31500
Source: Company, ICICIdirect.com Research
Estimated spends for the above brownfield expansion programmes are part of total capex spends estimated in Exhibit 21. Thus, the opportunity arising for EIL from these brownfield expansions is considered part of the total capex spends and, hence, not highlighted separately.
Greenfield mega project – West Coast Refinery
The Government of Maharashtra along with OMC majors - Bharat Petroleum Corporation (BPCL), Hindustan Petroleum Corporation (HPCL) and Indian Oil Corporation (IOC) - have proposed India’s biggest refinery with a capacity of ~60,000 MT at a cost of ~| 2,00,000 crore. This refinery has been planned with the aim of meet the country’s projected requirement of petroleum products of 5,50,000 MT by 2040. A mega petrochemical complex is also likely to come up along with the refinery. The entire project is likely to be built in two phases. Phase-1 will be ~40,000 MT together with an aromatic complex, naphtha cracker and a polymer complex. This phase is likely to cost | 1.2-1.5 lakh crore and will take about five to six years for construction & development. The second phase is likely to cost | 50,000-60,000 crore. This mega refinery is likely to produce petrol, diesel, LPG, ATF and feedstock for petrochemical plants in plastic, chemical and textile industries in Maharashtra. An MoU to this effect was also signed in December 2016. In addition to the MoU signed for the west coast refinery, state run oil marketing companies and refineries also entered into 10 other MoUs for ethanol refinery projects.
Such mega-projects, in addition to other smaller projects, are likely to provide substantial order inflow and revenue visibility to knowledge based consultancy players like EIL in the coming five to seven years. From the west coast refinery, we envisage an opportunity of estimated ~4% of | 2 lakh crore over the next six years. Thus, the opportunity for FY17E-20E is estimated at ~2% of total opportunity at ~| 4000 crore.
Page 14ICICI Securities Ltd | Retail Equity Research
Auto fuel upgradation: From BS-IV to BS-VI to accelerate order inflows
The Ministry of Petroleum and Natural Gas (MoPNG) plans to upgrade auto fuel to BS-VI (Bharat stage - VI) from the current BS-IV by April 2020. To meet this requirement, new process units for sulphur reduction, hydrogen generation and sulphur recovery units as well as revamp/expansion of existing units are required to be installed in refineries. As per the management, the total refinery capex for fuel upgradation towards BS-VI for domestic refineries is estimated at | 25000 crore in the next three to four years. This is expected to result in ~| 3000 crore for opportunity (consultancy & EPC) for EIL.
Recently, Engineers India (EIL) has received an order of ~| 2500 crore from HPCL for modernisation of its Vizag refinery. The total project is likely to be completed in 43 months. We believe this is a significant order for EIL as this propelled the company's current order backlog to | 7616 crore from | 5096 crore. Also, since the order type is part 'consultancy' and part 'open book estimate' type, the order is unlikely to be margin dilutive As per the management, most ordering in this segment has already been done and incremental orders in the pipeline are from Mangalore Refinery & Petrochem (MRPL) and Kochi Refinery. The consultancy opportunity from these orders is likely to be ~| 250 crore.
Foray into infrastructure and other segments
With a strong repertoire in the oil & gas space, EIL is expanding into other verticals such as fertiliser, power, mining & metallurgy and infrastructure. The company has been involved in many ammonia-urea complexes and has assisted the Fertiliser Association of India in providing cost estimates for the formulation of the recently announced new urea policy. In the mining & metallurgy space, its track record includes non-ferrous metallurgical plants for alumina, aluminium, copper, zinc, lead, titanium, etc, and includes all metal majors of India as its clients. In the infrastructure space, it has capabilities in segments like airports, stadiums and sports facilities, office complexes and data centres. The company expects to achieve higher turnover from non oil & gas verticals in the near to medium term.
In H2FY16, EIL was roped in for the first phase of the Namami Gange project where the company was asked to do feasibility studies and condition assessment for re-development of ghats, drainage upgradation and sewage infrastructure for ~27 towns in Uttar Pradesh. As per the management commentary, phase I is only an initial stage. Material budget improvements are likely from phase II onwards. Accordingly, EIL has garnered only revenues of ~| 80 crore from phase I. However, it is expecting ~| 500 crore of business opportunity from phase II over the next one to one and a half years.
Page 15ICICI Securities Ltd | Retail Equity Research
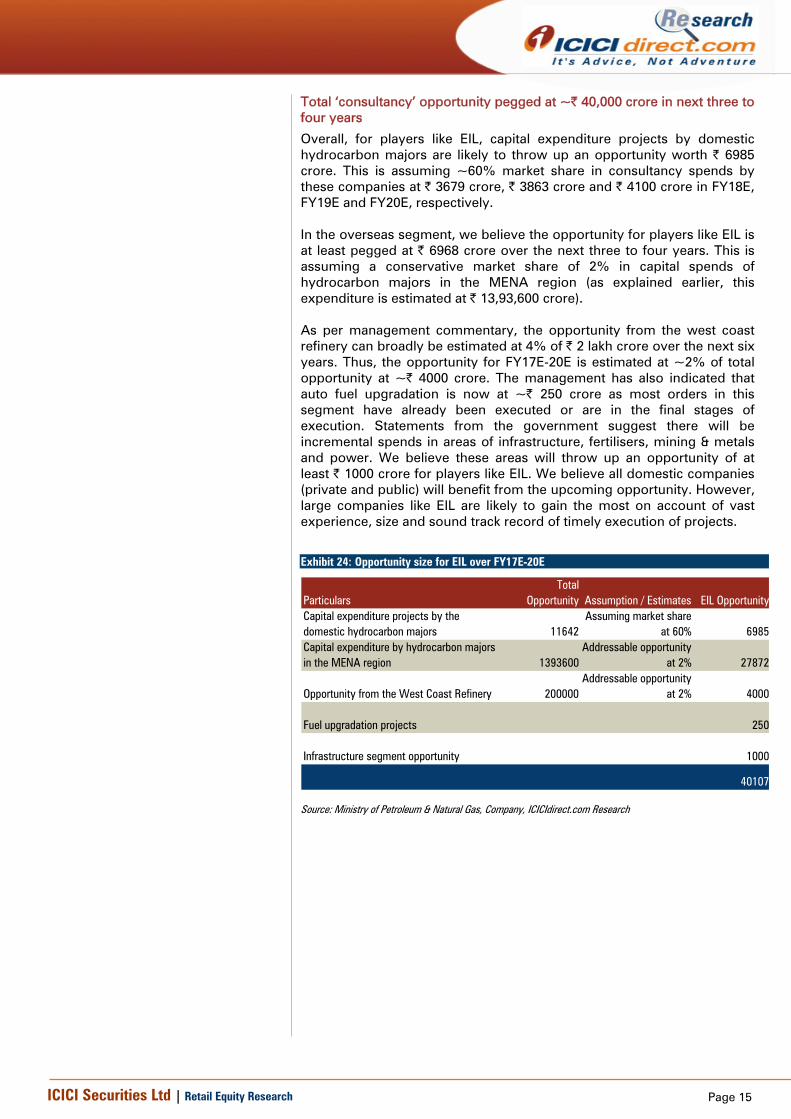
Total ‘consultancy’ opportunity pegged at ~| 40,000 crore in next three to four years
Overall, for players like EIL, capital expenditure projects by domestic hydrocarbon majors are likely to throw up an opportunity worth | 6985 crore. This is assuming ~60% market share in consultancy spends by these companies at | 3679 crore, | 3863 crore and | 4100 crore in FY18E, FY19E and FY20E, respectively. In the overseas segment, we believe the opportunity for players like EIL is at least pegged at | 6968 crore over the next three to four years. This is assuming a conservative market share of 2% in capital spends of hydrocarbon majors in the MENA region (as explained earlier, this expenditure is estimated at | 13,93,600 crore). As per management commentary, the opportunity from the west coast refinery can broadly be estimated at 4% of | 2 lakh crore over the next six years. Thus, the opportunity for FY17E-20E is estimated at ~2% of total opportunity at ~| 4000 crore. The management has also indicated that auto fuel upgradation is now at ~| 250 crore as most orders in this segment have already been executed or are in the final stages of execution. Statements from the government suggest there will be incremental spends in areas of infrastructure, fertilisers, mining & metals and power. We believe these areas will throw up an opportunity of at least | 1000 crore for players like EIL. We believe all domestic companies (private and public) will benefit from the upcoming opportunity. However, large companies like EIL are likely to gain the most on account of vast experience, size and sound track record of timely execution of projects.
Exhibit 24: Opportunity size for EIL over FY17E-20E
ParticularsTotal
Opportunity Assumption / Estimates EIL OpportunityCapital expenditure projects by the domestic hydrocarbon majors 11642
Assuming market share at 60% 6985
Capital expenditure by hydrocarbon majors in the MENA region 1393600
Addressable opportunity at 2% 27872
Opportunity from the West Coast Refinery 200000Addressable opportunity
at 2% 4000
Fuel upgradation projects 250
Infrastructure segment opportunity 1000
40107
Source: Ministry of Petroleum & Natural Gas, Company, ICICIdirect.com Research
Page 16ICICI Securities Ltd | Retail Equity Research
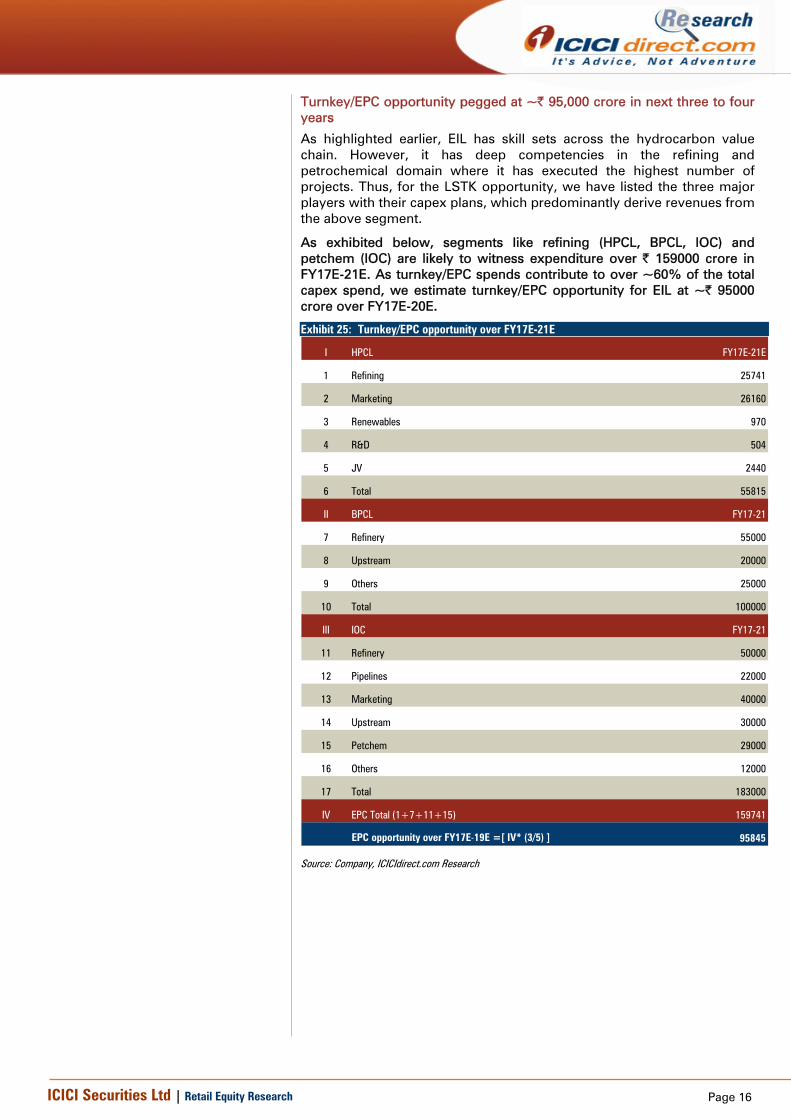
Turnkey/EPC opportunity pegged at ~| 95,000 crore in next three to four years
As highlighted earlier, EIL has skill sets across the hydrocarbon value chain. However, it has deep competencies in the refining and petrochemical domain where it has executed the highest number of projects. Thus, for the LSTK opportunity, we have listed the three major players with their capex plans, which predominantly derive revenues from the above segment.
As exhibited below, segments like refining (HPCL, BPCL, IOC) and petchem (IOC) are likely to witness expenditure over | 159000 crore in FY17E-21E. As turnkey/EPC spends contribute to over ~60% of the total capex spend, we estimate turnkey/EPC opportunity for EIL at ~| 95000 crore over FY17E-20E.
Exhibit 25: Turnkey/EPC opportunity over FY17E-21E
I HPCL FY17E-21E
1 Refining 25741
2 Marketing 26160
3 Renewables 970
4 R&D 504
5 JV 2440
6 Total 55815
II BPCL FY17-21
7 Refinery 55000
8 Upstream 20000
9 Others 25000
10 Total 100000
III IOC FY17-21
11 Refinery 50000
12 Pipelines 22000
13 Marketing 40000
14 Upstream 30000
15 Petchem 29000
16 Others 12000
17 Total 183000
IV EPC Total (1+7+11+15) 159741
EPC opportunity over FY17E-19E =[ IV* (3/5) ] 95845
Source: Company, ICICIdirect.com Research
Page 17ICICI Securities Ltd | Retail Equity Research
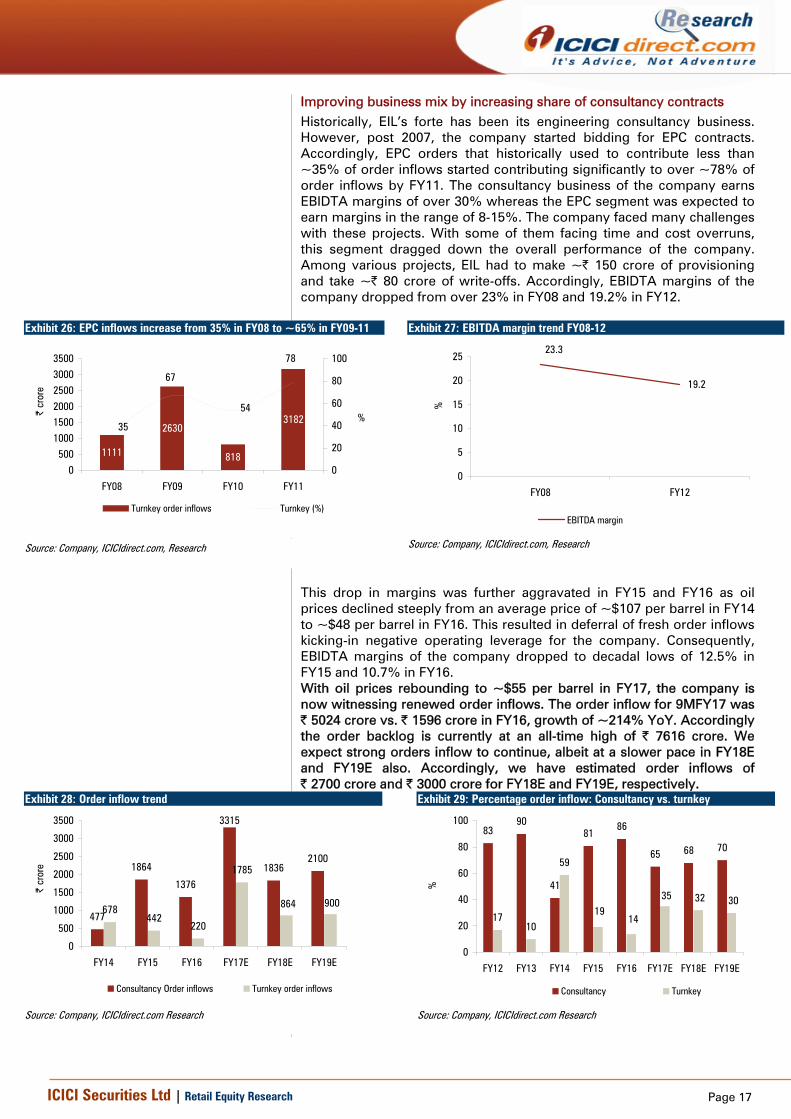
Improving business mix by increasing share of consultancy contracts Historically, EIL’s forte has been its engineering consultancy business. However, post 2007, the company started bidding for EPC contracts. Accordingly, EPC orders that historically used to contribute less than ~35% of order inflows started contributing significantly to over ~78% of order inflows by FY11. The consultancy business of the company earns EBIDTA margins of over 30% whereas the EPC segment was expected to earn margins in the range of 8-15%. The company faced many challenges with these projects. With some of them facing time and cost overruns, this segment dragged down the overall performance of the company. Among various projects, EIL had to make ~| 150 crore of provisioning and take ~| 80 crore of write-offs. Accordingly, EBIDTA margins of the company dropped from over 23% in FY08 and 19.2% in FY12.
Exhibit 26: EPC inflows increase from 35% in FY08 to ~65% in FY09-11
1111
2630
818
318235
67
54
78
0500
100015002000
250030003500
FY08 FY09 FY10 FY11
| cr
ore
0
20
40
60
80
100
%
Turnkey order inflows Turnkey (%)
Source: Company, ICICIdirect.com, Research
Exhibit 27: EBITDA margin trend FY08-12
19.2
23.3
0
5
10
15
20
25
FY08 FY12
%
EBITDA margin
Source: Company, ICICIdirect.com, Research
This drop in margins was further aggravated in FY15 and FY16 as oil prices declined steeply from an average price of ~$107 per barrel in FY14 to ~$48 per barrel in FY16. This resulted in deferral of fresh order inflows kicking-in negative operating leverage for the company. Consequently, EBIDTA margins of the company dropped to decadal lows of 12.5% in FY15 and 10.7% in FY16. With oil prices rebounding to ~$55 per barrel in FY17, the company is now witnessing renewed order inflows. The order inflow for 9MFY17 was | 5024 crore vs. | 1596 crore in FY16, growth of ~214% YoY. Accordingly the order backlog is currently at an all-time high of | 7616 crore. We expect strong orders inflow to continue, albeit at a slower pace in FY18E and FY19E also. Accordingly, we have estimated order inflows of | 2700 crore and | 3000 crore for FY18E and FY19E, respectively.
Exhibit 28: Order inflow trend
477
1864
1376
3315
18362100
678442
220
1785
864 900
0
500
1000
1500
2000
2500
3000
3500
FY14 FY15 FY16 FY17E FY18E FY19E
| cr
ore
Consultancy Order inflows Turnkey order inflows
Source: Company, ICICIdirect.com Research
Exhibit 29: Percentage order inflow: Consultancy vs. turnkey
8390
41
8186
65 68 70
1710
59
1914
35 32 30
0
20
40
60
80
100
FY12 FY13 FY14 FY15 FY16 FY17E FY18E FY19E
%
Consultancy Turnkey
Source: Company, ICICIdirect.com Research
Page 18ICICI Securities Ltd | Retail Equity Research
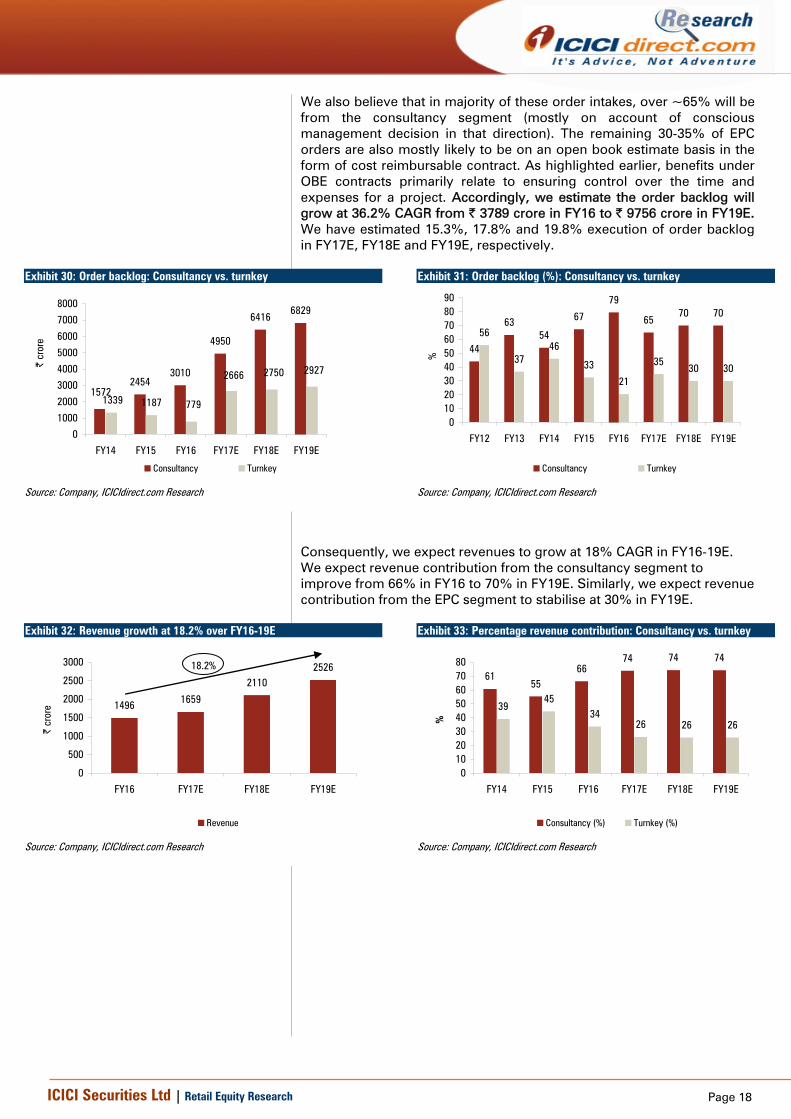
We also believe that in majority of these order intakes, over ~65% will be from the consultancy segment (mostly on account of conscious management decision in that direction). The remaining 30-35% of EPC orders are also mostly likely to be on an open book estimate basis in the form of cost reimbursable contract. As highlighted earlier, benefits under OBE contracts primarily relate to ensuring control over the time and expenses for a project. Accordingly, we estimate the order backlog will grow at 36.2% CAGR from | 3789 crore in FY16 to | 9756 crore in FY19E. We have estimated 15.3%, 17.8% and 19.8% execution of order backlog in FY17E, FY18E and FY19E, respectively.
Exhibit 30: Order backlog: Consultancy vs. turnkey
24543010
4950
64166829
11871572
1339 779
2666 2750 2927
0
1000
2000
3000
4000
5000
6000
7000
8000
FY14 FY15 FY16 FY17E FY18E FY19E
| cr
ore
Consultancy Turnkey
Source: Company, ICICIdirect.com Research
Exhibit 31: Order backlog (%): Consultancy vs. turnkey
44
6354
67
79
6570 70
56
3746
33
21
3530 30
0102030405060708090
FY12 FY13 FY14 FY15 FY16 FY17E FY18E FY19E%
Consultancy Turnkey
Source: Company, ICICIdirect.com Research
Consequently, we expect revenues to grow at 18% CAGR in FY16-19E. We expect revenue contribution from the consultancy segment to improve from 66% in FY16 to 70% in FY19E. Similarly, we expect revenue contribution from the EPC segment to stabilise at 30% in FY19E.
Exhibit 32: Revenue growth at 18.2% over FY16-19E
1496 1659
21102526
0
500
1000
1500
2000
2500
3000
FY16 FY17E FY18E FY19E
| cr
ore
Revenue
18.2%
Source: Company, ICICIdirect.com Research
Exhibit 33: Percentage revenue contribution: Consultancy vs. turnkey
6155
6674 74 74
3945
3426 26 26
01020304050607080
FY14 FY15 FY16 FY17E FY18E FY19E
%
Consultancy (%) Turnkey (%)
Source: Company, ICICIdirect.com Research
Page 19ICICI Securities Ltd | Retail Equity Research
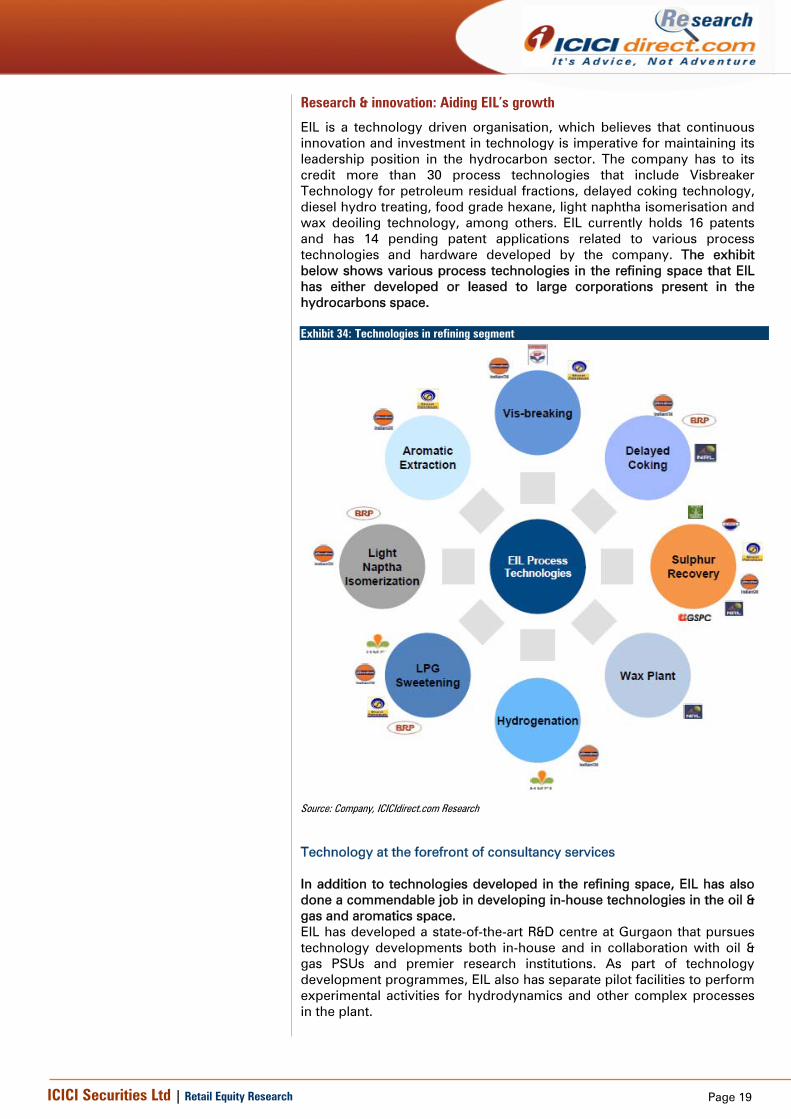
Research & innovation: Aiding EIL’s growth
EIL is a technology driven organisation, which believes that continuous innovation and investment in technology is imperative for maintaining its leadership position in the hydrocarbon sector. The company has to its credit more than 30 process technologies that include Visbreaker Technology for petroleum residual fractions, delayed coking technology, diesel hydro treating, food grade hexane, light naphtha isomerisation and wax deoiling technology, among others. EIL currently holds 16 patents and has 14 pending patent applications related to various process technologies and hardware developed by the company. The exhibit below shows various process technologies in the refining space that EIL has either developed or leased to large corporations present in the hydrocarbons space. Exhibit 34: Technologies in refining segment
Source: Company, ICICIdirect.com Research
Technology at the forefront of consultancy services In addition to technologies developed in the refining space, EIL has also done a commendable job in developing in-house technologies in the oil & gas and aromatics space. EIL has developed a state-of-the-art R&D centre at Gurgaon that pursues technology developments both in-house and in collaboration with oil & gas PSUs and premier research institutions. As part of technology development programmes, EIL also has separate pilot facilities to perform experimental activities for hydrodynamics and other complex processes in the plant.
Page 20ICICI Securities Ltd | Retail Equity Research
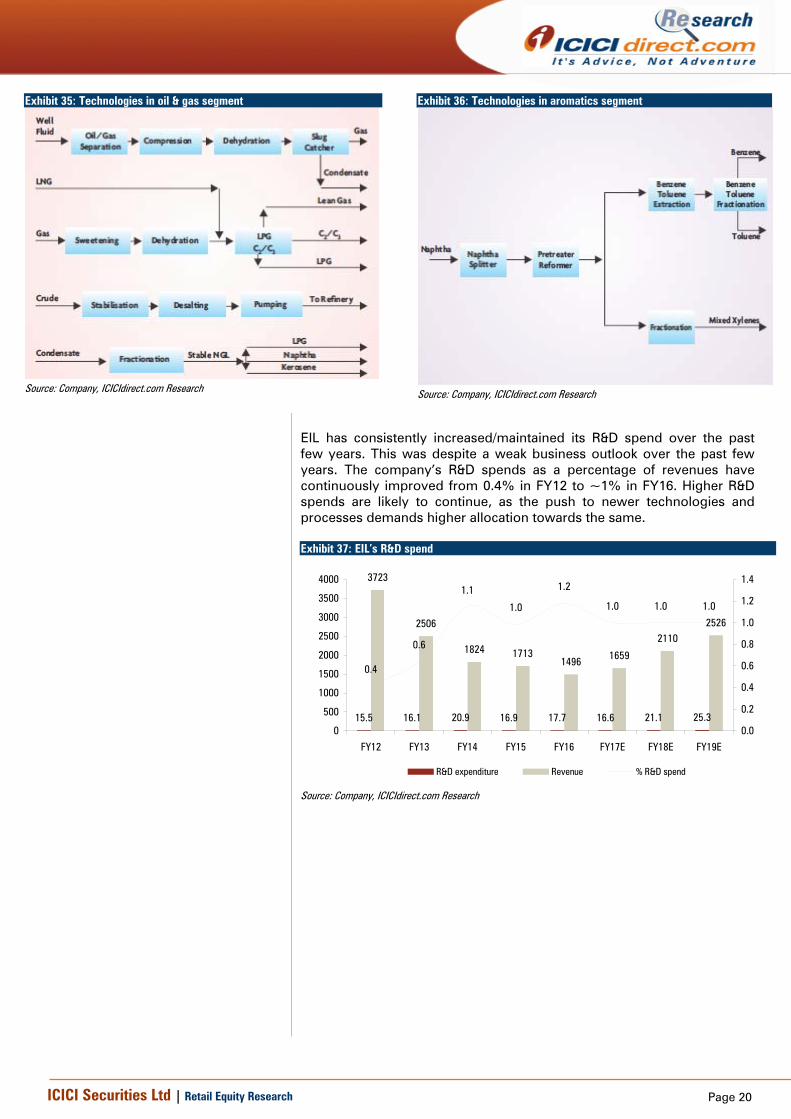
Exhibit 35: Technologies in oil & gas segment
Source: Company, ICICIdirect.com Research
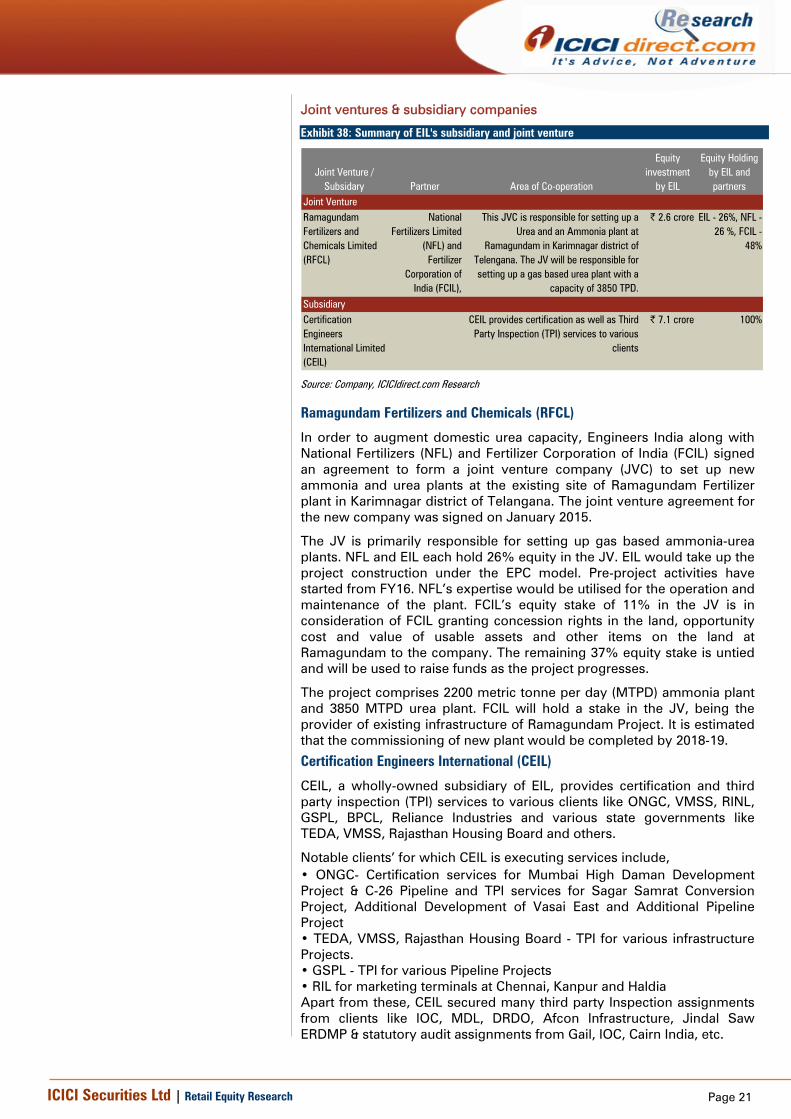
Exhibit 36: Technologies in aromatics segment
Source: Company, ICICIdirect.com Research
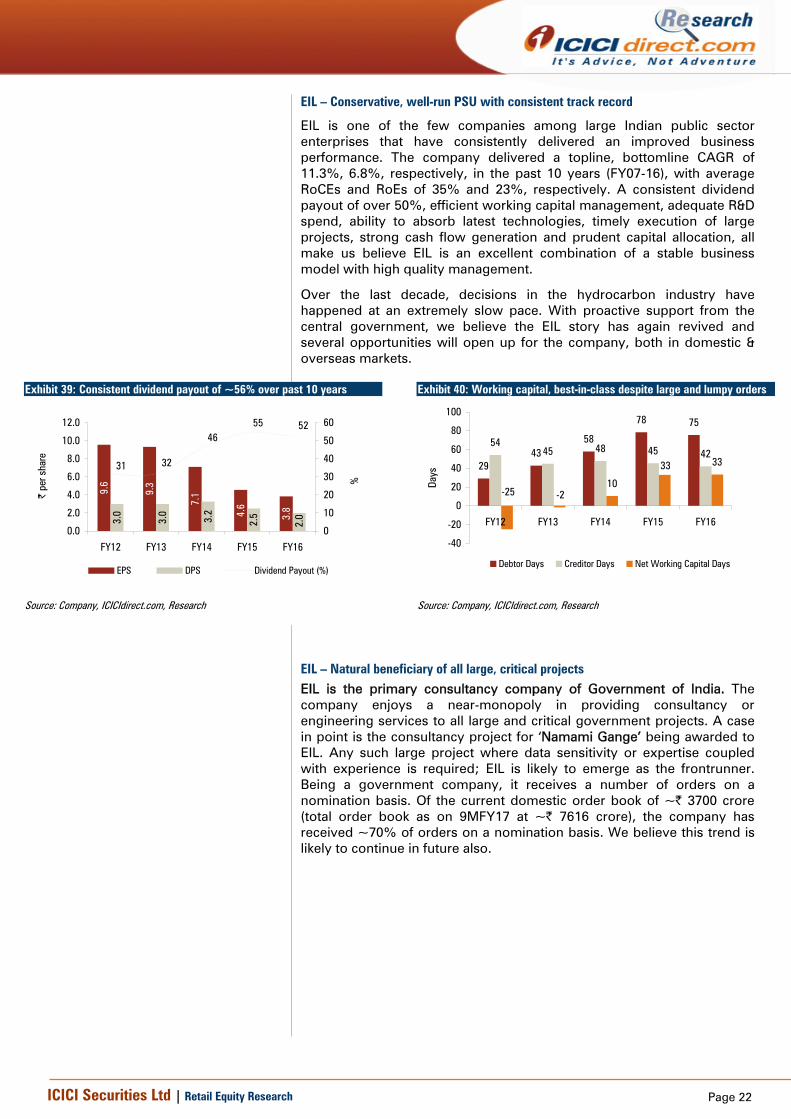
EIL has consistently increased/maintained its R&D spend over the past few years. This was despite a weak business outlook over the past few years. The company’s R&D spends as a percentage of revenues have continuously improved from 0.4% in FY12 to ~1% in FY16. Higher R&D spends are likely to continue, as the push to newer technologies and processes demands higher allocation towards the same. Exhibit 37: EIL’s R&D spend
15.5 16.1 20.9 16.9 17.7 16.6 21.1 25.3
3723
2506
1824 17131496 1659
21102526
0.4
0.6
1.1
1.0
1.2
1.0 1.0 1.0
0
500
1000
1500
2000
2500
3000
3500
4000
FY12 FY13 FY14 FY15 FY16 FY17E FY18E FY19E
0.0
0.2
0.4
0.6
0.8
1.0
1.2
1.4
R&D expenditure Revenue % R&D spend
Source: Company, ICICIdirect.com Research
Page 21ICICI Securities Ltd | Retail Equity Research
Joint ventures & subsidiary companies
Exhibit 38: Summary of EIL's subsidiary and joint venture
Joint Venture / Subsidary Partner Area of Co-operation
Equity investment
by EIL
Equity Holding by EIL and partners
Joint VentureRamagundam Fertilizers and Chemicals Limited (RFCL)
National Fertilizers Limited
(NFL) and Fertilizer
Corporation of India (FCIL),
This JVC is responsible for setting up a Urea and an Ammonia plant at
Ramagundam in Karimnagar district of Telengana. The JV will be responsible for setting up a gas based urea plant with a
capacity of 3850 TPD.
| 2.6 crore EIL - 26%, NFL - 26 %, FCIL -
48%
SubsidiaryCertification Engineers International Limited (CEIL)
CEIL provides certification as well as Third Party Inspection (TPI) services to various
clients
| 7.1 crore 100%
Source: Company, ICICIdirect.com Research
Ramagundam Fertilizers and Chemicals (RFCL)
In order to augment domestic urea capacity, Engineers India along with National Fertilizers (NFL) and Fertilizer Corporation of India (FCIL) signed an agreement to form a joint venture company (JVC) to set up new ammonia and urea plants at the existing site of Ramagundam Fertilizer plant in Karimnagar district of Telangana. The joint venture agreement for the new company was signed on January 2015.
The JV is primarily responsible for setting up gas based ammonia-urea plants. NFL and EIL each hold 26% equity in the JV. EIL would take up the project construction under the EPC model. Pre-project activities have started from FY16. NFL’s expertise would be utilised for the operation and maintenance of the plant. FCIL’s equity stake of 11% in the JV is in consideration of FCIL granting concession rights in the land, opportunity cost and value of usable assets and other items on the land at Ramagundam to the company. The remaining 37% equity stake is untied and will be used to raise funds as the project progresses.
The project comprises 2200 metric tonne per day (MTPD) ammonia plant and 3850 MTPD urea plant. FCIL will hold a stake in the JV, being the provider of existing infrastructure of Ramagundam Project. It is estimated that the commissioning of new plant would be completed by 2018-19.
Certification Engineers International (CEIL)
CEIL, a wholly-owned subsidiary of EIL, provides certification and third party inspection (TPI) services to various clients like ONGC, VMSS, RINL, GSPL, BPCL, Reliance Industries and various state governments like TEDA, VMSS, Rajasthan Housing Board and others.
Notable clients’ for which CEIL is executing services include, • ONGC- Certification services for Mumbai High Daman Development Project & C-26 Pipeline and TPI services for Sagar Samrat Conversion Project, Additional Development of Vasai East and Additional Pipeline Project • TEDA, VMSS, Rajasthan Housing Board - TPI for various infrastructure Projects. • GSPL - TPI for various Pipeline Projects • RIL for marketing terminals at Chennai, Kanpur and Haldia Apart from these, CEIL secured many third party Inspection assignments from clients like IOC, MDL, DRDO, Afcon Infrastructure, Jindal Saw ERDMP & statutory audit assignments from Gail, IOC, Cairn India, etc.
Page 22ICICI Securities Ltd | Retail Equity Research
EIL – Conservative, well-run PSU with consistent track record
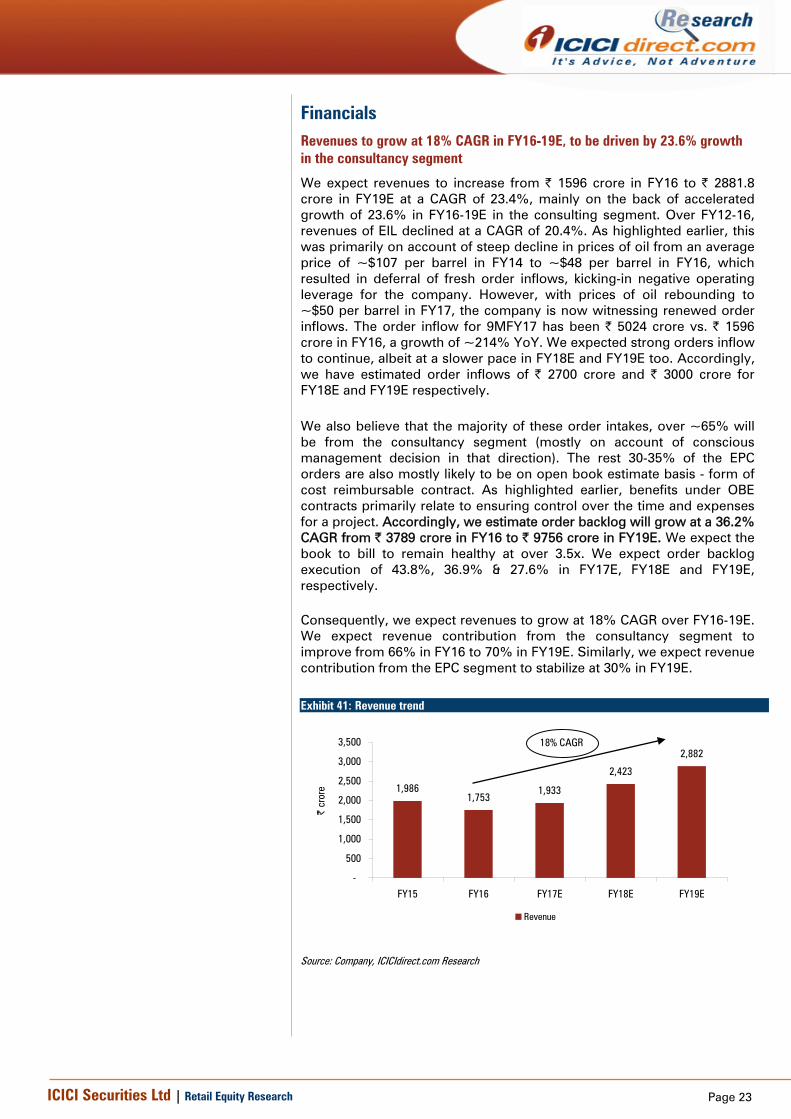
EIL is one of the few companies among large Indian public sector enterprises that have consistently delivered an improved business performance. The company delivered a topline, bottomline CAGR of 11.3%, 6.8%, respectively, in the past 10 years (FY07-16), with average RoCEs and RoEs of 35% and 23%, respectively. A consistent dividend payout of over 50%, efficient working capital management, adequate R&D spend, ability to absorb latest technologies, timely execution of large projects, strong cash flow generation and prudent capital allocation, all make us believe EIL is an excellent combination of a stable business model with high quality management.
Over the last decade, decisions in the hydrocarbon industry have happened at an extremely slow pace. With proactive support from the central government, we believe the EIL story has again revived and several opportunities will open up for the company, both in domestic & overseas markets.
Exhibit 39: Consistent dividend payout of ~56% over past 10 years
9.6
9.3
7.1
3.0
3.0
3.2
2.5
2.04.
6
3.8
31 32
4655 52
0.0
2.0
4.0
6.0
8.0
10.0
12.0
FY12 FY13 FY14 FY15 FY16
| pe
r sha
re
0
10
20
30
40
50
60
%
EPS DPS Dividend Payout (%)
Source: Company, ICICIdirect.com, Research
Exhibit 40: Working capital, best-in-class despite large and lumpy orders
2943
58
78 75
5445 48 45 42
10
33
-25 -2
33
-40
-20
0
20
40
60
80
100
FY12 FY13 FY14 FY15 FY16
Days
Debtor Days Creditor Days Net Working Capital Days
Source: Company, ICICIdirect.com, Research
EIL – Natural beneficiary of all large, critical projects EIL is the primary consultancy company of Government of India. The company enjoys a near-monopoly in providing consultancy or engineering services to all large and critical government projects. A case in point is the consultancy project for ‘Namami Gange’ being awarded to EIL. Any such large project where data sensitivity or expertise coupled with experience is required; EIL is likely to emerge as the frontrunner. Being a government company, it receives a number of orders on a nomination basis. Of the current domestic order book of ~| 3700 crore (total order book as on 9MFY17 at ~| 7616 crore), the company has received ~70% of orders on a nomination basis. We believe this trend is likely to continue in future also.
Page 23ICICI Securities Ltd | Retail Equity Research
Financials Revenues to grow at 18% CAGR in FY16-19E, to be driven by 23.6% growth in the consultancy segment
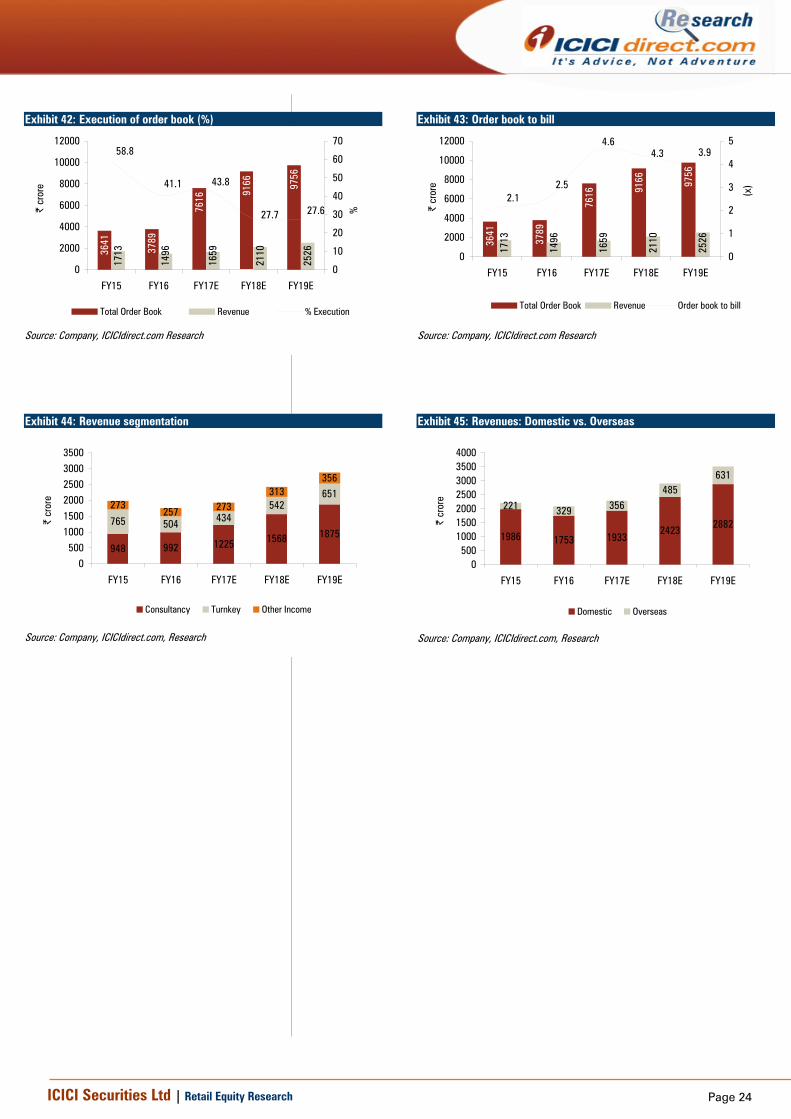
We expect revenues to increase from | 1596 crore in FY16 to | 2881.8 crore in FY19E at a CAGR of 23.4%, mainly on the back of accelerated growth of 23.6% in FY16-19E in the consulting segment. Over FY12-16, revenues of EIL declined at a CAGR of 20.4%. As highlighted earlier, this was primarily on account of steep decline in prices of oil from an average price of ~$107 per barrel in FY14 to ~$48 per barrel in FY16, which resulted in deferral of fresh order inflows, kicking-in negative operating leverage for the company. However, with prices of oil rebounding to ~$50 per barrel in FY17, the company is now witnessing renewed order inflows. The order inflow for 9MFY17 has been | 5024 crore vs. | 1596 crore in FY16, a growth of ~214% YoY. We expected strong orders inflow to continue, albeit at a slower pace in FY18E and FY19E too. Accordingly, we have estimated order inflows of | 2700 crore and | 3000 crore for FY18E and FY19E respectively. We also believe that the majority of these order intakes, over ~65% will be from the consultancy segment (mostly on account of conscious management decision in that direction). The rest 30-35% of the EPC orders are also mostly likely to be on open book estimate basis - form of cost reimbursable contract. As highlighted earlier, benefits under OBE contracts primarily relate to ensuring control over the time and expenses for a project. Accordingly, we estimate order backlog will grow at a 36.2% CAGR from | 3789 crore in FY16 to | 9756 crore in FY19E. We expect the book to bill to remain healthy at over 3.5x. We expect order backlog execution of 43.8%, 36.9% & 27.6% in FY17E, FY18E and FY19E, respectively. Consequently, we expect revenues to grow at 18% CAGR over FY16-19E. We expect revenue contribution from the consultancy segment to improve from 66% in FY16 to 70% in FY19E. Similarly, we expect revenue contribution from the EPC segment to stabilize at 30% in FY19E.
Exhibit 41: Revenue trend
1,9861,753
1,933
2,423
2,882
-
500
1,000
1,500
2,000
2,500
3,000
3,500
FY15 FY16 FY17E FY18E FY19E
| cr
ore
Revenue
18% CAGR
Source: Company, ICICIdirect.com Research
Page 24ICICI Securities Ltd | Retail Equity Research
Exhibit 42: Execution of order book (%)
3641
3789
7616 91
66 9756
1713
1496
1659
2110
2526
58.8
41.1 43.8
27.7 27.6
0
2000
4000
6000
8000
10000
12000
FY15 FY16 FY17E FY18E FY19E
| cr
ore
0
10
20
30
40
50
60
70
%
Total Order Book Revenue % Execution
Source: Company, ICICIdirect.com Research
Exhibit 43: Order book to bill
3641
3789
7616 91
66 9756
1713
1496
1659
2110
2526
2.12.5
4.64.3 3.9
0
2000
4000
6000
8000
10000
12000
FY15 FY16 FY17E FY18E FY19E
| cr
ore
0
1
2
3
4
5
(x)
Total Order Book Revenue Order book to bill
Source: Company, ICICIdirect.com Research
Exhibit 44: Revenue segmentation
948 992 1225 1568 1875765 504 434
542651
273257 273
313356
0500
100015002000250030003500
FY15 FY16 FY17E FY18E FY19E
| cr
ore
Consultancy Turnkey Other Income
Source: Company, ICICIdirect.com, Research
Exhibit 45: Revenues: Domestic vs. Overseas
1986 1753 19332423 2882
221 329 356485
631
0500
1000150020002500300035004000
FY15 FY16 FY17E FY18E FY19E
| cr
ore
Domestic Overseas
Source: Company, ICICIdirect.com, Research
Page 25ICICI Securities Ltd | Retail Equity Research
Higher proportion of consultancy revenues to boost EBITDA margins
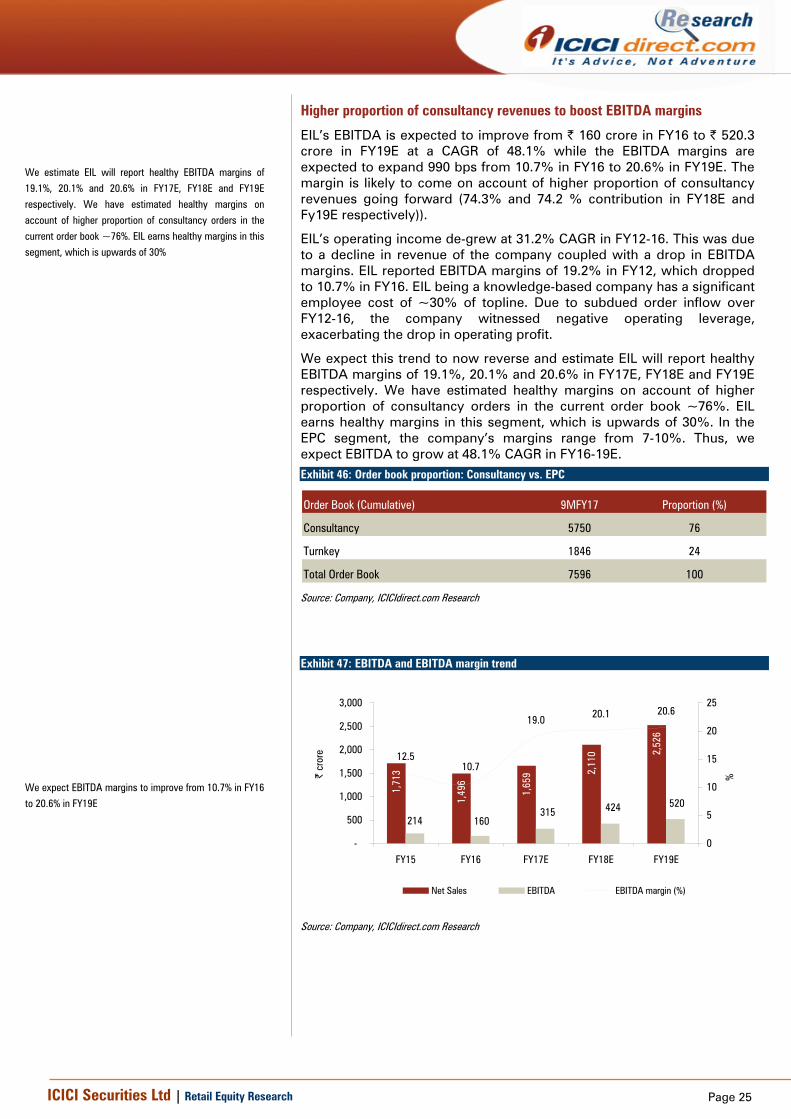
EIL’s EBITDA is expected to improve from | 160 crore in FY16 to | 520.3 crore in FY19E at a CAGR of 48.1% while the EBITDA margins are expected to expand 990 bps from 10.7% in FY16 to 20.6% in FY19E. The margin is likely to come on account of higher proportion of consultancy revenues going forward (74.3% and 74.2 % contribution in FY18E and Fy19E respectively)).
EIL’s operating income de-grew at 31.2% CAGR in FY12-16. This was due to a decline in revenue of the company coupled with a drop in EBITDA margins. EIL reported EBITDA margins of 19.2% in FY12, which dropped to 10.7% in FY16. EIL being a knowledge-based company has a significant employee cost of ~30% of topline. Due to subdued order inflow over FY12-16, the company witnessed negative operating leverage, exacerbating the drop in operating profit.
We expect this trend to now reverse and estimate EIL will report healthy EBITDA margins of 19.1%, 20.1% and 20.6% in FY17E, FY18E and FY19E respectively. We have estimated healthy margins on account of higher proportion of consultancy orders in the current order book ~76%. EIL earns healthy margins in this segment, which is upwards of 30%. In the EPC segment, the company’s margins range from 7-10%. Thus, we expect EBITDA to grow at 48.1% CAGR in FY16-19E. Exhibit 46: Order book proportion: Consultancy vs. EPC
Order Book (Cumulative) 9MFY17 Proportion (%)
Consultancy 5750 76
Turnkey 1846 24
Total Order Book 7596 100 Source: Company, ICICIdirect.com Research
Exhibit 47: EBITDA and EBITDA margin trend
1,71
3
1,49
6
1,65
9 2,11
0 2,52
6
214 160315 424 520
12.510.7
19.0 20.1 20.6
-
500
1,000
1,500
2,000
2,500
3,000
FY15 FY16 FY17E FY18E FY19E
| cr
ore
0
5
10
15
20
25
%
Net Sales EBITDA EBITDA margin (%)
Source: Company, ICICIdirect.com Research
We estimate EIL will report healthy EBITDA margins of
19.1%, 20.1% and 20.6% in FY17E, FY18E and FY19E
respectively. We have estimated healthy margins on
account of higher proportion of consultancy orders in the
current order book ~76%. EIL earns healthy margins in this
segment, which is upwards of 30%
We expect EBITDA margins to improve from 10.7% in FY16
to 20.6% in FY19E
Page 26ICICI Securities Ltd | Retail Equity Research
PAT to grow at 29.2% CAGR over FY16-19E
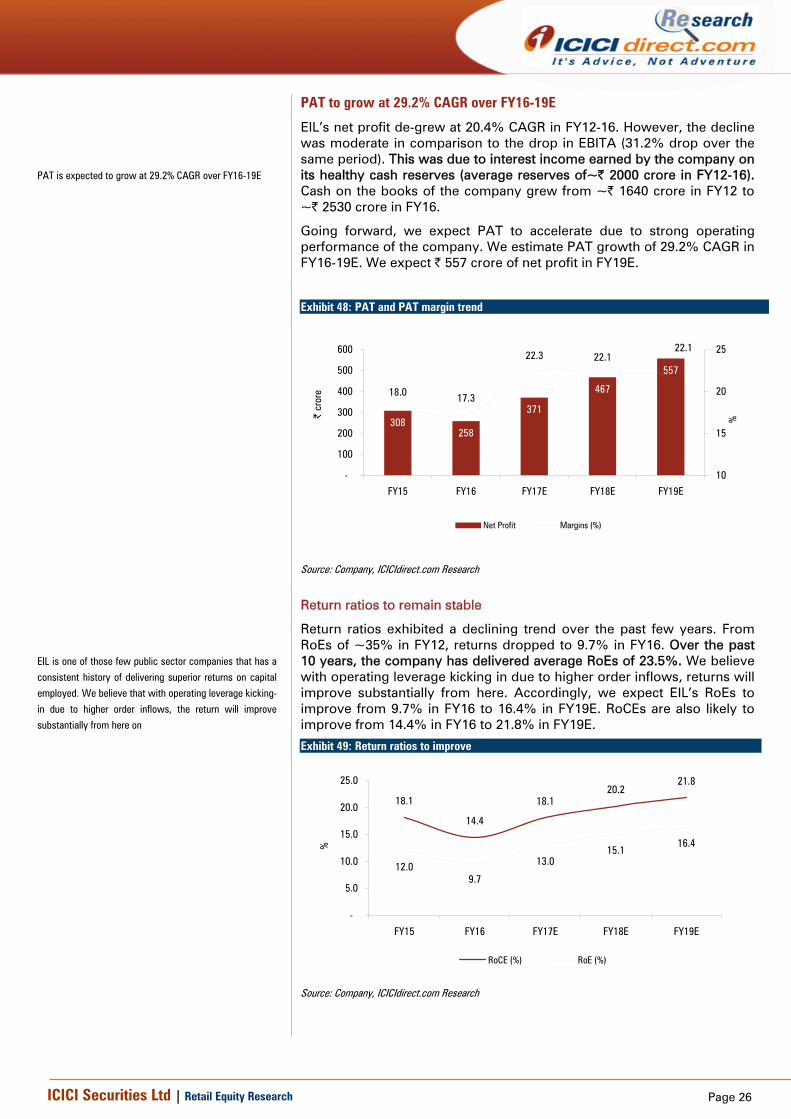
EIL’s net profit de-grew at 20.4% CAGR in FY12-16. However, the decline was moderate in comparison to the drop in EBITA (31.2% drop over the same period). This was due to interest income earned by the company on its healthy cash reserves (average reserves of~| 2000 crore in FY12-16). Cash on the books of the company grew from ~| 1640 crore in FY12 to ~| 2530 crore in FY16.
Going forward, we expect PAT to accelerate due to strong operating performance of the company. We estimate PAT growth of 29.2% CAGR in FY16-19E. We expect | 557 crore of net profit in FY19E.
Exhibit 48: PAT and PAT margin trend
308258
371
467
557
18.0 17.3
22.3 22.122.1
-
100
200
300
400
500
600
FY15 FY16 FY17E FY18E FY19E
| cr
ore
10
15
20
25
%
Net Profit Margins (%)
Source: Company, ICICIdirect.com Research
Return ratios to remain stable
Return ratios exhibited a declining trend over the past few years. From RoEs of ~35% in FY12, returns dropped to 9.7% in FY16. Over the past 10 years, the company has delivered average RoEs of 23.5%. We believe with operating leverage kicking in due to higher order inflows, returns will improve substantially from here. Accordingly, we expect EIL’s RoEs to improve from 9.7% in FY16 to 16.4% in FY19E. RoCEs are also likely to improve from 14.4% in FY16 to 21.8% in FY19E.
Exhibit 49: Return ratios to improve
18.1
14.4
18.120.2
21.8
12.09.7
13.015.1
16.4
-
5.0
10.0
15.0
20.0
25.0
FY15 FY16 FY17E FY18E FY19E
%
RoCE (%) RoE (%)
Source: Company, ICICIdirect.com Research
PAT is expected to grow at 29.2% CAGR over FY16-19E
EIL is one of those few public sector companies that has a
consistent history of delivering superior returns on capital
employed. We believe that with operating leverage kicking-
in due to higher order inflows, the return will improve
substantially from here on
Page 27ICICI Securities Ltd | Retail Equity Research
Cash flows set to improve; CFO/EBITDA healthy at 1.4x
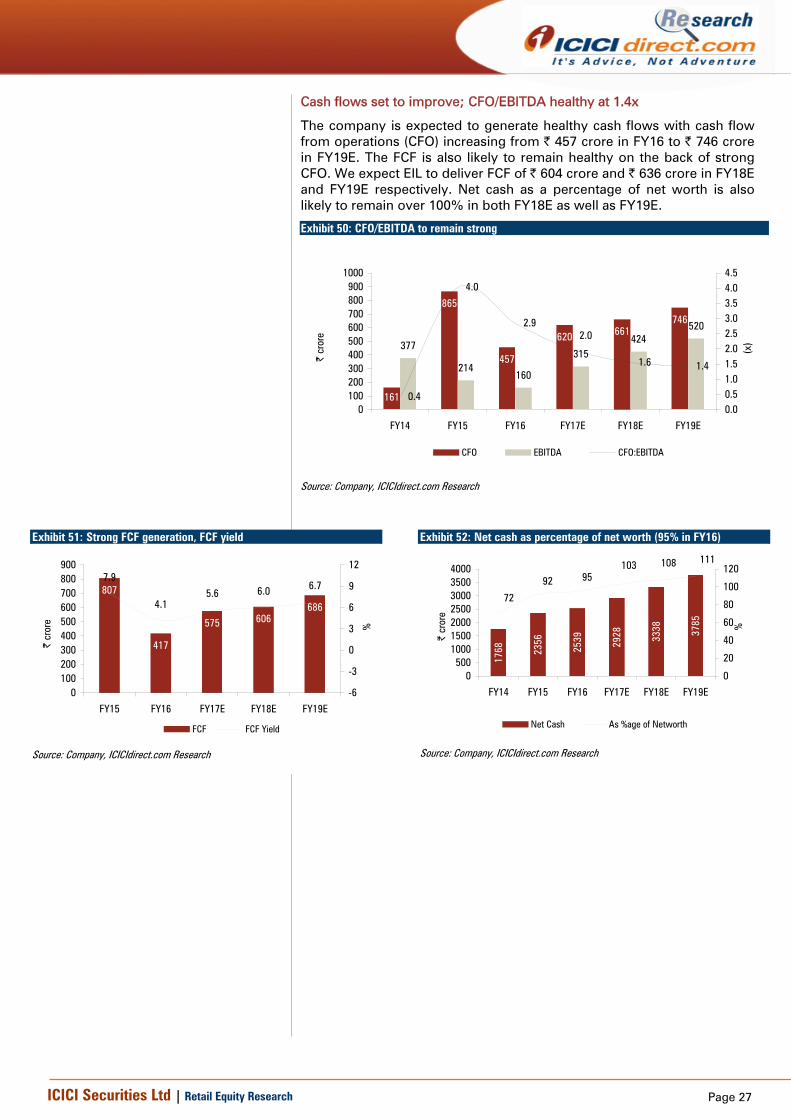
The company is expected to generate healthy cash flows with cash flow from operations (CFO) increasing from | 457 crore in FY16 to | 746 crore in FY19E. The FCF is also likely to remain healthy on the back of strong CFO. We expect EIL to deliver FCF of | 604 crore and | 636 crore in FY18E and FY19E respectively. Net cash as a percentage of net worth is also likely to remain over 100% in both FY18E as well as FY19E.
Exhibit 50: CFO/EBITDA to remain strong
161
865
457
620 661746
377
214160
315424
520
0.4
4.0
2.9
1.6 1.4
2.0
0100200300400500600700800900
1000
FY14 FY15 FY16 FY17E FY18E FY19E
| cr
ore
0.00.51.01.52.02.53.03.54.04.5
(x)
CFO EBITDA CFO:EBITDA
Source: Company, ICICIdirect.com Research
Exhibit 51: Strong FCF generation, FCF yield
807
417
575686
606
7.9
4.15.6 6.0 6.7
0100200300400500600700800900
FY15 FY16 FY17E FY18E FY19E
| cr
ore
-6
-3
0
3
6
9
12
%
FCF FCF Yield
Source: Company, ICICIdirect.com Research
Exhibit 52: Net cash as percentage of net worth (95% in FY16)
1768 23
56
2539 2928 33
38 3785
72
92 95103 108 111
0500
1000150020002500300035004000
FY14 FY15 FY16 FY17E FY18E FY19E
| cr
ore
0
20
40
60
80
100
120
%Net Cash As %age of Networth
Source: Company, ICICIdirect.com Research
Page 28ICICI Securities Ltd | Retail Equity Research
Risks & concerns Subdued oil & gas prices/increase in alternative sources of energy
Oil & gas prices are subject to significant fluctuations in response to relatively minor changes in their supply or demand. EIL witnessed a significant slowdown in order inflows when oil prices started trending downwards. This is primarily on account of deferral of capital expenditure plans by its major customers that derive revenues from the hydrocarbons sector. Thus, subdued oil & gas prices for long periods of time may result in weak operations and financial condition for the company. Similarly, increase in use of alternative sources of energy can push large hydrocarbon companies to defer or even cancel their capex plans. This may severely dent the business outlook of the company.
Heavy dependence on hydrocarbon revenues
Currently, EIL derives ~92% of revenue from the hydrocarbon sector. Hydrocarbon exploration is a capital intensive and high risk-high reward business subject to the risk that even after a considerable investment, the discovered hydrocarbon reserve may not be commercially viable for production. Thus, EIL’s success in this sector depends, to a great extent, on its ability to maintain and/or establish relationship with key clients and other partners and also its ability to deploy additional management, financial and operational resources. Additionally, if the hydrocarbon sector ceases to be a growth driver for EIL’s business, the company’s financial condition may be adversely affected.
Failure to effectively manage diversification/stake acquisitions may derail growth, profitability
EIL continuously identifies and targets specific project segments and industries where it believes there is high potential for growth. These include projects in the power-solar and nuclear, oil & gas exploration, gas based fertiliser projects, coal to liquid, water and waste management, liquefied natural gas and city gas distribution. These additional business activities may require additional management, financial and operational resources, which may weigh heavily on the current margin profile of the company. EIL’s stake acquisition in Ramagundam fertiliser plant (along with NFL, EIL investment of | 1250 crore, investment in 125 MW solar thermal project, office investments of | 560 crore in various cities, investment in BOT assets and nuclear plant BOP are moves that can dilute the return profile of the company.
EPC business may lead to reduced profit
EIL engages in EPC contracts under various types of contractual arrangements where costs are estimated in advance. A majority of its engineering consultancy and EPC projects (by value) are cost-reimbursable contracts that allocate the risk of cost overruns to its clients. However, some engineering consultancy and EPC contracts are fixed-price or lumpsum contracts, where EIL bears a portion of the risk for cost overruns. Under these types of contracts, contract prices are established in part on cost and scheduling estimates, which are based on a number of assumptions. For EPC contracts, these assumptions include assumptions relating to future economic conditions, prices and availability of labour, equipment and materials. If these estimates prove inaccurate, or circumstances change such as unanticipated technical problems, difficulties in obtaining permits or approvals, changes in local laws or labour conditions, weather delays, cost of raw materials, or its suppliers' or subcontractors' inability to perform, cost overruns may occur. In that case, the company could experience reduced profits.
Page 29ICICI Securities Ltd | Retail Equity Research
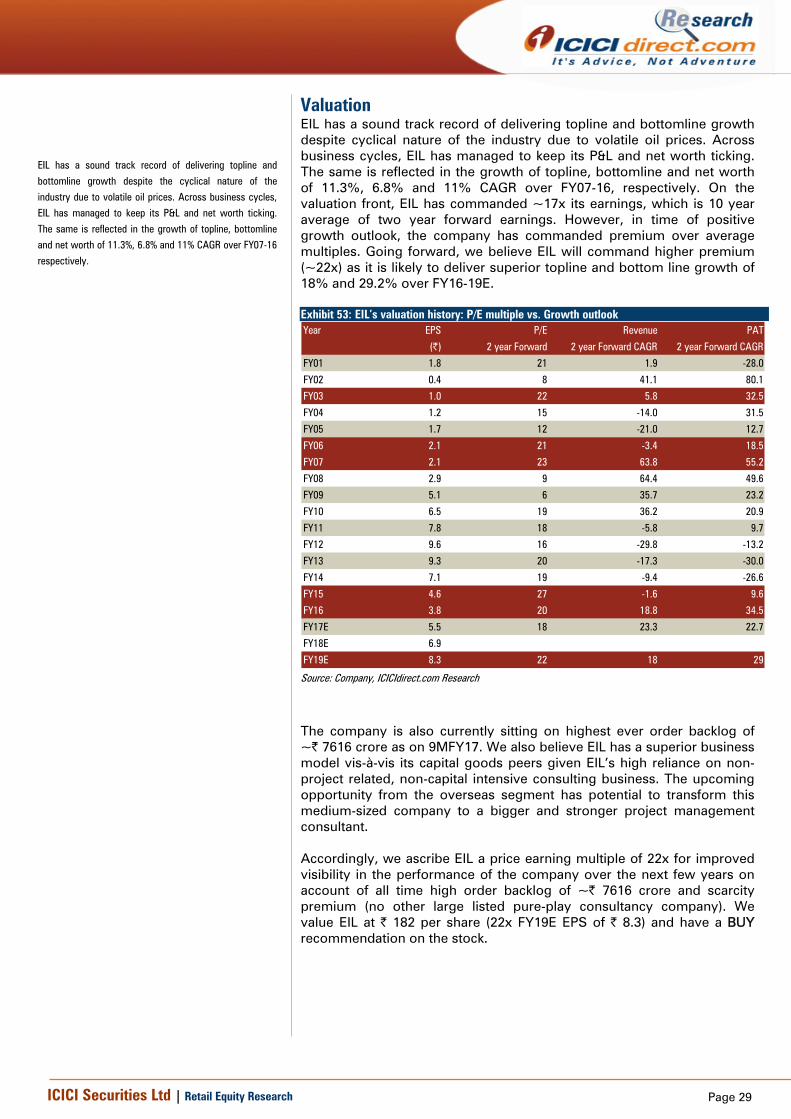
Valuation EIL has a sound track record of delivering topline and bottomline growth despite cyclical nature of the industry due to volatile oil prices. Across business cycles, EIL has managed to keep its P&L and net worth ticking. The same is reflected in the growth of topline, bottomline and net worth of 11.3%, 6.8% and 11% CAGR over FY07-16, respectively. On the valuation front, EIL has commanded ~17x its earnings, which is 10 year average of two year forward earnings. However, in time of positive growth outlook, the company has commanded premium over average multiples. Going forward, we believe EIL will command higher premium (~22x) as it is likely to deliver superior topline and bottom line growth of 18% and 29.2% over FY16-19E. Exhibit 53: EIL’s valuation history: P/E multiple vs. Growth outlook Year EPS P/E Revenue PAT
(|) 2 year Forward 2 year Forward CAGR 2 year Forward CAGR
FY01 1.8 21 1.9 -28.0
FY02 0.4 8 41.1 80.1
FY03 1.0 22 5.8 32.5
FY04 1.2 15 -14.0 31.5
FY05 1.7 12 -21.0 12.7
FY06 2.1 21 -3.4 18.5
FY07 2.1 23 63.8 55.2
FY08 2.9 9 64.4 49.6
FY09 5.1 6 35.7 23.2
FY10 6.5 19 36.2 20.9
FY11 7.8 18 -5.8 9.7
FY12 9.6 16 -29.8 -13.2
FY13 9.3 20 -17.3 -30.0
FY14 7.1 19 -9.4 -26.6
FY15 4.6 27 -1.6 9.6
FY16 3.8 20 18.8 34.5
FY17E 5.5 18 23.3 22.7
FY18E 6.9
FY19E 8.3 22 18 29 Source: Company, ICICIdirect.com Research
The company is also currently sitting on highest ever order backlog of ~| 7616 crore as on 9MFY17. We also believe EIL has a superior business model vis-à-vis its capital goods peers given EIL’s high reliance on non-project related, non-capital intensive consulting business. The upcoming opportunity from the overseas segment has potential to transform this medium-sized company to a bigger and stronger project management consultant. Accordingly, we ascribe EIL a price earning multiple of 22x for improved visibility in the performance of the company over the next few years on account of all time high order backlog of ~| 7616 crore and scarcity premium (no other large listed pure-play consultancy company). We value EIL at | 182 per share (22x FY19E EPS of | 8.3) and have a BUY recommendation on the stock.
EIL has a sound track record of delivering topline and
bottomline growth despite the cyclical nature of the
industry due to volatile oil prices. Across business cycles,
EIL has managed to keep its P&L and net worth ticking.
The same is reflected in the growth of topline, bottomline
and net worth of 11.3%, 6.8% and 11% CAGR over FY07-16
respectively.
Page 30ICICI Securities Ltd | Retail Equity Research
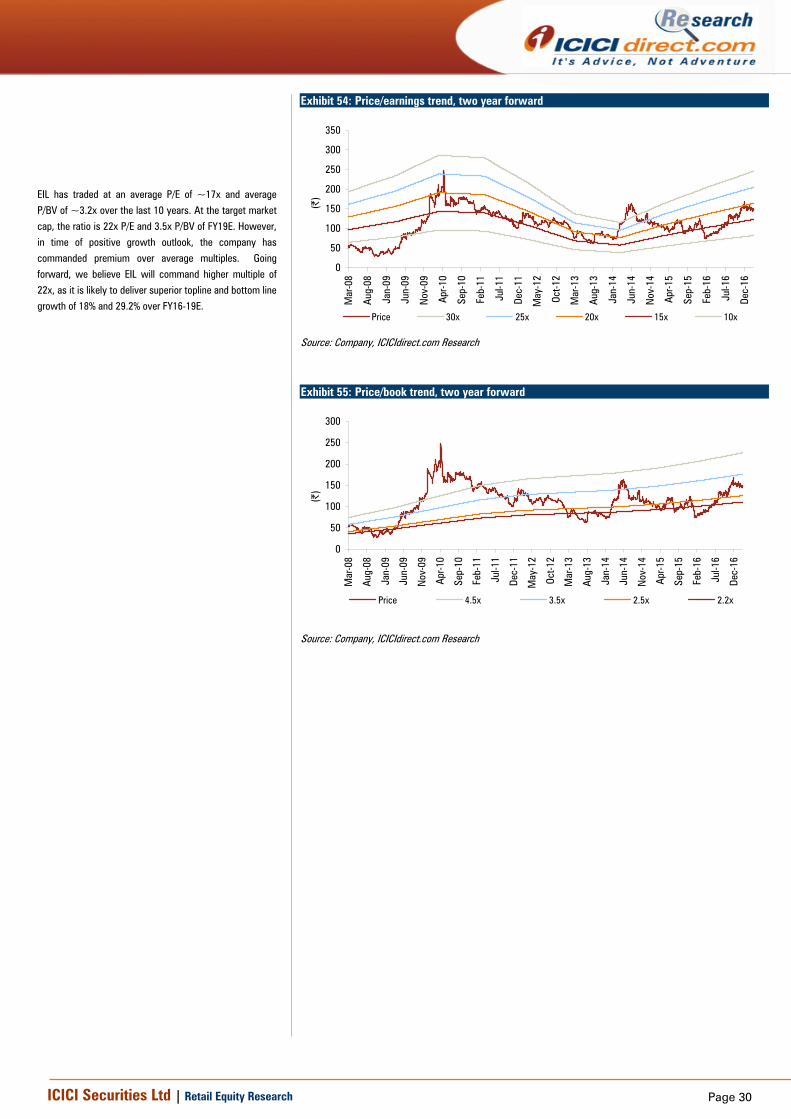
Exhibit 54: Price/earnings trend, two year forward
0
50
100
150
200
250
300
350
Mar
-08
Aug-
08
Jan-
09
Jun-
09
Nov
-09
Apr-1
0
Sep-
10
Feb-
11
Jul-1
1
Dec-
11
May
-12
Oct-1
2
Mar
-13
Aug-
13
Jan-
14
Jun-
14
Nov
-14
Apr-1
5
Sep-
15
Feb-
16
Jul-1
6
Dec-
16
(|)
Price 30x 25x 20x 15x 10x
Source: Company, ICICIdirect.com Research
EIL has traded at an average P/E of ~17x and average
P/BV of ~3.2x over the last 10 years. At the target market
cap, the ratio is 22x P/E and 3.5x P/BV of FY19E. However,
in time of positive growth outlook, the company has
commanded premium over average multiples. Going
forward, we believe EIL will command higher multiple of
22x, as it is likely to deliver superior topline and bottom line
growth of 18% and 29.2% over FY16-19E.
Exhibit 55: Price/book trend, two year forward
0
50
100
150
200
250
300
Mar
-08
Aug-
08
Jan-
09
Jun-
09
Nov
-09
Apr-1
0
Sep-
10
Feb-
11
Jul-1
1
Dec-
11
May
-12
Oct-1
2
Mar
-13
Aug-
13
Jan-
14
Jun-
14
Nov
-14
Apr-1
5
Sep-
15
Feb-
16
Jul-1
6
Dec-
16
(|)
Price 4.5x 3.5x 2.5x 2.2x
Source: Company, ICICIdirect.com Research
Page 31ICICI Securities Ltd | Retail Equity Research
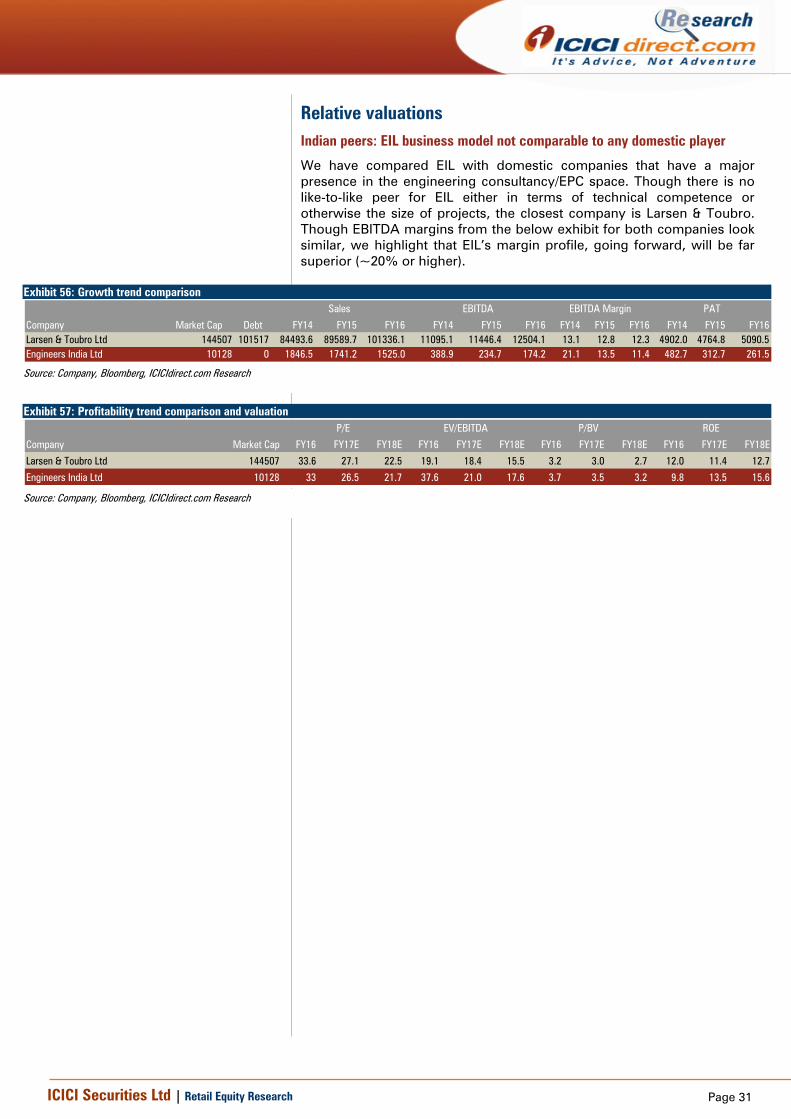
Relative valuations Indian peers: EIL business model not comparable to any domestic player
We have compared EIL with domestic companies that have a major presence in the engineering consultancy/EPC space. Though there is no like-to-like peer for EIL either in terms of technical competence or otherwise the size of projects, the closest company is Larsen & Toubro. Though EBITDA margins from the below exhibit for both companies look similar, we highlight that EIL’s margin profile, going forward, will be far superior (~20% or higher).
Exhibit 56: Growth trend comparison
FY14 FY15 FY16 FY14 FY15 FY16 FY14 FY15 FY16 FY14 FY15 FY16Larsen & Toubro Ltd 144507 101517 84493.6 89589.7 101336.1 11095.1 11446.4 12504.1 13.1 12.8 12.3 4902.0 4764.8 5090.5Engineers India Ltd 10128 0 1846.5 1741.2 1525.0 388.9 234.7 174.2 21.1 13.5 11.4 482.7 312.7 261.5
Company
PAT
Market Cap Debt
Sales EBITDA MarginEBITDA
Source: Company, Bloomberg, ICICIdirect.com Research
Exhibit 57: Profitability trend comparison and valuation
FY16 FY17E FY18E FY16 FY17E FY18E FY16 FY17E FY18E FY16 FY17E FY18E
Larsen & Toubro Ltd 144507 33.6 27.1 22.5 19.1 18.4 15.5 3.2 3.0 2.7 12.0 11.4 12.7
Engineers India Ltd 10128 33 26.5 21.7 37.6 21.0 17.6 3.7 3.5 3.2 9.8 13.5 15.6
Company Market Cap
P/E EV/EBITDA P/BV ROE
Source: Company, Bloomberg, ICICIdirect.com Research
Page 32ICICI Securities Ltd | Retail Equity Research
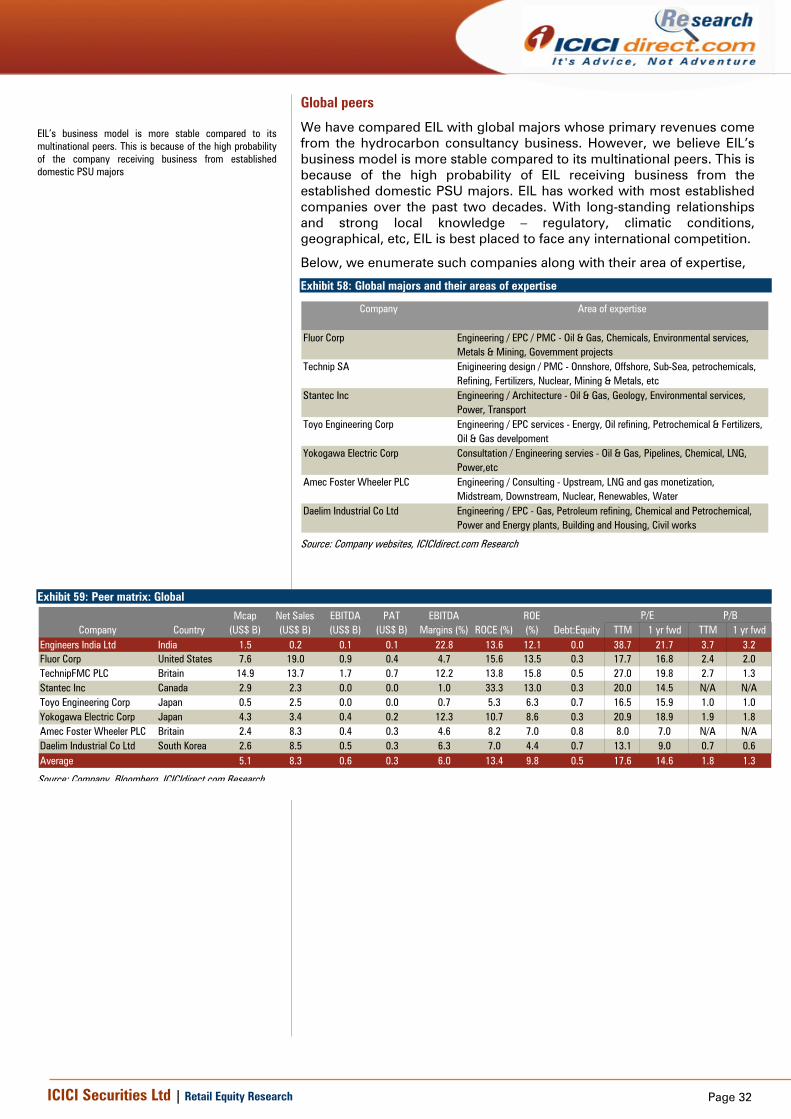
Global peers
We have compared EIL with global majors whose primary revenues come from the hydrocarbon consultancy business. However, we believe EIL’s business model is more stable compared to its multinational peers. This is because of the high probability of EIL receiving business from the established domestic PSU majors. EIL has worked with most established companies over the past two decades. With long-standing relationships and strong local knowledge – regulatory, climatic conditions, geographical, etc, EIL is best placed to face any international competition.
Below, we enumerate such companies along with their area of expertise,
Exhibit 58: Global majors and their areas of expertise
Fluor Corp Engineering / EPC / PMC - Oil & Gas, Chemicals, Environmental services, Metals & Mining, Government projects
Technip SA Enigineering design / PMC - Onnshore, Offshore, Sub-Sea, petrochemicals, Refining, Fertilizers, Nuclear, Mining & Metals, etc
Stantec Inc Engineering / Architecture - Oil & Gas, Geology, Environmental services, Power, Transport
Toyo Engineering Corp Engineering / EPC services - Energy, Oil refining, Petrochemical & Fertilizers, Oil & Gas develpoment
Yokogawa Electric Corp Consultation / Engineering servies - Oil & Gas, Pipelines, Chemical, LNG, Power,etc
Amec Foster Wheeler PLC Engineering / Consulting - Upstream, LNG and gas monetization, Midstream, Downstream, Nuclear, Renewables, Water
Daelim Industrial Co Ltd Engineering / EPC - Gas, Petroleum refining, Chemical and Petrochemical, Power and Energy plants, Building and Housing, Civil works
Company Area of expertise
Source: Company websites, ICICIdirect.com Research
Exhibit 59: Peer matrix: Global
TTM 1 yr fwd TTM 1 yr fwdEngineers India Ltd India 1.5 0.2 0.1 0.1 22.8 13.6 12.1 0.0 38.7 21.7 3.7 3.2Fluor Corp United States 7.6 19.0 0.9 0.4 4.7 15.6 13.5 0.3 17.7 16.8 2.4 2.0TechnipFMC PLC Britain 14.9 13.7 1.7 0.7 12.2 13.8 15.8 0.5 27.0 19.8 2.7 1.3Stantec Inc Canada 2.9 2.3 0.0 0.0 1.0 33.3 13.0 0.3 20.0 14.5 N/A N/AToyo Engineering Corp Japan 0.5 2.5 0.0 0.0 0.7 5.3 6.3 0.7 16.5 15.9 1.0 1.0Yokogawa Electric Corp Japan 4.3 3.4 0.4 0.2 12.3 10.7 8.6 0.3 20.9 18.9 1.9 1.8Amec Foster Wheeler PLC Britain 2.4 8.3 0.4 0.3 4.6 8.2 7.0 0.8 8.0 7.0 N/A N/ADaelim Industrial Co Ltd South Korea 2.6 8.5 0.5 0.3 6.3 7.0 4.4 0.7 13.1 9.0 0.7 0.6Average 5.1 8.3 0.6 0.3 6.0 13.4 9.8 0.5 17.6 14.6 1.8 1.3
CompanyMcap
(US$ B)PAT
(US$ B)EBITDA
Margins (%)Net Sales (US$ B)
EBITDA (US$ B)Country ROCE (%)
ROE (%) Debt:Equity
P/E P/B
Source: Company, Bloomberg, ICICIdirect.com Research
EIL’s business model is more stable compared to its multinational peers. This is because of the high probability of the company receiving business from established domestic PSU majors
Page 33ICICI Securities Ltd | Retail Equity Research
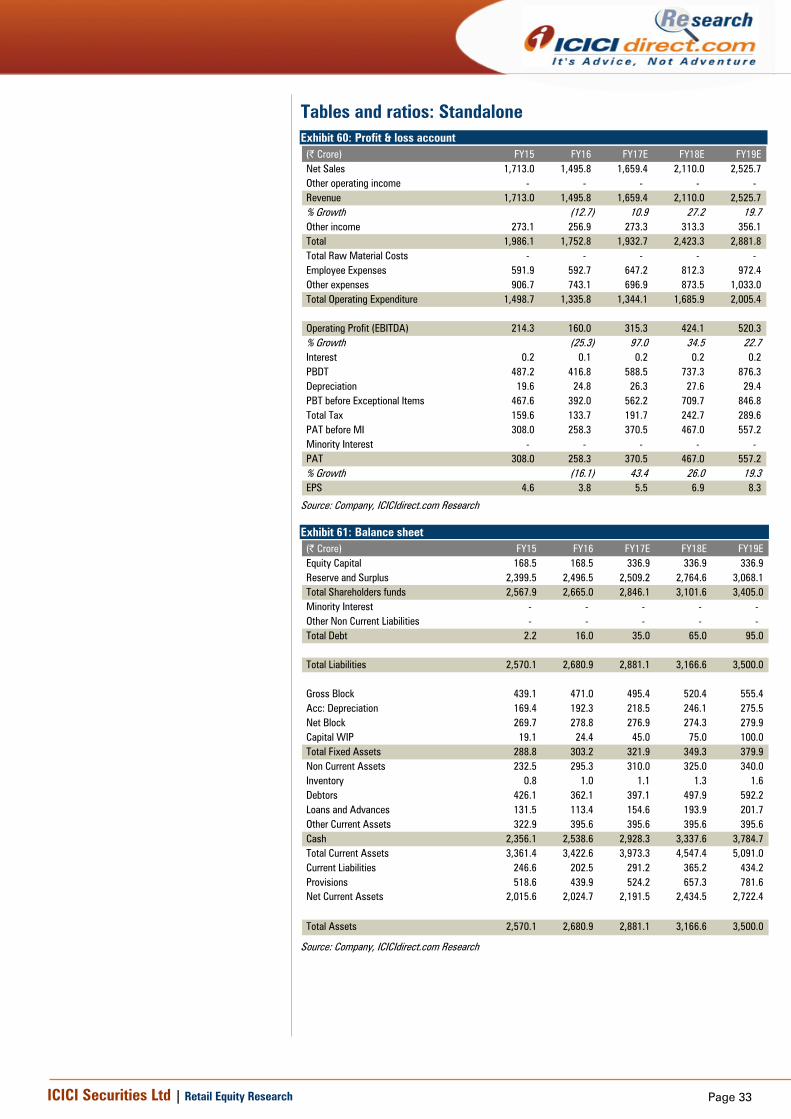
Tables and ratios: Standalone Exhibit 60: Profit & loss account
(| Crore) FY15 FY16 FY17E FY18E FY19ENet Sales 1,713.0 1,495.8 1,659.4 2,110.0 2,525.7 Other operating income - - - - - Revenue 1,713.0 1,495.8 1,659.4 2,110.0 2,525.7 % Growth (12.7) 10.9 27.2 19.7 Other income 273.1 256.9 273.3 313.3 356.1 Total 1,986.1 1,752.8 1,932.7 2,423.3 2,881.8 Total Raw Material Costs - - - - - Employee Expenses 591.9 592.7 647.2 812.3 972.4 Other expenses 906.7 743.1 696.9 873.5 1,033.0 Total Operating Expenditure 1,498.7 1,335.8 1,344.1 1,685.9 2,005.4
Operating Profit (EBITDA) 214.3 160.0 315.3 424.1 520.3 % Growth (25.3) 97.0 34.5 22.7 Interest 0.2 0.1 0.2 0.2 0.2 PBDT 487.2 416.8 588.5 737.3 876.3 Depreciation 19.6 24.8 26.3 27.6 29.4 PBT before Exceptional Items 467.6 392.0 562.2 709.7 846.8 Total Tax 159.6 133.7 191.7 242.7 289.6 PAT before MI 308.0 258.3 370.5 467.0 557.2 Minority Interest - - - - - PAT 308.0 258.3 370.5 467.0 557.2 % Growth (16.1) 43.4 26.0 19.3 EPS 4.6 3.8 5.5 6.9 8.3
Source: Company, ICICIdirect.com Research
Exhibit 61: Balance sheet (| Crore) FY15 FY16 FY17E FY18E FY19EEquity Capital 168.5 168.5 336.9 336.9 336.9 Reserve and Surplus 2,399.5 2,496.5 2,509.2 2,764.6 3,068.1 Total Shareholders funds 2,567.9 2,665.0 2,846.1 3,101.6 3,405.0 Minority Interest - - - - - Other Non Current Liabilities - - - - - Total Debt 2.2 16.0 35.0 65.0 95.0
Total Liabilities 2,570.1 2,680.9 2,881.1 3,166.6 3,500.0
Gross Block 439.1 471.0 495.4 520.4 555.4 Acc: Depreciation 169.4 192.3 218.5 246.1 275.5 Net Block 269.7 278.8 276.9 274.3 279.9 Capital WIP 19.1 24.4 45.0 75.0 100.0 Total Fixed Assets 288.8 303.2 321.9 349.3 379.9 Non Current Assets 232.5 295.3 310.0 325.0 340.0 Inventory 0.8 1.0 1.1 1.3 1.6 Debtors 426.1 362.1 397.1 497.9 592.2 Loans and Advances 131.5 113.4 154.6 193.9 201.7 Other Current Assets 322.9 395.6 395.6 395.6 395.6 Cash 2,356.1 2,538.6 2,928.3 3,337.6 3,784.7 Total Current Assets 3,361.4 3,422.6 3,973.3 4,547.4 5,091.0 Current Liabilities 246.6 202.5 291.2 365.2 434.2 Provisions 518.6 439.9 524.2 657.3 781.6 Net Current Assets 2,015.6 2,024.7 2,191.5 2,434.5 2,722.4
Total Assets 2,570.1 2,680.9 2,881.1 3,166.6 3,500.0
Source: Company, ICICIdirect.com Research
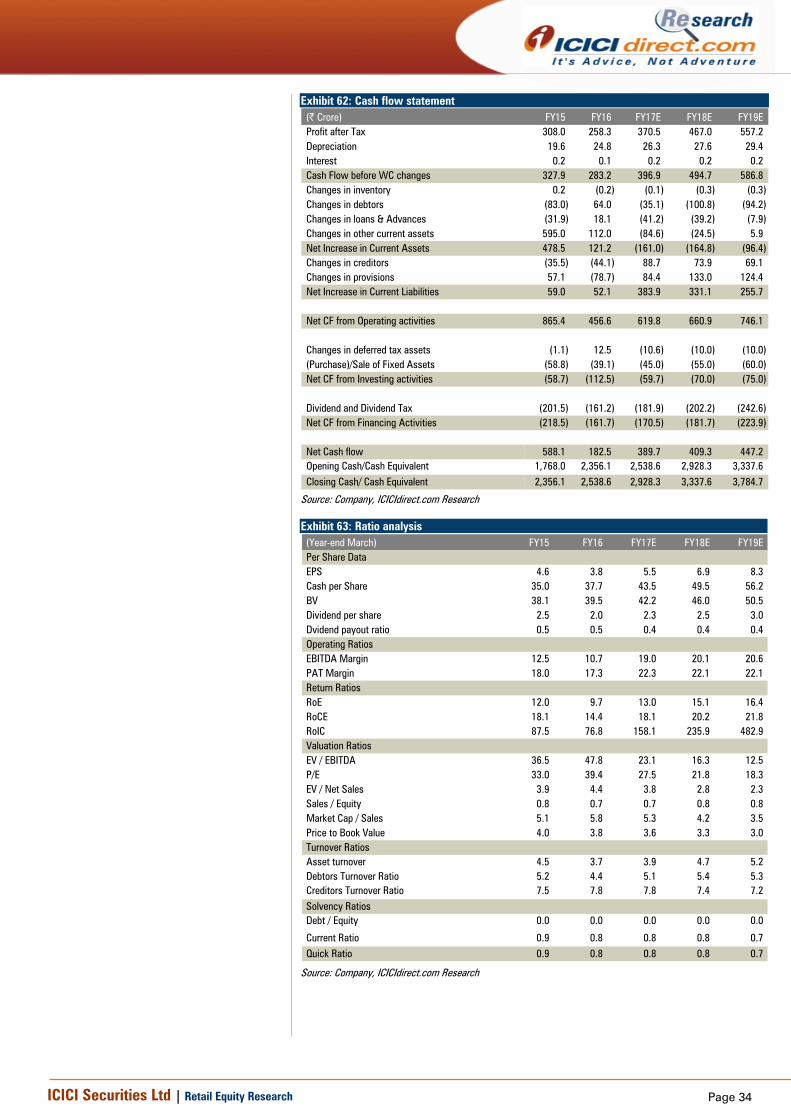
Page 34ICICI Securities Ltd | Retail Equity Research
Exhibit 62: Cash flow statement (| Crore) FY15 FY16 FY17E FY18E FY19EProfit after Tax 308.0 258.3 370.5 467.0 557.2 Depreciation 19.6 24.8 26.3 27.6 29.4 Interest 0.2 0.1 0.2 0.2 0.2 Cash Flow before WC changes 327.9 283.2 396.9 494.7 586.8 Changes in inventory 0.2 (0.2) (0.1) (0.3) (0.3) Changes in debtors (83.0) 64.0 (35.1) (100.8) (94.2) Changes in loans & Advances (31.9) 18.1 (41.2) (39.2) (7.9) Changes in other current assets 595.0 112.0 (84.6) (24.5) 5.9 Net Increase in Current Assets 478.5 121.2 (161.0) (164.8) (96.4) Changes in creditors (35.5) (44.1) 88.7 73.9 69.1 Changes in provisions 57.1 (78.7) 84.4 133.0 124.4 Net Increase in Current Liabilities 59.0 52.1 383.9 331.1 255.7
Net CF from Operating activities 865.4 456.6 619.8 660.9 746.1
Changes in deferred tax assets (1.1) 12.5 (10.6) (10.0) (10.0) (Purchase)/Sale of Fixed Assets (58.8) (39.1) (45.0) (55.0) (60.0) Net CF from Investing activities (58.7) (112.5) (59.7) (70.0) (75.0)
Dividend and Dividend Tax (201.5) (161.2) (181.9) (202.2) (242.6) Net CF from Financing Activities (218.5) (161.7) (170.5) (181.7) (223.9)
Net Cash flow 588.1 182.5 389.7 409.3 447.2 Opening Cash/Cash Equivalent 1,768.0 2,356.1 2,538.6 2,928.3 3,337.6 Closing Cash/ Cash Equivalent 2,356.1 2,538.6 2,928.3 3,337.6 3,784.7
Source: Company, ICICIdirect.com Research
Exhibit 63: Ratio analysis (Year-end March) FY15 FY16 FY17E FY18E FY19EPer Share DataEPS 4.6 3.8 5.5 6.9 8.3 Cash per Share 35.0 37.7 43.5 49.5 56.2 BV 38.1 39.5 42.2 46.0 50.5 Dividend per share 2.5 2.0 2.3 2.5 3.0 Dvidend payout ratio 0.5 0.5 0.4 0.4 0.4 Operating RatiosEBITDA Margin 12.5 10.7 19.0 20.1 20.6 PAT Margin 18.0 17.3 22.3 22.1 22.1 Return RatiosRoE 12.0 9.7 13.0 15.1 16.4 RoCE 18.1 14.4 18.1 20.2 21.8 RoIC 87.5 76.8 158.1 235.9 482.9 Valuation RatiosEV / EBITDA 36.5 47.8 23.1 16.3 12.5 P/E 33.0 39.4 27.5 21.8 18.3 EV / Net Sales 3.9 4.4 3.8 2.8 2.3 Sales / Equity 0.8 0.7 0.7 0.8 0.8 Market Cap / Sales 5.1 5.8 5.3 4.2 3.5 Price to Book Value 4.0 3.8 3.6 3.3 3.0 Turnover RatiosAsset turnover 4.5 3.7 3.9 4.7 5.2 Debtors Turnover Ratio 5.2 4.4 5.1 5.4 5.3 Creditors Turnover Ratio 7.5 7.8 7.8 7.4 7.2 Solvency RatiosDebt / Equity 0.0 0.0 0.0 0.0 0.0
Current Ratio 0.9 0.8 0.8 0.8 0.7 Quick Ratio 0.9 0.8 0.8 0.8 0.7
Source: Company, ICICIdirect.com Research
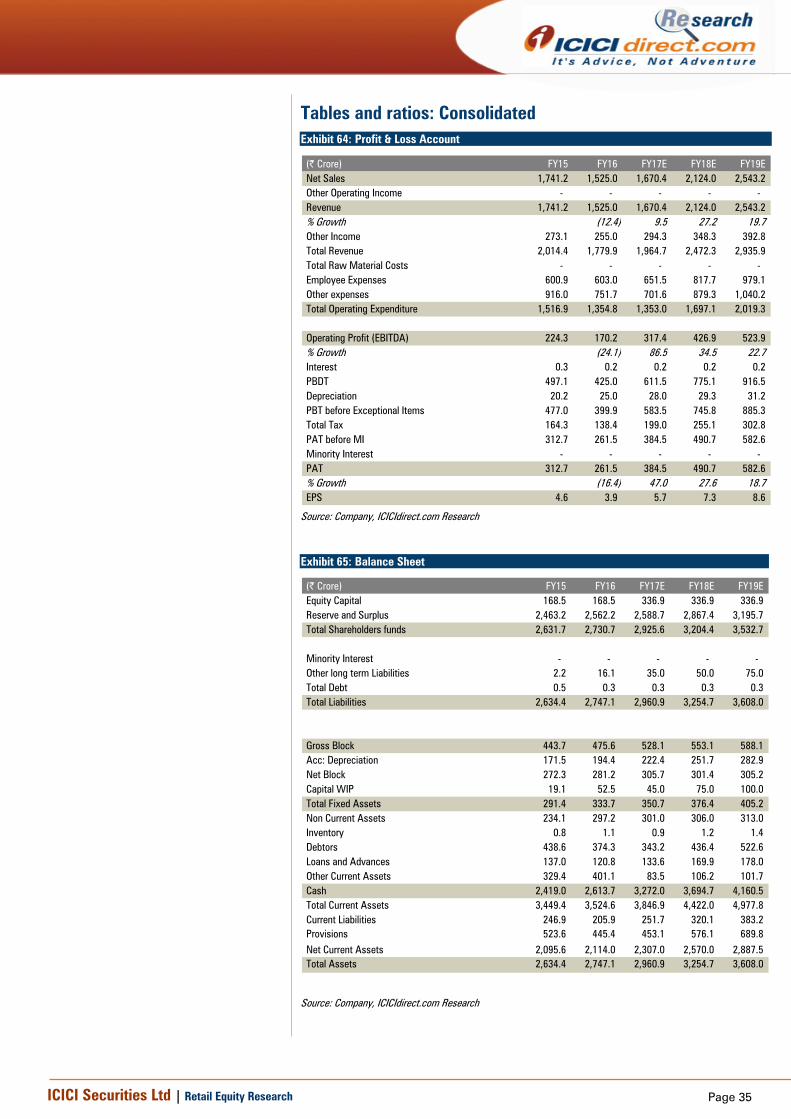
Page 35ICICI Securities Ltd | Retail Equity Research
Tables and ratios: Consolidated Exhibit 64: Profit & Loss Account
(| Crore) FY15 FY16 FY17E FY18E FY19ENet Sales 1,741.2 1,525.0 1,670.4 2,124.0 2,543.2 Other Operating Income - - - - - Revenue 1,741.2 1,525.0 1,670.4 2,124.0 2,543.2 % Growth (12.4) 9.5 27.2 19.7 Other Income 273.1 255.0 294.3 348.3 392.8 Total Revenue 2,014.4 1,779.9 1,964.7 2,472.3 2,935.9 Total Raw Material Costs - - - - - Employee Expenses 600.9 603.0 651.5 817.7 979.1 Other expenses 916.0 751.7 701.6 879.3 1,040.2 Total Operating Expenditure 1,516.9 1,354.8 1,353.0 1,697.1 2,019.3
Operating Profit (EBITDA) 224.3 170.2 317.4 426.9 523.9 % Growth (24.1) 86.5 34.5 22.7 Interest 0.3 0.2 0.2 0.2 0.2 PBDT 497.1 425.0 611.5 775.1 916.5 Depreciation 20.2 25.0 28.0 29.3 31.2 PBT before Exceptional Items 477.0 399.9 583.5 745.8 885.3 Total Tax 164.3 138.4 199.0 255.1 302.8 PAT before MI 312.7 261.5 384.5 490.7 582.6 Minority Interest - - - - - PAT 312.7 261.5 384.5 490.7 582.6 % Growth (16.4) 47.0 27.6 18.7 EPS 4.6 3.9 5.7 7.3 8.6
Source: Company, ICICIdirect.com Research
Exhibit 65: Balance Sheet
(| Crore) FY15 FY16 FY17E FY18E FY19EEquity Capital 168.5 168.5 336.9 336.9 336.9 Reserve and Surplus 2,463.2 2,562.2 2,588.7 2,867.4 3,195.7 Total Shareholders funds 2,631.7 2,730.7 2,925.6 3,204.4 3,532.7
Minority Interest - - - - - Other long term Liabilities 2.2 16.1 35.0 50.0 75.0 Total Debt 0.5 0.3 0.3 0.3 0.3 Total Liabilities 2,634.4 2,747.1 2,960.9 3,254.7 3,608.0
Gross Block 443.7 475.6 528.1 553.1 588.1 Acc: Depreciation 171.5 194.4 222.4 251.7 282.9 Net Block 272.3 281.2 305.7 301.4 305.2 Capital WIP 19.1 52.5 45.0 75.0 100.0 Total Fixed Assets 291.4 333.7 350.7 376.4 405.2 Non Current Assets 234.1 297.2 301.0 306.0 313.0 Inventory 0.8 1.1 0.9 1.2 1.4 Debtors 438.6 374.3 343.2 436.4 522.6 Loans and Advances 137.0 120.8 133.6 169.9 178.0 Other Current Assets 329.4 401.1 83.5 106.2 101.7 Cash 2,419.0 2,613.7 3,272.0 3,694.7 4,160.5 Total Current Assets 3,449.4 3,524.6 3,846.9 4,422.0 4,977.8 Current Liabilities 246.9 205.9 251.7 320.1 383.2 Provisions 523.6 445.4 453.1 576.1 689.8 Net Current Assets 2,095.6 2,114.0 2,307.0 2,570.0 2,887.5 Total Assets 2,634.4 2,747.1 2,960.9 3,254.7 3,608.0
Source: Company, ICICIdirect.com Research
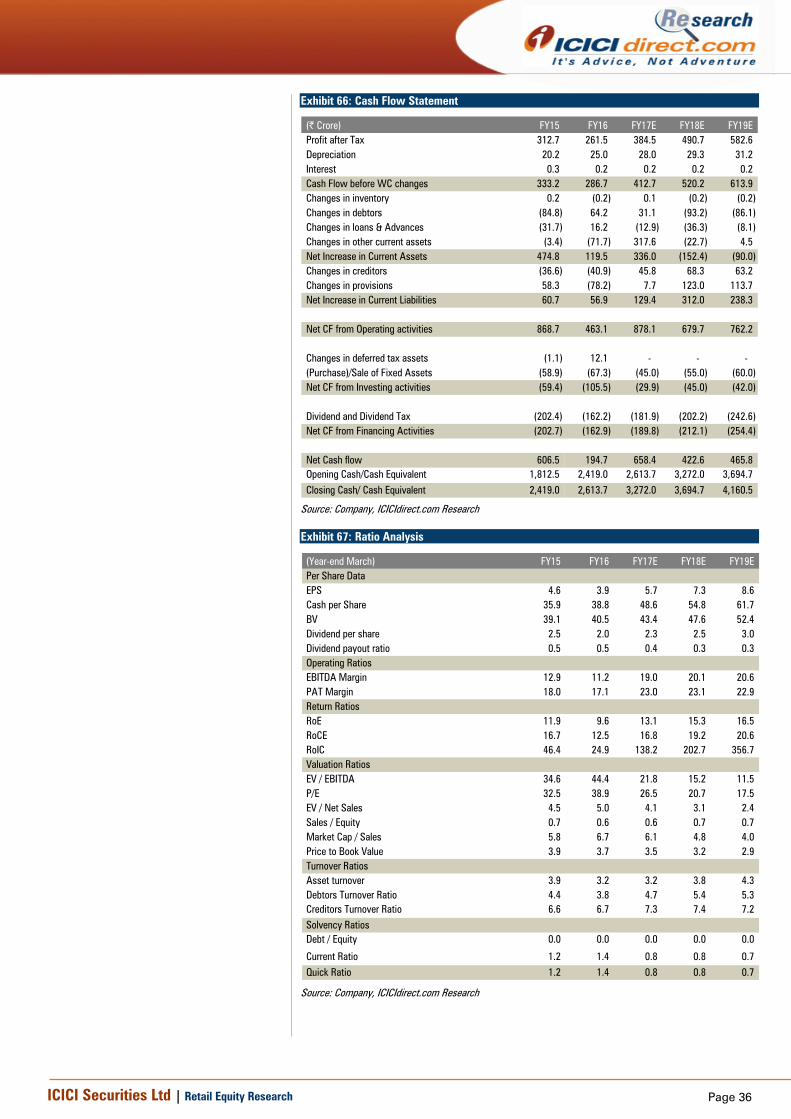
Page 36ICICI Securities Ltd | Retail Equity Research
Exhibit 66: Cash Flow Statement
(| Crore) FY15 FY16 FY17E FY18E FY19EProfit after Tax 312.7 261.5 384.5 490.7 582.6 Depreciation 20.2 25.0 28.0 29.3 31.2 Interest 0.3 0.2 0.2 0.2 0.2 Cash Flow before WC changes 333.2 286.7 412.7 520.2 613.9 Changes in inventory 0.2 (0.2) 0.1 (0.2) (0.2) Changes in debtors (84.8) 64.2 31.1 (93.2) (86.1) Changes in loans & Advances (31.7) 16.2 (12.9) (36.3) (8.1) Changes in other current assets (3.4) (71.7) 317.6 (22.7) 4.5 Net Increase in Current Assets 474.8 119.5 336.0 (152.4) (90.0) Changes in creditors (36.6) (40.9) 45.8 68.3 63.2 Changes in provisions 58.3 (78.2) 7.7 123.0 113.7 Net Increase in Current Liabilities 60.7 56.9 129.4 312.0 238.3
Net CF from Operating activities 868.7 463.1 878.1 679.7 762.2
Changes in deferred tax assets (1.1) 12.1 - - - (Purchase)/Sale of Fixed Assets (58.9) (67.3) (45.0) (55.0) (60.0) Net CF from Investing activities (59.4) (105.5) (29.9) (45.0) (42.0)
Dividend and Dividend Tax (202.4) (162.2) (181.9) (202.2) (242.6) Net CF from Financing Activities (202.7) (162.9) (189.8) (212.1) (254.4)
Net Cash flow 606.5 194.7 658.4 422.6 465.8 Opening Cash/Cash Equivalent 1,812.5 2,419.0 2,613.7 3,272.0 3,694.7 Closing Cash/ Cash Equivalent 2,419.0 2,613.7 3,272.0 3,694.7 4,160.5
Source: Company, ICICIdirect.com Research
Exhibit 67: Ratio Analysis
(Year-end March) FY15 FY16 FY17E FY18E FY19EPer Share DataEPS 4.6 3.9 5.7 7.3 8.6 Cash per Share 35.9 38.8 48.6 54.8 61.7 BV 39.1 40.5 43.4 47.6 52.4 Dividend per share 2.5 2.0 2.3 2.5 3.0 Dividend payout ratio 0.5 0.5 0.4 0.3 0.3 Operating RatiosEBITDA Margin 12.9 11.2 19.0 20.1 20.6 PAT Margin 18.0 17.1 23.0 23.1 22.9 Return RatiosRoE 11.9 9.6 13.1 15.3 16.5 RoCE 16.7 12.5 16.8 19.2 20.6 RoIC 46.4 24.9 138.2 202.7 356.7 Valuation RatiosEV / EBITDA 34.6 44.4 21.8 15.2 11.5 P/E 32.5 38.9 26.5 20.7 17.5 EV / Net Sales 4.5 5.0 4.1 3.1 2.4 Sales / Equity 0.7 0.6 0.6 0.7 0.7 Market Cap / Sales 5.8 6.7 6.1 4.8 4.0 Price to Book Value 3.9 3.7 3.5 3.2 2.9 Turnover RatiosAsset turnover 3.9 3.2 3.2 3.8 4.3 Debtors Turnover Ratio 4.4 3.8 4.7 5.4 5.3 Creditors Turnover Ratio 6.6 6.7 7.3 7.4 7.2 Solvency RatiosDebt / Equity 0.0 0.0 0.0 0.0 0.0
Current Ratio 1.2 1.4 0.8 0.8 0.7 Quick Ratio 1.2 1.4 0.8 0.8 0.7
Source: Company, ICICIdirect.com Research
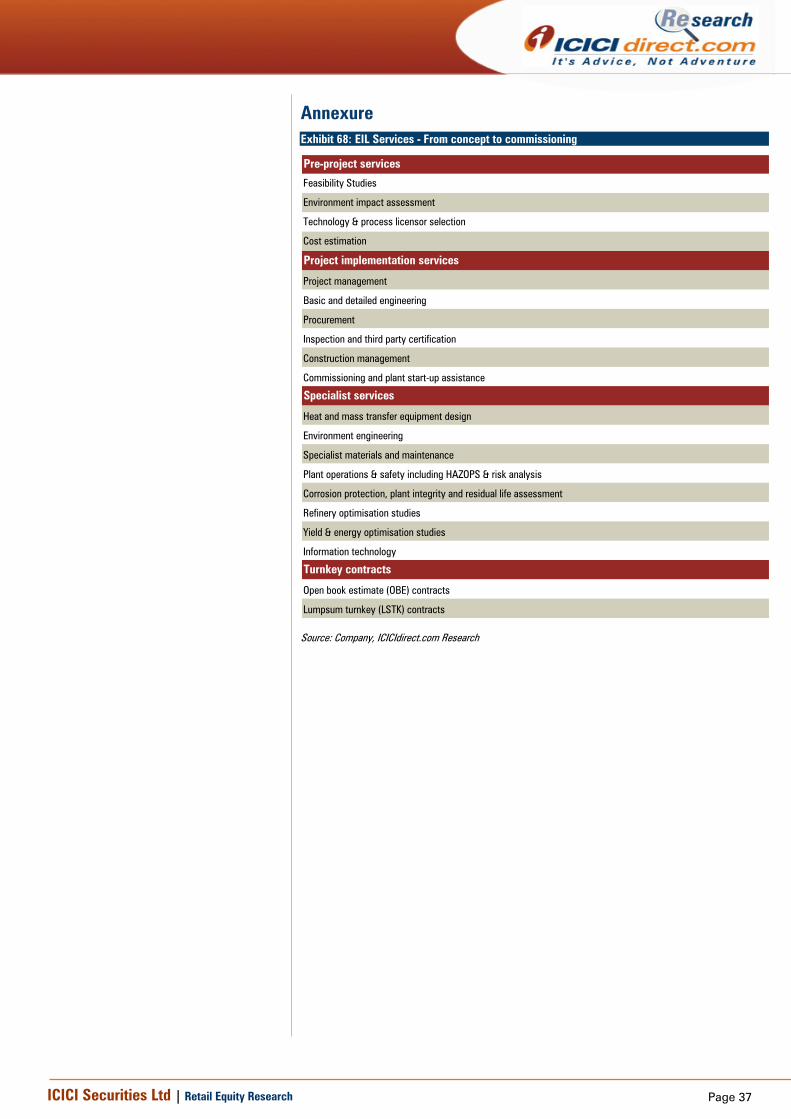
Page 37ICICI Securities Ltd | Retail Equity Research
Annexure Exhibit 68: EIL Services - From concept to commissioning
Pre-project services
Feasibility Studies
Environment impact assessment
Technology & process licensor selection
Cost estimation
Project implementation services
Project management
Basic and detailed engineering
Procurement
Inspection and third party certification
Construction management
Commissioning and plant start-up assistance
Specialist services
Heat and mass transfer equipment design
Environment engineering
Specialist materials and maintenance
Plant operations & safety including HAZOPS & risk analysis
Corrosion protection, plant integrity and residual life assessment
Refinery optimisation studies
Yield & energy optimisation studies
Information technology
Turnkey contracts
Open book estimate (OBE) contracts
Lumpsum turnkey (LSTK) contracts
Source: Company, ICICIdirect.com Research
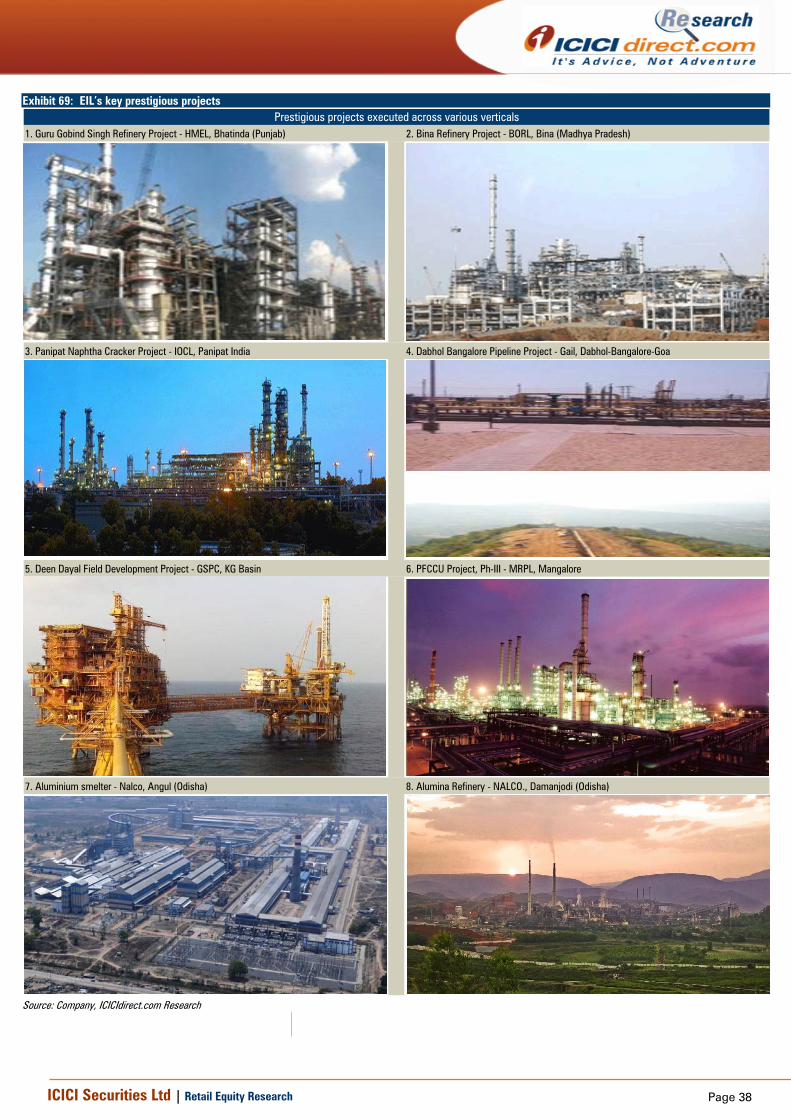
Page 38ICICI Securities Ltd | Retail Equity Research
Exhibit 69: EIL’s key prestigious projects
1. Guru Gobind Singh Refinery Project - HMEL, Bhatinda (Punjab) 2. Bina Refinery Project - BORL, Bina (Madhya Pradesh)
3. Panipat Naphtha Cracker Project - IOCL, Panipat India 4. Dabhol Bangalore Pipeline Project - Gail, Dabhol-Bangalore-Goa
5. Deen Dayal Field Development Project - GSPC, KG Basin 6. PFCCU Project, Ph-III - MRPL, Mangalore
7. Aluminium smelter - Nalco, Angul (Odisha) 8. Alumina Refinery - NALCO., Damanjodi (Odisha)
Prestigious projects executed across various verticals
Source: Company, ICICIdirect.com Research
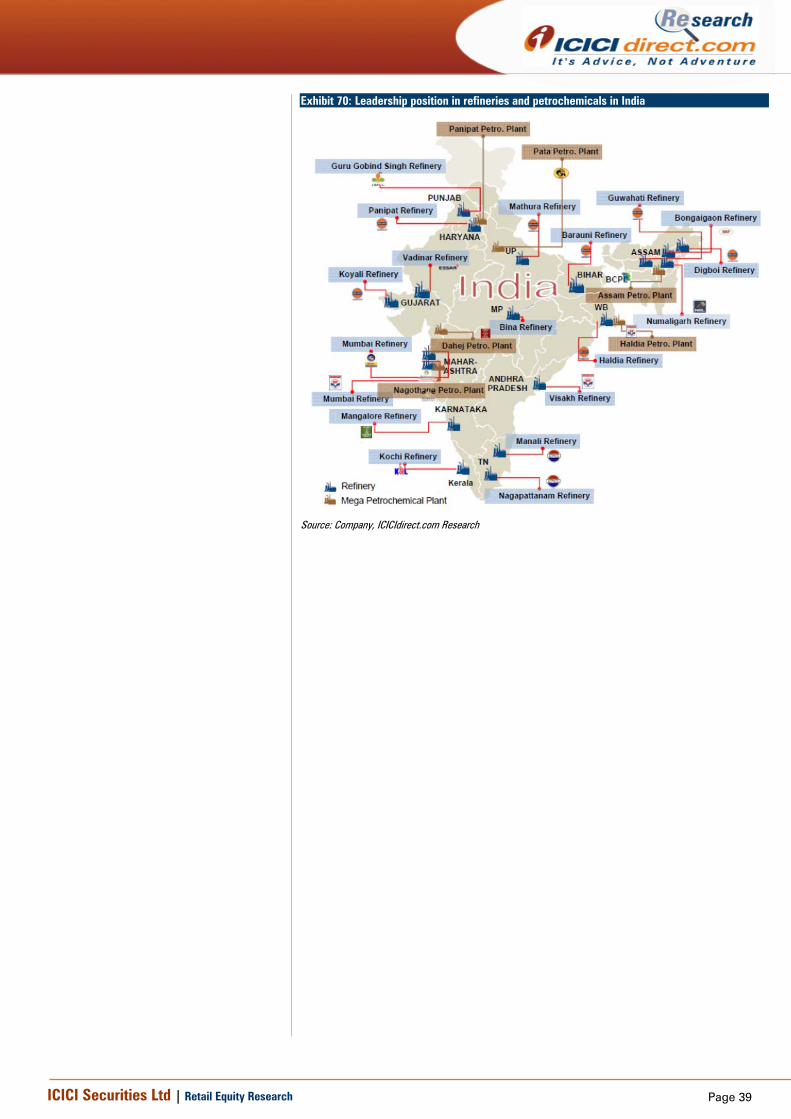
Page 39ICICI Securities Ltd | Retail Equity Research
Exhibit 70: Leadership position in refineries and petrochemicals in India
Source: Company, ICICIdirect.com Research
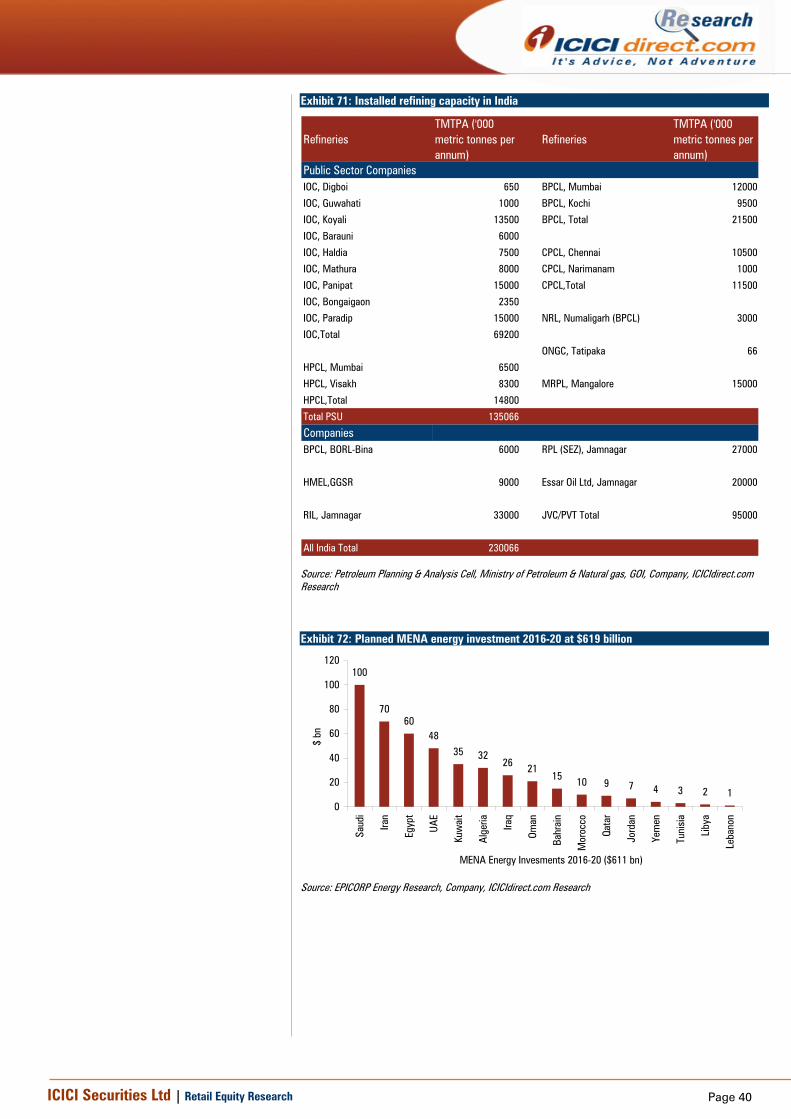
Page 40ICICI Securities Ltd | Retail Equity Research
Exhibit 71: Installed refining capacity in India
RefineriesTMTPA ('000 metric tonnes per annum)
RefineriesTMTPA ('000 metric tonnes per annum)
Public Sector CompaniesIOC, Digboi 650 BPCL, Mumbai 12000
IOC, Guwahati 1000 BPCL, Kochi 9500
IOC, Koyali 13500 BPCL, Total 21500
IOC, Barauni 6000
IOC, Haldia 7500 CPCL, Chennai 10500
IOC, Mathura 8000 CPCL, Narimanam 1000
IOC, Panipat 15000 CPCL,Total 11500
IOC, Bongaigaon 2350
IOC, Paradip 15000 NRL, Numaligarh (BPCL) 3000
IOC,Total 69200
ONGC, Tatipaka 66
HPCL, Mumbai 6500
HPCL, Visakh 8300 MRPL, Mangalore 15000
HPCL,Total 14800
Total PSU 135066
CompaniesBPCL, BORL-Bina 6000 RPL (SEZ), Jamnagar 27000
HMEL,GGSR 9000 Essar Oil Ltd, Jamnagar 20000
RIL, Jamnagar 33000 JVC/PVT Total 95000
All India Total 230066
Source: Petroleum Planning & Analysis Cell, Ministry of Petroleum & Natural gas, GOI, Company, ICICIdirect.com Research
Exhibit 72: Planned MENA energy investment 2016-20 at $619 billion
MENA Energy Invesments 2016-20 ($611 bn)
100
7060
4835 32
26 2115 10 9 7 4 3 2 1
0
20
40
60
80
100
120
Saud
i
Iran
Egyp
t
UAE
Kuw
ait
Alge
ria Iraq
Oman
Bahr
ain
Mor
occo
Qata
r
Jord
an
Yem
en
Tuni
sia
Liby
a
Leba
non
$ bn
Source: EPICORP Energy Research, Company, ICICIdirect.com Research
Page 41ICICI Securities Ltd | Retail Equity Research
RATING RATIONALE ICICIdirect.com endeavours to provide objective opinions and recommendations. ICICIdirect.com assigns ratings to its stocks according to their notional target price vs. current market price and then categorises them as Strong Buy, Buy, Hold and Sell. The performance horizon is two years unless specified and the notional target price is defined as the analysts' valuation for a stock. Strong Buy: >15%/20% for large caps/midcaps, respectively, with high conviction; Buy: >10%/15% for large caps/midcaps, respectively; Hold: Up to +/-10%; Sell: -10% or more;
Pankaj Pandey Head – Research [email protected]
ICICIdirect.com Research Desk, ICICI Securities Limited, 1st Floor, Akruti Trade Centre, Road No. 7, MIDC, Andheri (East) Mumbai – 400 093
Page 42ICICI Securities Ltd | Retail Equity Research
Disclaimer
ANALYST CERTIFICATION We /I, Chirag Shah PGDBM; Sagar Gandhi MBA (Finance), Research Analysts, authors and the names subscribed to this report, hereby certify that all of the views expressed in this research report accurately reflect our views about the subject issuer(s) or securities. We also certify that no part of our compensation was, is, or will be directly or indirectly related to the specific recommendation(s) or view(s) in this report.
Terms & conditions and other disclosures: ICICI Securities Limited (ICICI Securities) is a full-service, integrated investment banking and is, inter alia, engaged in the business of stock brokering and distribution of financial products. ICICI Securities Limited is a Sebi registered Research Analyst with Sebi Registration Number – INH000000990. ICICI Securities is a wholly-owned subsidiary of ICICI Bank which is India’s largest private sector bank and has its various subsidiaries engaged in businesses of housing finance, asset management, life insurance, general insurance, venture capital fund management, etc. (“associates”), the details in respect of which are available on www.icicibank.com. ICICI Securities is one of the leading merchant bankers/ underwriters of securities and participate in virtually all securities trading markets in India. We and our associates might have investment banking and other business relationship with a significant percentage of companies covered by our Investment Research Department. ICICI Securities generally prohibits its analysts, persons reporting to analysts and their relatives from maintaining a financial interest in the securities or derivatives of any companies that the analysts cover. The information and opinions in this report have been prepared by ICICI Securities and are subject to change without any notice. The report and information contained herein is strictly confidential and meant solely for the selected recipient and may not be altered in any way, transmitted to, copied or distributed, in part or in whole, to any other person or to the media or reproduced in any form, without prior written consent of ICICI Securities. While we would endeavour to update the information herein on a reasonable basis, ICICI Securities is under no obligation to update or keep the information current. Also, there may be regulatory, compliance or other reasons that may prevent ICICI Securities from doing so. Non-rated securities indicate that rating on a particular security has been suspended temporarily and such suspension is in compliance with applicable regulations and/or ICICI Securities policies, in circumstances where ICICI Securities might be acting in an advisory capacity to this company, or in certain other circumstances. This report is based on information obtained from public sources and sources believed to be reliable, but no independent verification has been made nor is its accuracy or completeness guaranteed. This report and information herein is solely for informational purpose and shall not be used or considered as an offer document or solicitation of offer to buy or sell or subscribe for securities or other financial instruments. Though disseminated to all the customers simultaneously, not all customers may receive this report at the same time. ICICI Securities will not treat recipients as customers by virtue of their receiving this report. Nothing in this report constitutes investment, legal, accounting and tax advice or a representation that any investment or strategy is suitable or appropriate to your specific circumstances. The securities discussed and opinions expressed in this report may not be suitable for all investors, who must make their own investment decisions, based on their own investment objectives, financial positions and needs of specific recipient. This may not be taken in substitution for the exercise of independent judgment by any recipient. The recipient should independently evaluate the investment risks. The value and return on investment may vary because of changes in interest rates, foreign exchange rates or any other reason. ICICI Securities accepts no liabilities whatsoever for any loss or damage of any kind arising out of the use of this report. Past performance is not necessarily a guide to future performance. Investors are advised to see Risk Disclosure Document to understand the risks associated before investing in the securities markets. Actual results may differ materially from those set forth in projections. Forward-looking statements are not predictions and may be subject to change without notice. ICICI Securities or its associates might have managed or co-managed public offering of securities for the subject company or might have been mandated by the subject company for any other assignment in the past twelve months. ICICI Securities or its associates might have received any compensation from the companies mentioned in the report during the period preceding twelve months from the date of this report for services in respect of managing or co-managing public offerings, corporate finance, investment banking or merchant banking, brokerage services or other advisory service in a merger or specific transaction. ICICI Securities or its associates might have received any compensation for products or services other than investment banking or merchant banking or brokerage services from the companies mentioned in the report in the past twelve months. ICICI Securities encourages independence in research report preparation and strives to minimize conflict in preparation of research report. ICICI Securities or its associates or its analysts did not receive any compensation or other benefits from the companies mentioned in the report or third party in connection with preparation of the research report. Accordingly, neither ICICI Securities nor Research Analysts and their relatives have any material conflict of interest at the time of publication of this report. It is confirmed that Chirag Shah PGDBM; Sagar Gandhi MBA (Finance), Research Analysts of this report have not received any compensation from the companies mentioned in the report in the preceding twelve months. Compensation of our Research Analysts is not based on any specific merchant banking, investment banking or brokerage service transactions. ICICI Securities or its subsidiaries collectively or Research Analysts or their relatives do not own 1% or more of the equity securities of the Company mentioned in the report as of the last day of the month preceding the publication of the research report. Since associates of ICICI Securities are engaged in various financial service businesses, they might have financial interests or beneficial ownership in various companies including the subject company/companies mentioned in this report. It is confirmed that Chirag Shah PGDBM; Sagar Gandhi MBA (Finance), Research Analysts do not serve as an officer, director or employee of the companies mentioned in the report. ICICI Securities may have issued other reports that are inconsistent with and reach different conclusion from the information presented in this report. Neither the Research Analysts nor ICICI Securities have been engaged in market making activity for the companies mentioned in the report. We submit that no material disciplinary action has been taken on ICICI Securities by any Regulatory Authority impacting Equity Research Analysis activities. This report is not directed or intended for distribution to, or use by, any person or entity who is a citizen or resident of or located in any locality, state, country or other jurisdiction, where such distribution, publication, availability or use would be contrary to law, regulation or which would subject ICICI Securities and affiliates to any registration or licensing requirement within such jurisdiction. The securities described herein may or may not be eligible for sale in all jurisdictions or to certain category of investors. Persons in whose possession this document may come are required to inform themselves of and to observe such restriction.