Embed Size (px)
Citation preview
July 20, 2016
ICICI Securities Ltd | Retail Equity Research
Result Update
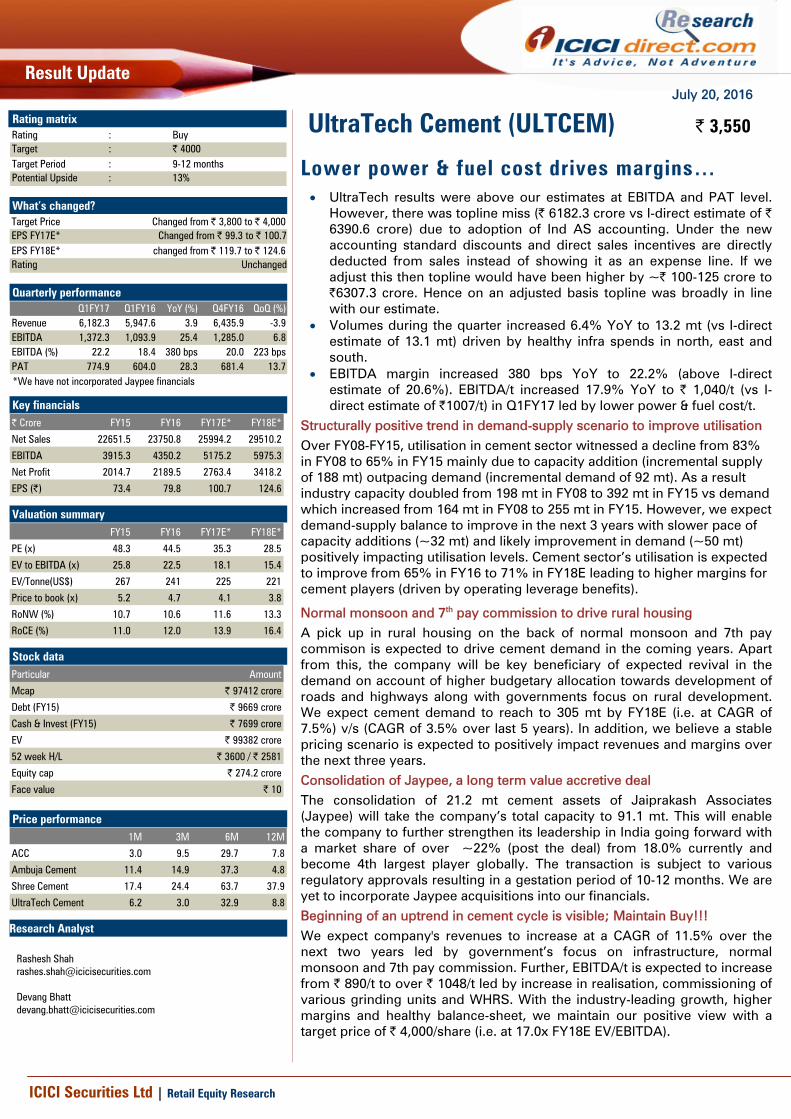
Lower power & fuel cost drives margins… • UltraTech results were above our estimates at EBITDA and PAT level.
However, there was topline miss (| 6182.3 crore vs I-direct estimate of | 6390.6 crore) due to adoption of Ind AS accounting. Under the new accounting standard discounts and direct sales incentives are directly deducted from sales instead of showing it as an expense line. If we adjust this then topline would have been higher by ~| 100-125 crore to |6307.3 crore. Hence on an adjusted basis topline was broadly in line with our estimate.
• Volumes during the quarter increased 6.4% YoY to 13.2 mt (vs I-direct estimate of 13.1 mt) driven by healthy infra spends in north, east and south.
• EBITDA margin increased 380 bps YoY to 22.2% (above I-direct estimate of 20.6%). EBITDA/t increased 17.9% YoY to | 1,040/t (vs I-direct estimate of |1007/t) in Q1FY17 led by lower power & fuel cost/t.
Structurally positive trend in demand-supply scenario to improve utilisation Over FY08-FY15, utilisation in cement sector witnessed a decline from 83% in FY08 to 65% in FY15 mainly due to capacity addition (incremental supply of 188 mt) outpacing demand (incremental demand of 92 mt). As a result industry capacity doubled from 198 mt in FY08 to 392 mt in FY15 vs demand which increased from 164 mt in FY08 to 255 mt in FY15. However, we expect demand-supply balance to improve in the next 3 years with slower pace of capacity additions (~32 mt) and likely improvement in demand (~50 mt) positively impacting utilisation levels. Cement sector’s utilisation is expected to improve from 65% in FY16 to 71% in FY18E leading to higher margins for cement players (driven by operating leverage benefits).
Normal monsoon and 7th pay commission to drive rural housing A pick up in rural housing on the back of normal monsoon and 7th pay commison is expected to drive cement demand in the coming years. Apart from this, the company will be key beneficiary of expected revival in the demand on account of higher budgetary allocation towards development of roads and highways along with governments focus on rural development. We expect cement demand to reach to 305 mt by FY18E (i.e. at CAGR of 7.5%) v/s (CAGR of 3.5% over last 5 years). In addition, we believe a stable pricing scenario is expected to positively impact revenues and margins over the next three years. Consolidation of Jaypee, a long term value accretive deal The consolidation of 21.2 mt cement assets of Jaiprakash Associates (Jaypee) will take the company’s total capacity to 91.1 mt. This will enable the company to further strengthen its leadership in India going forward with a market share of over ~22% (post the deal) from 18.0% currently and become 4th largest player globally. The transaction is subject to various regulatory approvals resulting in a gestation period of 10-12 months. We are yet to incorporate Jaypee acquisitions into our financials. Beginning of an uptrend in cement cycle is visible; Maintain Buy!!! We expect company's revenues to increase at a CAGR of 11.5% over the next two years led by government’s focus on infrastructure, normal monsoon and 7th pay commission. Further, EBITDA/t is expected to increase from | 890/t to over | 1048/t led by increase in realisation, commissioning of various grinding units and WHRS. With the industry-leading growth, higher margins and healthy balance-sheet, we maintain our positive view with a target price of | 4,000/share (i.e. at 17.0x FY18E EV/EBITDA).
UltraTech Cement (ULTCEM) | 3,550 Rating matrix Rating : BuyTarget : | 4000Target Period : 9-12 monthsPotential Upside : 13%
What’s changed? Target Price Changed from | 3,800 to | 4,000EPS FY17E* Changed from | 99.3 to | 100.7EPS FY18E* changed from | 119.7 to | 124.6Rating Unchanged
Quarterly performance
Q1FY17 Q1FY16 YoY (%) Q4FY16 QoQ (%)Revenue 6,182.3 5,947.6 3.9 6,435.9 -3.9EBITDA 1,372.3 1,093.9 25.4 1,285.0 6.8EBITDA (%) 22.2 18.4 380 bps 20.0 223 bpsPAT 774.9 604.0 28.3 681.4 13.7 *We have not incorporated Jaypee financials Key financials | Crore FY15 FY16 FY17E* FY18E*
Net Sales 22651.5 23750.8 25994.2 29510.2
EBITDA 3915.3 4350.2 5175.2 5975.3
Net Profit 2014.7 2189.5 2763.4 3418.2
EPS (|) 73.4 79.8 100.7 124.6 Valuation summary
FY15 FY16 FY17E* FY18E*
PE (x) 48.3 44.5 35.3 28.5
EV to EBITDA (x) 25.8 22.5 18.1 15.4
EV/Tonne(US$) 267 241 225 221
Price to book (x) 5.2 4.7 4.1 3.8
RoNW (%) 10.7 10.6 11.6 13.3
RoCE (%) 11.0 12.0 13.9 16.4 Stock data
Amount
Mcap | 97412 crore
Debt (FY15) | 9669 crore
Cash & Invest (FY15) | 7699 crore
EV | 99382 crore
52 week H/L | 3600 / | 2581
Equity cap | 274.2 crore
Face value | 10
Particular
Price performance
1M 3M 6M 12M
ACC 3.0 9.5 29.7 7.8
Ambuja Cement 11.4 14.9 37.3 4.8
Shree Cement 17.4 24.4 63.7 37.9
UltraTech Cement 6.2 3.0 32.9 8.8 Research Analyst
Rashesh Shah [email protected]
Devang Bhatt [email protected]
ICICI Securities Ltd | Retail Equity Research Page 2
Variance analysis Q1FY17 Q1FY17E Q1FY16 YoY (%) Q4FY16 QoQ (%) Comments
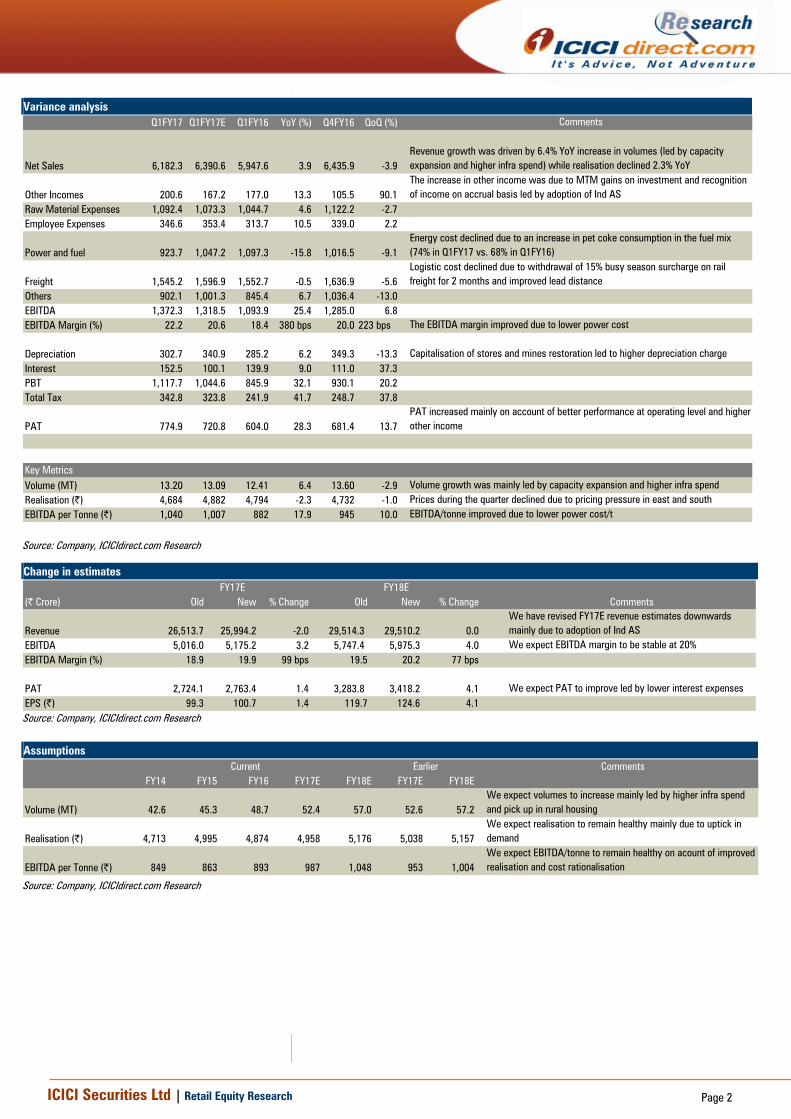
Net Sales 6,182.3 6,390.6 5,947.6 3.9 6,435.9 -3.9Revenue growth was driven by 6.4% YoY increase in volumes (led by capacity expansion and higher infra spend) while realisation declined 2.3% YoY
Other Incomes 200.6 167.2 177.0 13.3 105.5 90.1The increase in other income was due to MTM gains on investment and recognition of income on accrual basis led by adoption of Ind AS
Raw Material Expenses 1,092.4 1,073.3 1,044.7 4.6 1,122.2 -2.7Employee Expenses 346.6 353.4 313.7 10.5 339.0 2.2
Power and fuel 923.7 1,047.2 1,097.3 -15.8 1,016.5 -9.1Energy cost declined due to an increase in pet coke consumption in the fuel mix (74% in Q1FY17 vs. 68% in Q1FY16)
Freight 1,545.2 1,596.9 1,552.7 -0.5 1,636.9 -5.6Logistic cost declined due to withdrawal of 15% busy season surcharge on rail freight for 2 months and improved lead distance
Others 902.1 1,001.3 845.4 6.7 1,036.4 -13.0EBITDA 1,372.3 1,318.5 1,093.9 25.4 1,285.0 6.8EBITDA Margin (%) 22.2 20.6 18.4 380 bps 20.0 223 bps The EBITDA margin improved due to lower power cost
Depreciation 302.7 340.9 285.2 6.2 349.3 -13.3 Capitalisation of stores and mines restoration led to higher depreciation chargeInterest 152.5 100.1 139.9 9.0 111.0 37.3PBT 1,117.7 1,044.6 845.9 32.1 930.1 20.2Total Tax 342.8 323.8 241.9 41.7 248.7 37.8
PAT 774.9 720.8 604.0 28.3 681.4 13.7PAT increased mainly on account of better performance at operating level and higher other income
Key MetricsVolume (MT) 13.20 13.09 12.41 6.4 13.60 -2.9 Volume growth was mainly led by capacity expansion and higher infra spendRealisation (|) 4,684 4,882 4,794 -2.3 4,732 -1.0 Prices during the quarter declined due to pricing pressure in east and southEBITDA per Tonne (|) 1,040 1,007 882 17.9 945 10.0 EBITDA/tonne improved due to lower power cost/t
Source: Company, ICICIdirect.com Research
Change in estimates
(| Crore) Old New % Change Old New % Change Comments
Revenue 26,513.7 25,994.2 -2.0 29,514.3 29,510.2 0.0We have revised FY17E revenue estimates downwards mainly due to adoption of Ind AS
EBITDA 5,016.0 5,175.2 3.2 5,747.4 5,975.3 4.0 We expect EBITDA margin to be stable at 20%EBITDA Margin (%) 18.9 19.9 99 bps 19.5 20.2 77 bps
PAT 2,724.1 2,763.4 1.4 3,283.8 3,418.2 4.1 We expect PAT to improve led by lower interest expensesEPS (|) 99.3 100.7 1.4 119.7 124.6 4.1
FY17E FY18E
Source: Company, ICICIdirect.com Research Assumptions
CommentsFY14 FY15 FY16 FY17E FY18E FY17E FY18E
Volume (MT) 42.6 45.3 48.7 52.4 57.0 52.6 57.2We expect volumes to increase mainly led by higher infra spend and pick up in rural housing
Realisation (|) 4,713 4,995 4,874 4,958 5,176 5,038 5,157We expect realisation to remain healthy mainly due to uptick in demand
EBITDA per Tonne (|) 849 863 893 987 1,048 953 1,004We expect EBITDA/tonne to remain healthy on acount of improved realisation and cost rationalisation
EarlierCurrent
Source: Company, ICICIdirect.com Research
ICICI Securities Ltd | Retail Equity Research Page 3
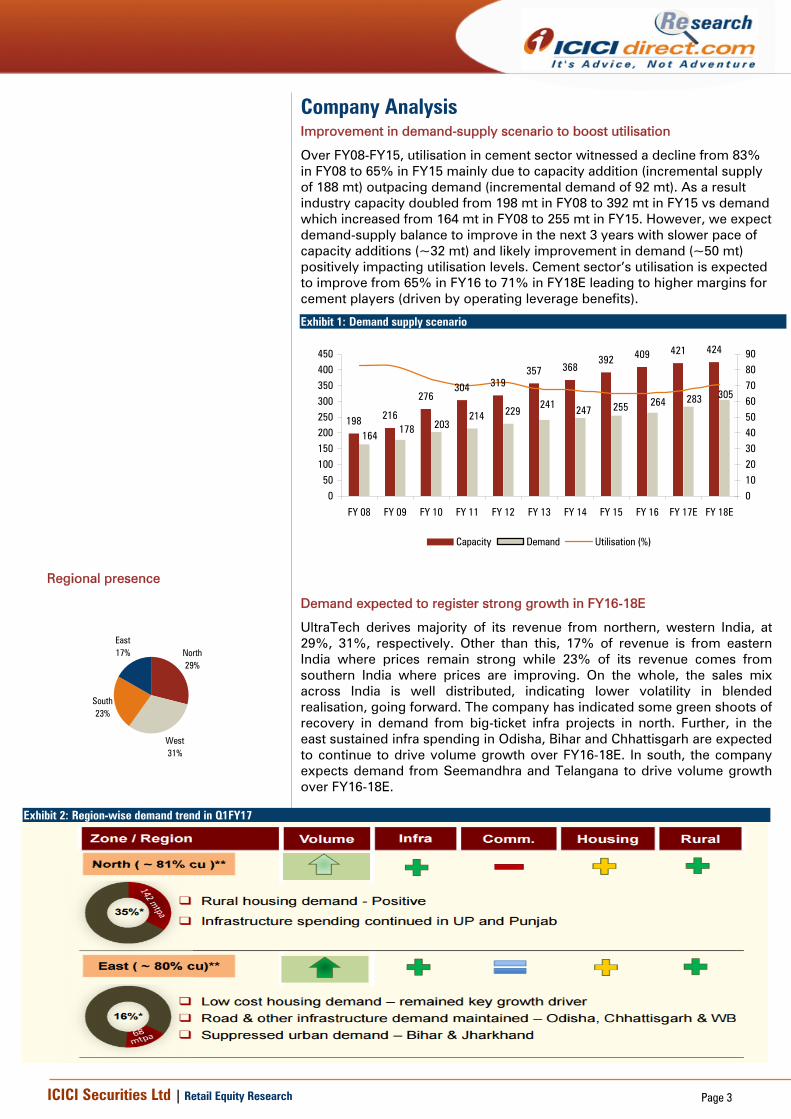
Company Analysis Improvement in demand-supply scenario to boost utilisation
Over FY08-FY15, utilisation in cement sector witnessed a decline from 83% in FY08 to 65% in FY15 mainly due to capacity addition (incremental supply of 188 mt) outpacing demand (incremental demand of 92 mt). As a result industry capacity doubled from 198 mt in FY08 to 392 mt in FY15 vs demand which increased from 164 mt in FY08 to 255 mt in FY15. However, we expect demand-supply balance to improve in the next 3 years with slower pace of capacity additions (~32 mt) and likely improvement in demand (~50 mt) positively impacting utilisation levels. Cement sector’s utilisation is expected to improve from 65% in FY16 to 71% in FY18E leading to higher margins for cement players (driven by operating leverage benefits).
Exhibit 1: Demand supply scenario
198 216
276304 319
357 368392 409 421 424
305283264255247241229214
203178164
050
100150200250300350400450
FY 08 FY 09 FY 10 FY 11 FY 12 FY 13 FY 14 FY 15 FY 16 FY 17E FY 18E
0102030405060708090
Capacity Demand Utilisation (%)
Demand expected to register strong growth in FY16-18E
UltraTech derives majority of its revenue from northern, western India, at 29%, 31%, respectively. Other than this, 17% of revenue is from eastern India where prices remain strong while 23% of its revenue comes from southern India where prices are improving. On the whole, the sales mix across India is well distributed, indicating lower volatility in blended realisation, going forward. The company has indicated some green shoots of recovery in demand from big-ticket infra projects in north. Further, in the east sustained infra spending in Odisha, Bihar and Chhattisgarh are expected to continue to drive volume growth over FY16-18E. In south, the company expects demand from Seemandhra and Telangana to drive volume growth over FY16-18E.
Exhibit 2: Region-wise demand trend in Q1FY17
Source: Company, ICICIdirect.com Research
Regional presence
East17%
South23%
West31%
North29%
ICICI Securities Ltd | Retail Equity Research Page 4
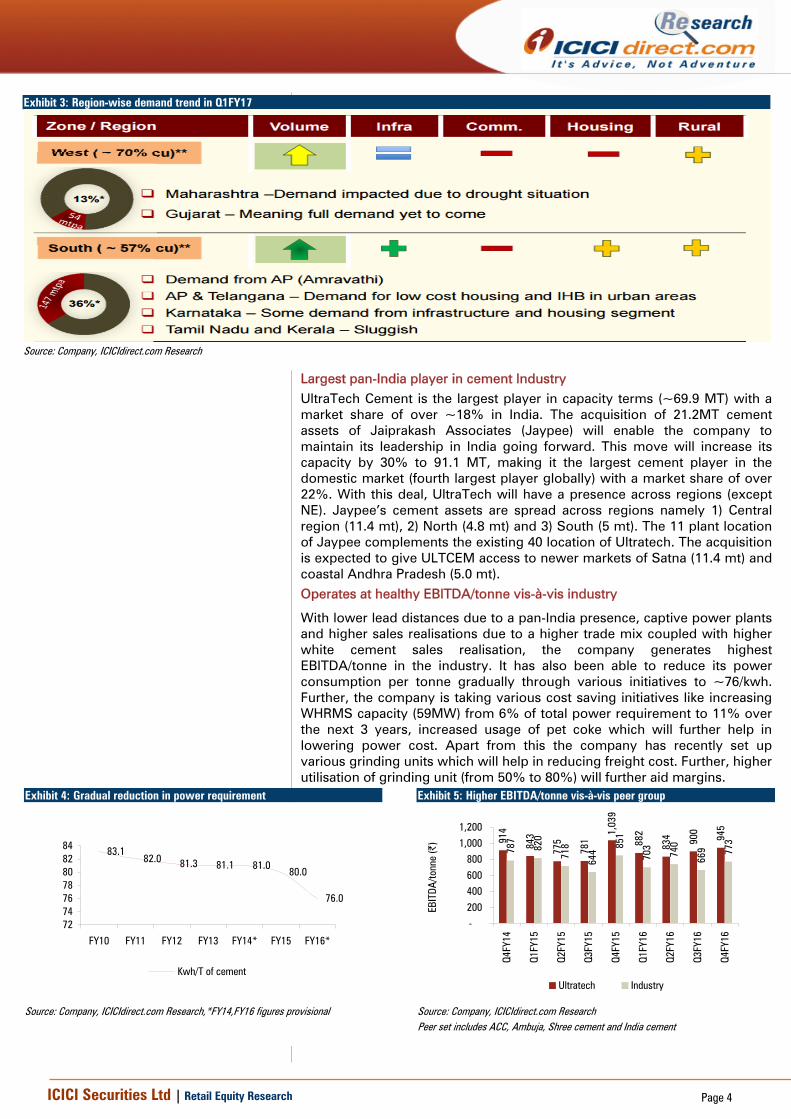
Exhibit 3: Region-wise demand trend in Q1FY17
Source: Company, ICICIdirect.com Research
Largest pan-India player in cement Industry UltraTech Cement is the largest player in capacity terms (~69.9 MT) with a market share of over ~18% in India. The acquisition of 21.2MT cement assets of Jaiprakash Associates (Jaypee) will enable the company to maintain its leadership in India going forward. This move will increase its capacity by 30% to 91.1 MT, making it the largest cement player in the domestic market (fourth largest player globally) with a market share of over 22%. With this deal, UltraTech will have a presence across regions (except NE). Jaypee’s cement assets are spread across regions namely 1) Central region (11.4 mt), 2) North (4.8 mt) and 3) South (5 mt). The 11 plant location of Jaypee complements the existing 40 location of Ultratech. The acquisition is expected to give ULTCEM access to newer markets of Satna (11.4 mt) and coastal Andhra Pradesh (5.0 mt). Operates at healthy EBITDA/tonne vis-à-vis industry
With lower lead distances due to a pan-India presence, captive power plants and higher sales realisations due to a higher trade mix coupled with higher white cement sales realisation, the company generates highest EBITDA/tonne in the industry. It has also been able to reduce its power consumption per tonne gradually through various initiatives to ~76/kwh. Further, the company is taking various cost saving initiatives like increasing WHRMS capacity (59MW) from 6% of total power requirement to 11% over the next 3 years, increased usage of pet coke which will further help in lowering power cost. Apart from this the company has recently set up various grinding units which will help in reducing freight cost. Further, higher utilisation of grinding unit (from 50% to 80%) will further aid margins.
Exhibit 4: Gradual reduction in power requirement
83.182.0 81.3 81.1 81.0
80.0
76.0
72747678808284
FY10 FY11 FY12 FY13 FY14* FY15 FY16*
Kwh/T of cement
Source: Company, ICICIdirect.com Research,*FY14,FY16 figures provisional
Exhibit 5: Higher EBITDA/tonne vis-à-vis peer group
914
843
775
781
1,03
9
882
834 90
0
945
787
820
718
644 85
1
703
740
669 77
3
-200
400600
8001,000
1,200
Q4FY
14
Q1FY
15
Q2FY
15
Q3FY
15
Q4FY
15
Q1FY
16
Q2FY
16
Q3FY
16
Q4FY
16
EBIT
DA/to
nne
(|)
Ultratech Industry
Source: Company, ICICIdirect.com Research Peer set includes ACC, Ambuja, Shree cement and India cement
ICICI Securities Ltd | Retail Equity Research Page 5
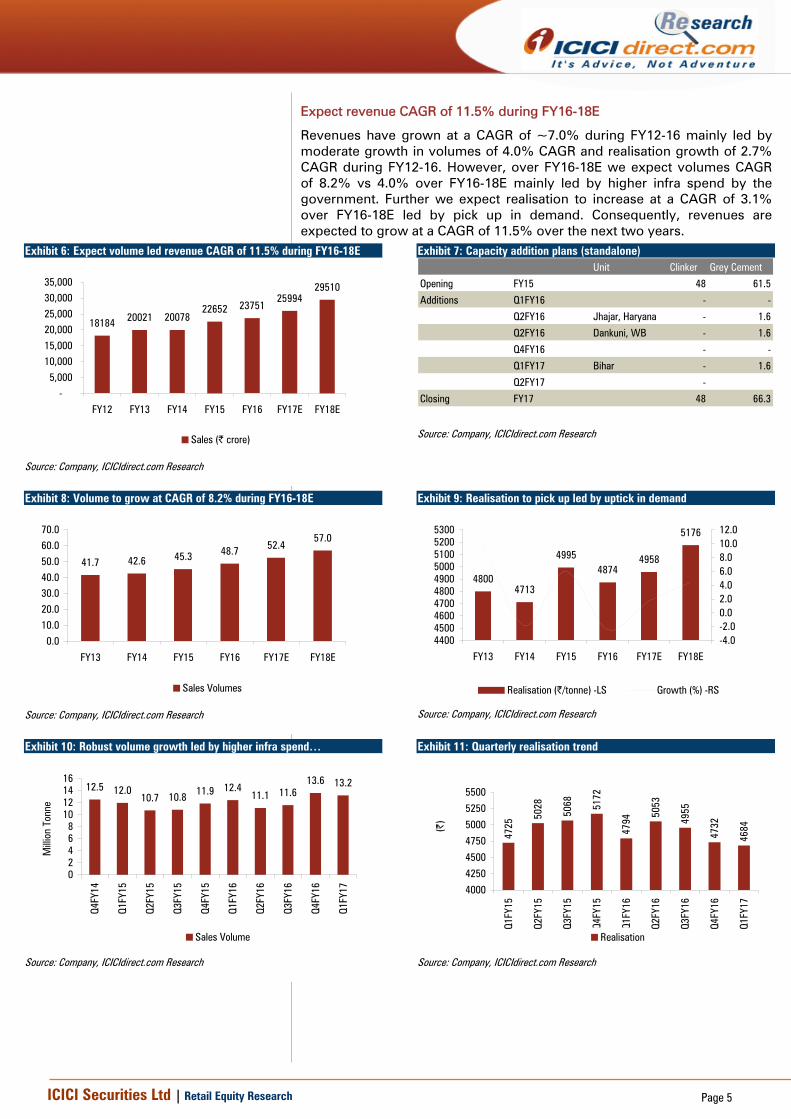
Expect revenue CAGR of 11.5% during FY16-18E
Revenues have grown at a CAGR of ~7.0% during FY12-16 mainly led by moderate growth in volumes of 4.0% CAGR and realisation growth of 2.7% CAGR during FY12-16. However, over FY16-18E we expect volumes CAGR of 8.2% vs 4.0% over FY16-18E mainly led by higher infra spend by the government. Further we expect realisation to increase at a CAGR of 3.1% over FY16-18E led by pick up in demand. Consequently, revenues are expected to grow at a CAGR of 11.5% over the next two years.
Exhibit 6: Expect volume led revenue CAGR of 11.5% during FY16-18E
18184 20021 2007822652 23751
2599429510
-5,000
10,00015,00020,00025,00030,00035,000
FY12 FY13 FY14 FY15 FY16 FY17E FY18E
Sales (| crore)
Source: Company, ICICIdirect.com Research
Exhibit 7: Capacity addition plans (standalone) Unit Clinker Grey Cement
Opening FY15 48 61.5
Additions Q1FY16 - -
Q2FY16 Jhajar, Haryana - 1.6
Q2FY16 Dankuni, WB - 1.6
Q4FY16 - -
Q1FY17 Bihar - 1.6
Q2FY17 -
Closing FY17 48 66.3
Source: Company, ICICIdirect.com Research
Exhibit 8: Volume to grow at CAGR of 8.2% during FY16-18E
41.7 42.6 45.3 48.7 52.457.0
0.010.020.030.040.050.060.070.0
FY13 FY14 FY15 FY16 FY17E FY18E
Sales Volumes
Source: Company, ICICIdirect.com Research
Exhibit 9: Realisation to pick up led by uptick in demand
48004713
49954874
4958
5176
4400450046004700480049005000510052005300
FY13 FY14 FY15 FY16 FY17E FY18E
-4.0-2.00.02.04.06.08.010.012.0
Realisation (|/tonne) -LS Growth (%) -RS
Source: Company, ICICIdirect.com Research
Exhibit 10: Robust volume growth led by higher infra spend…
12.5 12.010.7 10.8 11.9 12.4
11.1 11.613.6 13.2
02468
10121416
Q4FY
14
Q1FY
15
Q2FY
15
Q3FY
15
Q4FY
15
Q1FY
16
Q2FY
16
Q3FY
16
Q4FY
16
Q1FY
17
Milli
on T
onne
Sales Volume
Source: Company, ICICIdirect.com Research
Exhibit 11: Quarterly realisation trend
4725
5028
5068 51
72
4794
5053
4955
4732
4684
4000
4250
4500
4750
5000
5250
5500
Q1FY
15
Q2FY
15
Q3FY
15
Q4FY
15
Q1FY
16
Q2FY
16
Q3FY
16
Q4FY
16
Q1FY
17
(|)
Realisation
Source: Company, ICICIdirect.com Research
ICICI Securities Ltd | Retail Equity Research Page 6
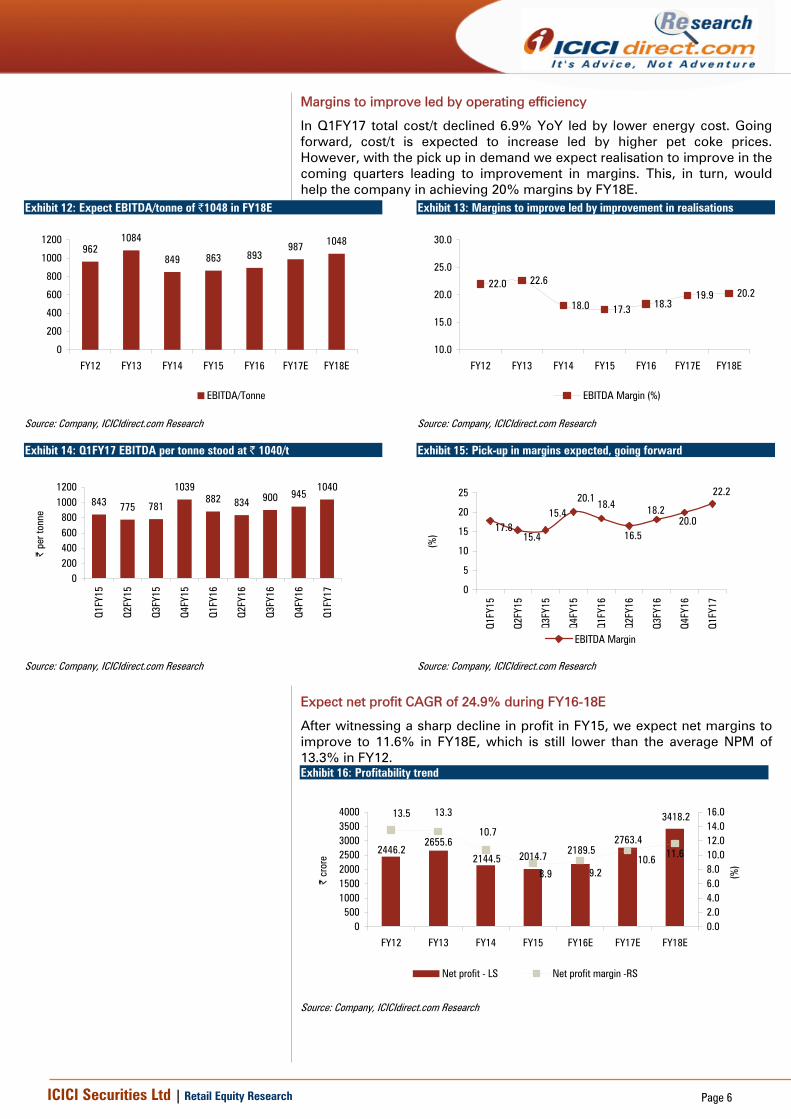
Margins to improve led by operating efficiency
In Q1FY17 total cost/t declined 6.9% YoY led by lower energy cost. Going forward, cost/t is expected to increase led by higher pet coke prices. However, with the pick up in demand we expect realisation to improve in the coming quarters leading to improvement in margins. This, in turn, would help the company in achieving 20% margins by FY18E.
Exhibit 12: Expect EBITDA/tonne of |1048 in FY18E
9621084
849 863 893987 1048
0
200
400
600
800
1000
1200
FY12 FY13 FY14 FY15 FY16 FY17E FY18E
EBITDA/Tonne
Source: Company, ICICIdirect.com Research
Exhibit 13: Margins to improve led by improvement in realisations
22.0 22.6
18.0 17.3 18.319.9 20.2
10.0
15.0
20.0
25.0
30.0
FY12 FY13 FY14 FY15 FY16 FY17E FY18E
EBITDA Margin (%)
Source: Company, ICICIdirect.com Research
Exhibit 14: Q1FY17 EBITDA per tonne stood at | 1040/t
843 775 781
1039882 834 900 945
1040
0200400600800
10001200
Q1FY
15
Q2FY
15
Q3FY
15
Q4FY
15
Q1FY
16
Q2FY
16
Q3FY
16
Q4FY
16
Q1FY
17
| pe
r ton
ne
Source: Company, ICICIdirect.com Research
Exhibit 15: Pick-up in margins expected, going forward
17.815.4
15.420.1 18.4
16.5
18.220.0
22.2
0
5
10
15
20
25Q1
FY15
Q2FY
15
Q3FY
15
Q4FY
15
Q1FY
16
Q2FY
16
Q3FY
16
Q4FY
16
Q1FY
17
(%)
EBITDA Margin
Source: Company, ICICIdirect.com Research
Expect net profit CAGR of 24.9% during FY16-18E
After witnessing a sharp decline in profit in FY15, we expect net margins to improve to 11.6% in FY18E, which is still lower than the average NPM of 13.3% in FY12. Exhibit 16: Profitability trend
2014.7
3418.2
2763.42189.52446.2
2655.6
2144.5 11.610.69.28.9
10.7
13.313.5
0500
1000150020002500300035004000
FY12 FY13 FY14 FY15 FY16E FY17E FY18E
| cr
ore
0.02.04.06.08.010.012.014.016.0
(%)
Net profit - LS Net profit margin -RS
Source: Company, ICICIdirect.com Research
ICICI Securities Ltd | Retail Equity Research Page 7
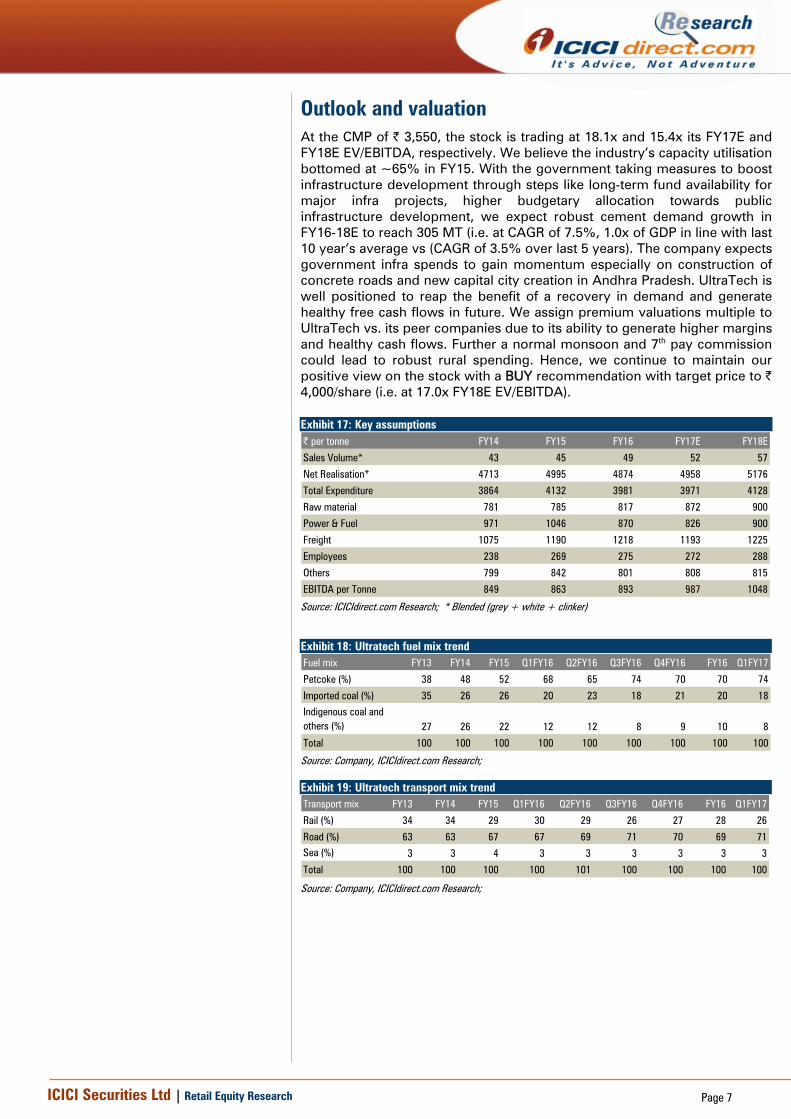
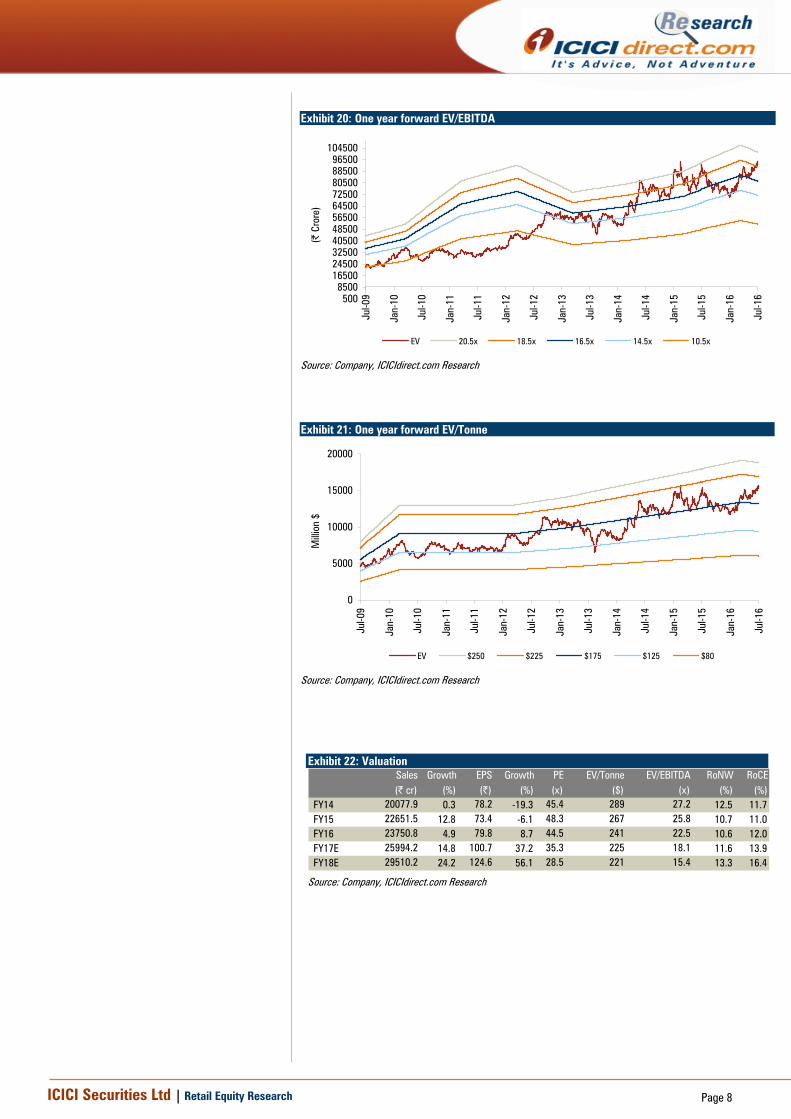
Outlook and valuation At the CMP of | 3,550, the stock is trading at 18.1x and 15.4x its FY17E and FY18E EV/EBITDA, respectively. We believe the industry’s capacity utilisation bottomed at ~65% in FY15. With the government taking measures to boost infrastructure development through steps like long-term fund availability for major infra projects, higher budgetary allocation towards public infrastructure development, we expect robust cement demand growth in FY16-18E to reach 305 MT (i.e. at CAGR of 7.5%, 1.0x of GDP in line with last 10 year’s average vs (CAGR of 3.5% over last 5 years). The company expects government infra spends to gain momentum especially on construction of concrete roads and new capital city creation in Andhra Pradesh. UltraTech is well positioned to reap the benefit of a recovery in demand and generate healthy free cash flows in future. We assign premium valuations multiple to UltraTech vs. its peer companies due to its ability to generate higher margins and healthy cash flows. Further a normal monsoon and 7th pay commission could lead to robust rural spending. Hence, we continue to maintain our positive view on the stock with a BUY recommendation with target price to | 4,000/share (i.e. at 17.0x FY18E EV/EBITDA).
Exhibit 17: Key assumptions | per tonne FY14 FY15 FY16 FY17E FY18E
Sales Volume* 43 45 49 52 57
Net Realisation* 4713 4995 4874 4958 5176
Total Expenditure 3864 4132 3981 3971 4128
Raw material 781 785 817 872 900
Power & Fuel 971 1046 870 826 900
Freight 1075 1190 1218 1193 1225
Employees 238 269 275 272 288
Others 799 842 801 808 815
EBITDA per Tonne 849 863 893 987 1048
Source: ICICIdirect.com Research; * Blended (grey + white + clinker)
Exhibit 18: Ultratech fuel mix trend Fuel mix FY13 FY14 FY15 Q1FY16 Q2FY16 Q3FY16 Q4FY16 FY16 Q1FY17
Petcoke (%) 38 48 52 68 65 74 70 70 74
Imported coal (%) 35 26 26 20 23 18 21 20 18
Indigenous coal and others (%) 27 26 22 12 12 8 9 10 8
Total 100 100 100 100 100 100 100 100 100
Source: Company, ICICIdirect.com Research;
Exhibit 19: Ultratech transport mix trend Transport mix FY13 FY14 FY15 Q1FY16 Q2FY16 Q3FY16 Q4FY16 FY16 Q1FY17
Rail (%) 34 34 29 30 29 26 27 28 26
Road (%) 63 63 67 67 69 71 70 69 71Sea (%) 3 3 4 3 3 3 3 3 3
Total 100 100 100 100 101 100 100 100 100
Source: Company, ICICIdirect.com Research;
ICICI Securities Ltd | Retail Equity Research Page 8
Exhibit 20: One year forward EV/EBITDA
5008500
1650024500325004050048500565006450072500805008850096500
104500
Jul-0
9
Jan-
10
Jul-1
0
Jan-
11
Jul-1
1
Jan-
12
Jul-1
2
Jan-
13
Jul-1
3
Jan-
14
Jul-1
4
Jan-
15
Jul-1
5
Jan-
16
Jul-1
6
(| C
rore
)
EV 20.5x 18.5x 16.5x 14.5x 10.5x
Source: Company, ICICIdirect.com Research
Exhibit 21: One year forward EV/Tonne
0
5000
10000
15000
20000
Jul-0
9
Jan-
10
Jul-1
0
Jan-
11
Jul-1
1
Jan-
12
Jul-1
2
Jan-
13
Jul-1
3
Jan-
14
Jul-1
4
Jan-
15
Jul-1
5
Jan-
16
Jul-1
6
Milli
on $
EV $250 $225 $175 $125 $80
Source: Company, ICICIdirect.com Research
Exhibit 22: Valuation Sales Growth EPS Growth PE EV/Tonne EV/EBITDA RoNW RoCE (| cr) (%) (|) (%) (x) ($) (x) (%) (%)
FY14 20077.9 0.3 78.2 -19.3 45.4 289 27.2 12.5 11.7FY15 22651.5 12.8 73.4 -6.1 48.3 267 25.8 10.7 11.0FY16 23750.8 4.9 79.8 8.7 44.5 241 22.5 10.6 12.0FY17E 25994.2 14.8 100.7 37.2 35.3 225 18.1 11.6 13.9FY18E 29510.2 24.2 124.6 56.1 28.5 221 15.4 13.3 16.4
Source: Company, ICICIdirect.com Research
ICICI Securities Ltd | Retail Equity Research Page 9
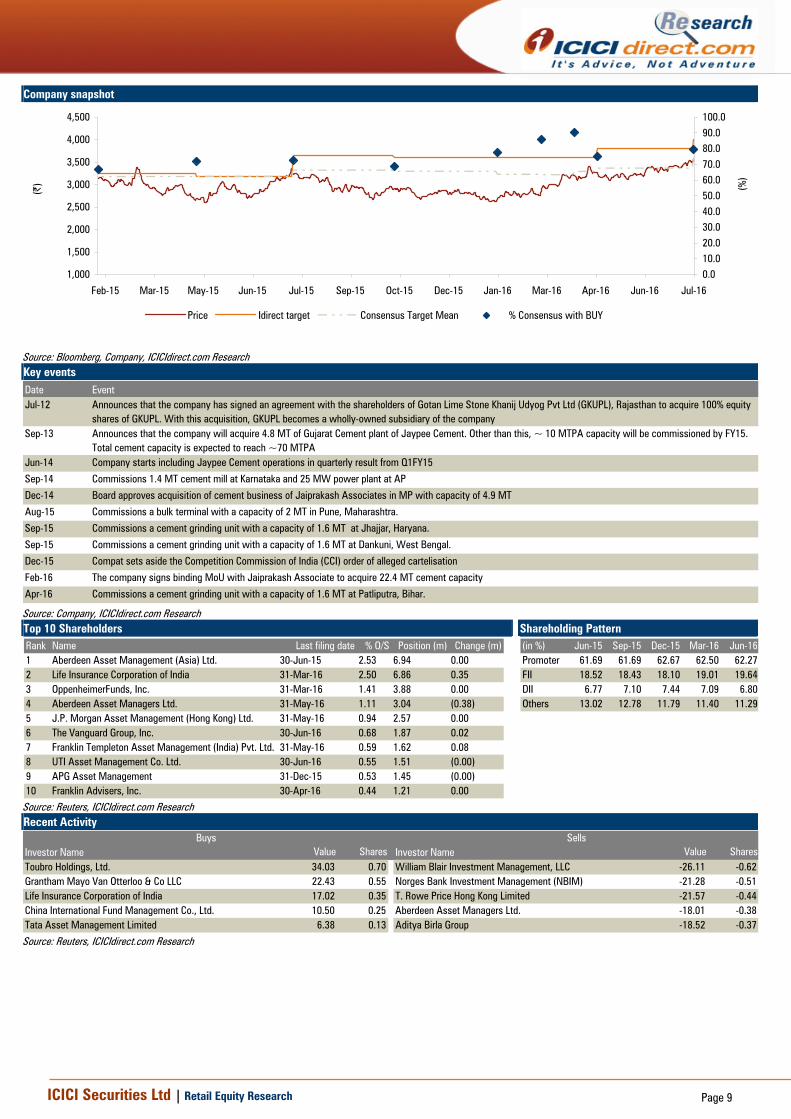
Company snapshot
1,000
1,500
2,000
2,500
3,000
3,500
4,000
4,500
Jul-16Jun-16Apr-16Mar-16Jan-16Dec-15Oct-15Sep-15Jul-15Jun-15May-15Mar-15Feb-15
(|)
0.010.020.030.040.050.060.070.080.090.0100.0
(%)
Price Idirect target Consensus Target Mean % Consensus with BUY
Source: Bloomberg, Company, ICICIdirect.com Research Key events Date EventJul-12 Announces that the company has signed an agreement with the shareholders of Gotan Lime Stone Khanij Udyog Pvt Ltd (GKUPL), Rajasthan to acquire 100% equity
shares of GKUPL. With this acquisition, GKUPL becomes a wholly-owned subsidiary of the companySep-13 Announces that the company will acquire 4.8 MT of Gujarat Cement plant of Jaypee Cement. Other than this, ~ 10 MTPA capacity will be commissioned by FY15.
Total cement capacity is expected to reach ~70 MTPAJun-14 Company starts including Jaypee Cement operations in quarterly result from Q1FY15
Sep-14 Commissions 1.4 MT cement mill at Karnataka and 25 MW power plant at AP
Dec-14 Board approves acquisition of cement business of Jaiprakash Associates in MP with capacity of 4.9 MT
Aug-15 Commissions a bulk terminal with a capacity of 2 MT in Pune, Maharashtra.
Sep-15 Commissions a cement grinding unit with a capacity of 1.6 MT at Jhajjar, Haryana.
Sep-15 Commissions a cement grinding unit with a capacity of 1.6 MT at Dankuni, West Bengal.
Dec-15 Compat sets aside the Competition Commission of India (CCI) order of alleged cartelisation
Feb-16 The company signs binding MoU with Jaiprakash Associate to acquire 22.4 MT cement capacity
Apr-16 Commissions a cement grinding unit with a capacity of 1.6 MT at Patliputra, Bihar.
Source: Company, ICICIdirect.com Research Top 10 Shareholders Shareholding Pattern Rank Name Last filing date % O/S Position (m) Change (m)1 Aberdeen Asset Management (Asia) Ltd. 30-Jun-15 2.53 6.94 0.002 Life Insurance Corporation of India 31-Mar-16 2.50 6.86 0.353 OppenheimerFunds, Inc. 31-Mar-16 1.41 3.88 0.004 Aberdeen Asset Managers Ltd. 31-May-16 1.11 3.04 (0.38)5 J.P. Morgan Asset Management (Hong Kong) Ltd. 31-May-16 0.94 2.57 0.006 The Vanguard Group, Inc. 30-Jun-16 0.68 1.87 0.027 Franklin Templeton Asset Management (India) Pvt. Ltd. 31-May-16 0.59 1.62 0.088 UTI Asset Management Co. Ltd. 30-Jun-16 0.55 1.51 (0.00)9 APG Asset Management 31-Dec-15 0.53 1.45 (0.00)10 Franklin Advisers, Inc. 30-Apr-16 0.44 1.21 0.00
(in %) Jun-15 Sep-15 Dec-15 Mar-16 Jun-16Promoter 61.69 61.69 62.67 62.50 62.27FII 18.52 18.43 18.10 19.01 19.64DII 6.77 7.10 7.44 7.09 6.80Others 13.02 12.78 11.79 11.40 11.29
Source: Reuters, ICICIdirect.com Research Recent Activity
Investor Name Value Shares Investor Name Value SharesToubro Holdings, Ltd. 34.03 0.70 William Blair Investment Management, LLC -26.11 -0.62Grantham Mayo Van Otterloo & Co LLC 22.43 0.55 Norges Bank Investment Management (NBIM) -21.28 -0.51Life Insurance Corporation of India 17.02 0.35 T. Rowe Price Hong Kong Limited -21.57 -0.44China International Fund Management Co., Ltd. 10.50 0.25 Aberdeen Asset Managers Ltd. -18.01 -0.38Tata Asset Management Limited 6.38 0.13 Aditya Birla Group -18.52 -0.37
Buys Sells
Source: Reuters, ICICIdirect.com Research
ICICI Securities Ltd | Retail Equity Research Page 10
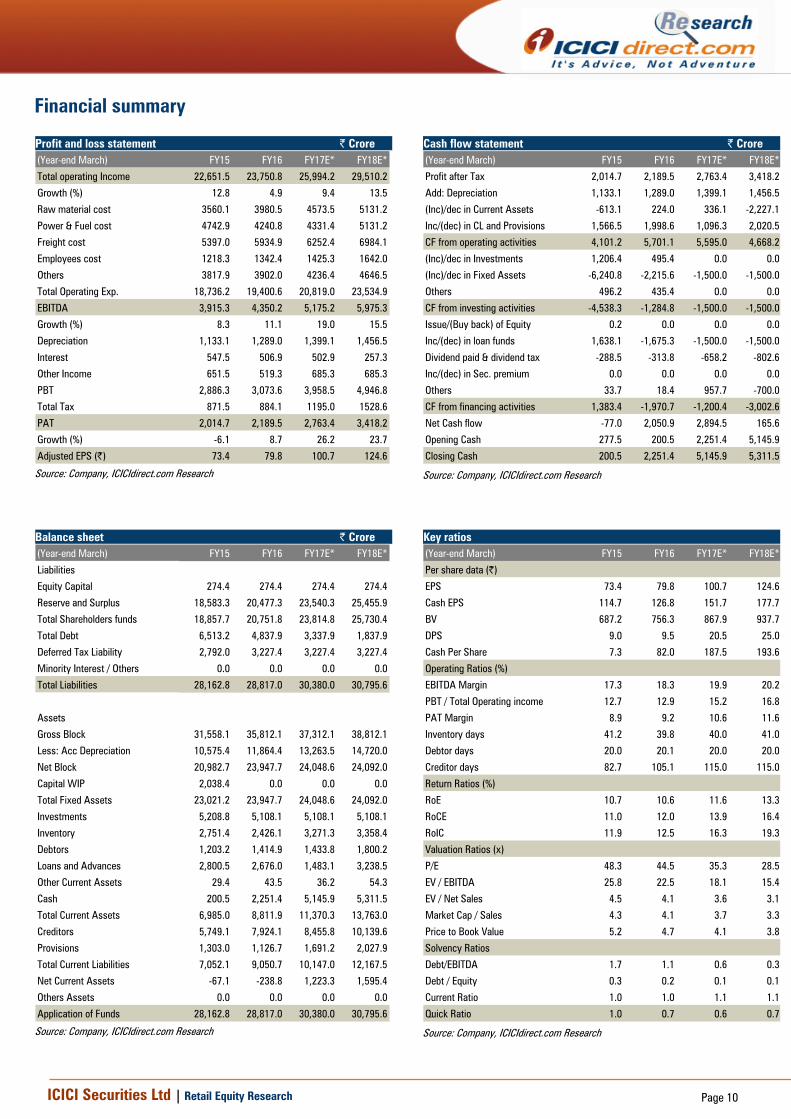
Financial summary Profit and loss statement | Crore (Year-end March) FY15 FY16 FY17E* FY18E*
Total operating Income 22,651.5 23,750.8 25,994.2 29,510.2
Growth (%) 12.8 4.9 9.4 13.5
Raw material cost 3560.1 3980.5 4573.5 5131.2
Power & Fuel cost 4742.9 4240.8 4331.4 5131.2
Freight cost 5397.0 5934.9 6252.4 6984.1
Employees cost 1218.3 1342.4 1425.3 1642.0
Others 3817.9 3902.0 4236.4 4646.5
Total Operating Exp. 18,736.2 19,400.6 20,819.0 23,534.9
EBITDA 3,915.3 4,350.2 5,175.2 5,975.3
Growth (%) 8.3 11.1 19.0 15.5
Depreciation 1,133.1 1,289.0 1,399.1 1,456.5
Interest 547.5 506.9 502.9 257.3
Other Income 651.5 519.3 685.3 685.3
PBT 2,886.3 3,073.6 3,958.5 4,946.8
Total Tax 871.5 884.1 1195.0 1528.6
PAT 2,014.7 2,189.5 2,763.4 3,418.2
Growth (%) -6.1 8.7 26.2 23.7
Adjusted EPS (|) 73.4 79.8 100.7 124.6
Source: Company, ICICIdirect.com Research
Cash flow statement | Crore (Year-end March) FY15 FY16 FY17E* FY18E*
Profit after Tax 2,014.7 2,189.5 2,763.4 3,418.2
Add: Depreciation 1,133.1 1,289.0 1,399.1 1,456.5
(Inc)/dec in Current Assets -613.1 224.0 336.1 -2,227.1
Inc/(dec) in CL and Provisions 1,566.5 1,998.6 1,096.3 2,020.5
CF from operating activities 4,101.2 5,701.1 5,595.0 4,668.2
(Inc)/dec in Investments 1,206.4 495.4 0.0 0.0
(Inc)/dec in Fixed Assets -6,240.8 -2,215.6 -1,500.0 -1,500.0
Others 496.2 435.4 0.0 0.0
CF from investing activities -4,538.3 -1,284.8 -1,500.0 -1,500.0
Issue/(Buy back) of Equity 0.2 0.0 0.0 0.0
Inc/(dec) in loan funds 1,638.1 -1,675.3 -1,500.0 -1,500.0
Dividend paid & dividend tax -288.5 -313.8 -658.2 -802.6
Inc/(dec) in Sec. premium 0.0 0.0 0.0 0.0
Others 33.7 18.4 957.7 -700.0
CF from financing activities 1,383.4 -1,970.7 -1,200.4 -3,002.6
Net Cash flow -77.0 2,050.9 2,894.5 165.6
Opening Cash 277.5 200.5 2,251.4 5,145.9
Closing Cash 200.5 2,251.4 5,145.9 5,311.5
Source: Company, ICICIdirect.com Research
Balance sheet | Crore (Year-end March) FY15 FY16 FY17E* FY18E*
Liabilities
Equity Capital 274.4 274.4 274.4 274.4
Reserve and Surplus 18,583.3 20,477.3 23,540.3 25,455.9
Total Shareholders funds 18,857.7 20,751.8 23,814.8 25,730.4
Total Debt 6,513.2 4,837.9 3,337.9 1,837.9
Deferred Tax Liability 2,792.0 3,227.4 3,227.4 3,227.4
Minority Interest / Others 0.0 0.0 0.0 0.0
Total Liabilities 28,162.8 28,817.0 30,380.0 30,795.6
Assets
Gross Block 31,558.1 35,812.1 37,312.1 38,812.1
Less: Acc Depreciation 10,575.4 11,864.4 13,263.5 14,720.0
Net Block 20,982.7 23,947.7 24,048.6 24,092.0
Capital WIP 2,038.4 0.0 0.0 0.0
Total Fixed Assets 23,021.2 23,947.7 24,048.6 24,092.0
Investments 5,208.8 5,108.1 5,108.1 5,108.1
Inventory 2,751.4 2,426.1 3,271.3 3,358.4
Debtors 1,203.2 1,414.9 1,433.8 1,800.2
Loans and Advances 2,800.5 2,676.0 1,483.1 3,238.5
Other Current Assets 29.4 43.5 36.2 54.3
Cash 200.5 2,251.4 5,145.9 5,311.5
Total Current Assets 6,985.0 8,811.9 11,370.3 13,763.0
Creditors 5,749.1 7,924.1 8,455.8 10,139.6
Provisions 1,303.0 1,126.7 1,691.2 2,027.9
Total Current Liabilities 7,052.1 9,050.7 10,147.0 12,167.5
Net Current Assets -67.1 -238.8 1,223.3 1,595.4
Others Assets 0.0 0.0 0.0 0.0
Application of Funds 28,162.8 28,817.0 30,380.0 30,795.6
Source: Company, ICICIdirect.com Research
Key ratios (Year-end March) FY15 FY16 FY17E* FY18E*
Per share data (|)
EPS 73.4 79.8 100.7 124.6
Cash EPS 114.7 126.8 151.7 177.7
BV 687.2 756.3 867.9 937.7
DPS 9.0 9.5 20.5 25.0
Cash Per Share 7.3 82.0 187.5 193.6
Operating Ratios (%)
EBITDA Margin 17.3 18.3 19.9 20.2
PBT / Total Operating income 12.7 12.9 15.2 16.8
PAT Margin 8.9 9.2 10.6 11.6
Inventory days 41.2 39.8 40.0 41.0
Debtor days 20.0 20.1 20.0 20.0
Creditor days 82.7 105.1 115.0 115.0
Return Ratios (%)
RoE 10.7 10.6 11.6 13.3
RoCE 11.0 12.0 13.9 16.4
RoIC 11.9 12.5 16.3 19.3
Valuation Ratios (x)
P/E 48.3 44.5 35.3 28.5
EV / EBITDA 25.8 22.5 18.1 15.4
EV / Net Sales 4.5 4.1 3.6 3.1
Market Cap / Sales 4.3 4.1 3.7 3.3
Price to Book Value 5.2 4.7 4.1 3.8
Solvency Ratios
Debt/EBITDA 1.7 1.1 0.6 0.3
Debt / Equity 0.3 0.2 0.1 0.1
Current Ratio 1.0 1.0 1.1 1.1
Quick Ratio 1.0 0.7 0.6 0.7
Source: Company, ICICIdirect.com Research
ICICI Securities Ltd | Retail Equity Research Page 11
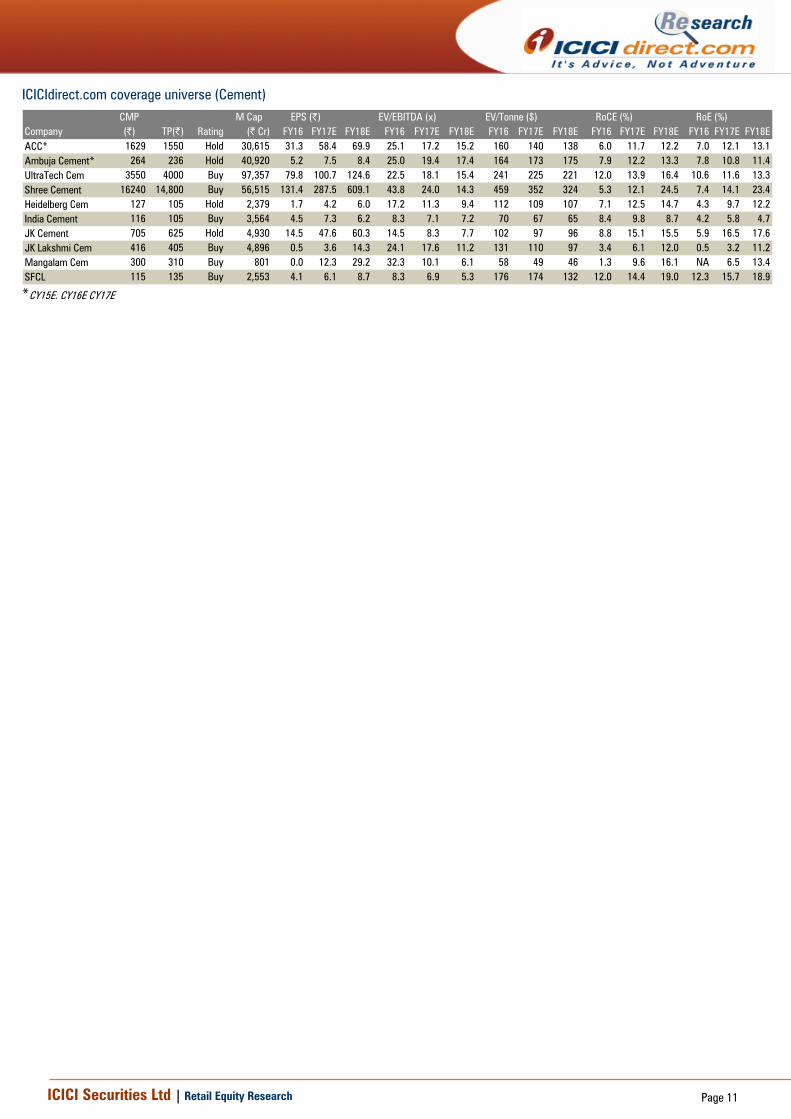
ICICIdirect.com coverage universe (Cement)
CMP M Cap(|) TP(|) Rating (| Cr) FY16 FY17E FY18E FY16 FY17E FY18E FY16 FY17E FY18E FY16 FY17E FY18E FY16 FY17E FY18E
ACC* 1629 1550 Hold 30,615 31.3 58.4 69.9 25.1 17.2 15.2 160 140 138 6.0 11.7 12.2 7.0 12.1 13.1Ambuja Cement* 264 236 Hold 40,920 5.2 7.5 8.4 25.0 19.4 17.4 164 173 175 7.9 12.2 13.3 7.8 10.8 11.4UltraTech Cem 3550 4000 Buy 97,357 79.8 100.7 124.6 22.5 18.1 15.4 241 225 221 12.0 13.9 16.4 10.6 11.6 13.3Shree Cement 16240 14,800 Buy 56,515 131.4 287.5 609.1 43.8 24.0 14.3 459 352 324 5.3 12.1 24.5 7.4 14.1 23.4Heidelberg Cem 127 105 Hold 2,379 1.7 4.2 6.0 17.2 11.3 9.4 112 109 107 7.1 12.5 14.7 4.3 9.7 12.2India Cement 116 105 Buy 3,564 4.5 7.3 6.2 8.3 7.1 7.2 70 67 65 8.4 9.8 8.7 4.2 5.8 4.7JK Cement 705 625 Hold 4,930 14.5 47.6 60.3 14.5 8.3 7.7 102 97 96 8.8 15.1 15.5 5.9 16.5 17.6JK Lakshmi Cem 416 405 Buy 4,896 0.5 3.6 14.3 24.1 17.6 11.2 131 110 97 3.4 6.1 12.0 0.5 3.2 11.2Mangalam Cem 300 310 Buy 801 0.0 12.3 29.2 32.3 10.1 6.1 58 49 46 1.3 9.6 16.1 NA 6.5 13.4SFCL 115 135 Buy 2,553 4.1 6.1 8.7 8.3 6.9 5.3 176 174 132 12.0 14.4 19.0 12.3 15.7 18.9
RoCE (%) RoE (%)Company
EPS (|) EV/Tonne ($)EV/EBITDA (x)
*CY15E, CY16E CY17E
ICICI Securities Ltd | Retail Equity Research Page 12
RATING RATIONALE ICICIdirect.com endeavours to provide objective opinions and recommendations. ICICIdirect.com assigns ratings to its stocks according to their notional target price vs. current market price and then categorises them as Strong Buy, Buy, Hold and Sell. The performance horizon is two years unless specified and the notional target price is defined as the analysts' valuation for a stock. Strong Buy: >15%/20% for large caps/midcaps, respectively, with high conviction; Buy: >10%/15% for large caps/midcaps, respectively; Hold: Up to +/-10%; Sell: -10% or more;
Pankaj Pandey Head – Research [email protected]
ICICIdirect.com Research Desk, ICICI Securities Limited, 1st Floor, Akruti Trade Centre, Road No 7, MIDC, Andheri (East) Mumbai – 400 093
ICICI Securities Ltd | Retail Equity Research Page 13
ANALYST CERTIFICATION We /I, Rashesh Shah, CA, and Devang Bhatt, PGDBM Research Analysts, authors and the names subscribed to this report, hereby certify that all of the views expressed in this research report accurately reflect our views about the subject issuer(s) or securities. We also certify that no part of our compensation was, is, or will be directly or indirectly related to the specific recommendation(s) or view(s) in this report.
Terms & conditions and other disclosures: ICICI Securities Limited (ICICI Securities) is a SEBI registered Research Analyst having registration no. INH000000990.ICICI Securities Limited (ICICI Securities) is a full-service, integrated investment banking and is, inter alia, engaged in the business of stock brokering and distribution of financial products. ICICI Securities is a wholly-owned subsidiary of ICICI Bank which is India’s largest private sector bank and has its various subsidiaries engaged in businesses of housing finance, asset management, life insurance, general insurance, venture capital fund management, etc. (“associates”), the details in respect of which are available on www.icicibank.com. ICICI Securities is one of the leading merchant bankers/ underwriters of securities and participate in virtually all securities trading markets in India. We and our associates might have investment banking and other business relationship with a significant percentage of companies covered by our Investment Research Department. ICICI Securities generally prohibits its analysts, persons reporting to analysts and their relatives from maintaining a financial interest in the securities or derivatives of any companies that the analysts cover. The information and opinions in this report have been prepared by ICICI Securities and are subject to change without any notice. The report and information contained herein is strictly confidential and meant solely for the selected recipient and may not be altered in any way, transmitted to, copied or distributed, in part or in whole, to any other person or to the media or reproduced in any form, without prior written consent of ICICI Securities. While we would endeavour to update the information herein on a reasonable basis, ICICI Securities is under no obligation to update or keep the information current. Also, there may be regulatory, compliance or other reasons that may prevent ICICI Securities from doing so. Non-rated securities indicate that rating on a particular security has been suspended temporarily and such suspension is in compliance with applicable regulations and/or ICICI Securities policies, in circumstances where ICICI Securities might be acting in an advisory capacity to this company, or in certain other circumstances. This report is based on information obtained from public sources and sources believed to be reliable, but no independent verification has been made nor is its accuracy or completeness guaranteed. This report and information herein is solely for informational purpose and shall not be used or considered as an offer document or solicitation of offer to buy or sell or subscribe for securities or other financial instruments. Though disseminated to all the customers simultaneously, not all customers may receive this report at the same time. ICICI Securities will not treat recipients as customers by virtue of their receiving this report. Nothing in this report constitutes investment, legal, accounting and tax advice or a representation that any investment or strategy is suitable or appropriate to your specific circumstances. The securities discussed and opinions expressed in this report may not be suitable for all investors, who must make their own investment decisions, based on their own investment objectives, financial positions and needs of specific recipient. This may not be taken in substitution for the exercise of independent judgment by any recipient. The recipient should independently evaluate the investment risks. The value and return on investment may vary because of changes in interest rates, foreign exchange rates or any other reason. ICICI Securities accepts no liabilities whatsoever for any loss or damage of any kind arising out of the use of this report. Past performance is not necessarily a guide to future performance. Investors are advised to see Risk Disclosure Document to understand the risks associated before investing in the securities markets. Actual results may differ materially from those set forth in projections. Forward-looking statements are not predictions and may be subject to change without notice. ICICI Securities or its associates might have managed or co-managed public offering of securities for the subject company or might have been mandated by the subject company for any other assignment in the past twelve months. ICICI Securities or its associates might have received any compensation from the companies mentioned in the report during the period preceding twelve months from the date of this report for services in respect of managing or co-managing public offerings, corporate finance, investment banking or merchant banking, brokerage services or other advisory service in a merger or specific transaction. ICICI Securities or its associates might have received any compensation for products or services other than investment banking or merchant banking or brokerage services from the companies mentioned in the report in the past twelve months. ICICI Securities encourages independence in research report preparation and strives to minimize conflict in preparation of research report. ICICI Securities or its analysts did not receive any compensation or other benefits from the companies mentioned in the report or third party in connection with preparation of the research report. Accordingly, neither ICICI Securities nor Research Analysts have any material conflict of interest at the time of publication of this report. It is confirmed that Rashesh Shah, CA, and Devang Bhatt, PGDBM, Research Analysts of this report have not received any compensation from the companies mentioned in the report in the preceding twelve months. Compensation of our Research Analysts is not based on any specific merchant banking, investment banking or brokerage service transactions. ICICI Securities or its subsidiaries collectively or Research Analysts do not own 1% or more of the equity securities of the Company mentioned in the report as of the last day of the month preceding the publication of the research report. Since associates of ICICI Securities are engaged in various financial service businesses, they might have financial interests or beneficial ownership in various companies including the subject company/companies mentioned in this report. It is confirmed that Rashesh Shah, CA, and Devang Bhatt, PGDBM, Research Analysts do not serve as an officer, director or employee of the companies mentioned in the report. ICICI Securities may have issued other reports that are inconsistent with and reach different conclusion from the information presented in this report. Neither the Research Analysts nor ICICI Securities have been engaged in market making activity for the companies mentioned in the report. We submit that no material disciplinary action has been taken on ICICI Securities by any Regulatory Authority impacting Equity Research Analysis activities. This report is not directed or intended for distribution to, or use by, any person or entity who is a citizen or resident of or located in any locality, state, country or other jurisdiction, where such distribution, publication, availability or use would be contrary to law, regulation or which would subject ICICI Securities and affiliates to any registration or licensing requirement within such jurisdiction. The securities described herein may or may not be eligible for sale in all jurisdictions or to certain category of investors. Persons in whose possession this document may come are required to inform themselves of and to observe such restriction.