Embed Size (px)
Citation preview

March 2012March 2012
All data and design concepts property of Baseball Info Solutions. No part of this material or the accompanying data may be reproduced or distributed without the expressed consent of Baseball Info Solutions.
© 2012 Baseball Info Solutions
Does the Ted Williams Shift Work?

Tampa Bay Rays
Best Defensive Team of 2011
Team Defensive Runs Saved
Tampa Bay Rays 85
Arizona Diamondbacks 54
San Diego Padres 46
Cincinnati Reds 44
Colorado Rockies 34

Top Shifting Teams
Rays also most aggressive with shifts
Team Shifts
Tampa Bay Rays 216
Milwaukee Brewers 170
Cleveland Indians 148
Toronto Blue Jays 117
Three Teams Tied 75
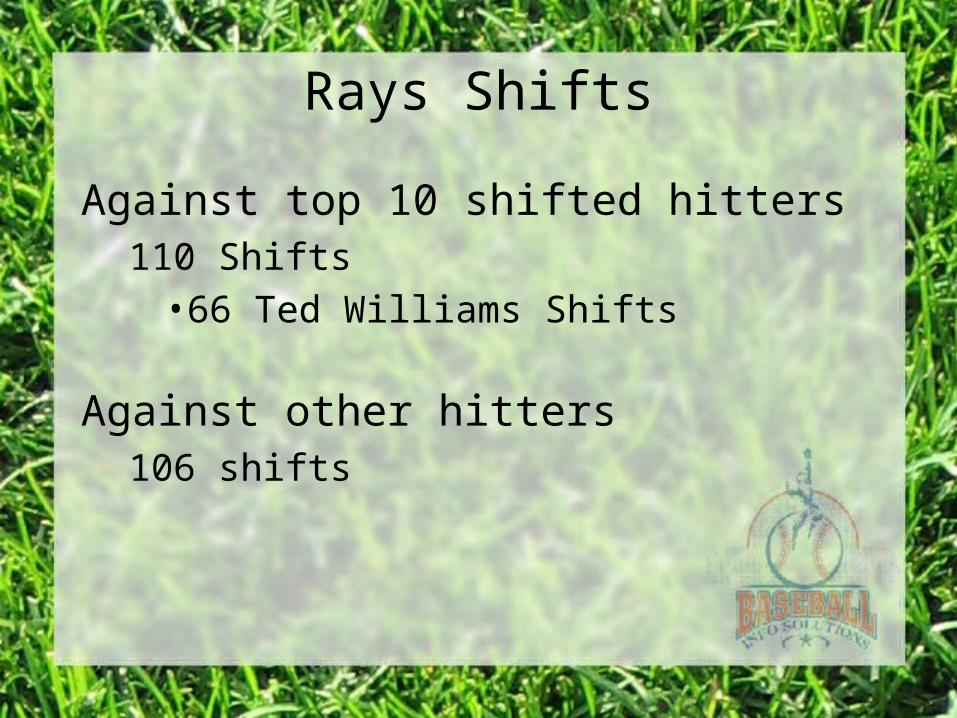
Rays Shifts
Against top 10 shifted hitters110 Shifts•66 Ted Williams Shifts
Against other hitters106 shifts

Is it a coincidence?

Brewers Infield- 2011
Prince Fielder -17 Runs Saved in 2010 (35th of 35 1B)
Rickie Weeks-16 Runs Saved in 2010 (34th of 35 2B)
Yuniesky Betancourt-27 Runs Saved in 2010 (35th of 35 SS)
Casey McGehee-14 Runs Saved in 2010 (T-31st of 35 3B)

Ron Roenicke & The Shift
Against top 10 shifted hitters45 Shifts•25 Ted Williams Shifts
Against other hitters125 shifts
Only 22 shifts in all of 2010, least in MLB
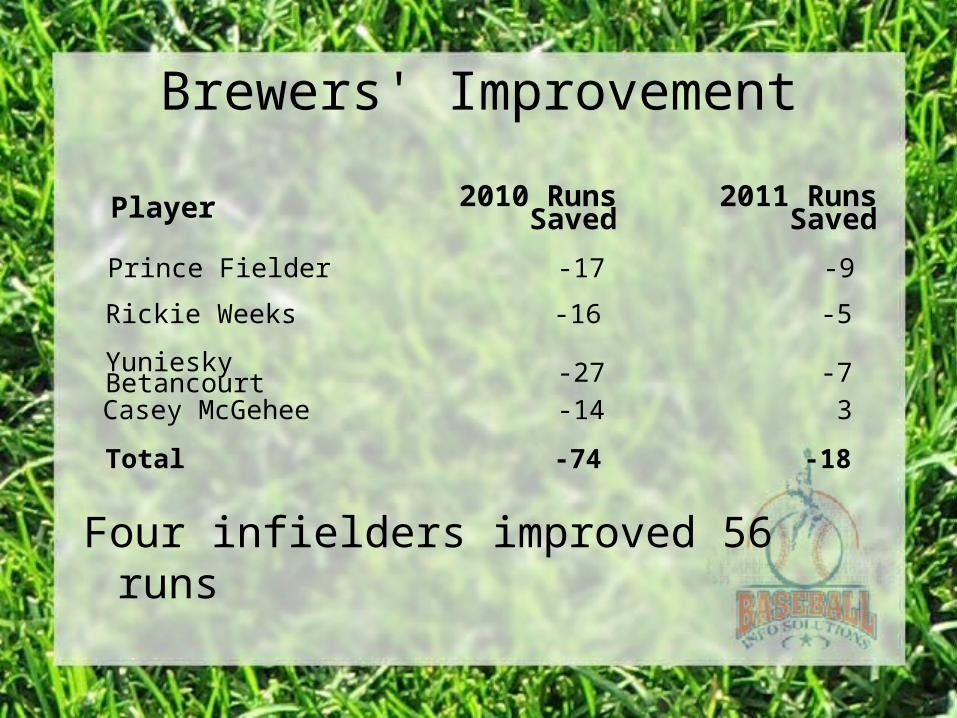
Brewers' Improvement
Four infielders improved 56 runs
Player 2010 Runs Saved 2011 Runs Saved
Prince Fielder -17 -9
Rickie Weeks -16 -5
Yuniesky Betancourt -27 -7
Casey McGehee -14 3
Total -74 -18

Is it a coincidence?

Origin of the Ted Williams Shift

All Shifts vs. “The Shift”
• The Ted Williams Shift
• Other Shifts

Top Ten Shifted HittersHitter All Shifts (2010-11)
David Ortiz 486
Ryan Howard 461
Carlos Pena 314
Adam Dunn 305
Prince Fielder 253
Jim Thome 223
Adrian Gonzalez 205
Mark Teixeira 180
Brian McCann 118
Jack Cust 115

Pena and McCann vs. The Shift
Hitter Ted Williams Shift On
No Ted Williams Shift
Shift Bunt Hits
Carlos Pena .243 .191 11
Brian McCann .321 .250 4
Weighted Average .266 .208
Batting Average On Grounders, Short Liners & Bunts
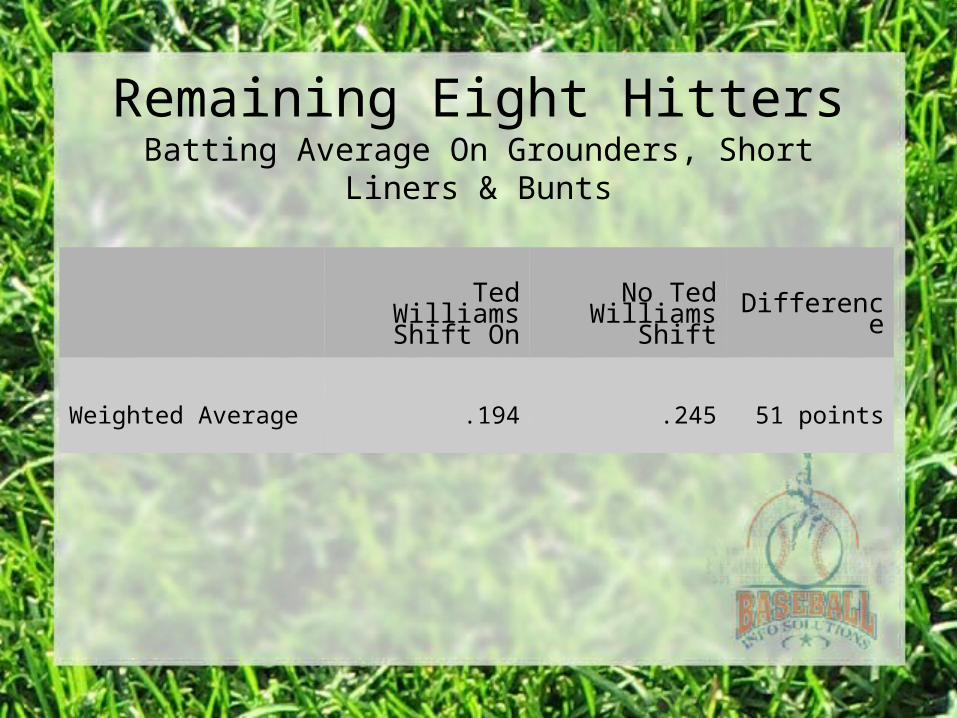
Remaining Eight Hitters
Ted Williams Shift On
No Ted Williams Shift Difference
Weighted Average .194 .245 51 points
Batting Average On Grounders, Short Liners & Bunts

Bases Empty/Runners On
Ted Williams Shift On
No Ted Williams Shift Difference
Bases Empty .194 .232 38 points
Runners On .208 .251 43 points
Batting Average On Grounders, Short Liners & Bunts

Ryan Howard in BIS-DLast 120 grounders and short liners
Shift Candidate (89% right of 2B)
0 bunt attempts in last 464 plate appearances

Alex Gordon in BIS-DLast 120 grounders and short liners
Shift Candidate (84% right of 2B)
0 bunt attempts in last 415 plate appearances

Dan Uggla in BIS-DLast 120 grounders and short liners
Shift Candidate (91% left of 2B)
0 bunt attempts in last 314 plate appearances

The Shift
48 LHB recommended for the shift by BIS-D
56 RHB recommended for the shift by BIS-D (including 16 who pull over 90 percent of grounders and short liners)
MLB Teams Should Shift More Often

Beyond Ted Williams
Less dramatic positioning for every hitter

Beyond Ted Williams
• Consider Pitch Type, Count, and Pitch Location
• Are there situations where average hitters exhibit extreme groundball pull tendencies?
• Are there situations where heavy pull hitters should NOT be shifted?

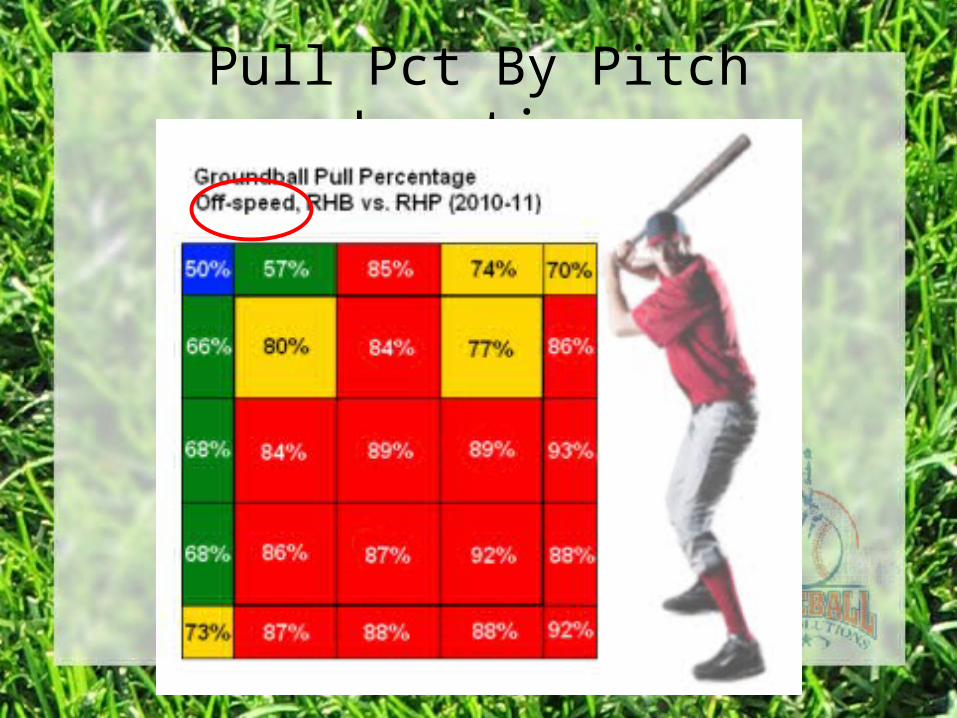
Pull Pct By Pitch Type
Average RHB pulls under 68% of cutters and 72% of fastballs
Pulls over 83% of curves, splitters, and changeups

Pull Pct By Count
Average RHB pulls 58% of GB in 0-2 counts vs. RHP
Pulls over 80% when ahead 3-0 or 3-1

Pull Pct By Pitch Location
Pull Pct By Pitch Location

Shift Candidates

Shift Candidates

Conclusions
Average hitter pulls off-speed pitches, ahead in the count, and/or down and in
LHB Shift Candidates pull almost everything except when behind in the count 0-2 and 1-2

March 2012March 2012
All data and design concepts property of Baseball Info Solutions. No part of this material or the accompanying data may be reproduced or distributed without the expressed consent of Baseball Info Solutions.
© 2012 Baseball Info Solutions
Does the Ted Williams Shift Work?