Embed Size (px)
Citation preview

i
Faculty of Engineering
Urban Planning and Design Master Program UPLD
Managing Urban Growth by Using a GIS-based Multi Criteria Analysis:
A Case Study from Ramallah-Al Bireh Governorate, Palestine
Master Thesis Submitted By:
Jumana Jamil Abu Sada
Supervision
Dr Salem Thawaba
2009

ii
Faculty of Engineering
Urban Planning and Design Master Program UPLD
Managing Urban Growth by Using a GIS-based Multi Criteria Analysis:
A Case Study from Ramallah-Al Bireh Governorate, Palestine
Master Thesis Submitted By:
Jumana Jamil Abu Sada
Supervision
Dr Salem Thawaba
Submitted in Partial Fulfillment of the Requirements for the Master Degree in Urban Planning and Design from the Faculty of Graduate Studies, at Birzeit University- Palestine
2009

iii
Managing Urban Growth by Using a GIS-based Multi Criteria Analysis:
A Case Study from Ramallah- Al Bireh Governorate, Palestine
Submitted By
Jumana Jamil Abu Sada
This Thesis was defended in 29 October 2009
Defense Committee
Dr Salem Thawaba (Supervisor) ____________________________________
Dr Ali Abdul Hamid (Committee Member) ___________________________
Dr Jamal Amro (Committee Member) ________________________________

iv
ملخص
٪ من 65أآثر من إن. صالموارد تتناقفيه أصبحت الذي الوقت فييشهد العالم اليوم نموا حضريا متسارعا،
مناطق حضريةمن يقطنون في أآبر بكثير من نسبة فلسطين نسبتهم في فباتت ،مناطق حضريةفي ونيعيش الفلسطينيين
من أآثر المحافظات تزايدا في محافظة رام االله والبيرة تعد. %50أآثر من إلى 2008في العام وصلتفي العالم والتي
مناسبلو الحاجة إلى توفير السكن ا عملال فرص توفر على الخدمات و اآبير اا النمو ضغطهذ صاحبوقد النمو الحضري
.ومدن وقرى ومخيمات الضفة الغربية مختلف محافظات من إليها القادمينلجميع الناس
حدود ضمن للتطور الحضريإن الهدف من هذا البحث هو إيجاد طريقة علمية تساعد في تحديد الأماآن الأآثر ملائمة
في نطاق تخفيف الضغط عن مراآز المدن إلىتهدف هذه المناطق . محافظة رام االله والبيرة وقابلة للتطبيق في آل مكان
. ظروف معيشية وبيئية أفضل
آأداة (GIS) استخدام نظم المعلومات الجغرافية فيها تم لمرحلة الأولىا :مرحلتين رئيسيتين على ارتكزت منهجية البحث
Multi ) ام التحليل المتعدد المعاييرفي المرحلة الثانية استخد تمفي حين ،المناسبة في مرحلة اختيار المناطقرئيسية
Criteria Analysis ) إخضاعها لعدة معايير تم تطويرها وذلك بعد البدء بالتطوير لتقييم المناطق المختارة حسب أولوية
. من خلال هذا البحث
المنطقة القريبة من ( 5الموقع إنمن جميع النواحي الست تقييم المناطق بعدلبحث النهائية انه وأخيرا ، أظهرت نتائج ا
.هي الأقل ملائمة )المنطقة القريبة من عابود( 3الموقع بينما لتكون منطقة امتداد حضري ملائمة هي الأآثر )رمون
أحد ومنهجه وإدارة النمو العمراني فيتتطرق لدراسة الأولى التي لم تكن الأولى فهي من الدراسات إنهذه الدراسة إن
االمستخدمة تصلح لأن تكون نموذج الآليةوأثبتت نتائجها أن " رام االله والبيرة" ضرية الكبرى في فلسطين التجمعات الح
.يمكن تطبيقه في مختلف محافظات الوطن و في مناطق التحضر المشابهة لفلسطين

v
ABSTRACT
Urban population growth is accelerating around the world while land is becoming a
decreasing resource. Over 65% of Palestinians are living in urban areas which are much
higher than the international percentage which are 50 %. Ramallah-Al Bireh Governorate is
the most rapid growing governorate and this is accompanied by a significant pressure on
services, employment opportunities, and the need to provide appropriate accommodation for
all people coming in from all over the West Bank governorates, cities, villages and camps.
This research aims to find suitable areas for absorbing urban growth in the Ramallah and Al
Bireh governorate in order to alleviate the pressure on the city center as well as to find
accommodations for all young families who looking for the better living conditions and a
better environment. This research was conducted through two major phases: Geomorphic
Information System (GIS) was the major tool for the site selection in Phase One, while in
Phase Two; Multi Criteria Analysis (MCA) was applied to compare these sites together
considering a set of criteria and different perspectives. Finally, in terms of the overall
perspectives, Site 5 (near Rammun) is the most suitable for the any new urban development
while Site 3 (near Aboud) is the least suitable site.
This research is not the first of its kind, but it is distinctive in its approach which addresses
the study and modeling of urban growth management in one of the largest urban
agglomeration in Palestine “Ramallah Al Bireh”. The results have proven that the approach
used can serve as a model, which can be applied in the different governorates of the West
Bank, and in regions which are experiencing urbanization similar to that in Palestine.
Key words: Urban Growth, Geographic Information Systems, Multi Criteria Analysis,
Criteria, Ramallah Al Bireh Governorate.

vi
Table of Content
ABSTRACT ............................................................................................................................................ v
DEDICATION ..................................................................................................................................... xii
ACKNOWLEDGMENT .................................................................................................................... xiii
LIST OF ABBREVIATIONS ............................................................................................................ xiv
Chapter One: Introduction ................................................................................................................... 2
1.1 Introduction ..................................................................................................................................... 3
1.2 Main Objective ............................................................................................................................... 5
1.3 Research Significance ..................................................................................................................... 5
1.4 Methods ........................................................................................................................................... 6
1.5 Research Contents ........................................................................................................................... 6
1.6 Research Limitations....................................................................................................................... 7
Chapter Two: Literature Review ......................................................................................................... 8
2.1 Urbanization .................................................................................................................................... 9
2.2 World Urbanization, Trends and Figures ........................................................................................ 9
2.3 Impacts of Urban Growth ............................................................................................................. 11
2.4 Managing Urban Growth: ............................................................................................................. 13
2.4.1 The concentration policy: .................................................................................................... 13
2.4.1 Decentralization .................................................................................................................. 14
2.4.2 New Towns: ........................................................................................................................ 16
2.5 Urban growth in Palestine ............................................................................................................. 21
2.5.1 Planning Experience in Palestine ........................................................................................ 23
Chapter Three: Study Area ................................................................................................................ 25
3.1 Historical Background: ................................................................................................................. 26
3.2 Ramallah Al Bireh Governorate: .................................................................................................. 29
3.2.1 Population: .......................................................................................................................... 32
3.2.2 Population Projection: ......................................................................................................... 33
3.2.3 Population Density .............................................................................................................. 34
3.3 Ramallah Urban Development ....................................................................................................... 36
Chapter Four: Data Analysis .............................................................................................................. 39
4.1 Site Selection Criteria and Methodology ...................................................................................... 40
4.1.2 Site Selection Criteria description ...................................................................................... 43
4.1.3 Site Selection analysis and preliminary results ................................................................... 46
4.1.3 Final Results ........................................................................................................................ 53

vii
4.2 Sites Evaluation and Analysis ........................................................................................................ 55
4.2.1 Introduction ......................................................................................................................... 55
4.2 .2 Multi Criteria Analysis Methodology ................................................................................. 55
4.3 Development of Criteria for Site Evaluation ................................................................................ 60
4.3.1 Criteria Description ............................................................................................................. 61
4.4 Quantification of the actual values ................................................................................................ 68
4.5 Normalization of basic criteria ...................................................................................................... 75
4.6 Determination of weightings and balancing factors ...................................................................... 76
4.7 Quantifying the values of second and third levels of criteria ........................................................ 77
4.8 Preliminary Results ....................................................................................................................... 78
4.9 Final Results and Discussion ......................................................................................................... 80
4.10 Description of the best Site: ........................................................................................................ 83
Chapter Five: Conclusion and Recommendations ............................................................................ 85
5.1 Conclusion .................................................................................................................................... 86
5.2 Recommendations ......................................................................................................................... 89
References: ........................................................................................................................................... 91
Appendices ............................................................................................................................................ 97

viii
List of Figures:
Figure 2.1 Urban and rural populations of the world, 1950-2050 .............................................................. 10
Figure 2.2 Galaxy Model ........................................................................................................................... 15
Figure 2.3 The original Garden City Concept by Ebenzer Howard ........................................................... 18
Figure 3.1 Historical Palestine through different political stages .............................................................. 27
Figure 3.2 Location of Ramallah Al Bireh Governorate ............................................................................ 29
Figure 3.2 Israeli colonies and Military Zones, the wall in Ramallah Al Bireh Governorate .................... 31
Figure 3.3 ABC Zones in Ramallah Al Bireh Governorate ....................................................................... 31
Figure 3.4 Population Pyramid of Ramallah Governorate ......................................................................... 32
Figure 3.5 Demographic Chart of Ramallah Governorate ......................................................................... 34
Figure 3.6 Ariel photos of Ramallah and Al-Bireh in 1944 and 2000 ....................................................... 36
Figure 3.7 The driving urban forces effecting the possibilities and limitation for Ramallah Al Bireh urban center’s future expansion ....................................................................................................................... 37
Figure 4.1 Simplified flow chart of the two major phases ......................................................................... 41
Figure 4.2 Detailed framework of the two phases ...................................................................................... 42
Figure 4.3 Main urban centers .................................................................................................................... 43
Figure 4.4 The Israeli Colonies and Military Zones .................................................................................. 44
Figure 4.5 The wall route within the governorate ..................................................................................... 45
Figure 4.6 The regional and bypass roads ................................................................................................. 45
Figure 4.7 10 m contour map and slope ..................................................................................................... 46
Figure 4.8 2 km buffers away as needed areas for expansion ................................................................... 47
Figure 4.9 The Israeli Settlements and the 2 km buffers away as restricted zones .................................... 48
Figure 4.10 The separation wall and the confisticated land behind that wall .............................................. 49
Figure 4.11 The regional and bypass road buffers as a mean of isolation the urban centers ....................... 50
Figure 4.12 10 m contour map and slope .................................................................................................... 51
Figure 4.13 Areas considered unsuitable for development .......................................................................... 52
Figure 4.14 Output map before refinement .................................................................................................. 52
Figure 4.15 Suitable areas (after overlaying) ............................................................................................... 54

ix
Figure 4.16 The Framework of the Criteria ................................................................................................. 56
Figure 4.17 Graphical representation of results ........................................................................................... 59
Figure 4.18 Graphical representation of a set of ranked management ......................................................... 60
Figure 4.20 Graphical representation of a set of ranked all sites based on different perspectives ............... 79
Figure 4.21 Classified sites according to their acceptance ........................................................................... 80
Figure 4.22 Accepted site scores based on the overall perspective .............................................................. 82
Figure 4.23 Ranked sites according to average overall perspective ............................................................. 83
Figure 4.24 Location of the best site ............................................................................................................ 84
Figure 5.1 The ranked sites according to management aspects. ................................................................. 87
Figure 5.2 Ranked sites according to socio-economic, environmental and infrastructure aspects. ........... 88
Figure 5.3 Ranked sites according to overall perspective .......................................................................... 88

x
List of Tables
Table 4.1 Characteristics of the potential sites ......................................................................................... 54
Table 4.2 List of the criteria in different levels ......................................................................................... 67
Table 4.3 The values of Criteria 1: Land Classification ........................................................................... 68
Table 4.4 The values of Criteria 2: Distance to Settlement ...................................................................... 68
Table 4.5 The values of Criteria 3: Distance to the separation wall ......................................................... 69
Table 4.6 The values of Criteria 4: Slope ................................................................................................. 69
Table 4.7 The values of Criterion 5: Aspect ............................................................................................. 70
Table 4.8 The values of Criterion 6: land continuity ................................................................................ 70
Table 4.9 The values of Criterion 7: Cadastre and land registration ........................................................ 70
Table 4.10 The values of Criterion 8: Available land for building ............................................................. 70
Table 4.11 The values of Criterion 9: Agreement to national perspective ................................................. 71
Table 4.12 The values of Criterion 10: Landownership ............................................................................. 71
Table 4.13 The values of Criterion 11: Distance to city center .................................................................. 71
Table 4.14 The values of Criterion 11: Agricultural land .......................................................................... 72
Table 4.15 The values of Criterion 13: Cultural heritage ........................................................................... 72
Table 4.16 The values of Criterion 14: Social acceptance .......................................................................... 72
Table 4.17 The values of Criterion 15: Average land price ....................................................................... 72
Table 4.18 The values of Criterion 16: Number of existing residences ...................................................... 73
Table 4.19 The values of Criterion 17: Distance to water sources ............................................................. 73
Table 4.20 The values of Criterion 18: Distance to electricity network ..................................................... 73
Table 4.21 The values of Criterion 19: Green areas ................................................................................... 73
Table 4.22 The values of Criterion 20: Vulnerability to ground water ....................................................... 74
Table 4.23 The quantified value of each site .............................................................................................. 74
Table 4.24 Ideal and worse value of each site ............................................................................................ 75
Table 4.25 The actual values of criterion for each site ............................................................................... 75
Table 4.26 Weights for first level of criteria ............................................................................................... 76
Table 4.27 Weights for second level criteria .............................................................................................. 77

xi
Table 4.28 Weights for third level criteria .................................................................................................. 77
Table 4.29 The scores of the second level criteria according to average perspectives ............................... 77
Table 4.30 The scores of the third level criteria according to average perspectives ................................... 77
Table 4.31 Summary of the most acceptable sites from different perspectives .......................................... 81
Table 4.32 Most acceptable sites ranked according to their suitability ...................................................... 81

xii
الإهــــــــــــــــــــــداء
،تربيت أآتـــــــــافهممن على إلى
،،هم آبرتـــــلاقـوعلى أخ
،،،هم تعلمتـــــــومن إرادت
....ـــــا ما آنـــــــتــــــــــــــــولاهمـــــلإلى من
أبي وأمي
DEDICATION
To the two people dearest to my heart
My Parents
Your support and encouragement, made it possible.

xiii
ACKNOWLEDGMENT
First and foremost I thank God Almighty for giving me the strength and patience to reach this
far.
For my supervisor Dr. Salem Thawaba, I am indebted for the time he spared me, the useful
comments, guidance, and for the encouraging discussions.
To my Family goes my warmest appreciation for their continuous support and
encouragement.
My deepest gratitude to my brother Eng. Muath Abu Sada, for his constant support and
confidence in me, I hope I made you proud.
I would like to thank Dr. Karen Assaf for her valuable comments on editing this thesis.
Lots of gratitude to my friends who helped and supported me while writing this research.
Thanks to My friends and colleagues in the House of Water and Environment for their
patience and support, mostly Najwan Imseih for all her help.

xiv
LIST OF ABBREVIATIONS
ARIJ Applied Research Institute- Jerusalem
ASL Above Sea Level
GIS Geographic Information Systems
HWE House of Water and Environment
MCA Multi Criteria Analysis
MOLG Ministry of Local Governance
MOP Ministry of Planning
NAD Negotiation Affairs Department
PCBS Palestinian Central Bureau of Statistics
PA Palestinian Authority
TIN Triangular Irregular Network
WB West Bank
UN United Nations
UNESCO United Nations Educational, Scientific and Cultural Organization
UNFP United Nations Fund for Population Activities

2
Chapter One: Introduction

3
1.1 Introduction
Urban population growth has been accelerating around the world for the past few
decades while land is becoming a decreasing resource. Today, statistics show that more than
half of the world’s 6.6 billion people live in urban areas, crowded into 3 percent of the earth’s
land area (United Nations, 2008). The proportion of the world’s population living in urban
areas, which was less than 5 percent in 1800 increased to 47 percent in 2000 and is expected
to reach 65 percent in 2030 (United Nations, 1991and 2007).
The rapid growth of the world's cities along with the associated problems of unemployment,
poverty, inadequate health, poor sanitation, urban slums and environmental degradation has
created alarming challenges in many developing countries.
While the population of urban areas continues to increase, managing urban growth has
increased in importance and has become one of the most important challenges of the 21st
century. In an attempt to meet the challenges faced, urban planners around the world are
adopting solutions to minimize the impacts of rapid urban growth when they decide whether
they want to encourage centralization, decentralization or the building new towns. By
researching these experiences, the criteria for planning such places were found to be general
standards and these often do not coincide with Palestinian circumstances. However, the
Palestinian experience has been reviewed through the West Bank Regional Plan which has
been proposed by the Ministry of Planning in 1998. This plan identified four models for
development. Also, new plans have been revealed by Palestinian investors to build new
cities with private investment. All these plans lack appropriate criteria for the selection of the
best location.
In Ramallah-Al Bireh Governorate, like all other governorates, land is considered a very
limited resource. In the status quo scenario, the urban expansion of Ramallah-Al Bireh

4
governorate’s urban centers has reached its limits from the all directions (Ramallah
Municipality, 2008). On the other hand, the Ramallah governorate unlike other West Bank
governorates is still experiencing a population boom accompanied by a significant pressure
on services and employment opportunities and the need to provide appropriate
accommodation for all people coming in from all over the West Bank governorates, cities,
villages and camps. This uncontrolled population growth is confronting urban planners and
developers with numerous problems with regard to essential services, as well as heavy
pressure on land and other resources, environmental degradation and urban flooding.
There is an urgent need for finding new places in order to ease the pressure on the city center
and to create residential areas close to the city center.
In the absence of comprehensive planning and strategic intervention at the regional and local
levels, the aim of this research is to locate the most suitable “sustainable” areas for absorbing
urban growth in the Ramallah and Al Bireh Governorate
Geographic Information Systems (GIS) and Multi Criteria Analysis (MCA) are the two major
tools used in this research. GIS deals mainly with suitability analysis, and MCA is used
mainly for analyzing and evaluating the alternatives based on a decision maker’s point of
view and preference.
This research deals with the hypothesis of “status quo”. In other words, the Israeli colonies
were considered as another kind of built- up area, the wall was taken into consideration and
areas A, B, C, based on the Oslo Accords were considered as facts on the ground. Of course,
this approach does not give any justification for these “on the ground facts”. The research
deals with development areas as an urgent need taking into consideration the recent urban
boom.

5
1.2 Main Objective
The main objective of this research is to find areas which are suitable for new urban
development in order to alleviate the pressure on the city center as well as to find
accommodations for all young people who are looking for better living conditions and a
better environment. This approach is based on studying political national planning policy, and
the socio- economic and environmental status of each site. The selected sites will be
evaluated and ranked using Multi Criteria Analysis.
1.3 Research Significance
This study has gained importance due to two main reasons. Firstly it focuses on the
development of a special scientific approach in order to select potential locations for new
urban development. This approach is based on the spatial analysis of the geographic data (e.g.
physical, socio-economic, using Geographical Information System (GIS). Also, this approach
is applicable elsewhere. Secondly, the results of this study will be available to the Palestinian
Authority as well as to the Palestinian investors as a guiding tool.
The added value of such a research is to establish a database which includes; digital maps,
attribute, geographical and statistical data for the study area. This research will provide
decision makers with basic directions, and analytical tools, in the form of a systematic
approach when dealing with urban growth management. Moreover, this approach can be
offered as educational material for students dealing with urban growth management.
6
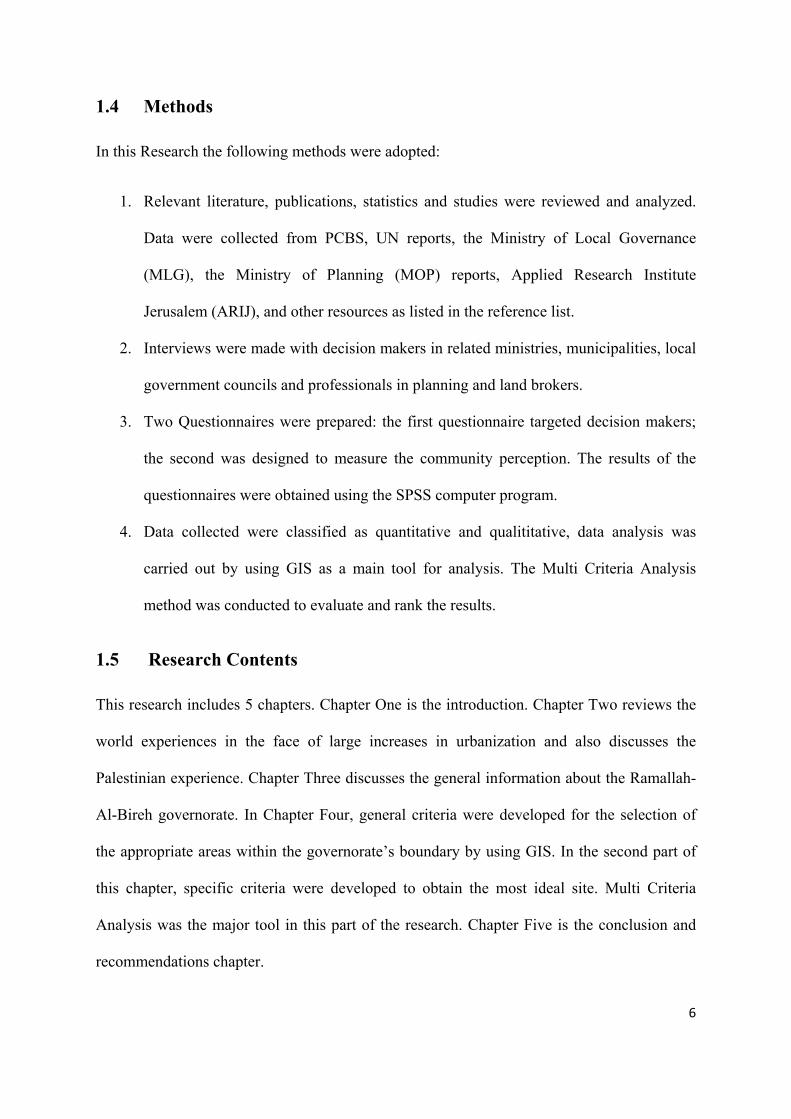
1.4 Methods
In this Research the following methods were adopted:
1. Relevant literature, publications, statistics and studies were reviewed and analyzed.
Data were collected from PCBS, UN reports, the Ministry of Local Governance
(MLG), the Ministry of Planning (MOP) reports, Applied Research Institute
Jerusalem (ARIJ), and other resources as listed in the reference list.
2. Interviews were made with decision makers in related ministries, municipalities, local
government councils and professionals in planning and land brokers.
3. Two Questionnaires were prepared: the first questionnaire targeted decision makers;
the second was designed to measure the community perception. The results of the
questionnaires were obtained using the SPSS computer program.
4. Data collected were classified as quantitative and qualititative, data analysis was
carried out by using GIS as a main tool for analysis. The Multi Criteria Analysis
method was conducted to evaluate and rank the results.
1.5 Research Contents
This research includes 5 chapters. Chapter One is the introduction. Chapter Two reviews the
world experiences in the face of large increases in urbanization and also discusses the
Palestinian experience. Chapter Three discusses the general information about the Ramallah-
Al-Bireh governorate. In Chapter Four, general criteria were developed for the selection of
the appropriate areas within the governorate’s boundary by using GIS. In the second part of
this chapter, specific criteria were developed to obtain the most ideal site. Multi Criteria
Analysis was the major tool in this part of the research. Chapter Five is the conclusion and
recommendations chapter.

7
1.6 Research Limitations
There are specific limitations to the research process with regards to limitations of data
collection and data analysis along the two stages of the research. These limitations can be
summarized as follows:
• Data was obtained from different resources that were non-harmonized in time and
some of the information was not available, and some other was difficult to obtain in
time.
• Lack of funding for the research as this type of research needs field visits and contacts
with decision-makers, planners, municipalities, and local councils.
• Lack of community awareness of the importance of the research, which thus led to the
lack of access to information from the public.

8
Chapter Two: Literature Review

9
2.1 Urbanization
Urbanization is one of the apparent global changes which the world is observing. It is
a dynamic process, which is highly involved in different aspects with different patterns.
Different countries define their urban areas in different ways; that is why the UN defines
urban areas according to the national census definition: “It is suggested that for purposes of
international comparisons, countries define urban areas as localities with a population of
2000 or more, and rural areas as localities with a population of less than 2000 and sparsely
populated areas” (World Urbanization Prospects, 2003).
In many parts of the world the structure of urbanization was established by the pre industrial
city, which accompanied industrial and technological development which was then reflected
on the urban fabric. For example, by 1800 only three percent of the world’s population was
located in urban places of 5,000 or more (UN, 2003) while in the year 2008, more than half
of the world’s people live in urban areas and by 2030 urban inhabitants will make up roughly
60% of the world’s population which clearly means that the world on the verge of a shift
from predominately rural to mainly urban (World Urbanization Prospects, the 2007
Revision).
2.2 World Urbanization, Trends and Figures
Although the world’s population is urbanizing at an increasingly rapid rate, developing and
developed countries differ greatly in urban growth rate. Less developed countries have often
a greater rate of urban growth, while developed countries are the most urbanized and
industrialized areas (UN, 2000, World Urbanization Prospects, 2007). Figure 2.1

10
Figure 2.1 Urban and rural populations of the world, 1950-2050 (World Urbanization
Prospects, 2007)
In Europe, for example, the urbanization level can be estimated as 40-60% which is resulted
from a number of related factors, due to the industrialization which increased the percentage
of urban population to the total population, the population growth rate, in addition to progress
causing structural changes in the population in metropolitan areas.
On other hand, Latin America has a high rate of population growth which reaches 75%; the
main two factors that affect the urbanization in Latin America are the immigration and
revolution which led to the centralization of the urban population in the major cities in Latin
America.
In contrast, the urbanization in Africa and Asia is considered to be relatively low since a
small number of populations live in urban areas. This has characterized both continents as
rural since each has no more than 38 and 41 %, respectively of its total population living in
urban areas. Moreover, by 2030, 53% of Africa’s population and 54% of Asia’s population

11
are expected to be living in urban areas. In Africa, the cause of this growth has been mainly
from migration to urban areas, while in Asia population distribution is the most significant
characteristic for Asia urbanization where the urban population is concentrated either in the
capital of the country, large cities or metropolis (UN, 2000).
In other parts of the world, the North Africa/Middle East region, the population was
predominantly rural until the second half of the 20th century during the years following the
Second World War, when only 27% of the region (81 million people) lived in urban areas
(UNFPA, 1991). The causes of the urbanization in the Middle East the rural-urban migration
and the economic growth which occurred a decade later with the oil price boom in 1970’s and
the immigration of Palestinian refugees (UN, 2000). The pattern of urbanization in the
Middle East is clear in the overcrowded conditions within the old cities and a more modern
trend of urban sprawl. (UN, 2000 and Pugh, 1995).
2.3 Impacts of Urban Growth
In general, it is clear that the world is becoming more and more urban. The three dominant
factors that affect urbanization in whole world can be concluded as rural to urban migration
combined with rapid population growth rate and industrialization. These factors led to
improvement in communications, changes in construction technology, the telecommunication
revolution, public health and safety improvement. In sequence these factors created a great
pressure on land resources and cities structures through the increase of the demand and need
for the new urban lands. Moreover, infrastructures have been pushed to their limits in order to
attend to the needs of their increasing populations.

12
On the other hand the individual share (land needed per person) has decreased and this led to
crowding in the major cities in terms of the number of dwelling units per km2 as well as
creating pressure on the roads, especially in the city center, in addition to the environmental
pollution impacts (both air and water), unemployment and other social problems as well as
the expansion of urban areas over the agricultural lands, especially in the developing
countries where the agricultural lands are a major source of income.
One of the worst problems of urban growth is the growth of slums, where the areas are
crowded with substandard and poor living conditions, with a lack of sanitation and primary
utilities. Slum conditions make maintenance of law and order difficult. Unemployment and
poverty have forced people into anti-social activities.
In general, sprawl is defined as a physical pattern of development due to increasing urban
population. But in reality sprawl is characterized by unplanned and uncontrolled patterns of
growth, forced by a large number of processes and leading to inadequate resource utilization.
Sprawl is defined as the physical pattern of the spreading out of a city and its suburbs over
more and more rural land at the periphery of an urban area. This involves the conversion of
open space into built-up, developed land over time. (sprawlcity.org)
Suburbs are another physical fact of urban growth beyond the borders of the city (Praeger,
1969). This phenomenon began as a socially exclusive community which allowed people to
live in a reasonably pleasant location away from the crowded areas of the city center, and
then suburbs generated employment as well as provided housing. However, the suburbs were
still dependent on the central cities’ services (Grogan and Proscio, 2002). After the Second

13
World War, the suburbs were serviced with a transportation system, since the residential
areas were placed outside the city centers.
2.4 Managing Urban Growth:
The population of urban areas continues to increase from 2.86 billion in 2000 to 4.98 billion
by 2030. This dramatic increase creates a high demand on services, increases the pressure on
transportation systems and increases the difficulties to serve the people that live away from
the main urban centers. Obviously, the required area per person is minimized.
Managing urban growth has increased in importance and has become one of the most
important challenges of the 21st century (Cohen, Barney, 2003). In an attempt to meet the
challenges faced urban planners around the world adopted solutions to minimize the impacts
when they decided whether they want to encourage centralization, decentralization or the
building new towns:
2.4.1 The concentration policy:
This development pattern is focused mainly on gathering centers on a minimum area of land
with expansion vertically. The ideas is applied by establishing a number of new cities and
satellite towns away or close to existing urban areas, or the creation of the suburbs which
allowed people to live in a reasonably pleasant location away from the pollution and poverty
of the inner-city, but still allowed them to work in the economically booming urban areas in
order to distribute some of the services to relieve the pressure on major cities.

14
(Schaeffer and Sclar, 1975). This policy would require planners to promote development in
the center of the cities and inner suburbs through the construction of high rise buildings that
could accommodate the forecasted population. Such a policy would be suitable for a city
where its land resources are limited.
• The compact city model is one of the concentration policies. It is introduced
as an alternative to urban sprawl and focuses on limiting the peripheral
expansion of urban areas. The compact city is designed to make more efficient
use of existing land resources and infrastructure, as well as reducing private
car usage as public transportation becomes more viable in area of higher urban
densities.
• The satellite city model is to a small or medium-sized city that is near a large
central city. The optimum population of a satellite city is between 25,000 and
250,000 inhabitants. Satellite cities have growth limitations and when a
maximum size has been reached, another satellite is started. Satellites are
separated from the central city by rural land and each satellite city is
surrounded by greenbelts (Golany, 1976).
2.4.1 Decentralization
Decentralization is the second policy which depends mainly on the distribution of urban
centers horizontally in order to distribute the social and economic activities in sub-centers
which will lead to minimize the population density away from the main urban center. There
are many directions of this strategy:

15
• The broad acre city is a type of decentralized community and is an urban
development concept proposed by Frank Lloyd Wright as a solution to
urbanization. The concept of this model was to combine social ideas and
values with modern concerns about technology, communications, electric
power, and developing systems in construction, manufacturing, and
transportation. Each family was given one acre (4,000 m2) of land, and each
city was inhabited by 1,400 families (Wright, 1932).
• The galaxy model is one of a decentralization policy. It represents an urban
form in which the older center and sub centers of a city are separated into small
units, each with a relatively dense central core and linked by a transportation
network ( Frey, 2005) Figure 2.2. The centers of units might be relatively equal
in importance. The units provide a large variety of house types from high
density, low rise at the cores around traffic nodes and low density family units
towards the edge of and in areas between units.
Figure 2.2 Galaxy Model, (Frey, 2005)

16
2.4.2 New Towns:
On the other hand and in many countries around the world, building new towns has been
a policy of managing urban growth in rapidly growing urban areas. The British
experience was basically developing garden cities and new towns. However, the idea of
developing new towns has also succeeded in other countries such as Germany, France and
Egypt (Pakzad, 2007).
The International Experience in New Towns:
The idea of new cities is not new. It has been in existence since the end of the
nineteenth century when Ebenzer Howard was the first to propose the creation
of Garden City in England. It gained global attention during the 20th century
especially in the period after the Second World War, when large numbers of
new cities in many countries were created around the world as a means of
capturing the surplus from cities within planned developments rather than
allowing random and unplanned urban growth. These new towns were starting
either from scratch or from an already existing human settlement or even rural
community with sufficient urbanizing potential which can provide the most
modern facilities, schools, shopping or parking. However, the purpose of
building new cities is numerous and varied; including reduction of population
density in the main cities, and transferring inhabitants to areas of low density
as in the case of Great Britain, and to ease pressure on major cities such as in
France and Egypt. In the case of Australia and Brazil, building new capitals of
countries was the main reason, and Saudi Arabia is heading to build industrial

17
cities purposefully to exploit natural resources. In the United States of
America, the purpose was to absorb more migrants to settle there.
The sections above explain that every country has its own purpose to build
new cities which differs from others, but it is worth mentioning that Britain
laid the cornerstone of planning for new towns, so among all other countries,
Britain was the pioneer in this development. After that, many other countries
adopted Britain’s concept and learned this knowledge.
• The British Experience:
The idea of the British New Towns movement was originally posed by
Ebenezer Howard who proposed the idea of the Garden City in 1898.
Howard's Garden City- as described in his book Garden Cities of Tomorrow is
a self sufficient settlement of no more than 32,000 people in 400 ha linked to
other Garden Cities of 2000 people in the agricultural belt of just over 2000 ha
(Hall, His main concept was to prevent sprawl around London from continuing
in order to protect productive agricultural land. His vision showed a central
city of 58,000 with six satellite cities around it. Each has its own industry and
services, and was reasonably self sufficient in meeting the needs of its
population. Belts of agricultural land separate the cities. The total population
would include about 25,000 (Thomas, 1985) Figure 2.3.

18
Figure 2.3 The original Garden City Concept by Ebenzer Howard (Thomas,
1985)
After the Second World War, the British government launched the New town
programme (New Town Acts 1946) as a national project. This project adopted
Howard’s concept. The programme has been issued to determine the regulation
and the rules of what constituted self-contained and balanced communities and
ranges for the ideal size of a New Town (Bennett, 2005).
• The Egyptian Experience:
During the last century the population of Egypt has grown about ten fold,
whereas the population of Cairo increased more than thirty folds. Egypt's large
and rapidly growing population is limited to a narrow strip of arable land along

19
the Nile River. In 1992, Egypt's total population of 54.7 million had increased
since 1980 at an average annual rate of 2.4 percent (Zigmann, 2007).
According to the 1996 census, the growth of Cairo city lowered to 1.6% yearly
compared to the 2.6% growth percentage in the 1980’s. Moreover, Cairo faced
an enormous influx during the past 30 years and grew from 6.7 million
inhabitants in 1976 to over 10 million in 2002 (Touman, 2006). Most of
Egypt’s populations live in urban areas, and 39% have settled in the capital
Cairo. The population of the next largest city, Alexandria, numbers only 3
million.
The high population growth rate related to Cairo has been caused by many
reasons such as growth of Cairo, the natural increase of population, and the
regional- internal migration including movement of inhabitants from the south
to the north heading to the delta and the Suez Canal seeking agricultural land
and job opportunities (Touman, 2005).
As the population continues to grow and concentrate in one city, Cairo coped
with the rapidly growing population by the master plan of Greater Cairo. Iِn
1969, a master plan for Greater Cairo was launched by the president Abd Al-
Nasser. The goal of this plan was to disburden the capital by the construction
of satellite towns in the desert surrounding Cairo in order to absorb Cairo’s
growth, and to provide alternative sites for urban development (Stewart, 1996).
After Abd Al Nasser died in 1970, his successor Anwar al Sadat (1974)
supported for the creation and execution of Nasser’s plan and later it turned

20
into a large scale programme beginning with the construction of the first new
town in 1977. A number of new urban forms were supposed to be developed,
including satellite towns, new towns, and new settlements (Stewart, 1996).
New urban towns became the effective solution for housing and community
service development in Egypt. Three town types were the options for the new
towns in Egypt; first, satellite towns which have an access to main cities,
second, twin cities which consist of a housing expansion of the existing desert
towns, and the third type was a new category of cities known as “new
settlements." These are described as self-sufficient communities located next
to existing urban centers.
Three satellite towns have been built; they are sited within a distance of 40 km
to Cairo. Some of them are industrial towns (City 6th of October), while others
are sleeping towns (City 15th of May). Population targets in these cities range
from 250,000 to 500,000.
Moreover, four new towns emerged at a greater distance from the capital (90
km). These are supposed to serve as new regional centers and to offer new job
opportunities through the selective settling for industry. These are designed to
accommodate populations of 500,000 to 1 million each. Two of these towns,
10 Ramadan and Al Badr, are located near the Greater Cairo Region.

21
The new settlements are sited directly on the edge of the Cairo agglomeration
and they are supposed to develop an independent economic base which would
reduce the essential of commuting to Cairo.
New towns in Germany:
The creation of new towns in Germany was raised during the transition period
from pre industrialization to Industrialization. The percentage of the workers
who were employed in manufacturing rose to 30% of the total labor force
(Praeger, 1969) and this problem led to the need of finding new centers to
accommodate these workers.
2.5 Urban growth in Palestine
The situation in Palestine is different compared to other countries. The total
Palestinian territory is divided into the West Bank and the Gaza Strip with
total area of 6165 km2. the West Bank is 5800 km2 in area, 130 km long and
ranges between 40-65 km in width, and Gaza Strip is 365 sq km in area , 45
long and between 5-12 km wide. According to the 2007 Census, 2,350,583
people are living in the West Bank and Gaza, the average population density in
Gaza is about 3880 person per km2 whereas the average population density in
the West Bank is 416 per km 2 (PCBS, 2008).
The West Bank is divided into 11 districts: Jenin, Tulkarm and Nablus
Districts occupy its north in the middle is Ramallah, Jerusalem and Bethlehem,
Hebron is in the south, and the eastern part of the West Bank is Jericho. In
Gaza, there are two centers, Gaza City in the north and Khan-Yunis City in the
south. By the end of 2007 the Palestinian Central Bureau of Statistics (PCPS)

22
stated that 2.5 million Palestinians lived in the West Bank (including East
Jerusalem).
Urban areas in Palestine are defined by the Palestinian Central Bureau of Statistics (PCBS)
as: ”any locality with at least 10,000 inhabitants; all governorate and district centers
regardless of size; and localities whose populations vary from 4,000 to 9,999 persons
provided they have at least four of the following services: public electricity network, public
water network, post office, health centre with a full-time physician and a school offering a
general secondary education certificate (PCBS, 1997)
In Palestine the issue differs from other countries since the proportion of Palestinian land that
is actually under Palestinian control is even smaller than the origin size of the West Bank
(initially in 1993 it was just 3% of the West Bank, then extended to 18% of the original size
of the West Bank in the year 2000) (khamaiseh, 2006).
In Palestine, the increase in urban population mainly resulted from three reasons: the high
natural growth rate of the urban population, the re-classification of rural localities as they
grow and reach a certain number that makes them cities and towns, and the uncontrolled
rural-urban migration of residents from the North and South of the West Bank to the main
cities, especially Ramallah city. The data available from PCBS stated that the percentage of
the urban population in the West Bank and Gaza is 68.7% which is much higher than the
international average 50% in 2007, and also higher than the percentage of urban areas
compared to other the developing countries which reached to 40.4% for the same year.
Comparatively, in the 1997 census, the figures for rural and urban areas were close at 46.6%
for urban areas of the total of the West Bank population and 46.9% for rural areas of the total

23
of the West Bank population. The percentage of refugee camps was 6.5% of the total of the
West Bank population (PCPS, 2008).
2.5.1 Planning Experience in Palestine
The Ministry of Planning prepared the first Palestinian regional plan for the West Bank in
1998. The plan proposes four models for development. The plan is supporting the main
urban- ridge along the middle series of mountains where six of the eleven governorate
administrative centers are located. Moreover, the plan highlights the need for enhancing
urban development along the eastern and western edges of the West Bank area (MOP, 1998).
Various options for creating new living spaces for the immigrants/returnees were investigated
during the Palestinian-Israeli negotiations; one of these options was to develop new towns.
Three selected locations were studied as pilot projects: (two towns in the West Bank and the
third in the Gaza Strip). The selection of these three was based mainly on the land use plan
proposed in the Regional Plans of 1998 for West Bank and Gaza Governorates, and on the
Emergency Natural Resources Protection Plans of 1996 for West Bank and Gaza
Governorates. The other option was to use the vacant public and waqf lands in/around
existing urban areas (MOP, 1998).
The RAND Corporation proposed a plan which addresses the infrastructure needs which suits
a growing Palestinian population. The main concept of this plan is a linear urban network
based on a high speed railway linking West Bank cities to each other and the Gaza strip. The
arced corridor is about 225 km including a railway, highway, and open water canal and
energy network. The plan considers a total population of five million inhabitants including

24
returnees. The West Bank population is expected to exceed this limit in about 20 years
(Suisman et al , 2005).
Nowadays, new plans have been revealed by Palestinian investors to build new cities in order
to solve the rapid population growth. Master plans of creating new cities near Ramallah have
already been launched; Rawabi, ten kilometers to the north of Ramallah, it is expected to
accommodate 25,000 residents with more than 5,000 housing units in addition to town
centers with commercial offices, schools, hospitals, hotels and other entertermaint services
(Rawabi.ps).
On the long run, many investors are also looking forward for planning new cities near
Nablus, Jenin and Hebron.
Despite reviewing the Palestinian experiences in the face of large increases in urbanization,
Palestinian urban centers are still facing a sprawl that threatens the balance of its urban
growth. In the absence of strong planning intervention at the regional and local level, this
research is focusing on finding scientific criteria for selecting new urban areas for absorbing
the increasing flux of population in the Ramallah Al Bireh Governorate.

25
Chapter Three: Study Area

26
3.1 Historical Background:
Historical Palestine is the land that lies between the Mediterranean Sea and Jordan River with
global coordination of (310 North, 350 East). It has an area of 27,000 Km2. It was under the
Ottoman’s empire for four centuries. The urban structure was formed in that time from few
major cities such as Safad, Tibeias, Akka, Yaffa, Haifa, Hebron, and Nablus, and villages,
towns and agricultural hamlets, and a few bedouins in the south (Coon, 1991).
After the collapse of the Ottoman regime, Palestine became under the British Mandate. In
1917, the Balfour Declaration supported the creation of a Jewish National Home in Palestine,
which facilitated the creation of Israel.
In November 1947, the UN General Assembly adapted a plan to divide Palestine. According
to that plan, the Jewish population formed only 30% of all the population and they owned
only 6% of the land. This plan was rejected and then the Israeli state was declared on 78% of
Palestine (ARIJ, 2006).
In 1948 , the Israeli occupation forces declared 78% of historical Palestine as a state of Israel,
while the rest 22% ( 5661 Km2) in the West Bank became under Jordanian rule while Gaza
Strip (365 km2) became under Egyptian rule. During that period, at least 418 Palestinian
villages were demolished and transformed into Jewish cities and villages.
In 1967, a major change occurred when Israel occupied the West Bank including Jerusalem,
the Gaza Strip, Golan Heights, and Sinai Figure 3.1.

27
Figure 3.1 Historical Palestine through different political stages (NAD, 2008)
During the Israeli occupation of the West Bank, their forces further launched military attacks
against the Palestinian people destroying their lands and resources, and more than 350,000
Palestinian refugees were forced to leave their lands. Many of the Palestinian villages were
destroyed (ARIJ, 2006).
Since the year 1967, Israel did not allow development in Palestinian central cities through
control of their expansion. They also confisticated Palestinian lands to construct Israeli
Colonies. There are more than 250 Israeli colonies and sites built in the West Bank, including
Palestinian East Jerusalem. These sites house 450,000 Israelis with approximately 250,000
settlers live in the West Bank (ARIJ, 2006). Israel has also designated a bypass road system
throughout the West Bank Governorates which extends in length up to 765 km. These two

28
Israeli actions have affected Palestinian urban development by first, controlling the land
which may be used to develop the Palestinian communities, and secondly to prevent the
expansion of the urban areas (ARIJ, 2006).
After the Oslo agreement, the PLO and Israel signed a “Declaration of Principles” in 1993
through which limited Palestinian self-rule was established. Areas of the West Bank were
divided into three types, Area A, B, and Area C. Areas A are Palestinian areas with full
Palestinian control. This includes the area of the main cities. This represents 3% of the total
area of the West Bank. Area B, roughly 24% of the area, is under joint Israeli and Palestinian
control. The Israelis are responsible for its security while the Palestinians have the civil
authority. Area C is completely under Israeli control and the Israelis consider it as a “state”
land (ARIJ, 2006)
During 2000-2006, Israel continued to practice a policy that aimed at confiscating more
Palestinian lands. This is clearly observable in the construction of the Israeli Separation and
Annexation Wall, which seeks to deny the Palestinian people of a large part of their land and
water resources, squeezes their means of livelihood and growth and restricts their movement
between isolated cantons; whereas Israel is continuing with its colony expansion policy.
The wall will stretch for 770 km in the West Bank, and around 12% of the total West Bank
area will be segregated behind it. The wall will completely isolate 29 Palestinian villages
behind the wall and will also affect another 138 Palestinian villages (ARIJ, 2007).
In addition, Israel has created a de facto eastern separation wall without walls but through
control of access along the Jordan Valley and the Dead Sea. This zone has a total area of
1555 km2 representing 29.4% of the West Bank (ARIJ, 2007).

29
3.2 Ramallah Al Bireh Governorate:
Ramallah Al Bireh Governorate was selected as the Study area. The Governorate is situated
in the middle part of the West Bank. It is bordered by the Green Line from the West, Jericho
from the east, Salfit Governorate from the north, and Jerusalem Governorate from the south
Figure 3.2.
The Governorate occupies an area of 830 km2 which is about 14.5% from the West Bank
area. The built up area is about 88 km2. There are 75 localities in the Ramallah Governorate,
14 of the localities are urban and 56 of them are in rural areas .The Governorate also hosts
five refugee camps of Al Am’ari, Qaddoura, Al Jalazon, Deir Ammar and Birzeit. (PCPS,
2008).
Figure 3.2 Location of Ramallah Al Bireh Governorate

30
The twin cities Ramallah and Al Bireh are considered to be the center of the Governorate.
They share the same urban area. The population concentrated in the twin cities is about
62,000 persons. Most services, including health, financial, education, governmental and
commercial services are located within these cities. This resulted in a strong attraction for the
people from localities in the Governorate and other Governorates to the twin cities (PCBS,
2009).
Ramallah Al Bireh Governorate has always been affected by the many changes that Palestine
has gone through politically, socially and culturally. This change in urban area was
accompanied with changes in the population during that time which stands as witness to these
changes.
The most important changes happened after the 1948 war when Ramallah Al Bireh
Governorate became under Jordanian rule, and then many refugees from the Israeli occupied
part came to settle in Ramallah City. Again a major change occurred in 1967 when Ramallah
and the rest of the West Bank and Gaza Strip were occupied by Israel. The Ramallah
Governorate observed another period of emigration even from the cities which where
occupied in 1948 (Niruz, 2004).
The wall in Ramallah Governorate extends along 78.971 km, and it will segregate 99.091
km2 of Palestinian lands. The wall redraws the political boundary of Ramallah. More than
12% of the area was annexed to Israel. (Figure 3.2)

31
Figure 3.2 The current situation of Ramallah Al Bireh Governorate
According to the Oslo Agreement, Ramallah Governorate became under the Palestinian
control, 101.731 km2 of its land were classified as Area A, and 210.738 km2 were classified
as Area B, while 535.369 km2 were classified as Area C (ARIJ, 2006).
Figure 3.3 ABC Zones in Ramallah Al Bireh Governorate

32
One more significant change was after arrival of the Palestinian Authority when Ramallah
City was chosen to be the administrative center of the government. The city of Ramallah was
chosen because of its geographic location and its closeness to Jerusalem. In this period, many
of returnees settled in Ramallah and the internal migration started towards Ramallah (MOP,
2007).
3.2.1 Population:
According to PCBS (1997), Ramallah Governorates’ population was 205,448 persons while,
the 2007 census stated that the Governorate is home to 279,730. 52% of the Governorates’
populations are living in urban areas, 42% live in rural areas and 6% living in refugee camps.
The population of Ramallah Governorate is around 12% of the total population of the West
Bank (PCPS, 2008).
Figure 3.4 Population Pyramid of Ramallah Governorate (Source: PCBS, 2008)
The population pyramid in Figure 3.4 shows the population distribution by age group in
2007. The graph is large at the base and becomes narrow at the top, which gives a sign of
young population. The percentage of children under the age of 15 years makes up 38% of

33
Ramallah – Al Bireh Governorates’ total population, while the youth account for 58.1%, and
the older group accounts for just 3.9%.
The annual growth rate in Ramallah- Al Bireh Governorate had an average of 2.9. The
growth rate in the Governorate is less than the national growth rate which reached 3.4%
(PCPS, 2008). The growth rates are considered high compared with the world growth rate
which is 1.2% (PRB 2005, World Population Data Sheet).
The data shows clearly the high percentage of a young population of the Governorate, most
likely due to migration of the young generation to Ramallah seeking for jobs provided by the
governmental institutions and the private sector which are mostly concentrated in Ramallah
and Al Bireh cities.
3.2.2 Population Projection:
According to PCBS, the following demographic equation is used to measure the population
growth and to calculate population trends.
Population T= Pop b* (1+growth rate) n
T: target Year
b: Base year
n: number of years
Based on this equation, the projected population for Ramallah- Al Bireh Governorate can be
calculated for the target year of 2030 as follows:
Population 2030= Pop 2007*(1+growth rate) 23
The population data for the end of year 2007 were used as a primary data in the population
projections considering the average population growth rate 3%.

34
Figure 3.5 Population Trend of Ramallah -Al Bireh Governorate (PCBS, 2008)
According to the projection, by the year 2030 the population of the Governorate expects to
increase to 552071.4. Therefore; the percentage of change in the population number from
2007 to 2030 is 97.0%.
The Figure 3.5 shows Ramallah Governorate’s population will double by 2030. This
population growth is a result of natural increases and uncontrolled migration.
3.2.3 Population Density
In 2007, the population density of Ramallah Governorate was 327 person/km2 compared to
the population density in 1997 which was 217 person/km2. (PCBS, 1997 and 2007). The
population density is expected to increase due to high population growth and the limited land
resources. This is due to the Israeli land confiscation polices (ARIJ, 2007).
Based on the population data (2008), it is expected that the population of Ramallah
Governorate will continue to increase significant at an average growth rate of 3.4% per year
(PCBS, 2009) taking into account that this Governorate is a magnet for those people coming
from other Governorates, cities, villages, either to improve their life style or due to the
political situation.

35
During the past nine years, Ramallah has been transformed still not only as an administrative
center but also as an institutional, cultural, and service center of the West Bank. Since that
time Ramallah acts as a magnet that has attracted people from all West Bank’s cities, towns,
villages either to work or to get services.
This internal migration has placed a considerable demand for housing and public services and
facilities, in addition to the pressure on roads which are not adequate to absorb this numbers,
as well as decreasing touristic attractions which were replaced by commercial centers and
residential buildings.
Official statistics from the Municipalities of Ramallah and Al Bireh show a rapid increase in
the number of buildings in the past years. The municipality of Ramallah granted 240 licenses
for total area of 1247,9432 m2 in 2007 compared to 149 licenses for total area of 132,422 m2
in 2004 (Ramallah Municipality, 2009). In the Municipality of Al Bireh the total area of
135,473 m2 were licensed in 2003 compared to a total area of 254,919 m2 in 2005 (Al Bireh
Municipality, 2009). The high demands on the land also add to increase in land prices.
Continuing construction expansion has caused a significant decrease in green areas. Many
buildings are replacing most of those areas to accommodate the hundreds of people who
moved and settled in Ramallah Governorate.

36
3.3 Ramallah Urban Development
The rapid urbanization in Ramallah Al Bireh Governorate includes concentration of the
economic establishments in the urban centers. In 2004 in Ramallah AL Bireh cities, there
were about 2,659 economic establishments with 10,845
employees (PCPS, 2005). The increase of economic activities in the twin cities has led to
sprawl of the building and expanding of the built-up area as part of urbanization.
The built-up area of Ramallah city expanded during the period of 1989-1994 by 16.1%, with
the built-up area growth being an average of 397 donums per year. While in the period
between 1994- 2000, the built-up area of Ramallah grew by 24.5 percent, and the built-up
area growth in average of 585 donums per year, this accelerating urbanization transformed
Ramallah from a non-dense city with low-rise buildings not more than four stories, to high-
rise buildings reaching about twenty stories ( Khamaiseh, 2006). (Figure 3.6).
Figure 3.6 Ariel photos of Ramallah and Al-Bireh cities in 1944 and 2000. (Ramallah
Municipality)

37
So, what type of urban expansion can Ramallah and Al Bireh have? The urban expansion of
Ramallah and Al Bireh is very limited since Jabal Al Taweel (Psagot colony) is closing any
eastern expansion; the Givait Zeev colony is preventing southern expansion, the same with
hilly terrain in the West, while Beit Eil colony is closing North east expansion. This leaves
Ramallah and Al Bireh with one option for expansion which is the North West as shown in
Figure 3.7 (Ramallah Municipality, 2008). On the other hand, there is a need to
accommodate more people in the future!
Figure 3.7 The driving urban forces effecting the possibilities and limitation for Ramallah’s future expansion
According to Abu Ghoush, A., Abu Sada, J. and Suboh R, 2008, Ramallah city is expected to
reach the optimum population after which there will be an attack on the individual share of land
(area/person) which is estimated at 280 m2/person in Ramallah City and a density of 557

38
person/km2. This will negatively affect the living standards of the population finally leading to
the overcrowding of future population growth. It is important to note that this result is based on
the scenario that the population growth only resulted from natural growth and internal migration
towards Ramallah City.
These challenges necessitate a comprehensive plan in order to absorb this flux of people in a
sustainable way. This type of comprehensive plan can be created by developing certain criteria,
which will assess and find new possibilities for future expansion, and a way to manage urban
expansion in a sustainable way.

39
Chapter Four: Data Analysis

40
4.1 Site Selection Criteria and Methodology
4.1.1 Introduction:
To meet the goal of the research, various data sources were approached. The majority of the
needed data were gathered from the Palestinian Bureau of statistics (PCBS), the Ministry of
Local Governance (MOLG), Applied Research Institute - Jerusalem (ARIJ), and Ministry of
Planning (MOP). These data were last updated in 2007. The rest of the required data was
obtained from other relevant literature, publications, and studies and other institutions. Based
on different sources, GIS databases were developed for Ramallah Al Bireh Governorate
consisting of all demographic information. Various thematic maps were created for the
Ramallah Al Bireh governorate by digitizing, georeferencing using GIS software (ARC Map
9.2) using high resolution (Ariel photos) in order to obtain the main spatial features. The
features derived from images were road network, built up area, settlement and military zones.
A 3D analysis tool was used to get the TIN model from 10 m contour map to generate and
obtain slope. The qualitative parts of data were obtained from the interviews which were
conducted with the Palestinian planners and decision makers from the MOLG and the MOP.
Choosing appropriate locations is clearly related to specific circumstances. The purpose of
the analysis process is to find the potential area for future development. This was achieved
through the scenario of status quo in which political constraints play a major role in the study
area (i.e. Israeli control of open spaces and other suitable areas for development) see Figure
4.1. The analysis depends on the defined constraints to be used as guidelines and direction of
the study in achieving the desired result. The GIS functions involved in the process were the
overlay function, classification, proximity and measurement. The initial selection stage
consisted of two parts. The first part was an excluding process in which each constraint layer
such as areas for expansion, road buffers, and areas confisticated by Israelis within the

41
governorate which were already restricted were not included in the available areas of urban
development. In the second part of the initial selection stage, the potential areas that were a
result from the first step (the excluding process) were refined based on its shape or size. In
next part of this chapter, these potential sites from the initial selection process will be
evaluated according to the developed criteria. Figure 4.1 shows the general framework of the
two major phases that the research has gone through, i,e, (1) selection process (2) evaluation
process, where GIS and Multi criteria analysis are integrated. GIS allows describing and
analyzing different potential sites whereas Multi Criteria Analysis will then be applied to
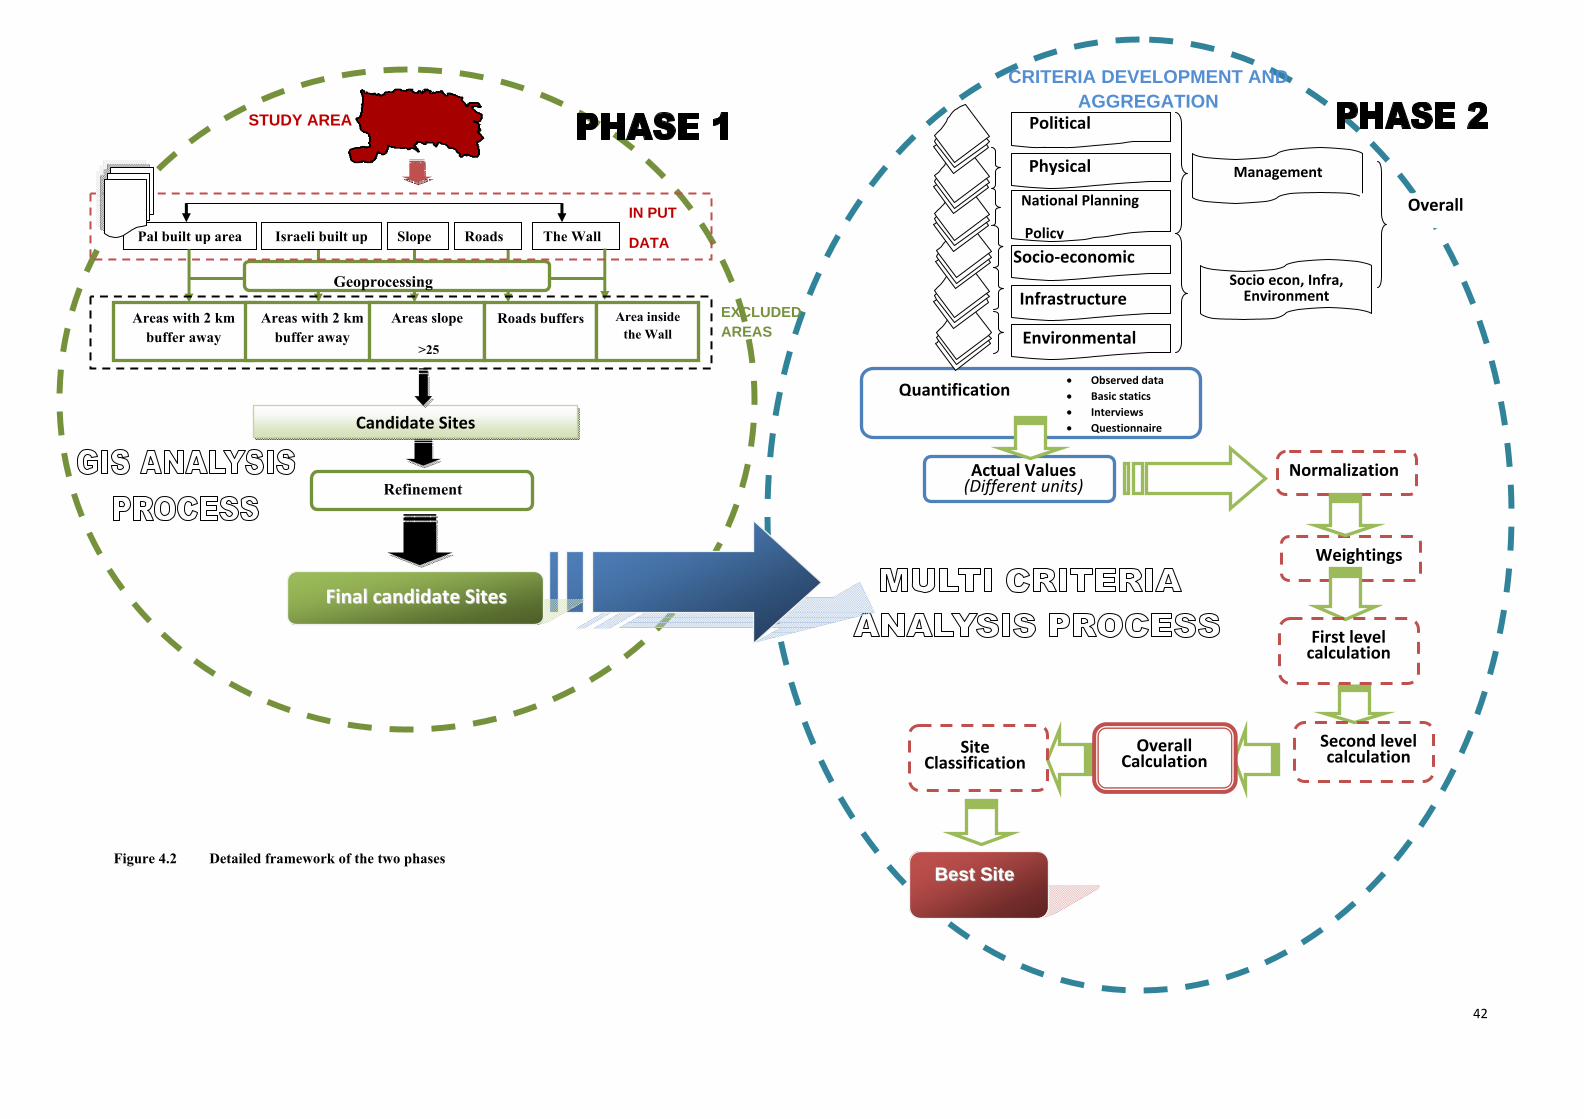
assess these sites. Figure 4.2 shows how buffer zones are assigned to the input criteria based
on adapted guidelines and the resulting areas are refined to produce the final candidate sites
in phase one, while in phase two show how the MCA was applied to compare these candidate
sites considering a set of parameters in order to find the most suitable site.
GIS ANALYSIS PROCESS
MULTI CRITERIA ANALYSIS
Figure 4.1 Simplified flow chart of the two major phases
FFiinnaall ccaannddiiddaattee SSiitteess
SSiittee SSeelleeccttiioonn
EEvvaalluuaattiioonn
BBeesstt SSiittee
42
Geoprocessing
Pal built up area Israeli built up Slope Roads The Wall
Areas with 2 km buffer away
Areas with 2 km buffer away
Areas slope
>25
Roads buffers Area inside the Wall
STUDY AREA
EXCLUDED AREAS
• Observed data • Basic statics • Interviews • Questionnaire
Weightings
IN PUT
DATA
CRITERIA DEVELOPMENT AND AGGREGATION
Quantification
Actual Values (Different units)
Normalization
Figure 4.2 Detailed framework of the two phases BBeesstt SSiittee
Geoprocessing
Candidate Sites
Refinement
Management
Political
Physical
National Planning
Policy
Infrastructure
Socio‐economic
Environmental
Socio econ, Infra, Environment
Overall
First level calculation
Second level calculation
FFiinnaall ccaannddiiddaattee SSiitteess
Overall Calculation
Site Classification

43
4.1.2 Site Selection Criteria description
Factors influencing the selection process of the sites were proposed by reviewing relevant
studies from the literature review and from a planners’ point of view. The considered factors
are: main urban centers slope more than 25%, Israeli colonies and military zones, The wall,
and road network. Following this procedure, maps were created for each constraining
criterion and a final composite map is produced by simple overlaying of the thematic maps.
Constraints are the exclusionary factors in the selection process. In this research, five basic
layers (thematic maps) were set as constraint layers where it was not allowed to plan any
future development. In order to find the suitable lands for development, areas were excluded
from the total in the governorate area. The following are the factors that considered in this
assessment:
1) Main urban center: In this Research, built up areas play a major role. This research
is trying to allocate new development areas near by those already existing areas,
taking into consideration the natural growth of these areas in order to avoid
overlapping between the proposed sites and the existing ones.
Figure 4.3 Main urban centers

44
(2) Israeli colonies and military areas:
The research dealt with these areas in the same way it dealt with the Palestinian urban
areas; where in the final status condition these areas will be transformed to the
Palestinian Authority so no need to propose any overlapping with the proposed
developmental sites (the outcome of the research). There are 30 Israeli colonies
located in the governorate, taking up about 30 Km2 of land.
Figure 4.4 The Israeli Colonies and Military areas
(3) The wall:
In Ramallah Al Bireh governorate, the wall extends along the western part of the
governorate (As written in the assumptions of the Research, the areas that were
annexed by the wall were excluded from the governorate area).

45
Figure 4.5 The wall route within the governorate
(4) Road network:
The road network in this district occupies a total area of 13.1 km2and is 695.9 km in
length. It is classified into three categories: local, regional, and bypass roads. In this
research, the total area of the regional (24 m width) and bypass road (70 m width)
were excluded from the study area.
Figure 4.6 The regional and bypass roads

46
(5) Slope: The slopes help to identify the maximum rate of change in surface value over a
specific distance and they are expressed in degrees or percentage (Anavberokhai,
2008). The map represents the slope in the Governorate. The cross section of the
governorate shows the undulating topography which stretches from the western slope
(350 m ASL) through the mountain ridge 800 m and goes to the Dead Sea (-100 m
ASL).
According to the MOLG, the sites on a slope above 25% are not suitable for urban
expansion and are considered as restricted areas.
Figure 4.7 Slope map of Ramallah Al Bireh Governorate
4.1.3 Site Selection analysis and preliminary results
In order to produce the initial site selection map, several GIS functions were conducted. The
five constraint layers were used to distinguish between lands that are suitable for urban areas
and those that are restricted. The map was produced by merging each individual layer with
the study area, then erasing the unsuitable land. This procedure produces a constraint map for
each layer. The consecutive exclusion process of all unsuitable land produces the final

47
constraint map which provides a large group of selected sites which comply with all the
initial criteria. Over 20 scattered areas were found to be suitable sites based on the initial
criteria. These selected sites are then refined by considering the size or the shape of the site.
(1) Main urban center: As mentioned previously, a 2 km buffer around the 14 main
urban centers was created in order to give room to absorb natural growth in these
areas in order to avoid overlapping between the proposed sites and the existing ones.
Figure 4.8 2 km buffers away as needed areas for expansion

48
(2) Israeli settlements and military areas:
Based on the assumption, 2 km buffer zones were created around the colonies and
military zones.
Figure 4.9 The Israeli Settlements and the 2 km buffers away as restricted zones

49
(3) The wall:
About 95 km2 were annexed by the wall. These areas were excluded from the
Governorate total areas.
Figure 4.10 The separation wall and the confisticated land behind that wall

50
(4) Road network: Data available about roads are symbolized as lines, in order to
convert these lines to areas; buffer zones were created around each road, 70 m buffer
for the regional roads and 24 for the regional road.
Figure 4.11 The regional and bypass road buffers as a mean of isolation the urban centers

51
(5) Slope: In this research, areas with steep slopes are not suitable for any urban
development. A TIN was generated from 10 m contour lines. Thus according to
MOLG a 25% slope is accepted.
Figure 4.12 Topography and slope maps of Ramallah Al Bireh Governorate

52
An analysis of suitable site selection was carried out, taking all the previously mentioned
factors into account. All buffer zones were combined in order to depict all constraints and
then were used to eliminate areas from consideration in the final analysis
Figure 4.13 Areas considered unsuitable for development
Figure 4.14 Output map before refinement

53
The resulting selected sites were then refined by considering the area and the shape of the site
in order to find the final output.
A suitable site for urban development must have a reasonable size with adequate open space,
circulation, and all the needed services. In this research, the site should have available
sufficient space to accommodate not less than 10,000 people. In order for the potential site to
be considered an urban area, such a population will need a minimum site area of 2.5 squared
kilometers when taking into consideration an area of 250 squared meters per person as
recommended by the MOLG.
4.1.3 Final Results
The final result obtained in this selection process is a map showing 13 sites which were
selected as potential areas for urban development by using GIS operations. Figure 4.14
shows the suitable sites for urban development and Table 4.1 provides some characteristics
of the final candidate sites. The 13 candidate sites which have been identified will be
evaluated. A multi-criteria decision analysis will be employed to signify the highest-ranking
site which will be described in the coming chapter.

54
Figure 4.15 Suitable areas (after overlaying)
Table 4.1 Characteristics of the potential sites NO. SITES Area (Km2) Nearest Locality Average Elevation (m)
1 Zone 1 18.74 Shuqqba, Qibya 500 2 Site 2 3.32 Rantis 150 3 Site 3 9.07 Aboud 400 4 Site 4 22.59 Turmus’ayya 200 5 Site 5 7.27 Rammun 700 6 Site 6 7.58 Badiw Al mua’rrajat 200 7 Site 7 29.23 Ein Samia 600 8 Site 8 5.99 Al Taybeh, Kufr Malik 350 9 Site 9 29.92 Badiw Al mua’rrajat 400
10 Site 10 10.94 Deir Ibzie’ 400 11 Site 11 4.89 Qarawet Bani Zeit 700 12 Site 12 11.60 Ein Samia 100 13 Site 13 18.88 Attara 100

55
4.2 Sites Evaluation and Analysis
4.2.1 Introduction
Urban development of any new urban area is influenced by several factors such as
physical, socio economic and environmental issues and amenities (Alsalabi, 2005). The 13
selected sites were analyzed and evaluated in order to rank them and to determine the most
ideal site. The Multi criteria Analysis (MCA) was followed and adopted as a decision-making
tool, it was used to make a comparative assessment of alternative sites taking into account
several points of view. Each step in the MCA process is described in details.
4.2 .2 Multi Criteria Analysis Methodology
Multi Criteria Analysis (MCA) is a methodology consisting of techniques for evaluating
options on individual, often conflicting criteria, and combining the separate evaluations into
one overall evaluation (Malczewki, 1999). The overall evaluation is achieved by establishing
preferences between options with reference to a set of defined objectives or criteria. The
extent of achievement of these objectives is then assessed by the established criteria but no
one option will obviously be best in achieving all objectives.
In this research, the evaluation method followed is based on the method which was developed
by UNESCO (1987, 1988).
(a) Criteria development and Aggregation
The first step of MCA is to develop a set of basic criteria covering social, economical,
environmental, political, national policy, natural recourses, infrastructure and other related
aspects, Table 4.2. These criteria were used to measure the impacts of developing urban
areas on all aspects.

56
As a second step of developing criteria, the basic level of criteria were grouped into second-
level and third level criteria as shown in Figure 4.16
Figure 4.16 The Framework of the Criteria
(b) Evaluation Criteria
This step is the most critical and time consuming one. Since the first level of criteria should
be calculated for the 13 selected sites, then the calculation method for each criterion should
be defined as shown in the coming section. This may involve the study of available
information such as observed data or basic statistics. In some cases, additional measurement
data could be required. In addition to criteria quantification, the ideal and the worst values of
each criterion should be also defined. The ideal values may correspond to either the lowest
value (i.e. distance to the center) or the highest value (i.e. distance to the pollution source) of
criteria.
(c) Normalization of basic criteria
Since units of basic criteria are different, such as percentages (%), prices (dollar/donum),
areas (km2) distance (km), the future trade-off analysis requires that the actual values should
First Criterion
Second Criterion
Third Criterion
Fourth Criterion
First Criterion
Second Criterion
Overall
First Level
Third Level
Second Level

57
be normalized, that is, transformed into the interval 0 – 1. The normalized value of criteria (i)
can be calculated as the following formula:
(1)
Where: Zi+ is the best value and Zi
- is the worst value in which Si =0 corresponds to the best
value, and Si =1 corresponds to the worst value
(d) Calculating the second level of criteria
The first level criteria Table 4.2 were grouped into second level criteria which include
political, physical, national policy, socio economic, environmental and infrastructure criteria;
the value of each group is calculated based on the values of normalized basic criterion with
the weight applied by the decision makers to each indicated group as follows:
(2)
Where
Si,j : Criteria i in group j.
αi,j : Weight applied to the ith indicated grouping;
nj : Criteria i in group j.
Lj : Represents the value of criteria
−+
+
−−
=ii
iii ZZ
ZZS
21
1
2⎥⎦
⎤⎢⎣
⎡= ∑
=
jn
iijijj SL α

58
(e) Calculating the third level of criteria
This step is conducted by grouping the second level criteria into a third level of criteria (two
criteria: socio-economic environmental and infrastructure criteria), the value of each third
group criteria is calculated as follows:
(3)
Where: k=1 , for management criteria
k=2 , for socio-economic and infrastructure and environmental criteria
mk: number of elements in each third level group
(f) Calculating the Overall Score
The result of the third-level formulation is two composite distances. The next step is done
with the following expression:
(4)
(g) Results Presentation
The overall score of each site will be presented graphically in 2D plane as shown in Figure
4.17. The location of each site in the plane represents the degree of achieving the ideal
location for developing a new urban area that satisfies all mentioned aspects. The X- axis
signifies the composite value of socio economic, environmental, and infrastructure which is
ranged from 0-1 and the Y- axis represents the composite value of management which also
ranges from 0-1.
21
1
2⎥⎦
⎤⎢⎣
⎡= ∑
=
km
jjkjkk LL α
[ ] 212
22211 LLL αα +=

59
Figure 4.17 Graphical representations of results
(h) Sites Classification using the 2D plane
The plane shown in Figure 4.18 is divided into three zones: sound, acceptable and poor
zones. The boundary of these zones is calculated based on Formula (5). This classification is
used to help the decision maker to filter the evaluated sites, i.e. all sites located in the poor
zone could be ignored.
( ) ( )[ ] 212
22
1 11 yx −+−= ααβ (5)
Where (x,y) = location of the sites on the plane
Ideal State Composite Distance For the Steady of the System (L)
Actual State
L
L
10 0
1
Composite Management Index (1-L2)
Composite Socio- economic, Infrastructure and environmental Index

60
Figure 4.18 Graphical representation of a set of ranked management
4.3 Development of Criteria for Site Evaluation
The first and the most sensitive stage of MCA is to develop the criteria which will be used to
quantify the impact of developing new urban areas on all aspects and then used for the overall
evaluation. The criteria were built on literature review and planning guidelines in the context
of the West Bank and also benefited from the last experiences in Europe and the Arab World
and from discussions with Palestinian planners and decision makers. The criteria were
selected based on six themes; political, physical, socio-economic, policy, environmental and
natural resources. Each of the themes was used to evaluate the suitability described below.
Composite Management Index
Composite Socio- economic, Infrastructure and environmental Index

61
4.3.1 Criteria Description
1. Political Criteria:
In Palestine, political issues play a major role in urban planning issues. The current political
condition imposed on Palestinians has its impact on urban development. It is important to
take into consideration all the currently imposed political conditions in this assessment,
bearing in mind that this in no way legitimizes the existence of any Israeli settlement, which
are illegal under International law and will be dismantled in the final status agreements. The
political criterion includes:
(1) Land Classification (Areas, A, B, C) which reflects the level of control and
administrative condition. The percentage of areas Type A, B, and C in each zone was
calculated by GIS, the ideal situation was assigned as that in which Palestinians have
full authority over their land and the worst condition is that in which Israelis have full
control over the Palestinian land.
(2) Distance from Israeli colony reflects the political sensitivity of any area to be allowed
or not allowed to establish any new development. The average aerial distance from each
site to the closest settlement in km is measured by using the GIS distance tool. In this
analysis, the farthest distance from the site to the settlement is considered as the ideal
condition, while the closest distance is the worst.
(3) Distance from the separation wall reflects the sensitivity of any site. The average
aerial distance from each site to the wall route in km is measured by using the GIS
distance tool. The farthest distance from each site to the wall is ideal situation; while any
site that is bordered by the wall is the worst.

62
2. Physical Criteria:
Physical characteristics affect the planning of urban development. Among the physical
factors that are commonly studied in residential site selection is slope and aspect which are
described as follows:
(1) Slope: According to Salabi (2005) the acceptable slope for residential development is
10%. According to Ministry of Local Governance, any area with slopes exceeding
25% is not suitable for urban development. The GIS Spatial analyst tool was used to
calculate the percentage of the slope. Areas with slope < 25% were determined as the
ideal condition, whereas the areas with slope > 25% were avoided because high costs
are involved in the planning in these areas.
(2) The aspect is the direction the slope faces. By using the spatial analyst, aspect was
derived for the study area. In Palestine the west and southwest exposures were
identified to be the suitable sites, the south is moderate suitable, and north took the
worst value.
(3) Land Continuity reflects the fragmentation and complexity of each potential zone for
urban development. According to the West Bank topography, it is difficult to find one
piece of land with a slope less than 25%, therefore, this criterion is considered to
measure the level of fragmentation of the suggested areas. In the analysis, the steep
slope areas are erased from the evaluated zone. It is measured by counting the number
of significant sub-zones within each zone. The most ideal values are those which
contain the minimum number of sub-areas, whereas the most fragmented zone is the
worst.

63
(4) Cadastre and land registration measures the general aspects of land delimitation
and documentation. It is designed to ensure property rights of individuals or the
government. The data was obtained from the Land Authority. The most ideal situation
is land which is totally cadastre, while the site that is totally not registered is the
worst.
(5) Site Size: is an important factor to be considered. This criterion measures the
availability of land to accommodate a designated number of people in each site. The
land area was calculated by using GIS. The result is the vacant land with a suitable
slope. Thus the maximum area is the ideal area while, the smallest site total area is the
worst.
3. National planning policy and guidelines criteria:
A national policy for urban growth provides important factors to solve the main problem of
the central city. A national policy for urban growth should show a clear strategy for directing
growth and development.
(1) Agreement to national perspectives reflects the level of preference of the site based
on the perspective of national plans and governmental vision. This criterion was
examined by interviewing planners from the Ministry of Local Governance and the
Ministry of Planning.
(2) Land Ownership shows the ownership properties of each zone. This information was
investigated from the Land Authority and from the local councils and municipalities,
the preference was for a site of public ownership as it minimizes the need for
negotiation and acquisition. According to the MOLG, the most ideal situation is when
64
100% of the zone is private owned while the worst is when the 100% is publicly
owned.
4. Socio- economic criteria:
The socio- economic aspects are the most important aspects according to the people
because they affect their daily lives such as the accessibility to reach their work, and other
daily activities. These aspects aim to make people lives easier as well as create a better
quality of life for the inhabitants, these aspects are:
(1) Accessibility is one of the important issues for new urban development as it provides
the link between the communities. (Al Salabi, 2005). Thus, the distance between each
zone and Ramallah center is important because it significantly impacts moving costs.
By using GIS tools, the travel distance between each zone and the center of Ramallah
was measured. Nearby sites are considered the ideal sites, and sites which are too far
away were considered the worst.
(2) Social Acceptance reflects the expected general public acceptance to live in the site.
This is measured by a questionnaire filled by a selected group (a selected group of
100 young people above the age of 18, currently living in Ramallah and searching for
a place to live). The ideal site is the site which gets the highest acceptance by the
public. The site with lowest acceptance is considered the worst.
(3) Land Prices reflect the value of the land. Land prices in an area are usually studied to
predict future trends. Here the prices vary from one place to another within the
governorate boundary. The average land price in each zone is investigated by asking

65
a number of land brokers in Ramallah-Al Bireh governorate. The lowest price is the
ideal price while the highest is the worst.
(4) Number of existing residences. The number of people living in/or surrounding area
of each zone reflects density of the site. The data was obtained from the PCBS census
year data. The site with the minimum number of people is the most ideal. The worst
site is the site with the highest number of people.
(5) Agricultural sites reflect the percentage of agricultural land in each site. The data
was obtained from calculating the area of the fertile lands (the field crops and olive
trees). It is a preference to consider the site with minimum agricultural land area as
an ideal site in order to prevent fertile land from being exposed to urban
development. The destruction of agricultural land will have many negative
implications on those relying on them for economic benefits; hence, the site with the
largest agricultural area is the worst.
(6) Cultural Heritage is an important measure. (i.e. the existence of significant
archeological or architectural monuments in the site). The site which has any
monuments or cultural site is considered to be an important resource and is in need
for protection. It also reflects the significance of the site. The locations of cultural
heritage areas and sites were obtained from MOP. Any zone that has a heritage site or
area took an advantage and is considered to be a most ideal site, while the site with
no archeological site is the worst

66
5. Infrastructure Criteria:
(1) Distance to water sources reflects the accessibility to a water supply. It is measured
by the distance of the proposed site from nearest reservoir. The closest distance is most
ideal. While the furthest distance is the worst, since it may involve high costs.
(2) Distance to electricity network reflects the accessibility to an electrical source. It is
the distance of the proposed site from an electrical source (high voltage transmission
line) which is the distance to the nearest built up area. The closest distance is most
ideal, while the furthest distance is the worst and may involve high costs.
6. Environmental Criteria:
The quality of environment in Palestine is rapidly deteriorating, mainly a consequence of air
pollution, groundwater pollution. Thus environmental issues have become a major concern
for planners.
(1) Green areas: the green area and the landscape areas percentage in each site increase
the aesthetic qualities of the site.
(2) Vulnerability to ground water reflects the sensitivity of each potential site to
groundwater pollution. The data that was obtained from HWE database, shows that
Ramallah-Al Bireh governorate was classified into 3 categories, from high vulnerable
to very low vulnerable The most ideal is when the potential site is located over a very
low sensitive area, and the worst, when the site is located over the high sensitive
areas.
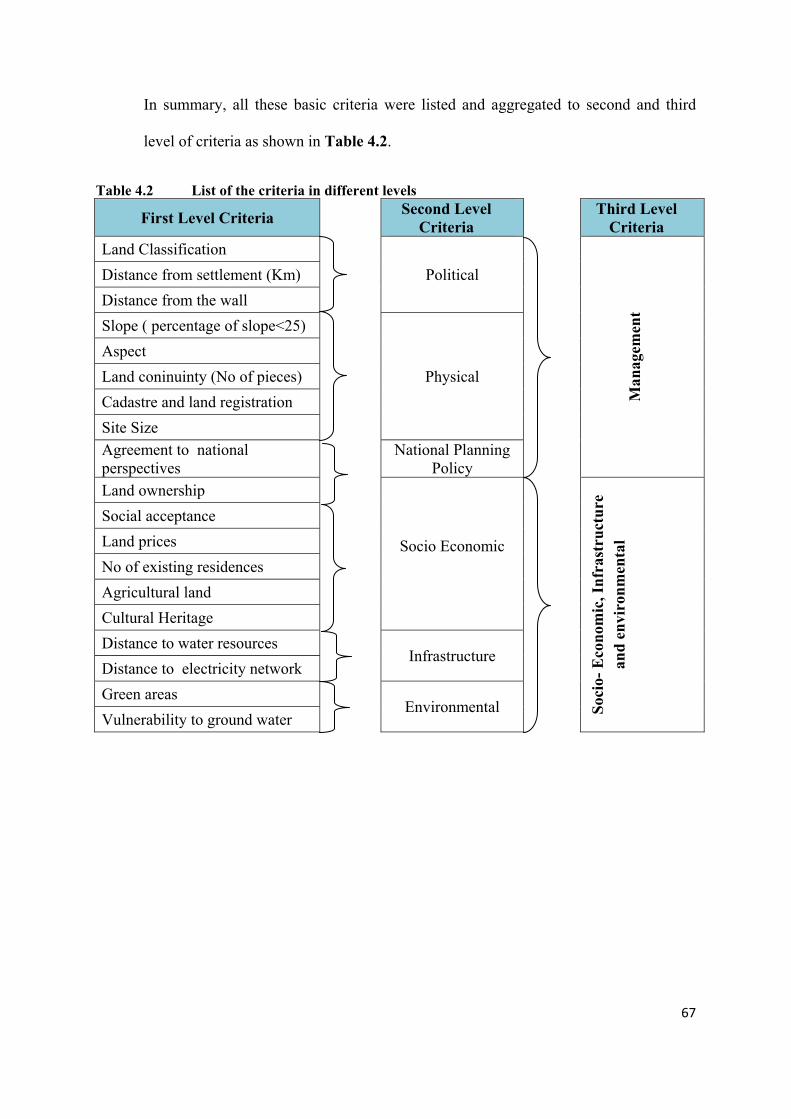
67
In summary, all these basic criteria were listed and aggregated to second and third
level of criteria as shown in Table 4.2.
Table 4.2 List of the criteria in different levels
First Level Criteria Second Level Criteria
Third Level Criteria
Land Classification
Political
Man
agem
ent
Distance from settlement (Km)
Distance from the wall
Slope ( percentage of slope<25)
Physical Aspect
Land coninuinty (No of pieces)
Cadastre and land registration
Site Size Agreement to national perspectives
National Planning Policy
Land ownership
Socio Economic
Soci
o- E
cono
mic
, Inf
rast
ruct
ure
and
envi
ronm
enta
l
Social acceptance
Land prices
No of existing residences
Agricultural land
Cultural Heritage
Distance to water resources Infrastructure
Distance to electricity network
Green areas Environmental
Vulnerability to ground water

68
4.4 Quantification of the actual values
Calculating the actual values of basic criteria: This step involves the study of available
information such as observed data or basic statistics. In some cases additional measurement
data could be required.
(1) Land Classification: The percentage of areas Type A, B, and C in each zone is
calculated by GIS. In this criterion, the value 0 was assigned for area A, 1 for area B and
2 for Area C.
CRi = Bi+2Ci
Where: CR i, criterion i
Bi : Percentage of area Type B
Ci : Percentage of area Type C
The values of land classification criteria for all suggested sites are shown in Table 4.3.
Table 4.3 The values of Criteria 1: Land Classification
Criterion 1 Site 1
Site 2 Site 3
Site 4
Site 5
Site 6
Site 7
Site 8
Site 9
Site 10
Site 11
Site 12
Site 13
Land Classification 1.83 2 1.35 1.29 1.37 2 2 1.23 2 1.52 0.12 2 0.33
When the site has an actual value of 2, this means that total area of the site is area Type C,
while any site has actual value 0 is totally area A.
(2) Distance to Settlement: The average aerial distance in km from each site to the closest
settlement in km is measured by using the GIS distance tool, Table 4.4.
Table 4.4 The values of Criteria 2: Distance to Settlement Criterion 2 Site
1 Site
2 Site
3 Site
4 Site
5 Site
6 Site
7 Site
8 Site
9 Site 10
Site 11
Site 12
Site 13
Distance to Settlement (km) 2 2 2 1.5 2.5 3 3 1.8 2 1 2 2.3 2

69
(3) Distance to the separation wall The average aerial distance from each site to the wall
route in km is measured by using the GIS distance tool. The value 0 means that the site
is bordered by the wall from one side, the values are showed in the Table 4.5.
Table 4.5 The values of Criteria 3: Distance to the separation wall Criterion 3 Site
1 Site
2 Site
3 Site
4 Site
5 Site
6 Site
7 Site
8 Site
9 Site 10
Site 11
Site 12
Site 13
Distance to the separation wall (km)
2 2 2 1.5 2.5 3 3 1.8 2 1 2 2.3 2
(4) Slope: GIS Spatial analyst tool was used to calculate the percentage of the slope by
using map calculator. Areas with slope < 25% was calculated, Table 4.6.
Table 4.6 The values of Criteria 4: Slope Criterion 4 Site
1 Site
2 Site
3 Site
4 Site
5 Site
6 Site
7 Site
8 Site
9 Site 10
Site 11
Site 12
Site 13
Slope (% of area < 25%) 94.5 91.6 79.2 84 93 93 54 86 65 73 63 60 49
(5) The aspect By using the spatial analyst, aspect was derived for the study area from the
slope. The value 0 was assigned for South and South West, the value 1 assigned for
East, West and Southeast. The value 2 assigned for North, Northeast and Northwest,
while the flat area was assigned with value 3. The values calculated as follows:
CRi = ASi W, E, SE +2ASi N, NE,NE+3ASi F
Where: CR i, criterion i
ASi : Percentage of area with specific aspect
W, E, SE: South and south west directions
N, NE, NW: North, Northeast and Northwest direction
F: Flat

70
The values of land classification criteria for all suggested sites are shown in Table 4.7.
Table 4.7 The values of Criterion 5: Aspect Criterion 5 Site
1 Site
2 Site
3 Site
4 Site
5 Site
6 Site
7 Site
8 Site
9 Site 10
Site 11
Site 12
Site 13
Aspect 1 0.94 1.1 1.2 0.94 0.94 0.98 0.95 1 1 1 0.98 0.95
(6) Land Continuity. It is measured by counting the number of sub-zones within the same
larger zone, table 4.8. Table 4.8 The values of Criterion 6: land continuity
Criterion 6 Site 1
Site 2
Site 3
Site 4
Site 5
Site 6
Site 7
Site 8
Site 9
Site 10
Site 11
Site 12
Site 13
land continuity (No of pieces) 3 1 16 9 1 2 64 4 48 27 21 58 127
(7) Cadastre and land registration: In this criterion, the value 0 was assigned for a site
with no cadastral. The value 1was assigned for the registered sites, Table 4.9.
Table 4.9 The values of Criterion 7: Cadastre and land registration Criterion 7 Site
1 Site
2 Site
3 Site
4 Site
5 Site
6 Site
7 Site
8 Site
9 Site 10
Site 11
Site 12
Site 13
Cadastre and land registration 0 0 0 1 1 0 0 1 0 1 1 0 1
(8) Available land for building: (Vacant Land): The land area is calculated in square
kilometers by using GIS. The result is the vacant land with a suitable slope.
Criterion 8 (Vacant land) = Total area-(built up + natural reserved )
CRi = Ai-(Ai
BLT + AiNR)
Where: A i, Total Area
AiBLT : Built up Areas
AiNR: Natural Reserved Areas
The values of land classification criteria for all suggested sites are shown in Table 4.10.
Table 4.10 The values of Criterion 8: Available land for building Criterion 8 Site
1 Site
2 Site
3 Site
4 Site
5 Site
6 Site
7 Site
8 Site
9 Site 10
Site 11
Site 12
Site 13
Available land for building
14.8 3 5.2 14.3 5.7 7.1 14.4 4.9 19.4 6.7 2.8 6.9 8.5

71
(9) Agreement to national perspective. This criterion was examined by the survey
planners and decision makers in the Ministry of Local Governance and the Ministry of
Planning. It ranks the sites regarding to the degree of agreement, Table 4.11.
Table 4.11 The values of Criterion 9: Agreement to national perspective Criterion 9 Site
1 Site
2 Site
3 Site
4 Site
5 Site
6 Site
7 Site
8 Site
9 Site 10
Site 11
Site 12
Site 13
Agreement to national perspective
5 11 6 2 7 12 10 3 9 13 8 4 1
(10) Landownership: In this criterion, the value 0 was assigned for site where the
majority of the land is private land, the value 1 was assigned for the land that is
governmental land and waqf land , and the value 2 assigned for the unknown
landownership, Table 4.12.
Table 4.12 The values of Criterion 10: Landownership Criterion 9 Site
1 Site
2 Site
3 Site
4 Site
5 Site
6 Site
7 Site
8 Site
9 Site 10
Site 11
Site 12
Site 13
Landownership 0 0 0 1 1 2 0 2 2 0 0 2 0
(11) Accessibility (Access to Ramallah (min/trip): By using GIS tools, the travel
distance in kilometer between each zone and the center of Ramallah was measured, Table
4.13.
Table 4.13 The values of Criterion 11: Distance to city center
Criterion 11 Site 1
Site 2
Site 3
Site 4
Site 5
Site 6
Site 7
Site 8
Site 9
Site 10
Site 11
Site 12
Site 13
Distance to city Center (km) 23 32 24 22 13 28 28 15 13.5 18 18 18 12.5
(12) Agricultural Area: The land area is calculated in square kilometers by using GIS.
Agricultural areas include the field crops and the olive trees, Table 4.14.

72
Table 4.14 The values of Criterion 11: Agricultural land Criterion 12 Site
1 Site
2 Site
3 Site
4 Site
5 Site
6 Site
7 Site
8 Site
9 Site 10
Site 11
Site 12
Site 13
agricultural land (km2)
1.23 0.0 0.19 3.6 1.04 0.0 1.66 0.53 1.14 0.0 0.00 0.0 0.76
(13) Cultural Heritage is an important measure. The site which has any monuments or
site considered to be an important resource in need for protection was given a score of 1,
while the site which has no archeological site took a score 0, Table 4.15.
Table 4.15 The values of Criterion 13: Cultural heritage Criterion 13 Site
1 Site
2 Site
3 Site
4 Site
5 Site
6 Site
7 Site
8 Site
9 Site 10
Site 11
Site 12
Site 13
Cultural Heritage
1 0 0 0 0 0 1 0 0 1 0 0 0
(14) Social Acceptance reflects the expected general public acceptance to live in the site.
This is measured by a questionnaire for a selected group. Each site has a percentage of
acceptances by public, Table 4.16.
Table 4.16 The values of Criterion 14: Social acceptance Criterion 14 Site
1 Site
2 Site
3 Site
4 Site
5 Site
6 Site
7 Site
8 Site
9 Site 10
Site 11
Site 12
Site 13
Social Acceptance (%) 0 0 3 17 17 4.5 0 10.5 6 9 6 1 26
(15) Land Prices The average land price in each zone is investigated by asking a number
of land brokers in Ramallah-Al Bireh governorate, Table 4.17.
Table 4.17 The values of Criterion 15: Average land price
Criterion 15 Site 1
Site 2
Site 3
Site 4
Site 5
Site 6
Site 7
Site 8
Site 9
Site 10
Site 11
Site 12
Site 13
Average Land Price (1000US dollar/donum)
8.5 4 8.5 55 12.5 3.75 8.5 11 4.75 17.5 12.5 7.5 17.5
(16) Number of existing residences. The number of people in the surrounding area of
each zone reflects the density of the site. The data was obtained from the PCBS census data,
Table 4.18.

73
Table 4.18 The values of Criterion 16: Number of existing residences Criterion
16 Site 1
Site 2
Site 3
Site 4
Site 5
Site 6
Site 7
Site 8
Site 9
Site 10
Site 11
Site 12
Site 13
Number of existing residences
12531 0 5269 9494 2469 0 0 1364 0 11307 6250 0 6431
(17) Distance to water Sources reflects the accessibility to the water source. It is
measured by the aerial distance of the proposed site from the nearest reservoir, Table
4.19.
Table 4.19 The values of Criterion 17: Distance to water sources
Criterion 17 Site 1
Site 2
Site 3
Site 4 Site 5
Site 6
Site 7
Site 8
Site 9
Site 10
Site 11
Site 12
Site 13
Distance to Water Sources (km)
2.5 1.5 1.5 1.5 1 1 0 2 1 1 1 0 2
(18) Distance to electricity network reflects the accessibility to an electrical source. It is
measured by the distance of the proposed site from electrical source (high voltage
transmission line) which is the distance to the nearest built up area, Table 4.20.
Table 4.20 The values of Criterion 18: Distance to electricity network
Criterion 18 Site 1
Site 2
Site 3
Site 4 Site 5
Site 6
Site 7
Site 8
Site 9
Site 10
Site 11
Site 12
Site 13
Distance to Electricity network (km)
2.5 1.5 1.5 1.5 1 1 0 2 1 1 1 0 2
(19) Green areas: The green area and the landscape areas percentage in each site increase
the aesthetic qualities of the site. By using GIS tools, the percentage of green area was
calculated, Table 4.21.
Table 4.21 The values of Criterion 19: Green areas
Criterion 17 Site 1
Site 2
Site 3
Site 4
Site 5
Site 6
Site 7
Site 8
Site 9
Site 10
Site 11
Site 12
Site 13
Green Areas (%) 42.65 23.3 49 41.6 49.5 0 6.1 59.8
3 4.1 41.5 62 0.25 49

74
(20) Vulnerability to ground water reflects the sensitivity of each site to groundwater
pollution. The data was obtained from the HWE database and shows that the Ramallah-
Al Bireh governorate is classified as high vulnerable to moderate and low vulnerable.
The value 0 assigned to high vulnerable areas, 1 for moderate and 2 for the low
vulnerable, Table 4.22.
Table 4.22 The values of Criterion 20: Vulnerability to ground water
Criterion 20 Site 1
Site 2
Site 3
Site 4 Site 5
Site 6
Site 7
Site 8
Site 9
Site 10
Site 11
Site 12
Site 13
Vulnerability to ground water
1 1 0 0 0 2 0 1 0 1 1 0 2
In summary, the quantified values for the 13 suggested sites are shown in the Table 4.23;
also, Table 4.24 shows the ideal and worst values of each criterion.
Table 4.23 The quantified value of each site

75
Table 4.24 Ideal and worse value of each site
4.5 Normalization of basic criteria
Subsequently the actual values for each criterion are required to be normalized, Table 4.25
that is transformed into the interval 0-1 the normalized value of criteria (i) can be calculated
as formula (1) described in Section 4.2.1 (c).
Table 4.25 The actual values of criterion for each site
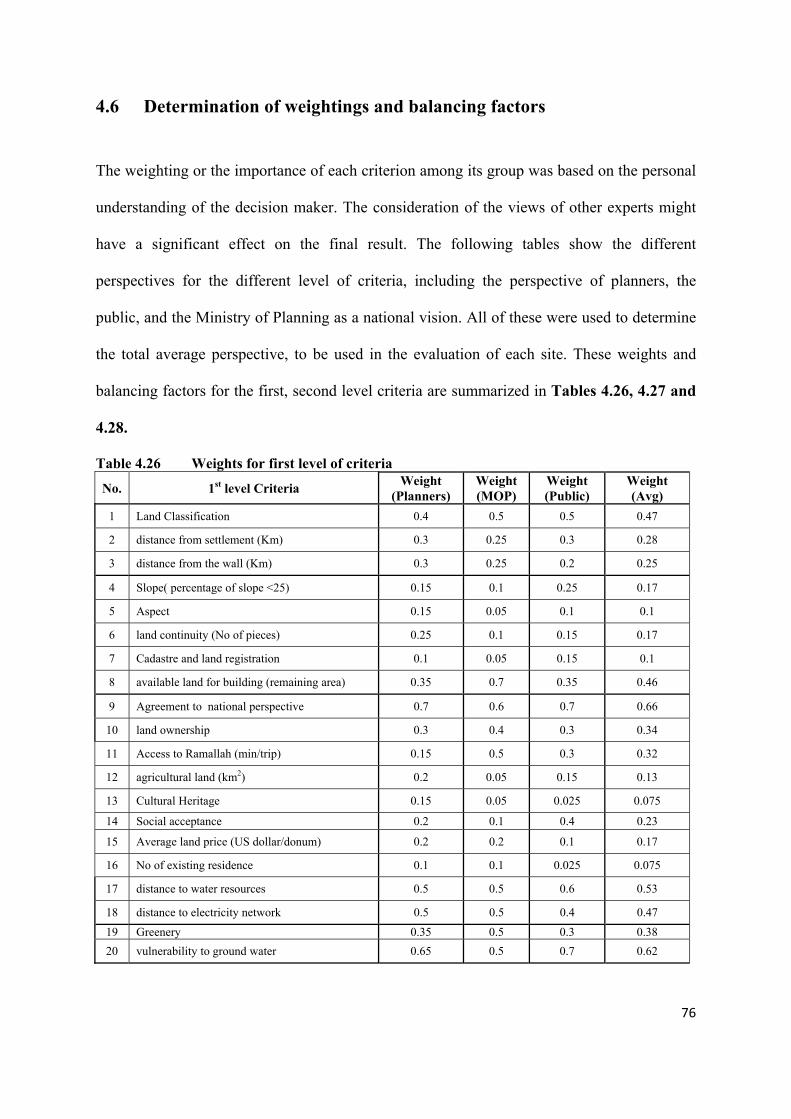
76
4.6 Determination of weightings and balancing factors
The weighting or the importance of each criterion among its group was based on the personal
understanding of the decision maker. The consideration of the views of other experts might
have a significant effect on the final result. The following tables show the different
perspectives for the different level of criteria, including the perspective of planners, the
public, and the Ministry of Planning as a national vision. All of these were used to determine
the total average perspective, to be used in the evaluation of each site. These weights and
balancing factors for the first, second level criteria are summarized in Tables 4.26, 4.27 and
4.28.
Table 4.26 Weights for first level of criteria
No. 1st level Criteria Weight (Planners)
Weight (MOP)
Weight (Public)
Weight (Avg)
1 Land Classification 0.4 0.5 0.5 0.47
2 distance from settlement (Km) 0.3 0.25 0.3 0.28
3 distance from the wall (Km) 0.3 0.25 0.2 0.25
4 Slope( percentage of slope <25) 0.15 0.1 0.25 0.17
5 Aspect 0.15 0.05 0.1 0.1
6 land continuity (No of pieces) 0.25 0.1 0.15 0.17
7 Cadastre and land registration 0.1 0.05 0.15 0.1
8 available land for building (remaining area) 0.35 0.7 0.35 0.46
9 Agreement to national perspective 0.7 0.6 0.7 0.66
10 land ownership 0.3 0.4 0.3 0.34
11 Access to Ramallah (min/trip) 0.15 0.5 0.3 0.32
12 agricultural land (km2) 0.2 0.05 0.15 0.13
13 Cultural Heritage 0.15 0.05 0.025 0.075
14 Social acceptance 0.2 0.1 0.4 0.23
15 Average land price (US dollar/donum) 0.2 0.2 0.1 0.17
16 No of existing residence 0.1 0.1 0.025 0.075
17 distance to water resources 0.5 0.5 0.6 0.53
18 distance to electricity network 0.5 0.5 0.4 0.47 19 Greenery 0.35 0.5 0.3 0.38 20 vulnerability to ground water 0.65 0.5 0.7 0.62

77
Table 4.27 Weights for second level criteria No. Criteria (Second Level) Weight
(Planners) Weight (MOP)
Weight (Public) Weight (Avg)
1 Political 0.3 0.1 0.2 0.20 2 Physical 0.5 0.2 0.4 0.35 3 National Planning Policy 0.2 0.7 0.5 0.45 4 Socio-economic 0.5 0.4 0.6 0.5 5 Infrastructure 0.2 0.4 0.15 0.25 7 Environmental 0.3 0.2 0.25 0.25 Table 4.28 Weights for third level criteria No. Criteria (Second Level) Weight
(Planners) Weight (MOP)
Weight (Public) Weight (Avg)
1 Management 0.6 0.7 0.45 0.58 2 Socio-economic environmental and
Infrastrucre Aspects 0.4 0.3 0.55 0.42
4.7 Quantifying the values of second and third levels of criteria
Based on the normalized values of basic criteria and the suggested weights estimated in the
previous section, the values of the second and the third level of criteria were calculated.
According to Formula 4 and 5 described in Sections 4.2.1 (g) and (h), the results are
summarized in the Tables 4.29 and 4.30.
Table 4.29 The scores of the second level criteria according to average perspectives
No. 2nd Level Criteria
Site 1
Site 2
Site 3
Site 4
Site 5
Site 6
Site 7
Site 8
Site 9
Site 10
Site 11
Site 12
Site 13
1 Political 0.88 0.92 0.77 0.71 0.52 0.71 0.69 0.61 0.82 0.80 0.54 0.73 0.47
2 Physical 0.38 0.74 0.68 0.25 0.57 0.60 0.57 0.60 0.45 0.57 0.75 0.71 0.74
3 National
Planning Policy
0.27 0.68 0.34 0.30 0.50 0.95 0.61 0.60 0.80 0.81 0.47 0.62 0.00
4 Socio-Economic 0.70 0.74 0.60 0.80 0.50 0.60 0.73 0.31 0.39 0.52 0.43 0.49 0.19
5 Infrastructure 0.73 0.44 0.44 0.44 0.30 0.74 0.05 0.58 0.38 0.29 0.29 0.20 0.58
6 Environmental 0.44 0.55 0.13 0.20 0.12 1.00 0.56 0.39 0.58 0.44 0.39 0.61 0.80
Table 4.30 The scores of the third level criteria according to average perspectives
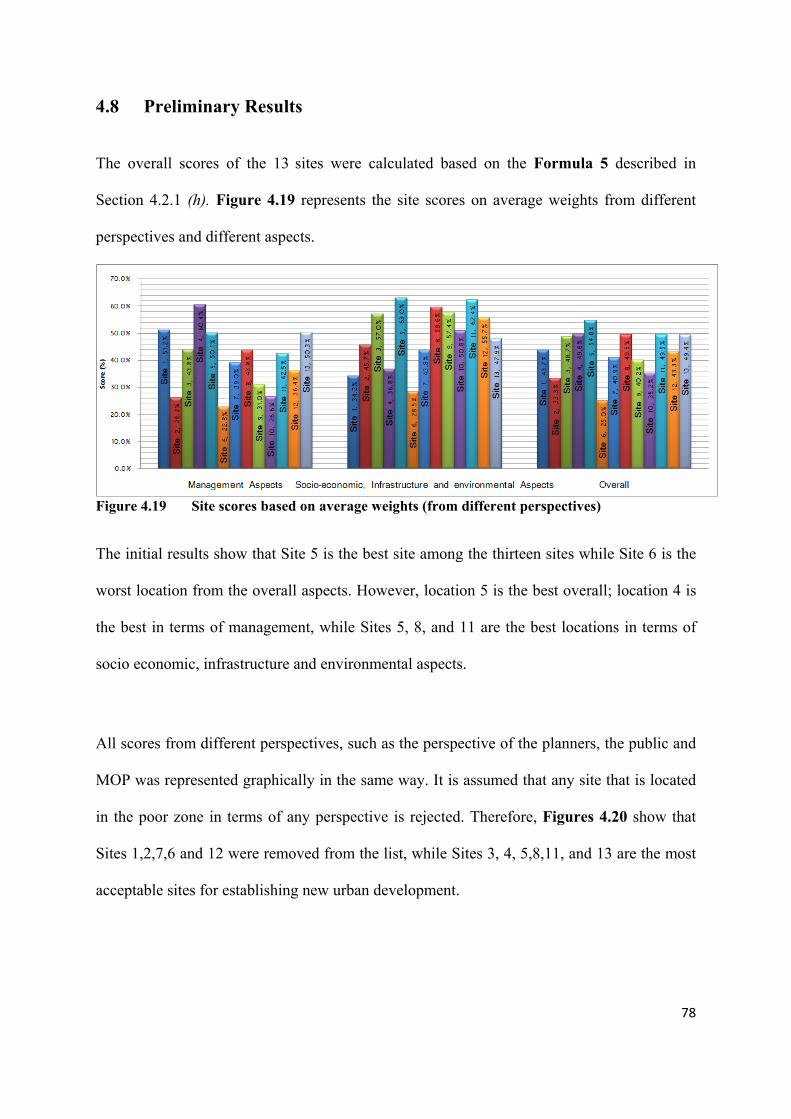
78
4.8 Preliminary Results
The overall scores of the 13 sites were calculated based on the Formula 5 described in
Section 4.2.1 (h). Figure 4.19 represents the site scores on average weights from different
perspectives and different aspects.
Figure 4.19 Site scores based on average weights (from different perspectives)
The initial results show that Site 5 is the best site among the thirteen sites while Site 6 is the
worst location from the overall aspects. However, location 5 is the best overall; location 4 is
the best in terms of management, while Sites 5, 8, and 11 are the best locations in terms of
socio economic, infrastructure and environmental aspects.
All scores from different perspectives, such as the perspective of the planners, the public and
MOP was represented graphically in the same way. It is assumed that any site that is located
in the poor zone in terms of any perspective is rejected. Therefore, Figures 4.20 show that
Sites 1,2,7,6 and 12 were removed from the list, while Sites 3, 4, 5,8,11, and 13 are the most
acceptable sites for establishing new urban development.

79
Figure 4.20 Graphical representation of a set of ranked all sites based on different
perspectives
Figure 4.21 shows the classification of the 13 sites according to their acceptance. The six accepted sites
are considered the best sites for urban development and will be analyzed and ranked in the coming section.
Ideal Site Ideal Site
Ideal Site Ideal Site
A: Average perspective
C: MOP perspective
B: Planner perspective
D: Public perspective

80
Figure 4.21 Classified sites according to their acceptance
4.9 Final Results and Discussion
The results obtained after the detailed analysis of the selected six sites are in Table 4.31.
Also, Table 4.32 shows the summarized sites ranking. The red color indicates the accepted
sites where the green colors indicate the least acceptable sites. Figure 4.22. Based on the
management aspects, site 4 (near Turmus’yya) is the most acceptable site while Site 8 (near
Al Taybeh) is the least acceptable site. In general, the accepted sites were ranked as the
following: 4, 13, 5, and 3,11,8 respectively. On the other hand, according to Socio-economic,
infrastructure, and environmental aspects Site 5 (near Rammun) is the best site while Site 4
(near Turmus’yya) is the worst. In general, the sites were ranked 5, 11, 8, 3, 13, and 4
respectively. From an overall perspective, Site 5(near Rammun) is the best site while Site 3
(near Abud) is the worst site.

81
Table 4.31 Summary of the most acceptable sites from different perspectives
Table 4.32 Most acceptable sites ranked according to their suitability
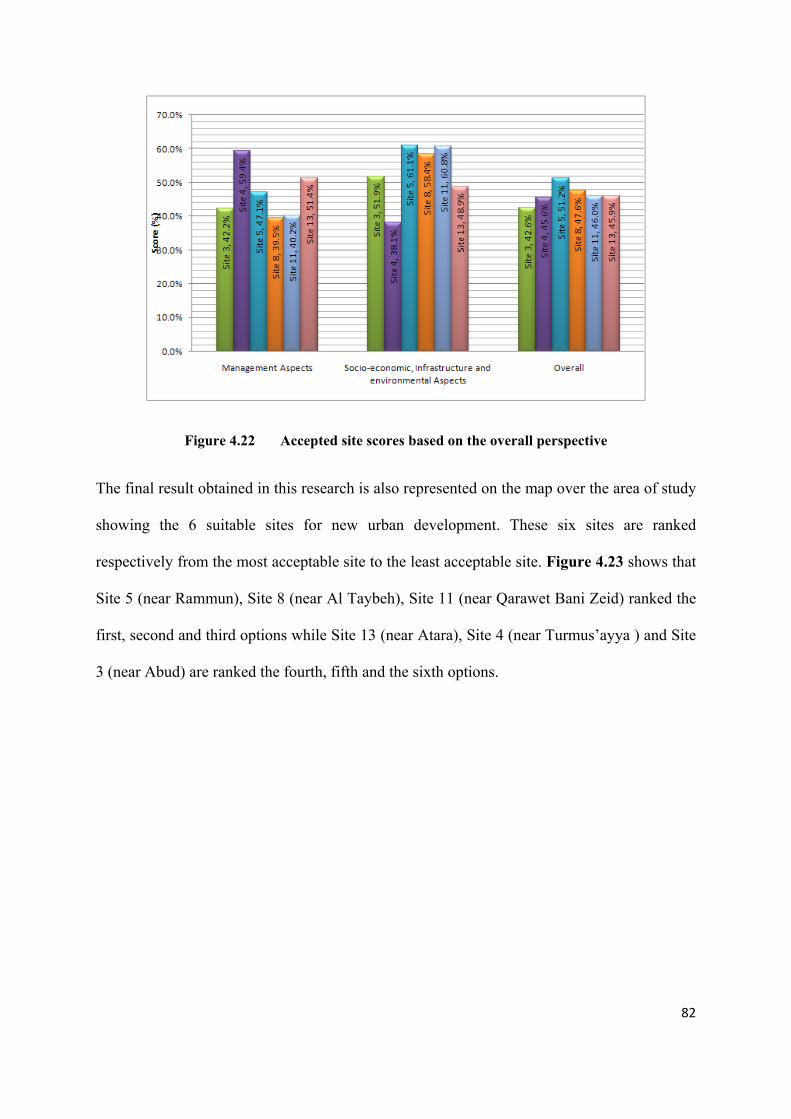
82
Figure 4.22 Accepted site scores based on the overall perspective
The final result obtained in this research is also represented on the map over the area of study
showing the 6 suitable sites for new urban development. These six sites are ranked
respectively from the most acceptable site to the least acceptable site. Figure 4.23 shows that
Site 5 (near Rammun), Site 8 (near Al Taybeh), Site 11 (near Qarawet Bani Zeid) ranked the
first, second and third options while Site 13 (near Atara), Site 4 (near Turmus’ayya ) and Site
3 (near Abud) are ranked the fourth, fifth and the sixth options.

83
Figure 4.23 Ranked sites according to average overall perspective
4.10 Description of the best Site:
Of the six potential sites, Site 5 (near Rammun) is the most suitable site in terms of overall
perspectives. The site is located in the south central of the Governorate; it faces the coastal
area of Palestine, 12 km east of Ramallah Figure 4.24. The site has a reasonable size (7.22
km2) to be considered an urban area. It is located near Rammun village where it forms a
significant point in the landscape, being situated on and around the summit of a hill and
visible from all directions to Ramallah. Moreover, the site gained the high acceptance from
the people who filled the questionnaire due to its closeness to the Ramallah and its
remarkable environment.

84
Figure 4.24 Location of the best site

85
Chapter Five: Conclusion and Recommendations

86
5.1 Conclusion
Land is a scarce resource all over the world. The population of the world is increasing while
the land is limited. In Ramallah-Al Bireh governorate, like all other West Bank governorates,
land is considered a very limited resource. In the status quo scenario, the urban expansion of
Ramallah-Al Bireh governorate’s main cities has reached its limits from all directions. On the
other hand, the Ramallah-Al Bireh governorate unlike other West Bank governorates is still
experiencing a population boom accompanied by a significant pressure on services and
employment opportunities and the need to provide appropriate accommodation for all people
coming in from all over the West Bank, cities, villages and camps. So there is an urgent need
to think about the means of finding places where the newcomers can live and ease the
pressure on the city center and create residential accommodation close to their work places
and provide them with a better environment.
The 13 sites selected in the initial selection process were evaluated to determine the most
suitable site. In the second part of analysis, the Multi Criteria Analysis (MCA) was followed
and adopted as a decision making tool. The criteria which were selected to evaluate the
potential sites were built on the literature review and planning guidelines in the context of the
West Bank and took into consideration experiences in Europe and the Arab World and from
discussions with Palestinian planners and decision makers. The criteria were selected based
on six themes; political, physical, socio-economic, national policy, environmental and
infrastructure networks. Each of the themes was used to evaluate the suitability of each site.
The evaluation process took into consideration different perspectives, and these include the
perspective of planners, the public, and the Ministry of Planning as a national vision. All of
these were used to determine the total average perspective to be used in the evaluation of
each site.

87
The sites were then ranked based on their distances from the ideal point and can be shown on
a graphical plot for Good, Acceptable and Poor sites.
A graphical plot of each site was drawn to represent the Management-socio economic,
environmental and infrastructure relationship to determine the distance of each site from the
ideal sites as a result of the analysis and through different perspectives, 6 sites were identified
as acceptable sites for new development, while the other 7 sites were excluded. These 6
acceptable sites were evaluated in detail in order to determine the most ideal location.
The result of the research showed that Site 4 (near Turmus’ayya) was the most suitable
location in terms of management aspects. This site is followed by Site 13 (near Atara), Site 5
(near Rammun) , Site 3 (near Aboud), Site 11 (near Qarawa bani zeid) while Site 8 (near Al
Taybeh) is the least acceptable among the six sites. This result is shown in Figure 5.1
Figure 5.1 The ranked sites according to management aspects.

88
On the other hand, Site 5 (near Rammun) is the most suitable site in terms of the socio-
economic, environmental and infrastructure aspects. This site is followed by Site 8 (near Al
Taybeh), Site 11 (near Qaraweh bani zeid), Site 13 (near Atara), whereas Site 3 (near
Aboud), and Site 4 (near Turmus’ayya) are the least acceptable sites.
Figure 5.2 Ranked sites according to socio-economic, environmental and infrastructure aspects.
Finally, in terms of overall perspectives, Site 5 (near Rammun) is the most acceptable site
while Site 3 (near Aboud) is the least acceptable site.
Figure 5.3 Ranked sites according to overall perspective

89
5.2 Recommendations
It is clear from this research that finding place for new urban development is urgently
required to achieve a better quality of life for the Palestinian people. Site selection criteria
were developed as well as a methodology for evaluating and ranking these sites.
During this research, it was found that refined guidelines are still needed in order to achieve
more accurate results and determine more useful decision-making. It is recommended to take
a number of preparation steps at a national level to facilitate adapting this methodology as
national guidelines for developing new urban areas.
1. Establishing a united data information center to ensure completed comprehensive,
accurate, updated, and easily accessed information which is consistent with
developing a GIS based model which has the capability of easily modifying the data.
2. Improving coordination among the related governmental and private organizations.
This can avoid research duplications, the waste of time, and incorrect results, and this
will positively affect decision-making and give accurate results and decisions.
3. There is a need to do further studies in order to do a detailed study for each of the
West Bank’s governorate in order to identify the possibilities of finding future urban
development areas.
4. Special attention is required to the vacant developable areas either by developing
some existing centers or establishing new centers in order to protect them from
confiscation by the Israelis.
5. Enhancing the coordination between the governmental, private and universities to
support researchers in terms of finance, information and expertise.

90
6. Increasing public awareness to increase the cooperation between public and
governmental and private organizations.
This research has also generated several questions which must be answered these include:
• What types of new urban development do we need (i.e. cities, towns,
suburbs)?
• What about developing existing suburban communities around major
cities?
• Is there a need to come up with a standard for individual share in built
environment and his/ her share in urban open spaces?
Through adapting a scientific approach such is the one developed and applied in this
research; the answers to these questions may be discovered.
I do strongly believe that this research does meet the goals of scientific research because
it adds more concrete information and adds a lot to knowledge. This research is a unique
one since it is the first Research taking all the applied variables and the process could be
applicable else where.
91
References:
• Abu Ghoush, A , Abu Sada, J., and Suboh, S. (2008) Impact on Urban Expansion;
Ramallah case study. Urban Planning in Palestine: Current Challenges & Future
Prospects, Conference Proceedings, An Najah National University, Palestine.
• Anavberokhai, O. (2008). Introducing GIS and Multi-criteria analysis in road path
planning process in Nigeria, A case study of Lokoja, Kogi State. Master Thesis,
University of Gävle, Sweden.
• Aliewi, A., Abu Sadah, M., Ghannam, S., Yaqubi, A., Mimi, Z., Jayyousi, A. (2005).
Assessment of the Supply/Demand Gap and Evaluation of the Sustainable Measures
towards Sustainable Water Resources in Palestine. House of Water and Environment
(HWE), Palestinian Water Authority (PWA), Birzeit University and An Najah
University.
• Applied Research Institute-Jerusalem-ARIJ (2005), Monitoring Israeli Colonizing
activities in the Palestinian West Bank and Gaza , http://www.poica.org/pal-in-a-
century/pal-in-century.php
• Applied Research Institute-Jerusalem-ARIJ (2006), The Geopolitical Status in
Ramallah Governorate, fact sheet prepared of project entitled Monitoring Israeli
Settlement Activities in Palestinian Territories
• Applied Research Institute-Jerusalem-ARIJ (2006), The Israeli Violations against the
Palestinian Environment. Palestine.
• Applied Research Institute-Jerusalem-ARIJ (2007). www.arij.org
• Bennett J. (2005), From New Towns to Growth Areas Learning from the past. IPPR,
London. Bryman, A. (2004), Social Research Methods, 2nd ed.

92
• Bubar, A. et al (2008) Site Suitability for New Residential Developments in North
Bay, Ontario Using GIS. Master Thesis submitted to Nipissing University Dept. of
Geography, Canada.
• Coon, A. (1991), Development Plans in the West Bank,” The Geographical Journal 21
(4) 363-73.
• Clapp, J. (1971), New Towns and urban policy ; planning metropolitan growth.
New York, New York, Dunellen
• Cohen, B. (2003), Growth in Developing Countries: A Review of Current Trends and
a Caution Regarding Existing Forecasts, Elsevier Ltd (World Development Vol. 32,
No. 1, pp. 23–51, 2004).
• Golany, G. (1976), New-town planning: principles and practice
A Wiley-Interscience publication, New York.
• Grant, J. (2006) Planning the Good Community: New Urbanism in Theory and
Practice (Routledge, London).
• Hildebrand F. (2005), H., Designing the City, towards a more sustainable Urban form,
Taylor & Francis.
• Hobson J. (1999) New towns, the modernist planning project and social justice the
cases of milton keynes, uk and 6th october, Egypt, Development Planning Unit,
University College London, UK.
• House of Water and Environment Data Bank, www.hwe.org.ps
• Jianquan, C and Masser, L. (2003) Towards a Spatial Analysis Framework: Modelling
Urban Development Patterns., International Institute for Aerospace Survey and Earth
Sciences, The Netherlands.
• Khamaiseh, R. (2006). The International experience in new towns building

93
• Khamaiseh, R. (2006). Planning and developing a new Palestinian core under
conditional Israeli Occupation. 42nd ISoCaRP Congress 2006, Istanbul, Turkey.
• Malczewski , J. (1999), GIS and Multicriteria Decision Analysis,: John Wiley and
Sons, New York.
• Ministry of Planning and Cooperation MOP, (1998) The Regional Plan for the West
Bank Governorates, Ramallah.
• Negotiation Affairs Department (NAD). Retrieved 26/3/2009 from, http://www.nad-
plo.org/listing.php?view=maps_borders
• Niruz, I. (2004). Ramallah: Geography, History and Civilization. Dar Al-Sharq Press,
Ramallah, Palestine, First Edition.
• Palestinian Central Bureau of Statistics (PCBS), (2007) Land Use Statistics in the
Palestinian Territory, Ramallah
• Palestinian Academic Society for the Study-PASSIA, http://www.passia.org.
• Palestinian Central Bureau of Statistics (PCBS), (2008) Census Final Results in The
West Bank Summary (Population and Housing), Ramallah
• Palestinian Central Bureau of Statistics (PCBS), (2009) Census Final Results –
Summary (Population, Buildings, Housing, Establishments) Ramallah & Al Bireh
Governerate, Ramallah.
• Palestinian Central Bureau of Statistics (PCBS), (2009): Main Indicators by Locality
Type, Ramallah
• Palestinian Central Bureau of Statics, http://www.pcbs.gov.ps/Census2007
• Pakzad, J. et al (2007). Assessment of New Towns Self Sufficiency Based on
Working and Non-working Trips by Mathematical Models, Int. J. Contemp. Math.
Sci., Vol. 2, 2007, no. 12, 591 – 600.
94
• Population Reference Bureau (2005). World Population Data Sheet , ISSN 0085-8315,
Washington, DC, US.
• Praeger (1969), the new city. National committee on urban growth policy, Canty, D.
Ed.
• Pugh, C. (1995). Urbanization in Developing countries; An overview of economic and
policy issues in the 1990s. Sheffied Hallam University, UK.
• Rawabi Maps. Retrieved 26/05/2009
http://www.rawabi.ps/maps.php?link=1&page=no
• Suisman, D. et al (2005). “The Arc: A Formal Structure for a Palestinian State,” Rand
Corporation.
• Saleh, B. and Al Rawashdeh, S. (2007), Study of Urban Expansion in Jordanian Cities
Using GIS and Remote Sensing. International Journal of Applied Science and
Engineering 2007. 5, 1: 41-52
• Sanders F. and Ruiter W. (1998), Physical Planning, policies, methods and
techniques, TU University, The Netherlands.
• Sha’at , A. (2000) Planning in Palestine: The Challenges, Ministry of Planning.
• Stewart, D. (1996) Cities in the Desert: The Egyptian New-Town Programme, Annals
of the Association of American Geographers, Vol. 86, No. 3. (Sep., 1996), pp. 459-
480.
• Sprawl City, US Bureau of Census Data on Urbanized Areas. Retrieved
6/1/2009, http://www.sprawlcity.org accessed at
• Touman, A. (2005) Egyptian new towns lessons to learn and mistakes to avoid,
Université Pierre Mendes, France
95
• Thomas, R. (1985) 'Introduction' to Howard, E. Garden Cities of Tomorrow, Powys:
Attic Books.
• UNESCO (1988), Training guidelines for the Integrated Environmental Evaluation of
Water Resources Development Projects, Paris.
• United Nations (1975) Urban and polices and land use control measures, Volume VII
Global review
• United Nations Fund for Population Activities (UNFPA) (1991) The state of world
population, New York.
• United Nations Fund for Population Activities (UNFPA) (1993) The state of world
population, New York.
• United Nations (2004) World Urbanization Prospects The 2003 Revision, United
Nations publication, New York
• United Nations (2008) World Urbanization Prospects The 2007 Revision, United
Nations publication, New York.
• Wright, F. (1932), The disappearing city. 90 pp. New York: William Farquar Payson.
New York.
• Zigmann, F. (2007) Urban sprawl, informal settlements and government responses in
the megalopolis of Cairo (Egypt). University of Cologne, Germany.
2007رانيا، مناهج التخطيط للمدن المصرية الحديثة، جامعة القاهرة رسالة ماجستير . سالم •
رسالة دآتوراه، آلية التجارة . انشاء المدن الحديثة في جمهورية مصر العربية: دراسة جدوى: الدمرداش طلعت •
جامعة

96
دراسة -تزايد الأهمية النسبية للمدن المتوسطة والصغيرة في التنمية الوطنية. بدالرحمن، محمدالهذلول، صالح؛ ع •
أعمال وبحوث وتوصيات المؤتمر ". المدينة العربية وتحديات المستقبل"تطبيقية للمملكة العربية السعودية في
مالزقازيق 1997: ء المدن، الرياض، المجلد الأول، المعهد العربي لإنماالعربية العام العاشر لمنظمة المدن
1995

97
Appendices

98
ماجستير التخطيط العمراني
استمارة( رؤية أصحاب القرار)
:معلومات عامة .1
:..........................................................الاسم .1 ..................:.............................المسمى الوظيفي .2
:الوضع المستقبلي .2
خيارا الرجاء ترتيب المناطق حسب . أين ترى اتجاه التوسع المستقبلي القادم في محافظة رام االله والبيرة تماشيا مع الرؤية الوطنية :الأولوية

99
البعد عن المواصفاتمرآز رام
االله والبيرة )آم(
معدل الارتفاع
عن سطح البحر
)م(
القرى المحيطة
بعدها عن أقرب مستوطنة
)آم(
بعدها عن الجدار
)آم(
الكثافة السكانية :بالمنطقة
) 2آم/شخص(
نسبة المناطق
الخضراء الموقع (%)
43 670 0 2 شقبا، قبيا، بدرس 200 23 )1(الموقع الأول 23.3 0 0 2 رنتيس 200 32 )2(الموقع الثاني
49 580 0 2 عابود 400 24 )3(ع الثالث الموق 42 420 21 1.5 ترمسعيا، أبو فلاح 700 22 )4(الموقع الرابع
50 360 23 2.5 رمون 600 13 )5(الموقع الخامس 0 0 19 3 ---- 100 28 )6(الموقع السادس 6 0 31 3 عين سامية 350 28 )7(الموقع السابع 60 228 23 1.8 ة وآفر مالكالطيب 700 15 )8(الموقع الثامن 4.1 0 13.5 2 ----------- 150 13.5 )9(الموقع التاسع دير ابزيع، آفر نعمة، 500 18 )10(الموقع العاشر
بلعين خربثا بني حارث
2 0.5 1033 42
قراوة بني زيد،عبوين، 400 18 )11(الموقع الحادي عشر دير السودان
2 5.5 1200 62
0.3 0 30 2.5 بدو المعرجات 100 18 )12(ر الموقع الثاني عشعطارة، جلجليا وعين 600 12.5 )13(الموقع الثالث عشر
سينيا2 13 320 49
........................................................................الموقع الأول •
...........................: .............................................الموقع الثاني •
:......................................................................الموقع الثالث •
......................................................................الموقع الرابع •
......................................................................الموقع الخامس •
......................................................................الموقع السادس •
......................................................................الموقع السابع •
......................................................................قع الثامنالمو •
......................................................................الموقع التاسع •
.....................................................................الموقع العاشر •
:......................................................................حادي عشرالموقع ال •
:.......................................................................الموقع الثاني عشر •
...:....................................................................الموقع الثالث عشر •
.............شكرا لتعاونكم

100
ماجستير التخطيط العمراني
استمارة
:تهدف الاستمارة إلى قياس رأي المجتمع المحلي في محافظة رام االله والبيرة في اختيار أنسب مكان لتجمع سكني جديد
:معلومات عامة .3
أنثى. 2ذآر .1: الجنس .3أآثر من . 6 40-36. 5 35 – 30. 4 30-25. 3 25أقل من . 1: مرالع .4
40 متزوج. 2أعزب . 1: الحالة الاجتماعية .5 أآثر من ذلك. 4يوس بكالور. 3دبلوم . 2شهادة ثانوية . 1: التحصيل العلمي .6 أخرى. 3خاص . 2حكومي . 1: طبيعة العمل .7 أخرى . 3مدينة البيرة . 2مدينة رام االله . 1: مكان العمل .8 قرى رام االله. 3مدينة البيرة . 2 مدينة رام االله .1 : مكان الإقامة .9
أآثر . 4 3500 -2600. 3 2500-1600 .2او أقل 1500 .1) : بالشيكل( الدخل الشهري .10 3500من
:الوضع المستقبلي .4
مرفق أيضا مواصفات آل موقع ). انظر الخارطة: ( رةخيارا لإقامة تجمع سكني جديد ضمن حدود محافظة رام االله والبي 13أمامك . اختيار ثلاث مناطق يمكن أن تسكن فيها ثم رتب هده المناطق حسب الأولويةالرجاء

101
البعد عن المواصفاتمرآز رام
االله والبيرة )آم(
معدل الارتفاع
عن سطح البحر
)م(
القرى المحيطة
بعدها عن أقرب مستوطنة
)آم(
بعدها عن
الجدار )آم(
الكثافة السكانية :بالمنطقة
2آم/شخص(
(
نسبة المناطق الخضراء
(%) الموقع
43 670 0 2 شقبا، قبيا، بدرس 200 23 )1(الموقع الأول 23.3 0 0 2 رنتيس 200 32 )2(الموقع الثاني 49 580 0 2 عابود 400 24 )3(الموقع الثالث 42 420 21 1.5 ترمسعيا، أبو فلاح 700 22 )4( الموقع الرابع
50 360 23 2.5 رمون 600 13 )5(الموقع الخامس 0 0 19 3 ---- 100 28 )6(الموقع السادس 6 0 31 3 عين سامية 350 28 )7(الموقع السابع 60 228 23 1.8 الطيبة وآفر مالك 700 15 )8(الموقع الثامن 4.1 0 13.5 2 ----------- 150 13.5 )9(الموقع التاسع دير ابزيع، آفر 500 18 )10(الموقع العاشر
نعمة، بلعين خربثا بني حارث
2 0.5 1033 42
قراوة بني 400 18 )11(الموقع الحادي عشر زيد،عبوين، دير
السودان
2 5.5 1200 62
0.3 0 30 2.5 بدو المعرجات 100 18 )12(الموقع الثاني عشر عطارة، جلجليا 600 12.5 )13(الث عشر الموقع الث
وعين سينيا2 13 320 49
:........................................................................الموقع الأول
: ........................................................................الموقع الثاني
.................................................................:.....الموقع الثالث
......................شكرا لتعاونكم

102