Embed Size (px)
Citation preview
University of Massachusetts AmherstScholarWorks@UMass AmherstLandscape Architecture & Regional PlanningMasters Projects Landscape Architecture & Regional Planning
5-2014
A GIS Multi-criteria Evaluation for IdentifyingPriority Industrial Land in Five Connecticut CitiesMark [email protected]
Follow this and additional works at: https://scholarworks.umass.edu/larp_ms_projects
Part of the Urban Studies and Planning Commons
This Article is brought to you for free and open access by the Landscape Architecture & Regional Planning at ScholarWorks@UMass Amherst. It hasbeen accepted for inclusion in Landscape Architecture & Regional Planning Masters Projects by an authorized administrator of ScholarWorks@UMassAmherst. For more information, please contact [email protected].
Berube, Mark, "A GIS Multi-criteria Evaluation for Identifying Priority Industrial Land in Five Connecticut Cities" (2014). LandscapeArchitecture & Regional Planning Masters Projects. 58.Retrieved from https://scholarworks.umass.edu/larp_ms_projects/58
A
A GIS Multi-criteria Evaluation for
Identifying Priority Industrial Land in Five
Connecticut Cities
Mark Berube
Master's of Regional Planning
University of Massachusetts, Amherst
Spring 2014
Approved as to style and content by:
____________________________________________
Dr. John Mullin, Committee Chair
Landscape Architecture and Regional Planning
____________________________________________
Dr. Henry Renski, Committee Member
Landscape Architecture and Regional Planning
___________________________________________
Dr. Elisabeth Hamin, Department Head
Landscape Architecture and Regional Planning
M. Berube
2
Abstract
Rising land values, environmental regulations, lack of investment, and a declining industrial
economy greatly threaten the existence of industrial land. Therefore, the purpose of this
project is to establish where priority industrial districts are located within five Connecticut
cities through the implementation of a GIS weighted multi-criteria evaluation. This tool
applies various constraints and factors critical to industrial location and business investment.
In addition to identifying suitable industrial districts, a tax base analysis assesses the overall
value of industrial land within each community and an employment outlook measures future
job growth for Connecticut Workforce Investment Areas. The overall goal of this research is
to understand why industrial activity is beneficial within urban areas, what factors contribute
to industrial development, and to advocate for the protection of industrial districts for future
industrial activity.
Keywords: GIS Multi-criteria evaluation, Industrial Land, Protection, Economic
Development, Industrial Development, Industrial Location
M. Berube
3
Table of Contents Abstract ....................................................................................................................................... 2
List of Figures and Tables .......................................................................................................... 4
Chapter 1. Introduction .............................................................................................................. 6
Project Overview and Research Questions ............................................................................. 8
Rationale for the Study ........................................................................................................... 9
Methodology ......................................................................................................................... 17
Chapter 2. Literature Review .................................................................................................. 22
Industrial Land ...................................................................................................................... 22
Constraints ............................................................................................................................ 23
Factors .................................................................................................................................. 26
Weighted Overlay Analysis and Multi-criteria Evaluation .................................................. 29
Chapter 3. Study Area Overview ............................................................................................. 31
Industrial Economic Outlook ............................................................................................... 34
Tax Base Analysis ................................................................................................................ 41
Chapter 4. GIS Analysis .......................................................................................................... 47
Part 1: Constraint Analysis .................................................................................................. 47
Part 2: Factor and Weighted Overlay Sensitivity Analysis ................................................. 54
Part 3: Final Suitability Analysis ......................................................................................... 60
Chapter 5. Research Results .................................................................................................... 66
Bridgeport ......................................................................................................................... 66
Hartford ............................................................................................................................ 69
New Haven ....................................................................................................................... 71
Stamford ........................................................................................................................... 73
Waterbury ......................................................................................................................... 75
Chapter 6. Conclusion ............................................................................................................. 77
Summary of Findings ........................................................................................................... 77
Limitations and Future Research .......................................................................................... 81
Recommendations for Industrial Land Protection ................................................................ 83
M. Berube
4
List of Figures and Tables Table 1. Study Area and 2012 Population ................................................................................. 9 Table 2. Unemployment and Poverty Rates ............................................................................. 11 Table 3. GIS Analysis Data ..................................................................................................... 20 Table 4. Physical Factors and Constraints ............................................................................... 22 Table 5. Study Area and 2012 Population ............................................................................... 32
Table 6. City Land Use According to Assessor's Zoning ........................................................ 33 Table 7. Change in Employment and Firms, 2002 to 2012 in Connecticut Cities .................. 39 Table 8. Manufacturing Employment Projections - 2010 to 2020 .......................................... 40 Table 9. Major Industry Sector Annual Average Wage by WIA - 2012 ................................. 41 Table 10. Mill Rates and Value of Land per Square Foot (2014 Dollars) ............................... 46
Table 11. Developable Industrial Land ................................................................................... 48
Table 12. Weighted Overlay Factor Criteria ........................................................................... 54
Table 13. Parcels Larger Than 10 Acres ................................................................................. 66 Table 14. Bridgeport Suitable Industrial Acreage ................................................................... 67 Table 15. Hartford Suitable Industrial Acreage ...................................................................... 69 Table 16. New Haven Suitable Industrial Acreage ................................................................. 71
Table 17. Stamford Suitable Industrial Acreage ..................................................................... 73 Table 18. Waterbury Suitable Industrial Acreage ................................................................... 75
Figure 1. Abandoned Factories, Bridgeport, CT ...................................................................... 7 Figure 2. Analysis Overview ................................................................................................... 20
Figure 3. State of Connecticut Study Areas ............................................................................ 31 Figure 4. Connecticut Workforce Investment Areas ............................................................... 35
Figure 5. Manufacturing Firms per City from 2002-2012 ...................................................... 37 Figure 6. Manufacturing Employees per City from 2002 to 2012 .......................................... 38
Figure 7. Manufacturing Jobs per WIA from 2002 to 2012 .................................................... 39 Figure 8. Real Property Tax Base ............................................................................................ 42 Figure 9. Stamford Real Property Tax Base ............................................................................ 43
Figure 10. Hartford Real Property Tax Base ........................................................................... 44 Figure 11. New Haven Real Property Tax Base ...................................................................... 44
Figure 12. Waterbury Real Property Tax Base ....................................................................... 45 Figure 13. Bridgeport Existing Land Use Depicting Developable Industrial Land ................ 49 Figure 14. Hartford Existing Land Use Depicting Developable Industrial Land .................... 50 Figure 15. New Haven Existing Land Use Depicting Developable Industrial Land .............. 51 Figure 16. Stamford Existing Land Use Depicting Developable Industrial Land .................. 52
Figure 17. Waterbury Existing Land Use Depicting Developable Industrial Land ............... 53 Figure 18. Bridgeport Factors Classified by Suitability .......................................................... 55
Figure 19. Hartford Factors Classified by Suitability ............................................................. 56 Figure 20. New Haven Factors Classified by Suitability ........................................................ 57 Figure 21. Stamford Factors Classified by Suitability ............................................................ 58 Figure 22. Waterbury Factors Classified by Suitability .......................................................... 59 Figure 23. Bridgeport Final Results - Geographic Location of Priority Industrial Land ........ 61
Figure 24. Hartford Final Results - Geographic Location of Priority Industrial Land ........... 62 Figure 25. New Haven Final Results - Geographic Location of Priority Industrial Land ...... 63
M. Berube
5
Figure 26. Stamford Final Results - Geographic Location of Priority Industrial Land .......... 64 Figure 27. Waterbury Final Results - Geographic Location of Priority Industrial Land ........ 65 Figure 28. Bridgeport Priority Parcel ...................................................................................... 68 Figure 29. Bridgeport Priority Parcel - Aerial View ............................................................... 68 Figure 30. Hartford Priority Parcel .......................................................................................... 70
Figure 31. Hartford Priority Parcel - Aerial View ................................................................... 70 Figure 32. New Haven Priority Parcel .................................................................................... 72 Figure 33. New Haven Priority Parcel - Aerial View ............................................................. 72 Figure 34. Stamford Priority Parcel ......................................................................................... 74 Figure 35. Stamford Priority Parcel - Aerial View ................................................................. 74
Figure 36. Waterbury Priority Parcel ...................................................................................... 76 Figure 37. Waterbury Priority Parcel - Aerial View ............................................................... 76
M. Berube
6
Chapter 1. Introduction
The purpose of this project is to conduct a Geographic Information System (GIS)
multi-criteria evaluation (MCE) that identifies and prioritizes industrial districts for future
investment, development, and protection. After converting industrial land to commercial,
residential, or agricultural parcels, it is nearly impossible to reclaim it, making industrial land
vulnerable to disinvestment and displacement (Hoelzel and Leigh 2013). A comprehensive
evaluation of industrial land provides context for local and regional officials who are
exploring opportunities for job creation and economic development. Prioritizing these
districts for future investment improves the site selection process, streamlines construction,
and more effectively targets public funding.
Industrial activity is essential to the urban framework; food distributors, warehousing,
research and development, recycling facilities, and manufacturing centers provide services
and create goods for cities and surrounding areas. In order to provide goods and services to
local communities, local businesses acquire outside resources, and utilize them to create
finished products eventually sold to the end user. This process boosts the economic base and
creates high wage employment opportunities for lower-skilled workers, strengthening a
community socially and economically. Active industrial land also diversifies a city's tax base,
generating fiscal revenue for community needs and public services. However, blighted
industrial property consequently drives down surrounding property values, reducing tax
revenue even more. As a result, once thriving industrial cities struggle to rejuvenate these
underutilized spaces.

M. Berube
7
Policymakers and planners realize distressed downtowns and cities require
revitalization to foster vibrant, active, and walkable communities. In order to do so, planning
goals often consist of implementing smart growth and mixed use development strategies with
the intention to create attractive residential and commercial environments. Although these
planning techniques are advantageous, they fail to acknowledge the benefits of industrial
development. As a result, economic development strategies may overlook industrial activity
as practical approach for job creation and business retention.
In addition to strategies that neglect the benefits of industrial activity, abandoned and
underutilized industrial space, as well as struggling industrial firms, are at risk of
displacement due to real estate market pressure, environmental regulations, and zoning
policies. New, appealing commercial and residential uses, developed adjacent to industrial
districts, increase the value of land and encourage conversion of the highest and best use from
industry to commercial or residential activity. As a result, industrial property owners and
firms exposed to rising land values relocate to suburban communities where tax rates or
property costs are less.
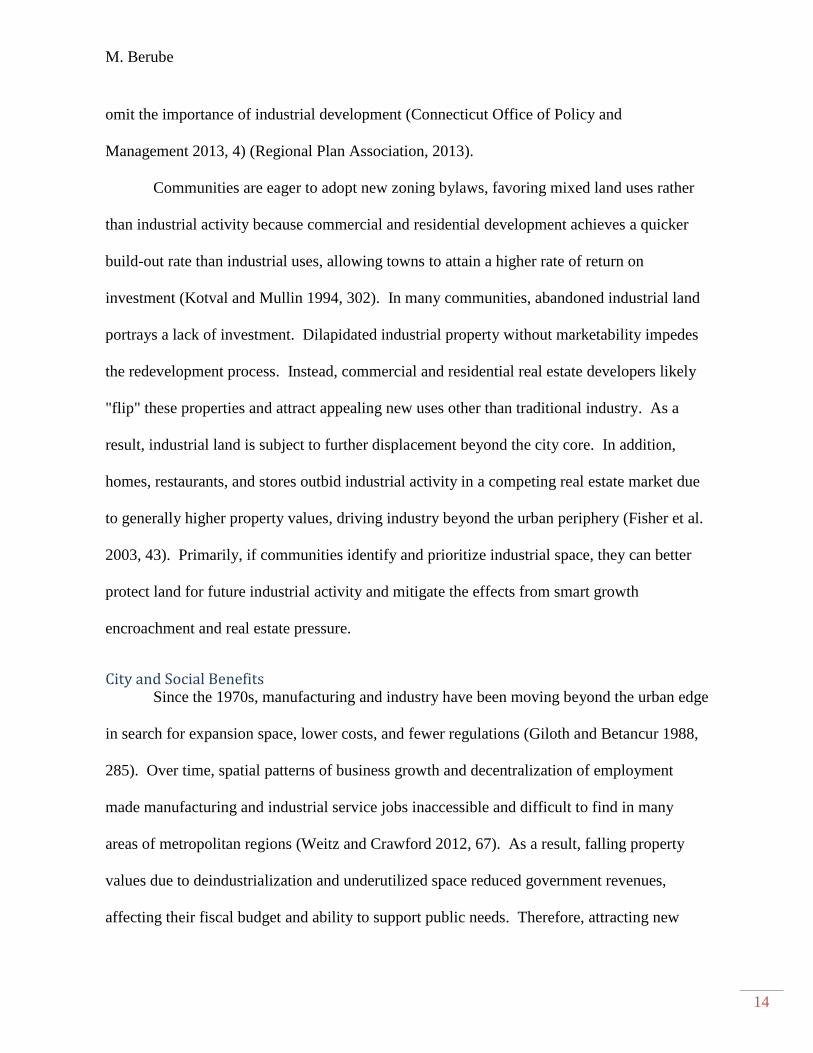
Figure 1. Abandoned Factories, Bridgeport, CT 1
1 http://www.archdaily.com/57093/help-save-remington-arms-factory/
M. Berube
8
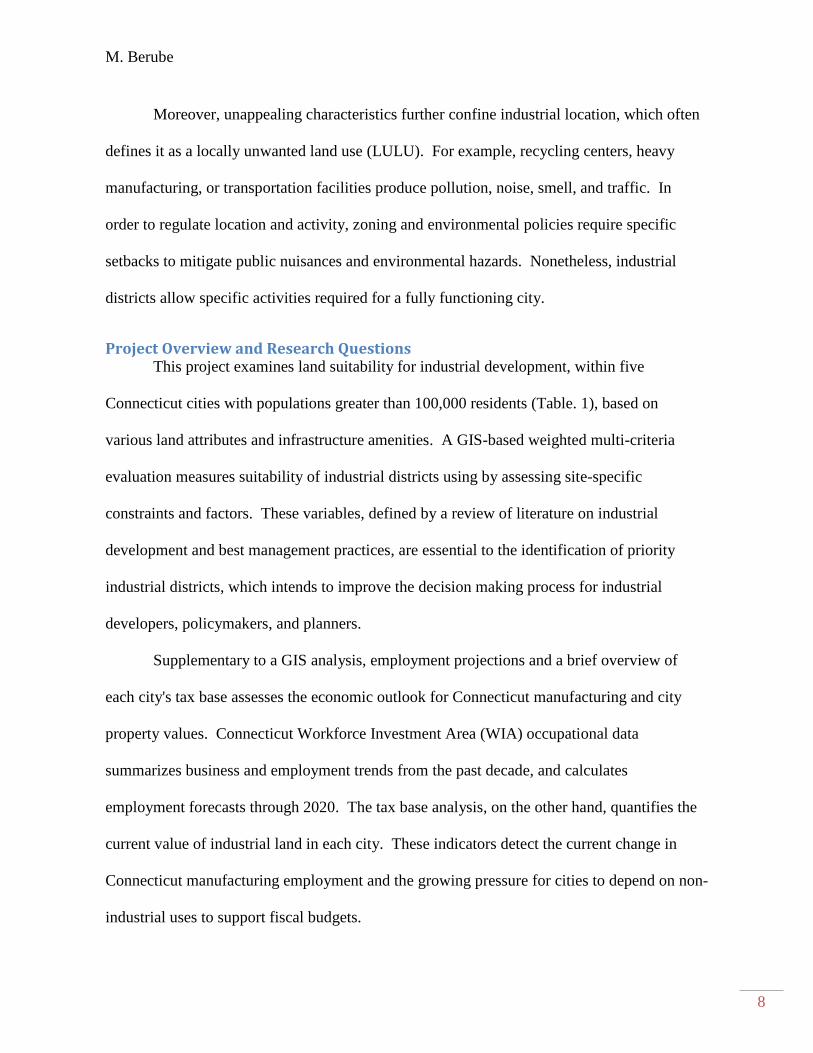
Moreover, unappealing characteristics further confine industrial location, which often
defines it as a locally unwanted land use (LULU). For example, recycling centers, heavy
manufacturing, or transportation facilities produce pollution, noise, smell, and traffic. In
order to regulate location and activity, zoning and environmental policies require specific
setbacks to mitigate public nuisances and environmental hazards. Nonetheless, industrial
districts allow specific activities required for a fully functioning city.
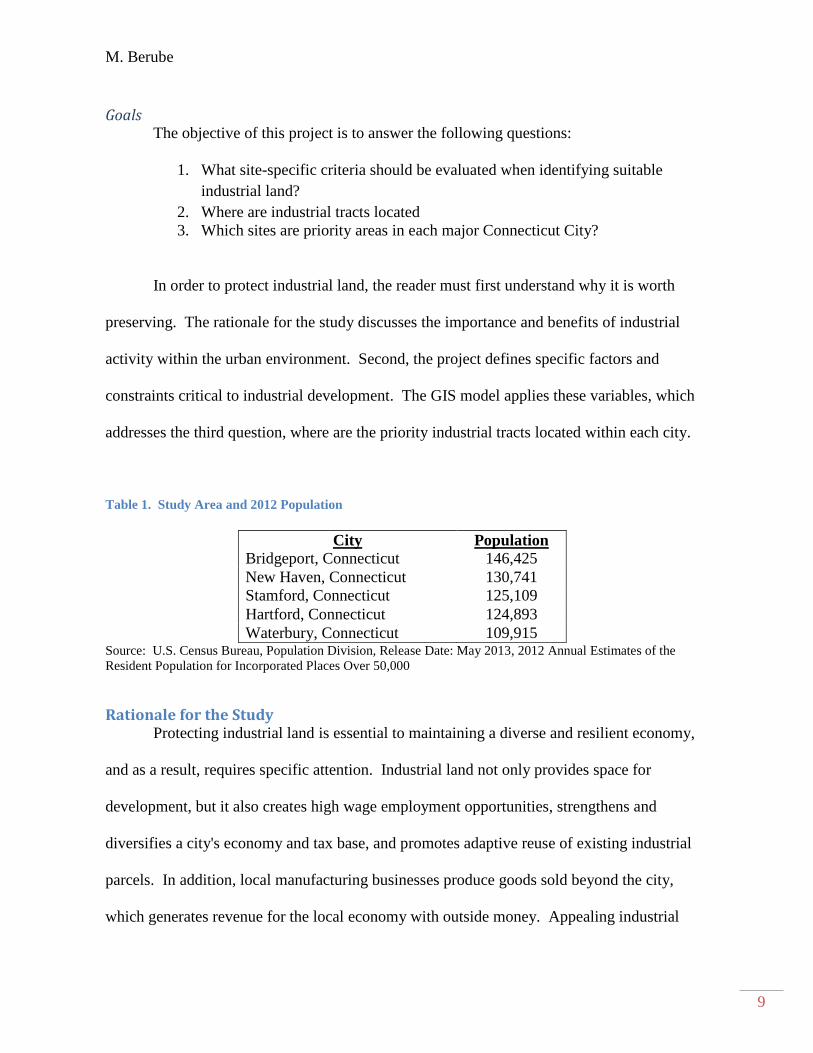
Project Overview and Research Questions This project examines land suitability for industrial development, within five
Connecticut cities with populations greater than 100,000 residents (Table. 1), based on
various land attributes and infrastructure amenities. A GIS-based weighted multi-criteria
evaluation measures suitability of industrial districts using by assessing site-specific
constraints and factors. These variables, defined by a review of literature on industrial
development and best management practices, are essential to the identification of priority
industrial districts, which intends to improve the decision making process for industrial
developers, policymakers, and planners.
Supplementary to a GIS analysis, employment projections and a brief overview of
each city's tax base assesses the economic outlook for Connecticut manufacturing and city
property values. Connecticut Workforce Investment Area (WIA) occupational data
summarizes business and employment trends from the past decade, and calculates
employment forecasts through 2020. The tax base analysis, on the other hand, quantifies the
current value of industrial land in each city. These indicators detect the current change in
Connecticut manufacturing employment and the growing pressure for cities to depend on non-
industrial uses to support fiscal budgets.
M. Berube
9
Goals The objective of this project is to answer the following questions:
1. What site-specific criteria should be evaluated when identifying suitable
industrial land?
2. Where are industrial tracts located
3. Which sites are priority areas in each major Connecticut City?
In order to protect industrial land, the reader must first understand why it is worth
preserving. The rationale for the study discusses the importance and benefits of industrial
activity within the urban environment. Second, the project defines specific factors and
constraints critical to industrial development. The GIS model applies these variables, which
addresses the third question, where are the priority industrial tracts located within each city.
Table 1. Study Area and 2012 Population
City Population
Bridgeport, Connecticut 146,425
New Haven, Connecticut 130,741
Stamford, Connecticut 125,109
Hartford, Connecticut 124,893
Waterbury, Connecticut 109,915 Source: U.S. Census Bureau, Population Division, Release Date: May 2013, 2012 Annual Estimates of the
Resident Population for Incorporated Places Over 50,000
Rationale for the Study Protecting industrial land is essential to maintaining a diverse and resilient economy,
and as a result, requires specific attention. Industrial land not only provides space for
development, but it also creates high wage employment opportunities, strengthens and
diversifies a city's economy and tax base, and promotes adaptive reuse of existing industrial
parcels. In addition, local manufacturing businesses produce goods sold beyond the city,
which generates revenue for the local economy with outside money. Appealing industrial
M. Berube
10
land also gives cities a competitive advantage when attracting new businesses. However, in
recent years, the recession has challenged many firms, and all sectors of the economy have
struggled, especially manufacturing. Along with a diminishing industrial base, the physical
condition of industrial land continues to deteriorate due to a lack of investment, bringing
down surrounding property values. Therefore, planners must inventory, prioritize, and protect
industrial land in order to strategically practice smart economic and land use development.
Derelict and abandoned buildings strewn throughout the built environment often
characterize urban decline. In addition to poor physical development, Connecticut's urban
areas, Bridgeport, New Haven, Hartford, Stamford, and Waterbury, are characterized by
immense poverty, rampant unemployment statistics, and low high school graduation rates.
Each community exceeds the current State unemployment rate (9.2%) and poverty rate
(10.0%). The unemployed population in these cities ranges from 10.6% (Stamford) to 19.3%
(Hartford), as evident in the table presented below. Moreover, the staggering poverty rates of
these cities warrants additional attention. In Hartford, 33.9% of residents live abjectly without
adequate employment, finances, or healthcare. New Haven, a city defined by the presence of
world-class institutions, has 26.9% of residents living in poverty. Finally, 89.0% of
Connecticut residents age 25 years or older graduated from high school. However, each city
(except Stamford - 86.2%), falls below this threshold and graduates fewer than 80% of their
residents older than 25.

M. Berube
11
Table 2. Unemployment and Poverty Rates
City Unemployment Poverty
Educational Attainment (High
School Graduates 25 years or older)
Bridgeport 15.8% 23.6% 73.9%
Hartford 19.3% 33.9% 68.6%
New Haven 13.8% 26.9% 80.5%
Stamford 10.6% 10.8% 86.2%
Waterbury 13.0% 21.9% 78.8% Source: United States Census, American Community Survey, 2008-2012 5 year estimates
Government Initiatives and Industrial Trends Government support, initiatives, and market trends predict growth in the industrial
sector. As a result, cities should proactively inventory suitable land for investment. President
Obama's administration plans to double exports within five years through the Advanced
Manufacturing Partnership (Leigh and Hoelzel 2012, 89). Additionally, this growth supports
an increasing demand for prime industrial space according to industrial real estate studies
(Morris 2014).
Current initiatives and depicted trends verify that the United States industrial economy
is growing. The manufacturing sector has added 250,000 jobs since its low point in
December 2009, and the U.S. remains one of the largest manufacturing economies in the
world. In 2010, 21% of the world's goods manufactured in the States increased its Gross
Domestic Product (GDP) value from 11.7% to 21.3% over the last decade (Leigh and Hoelzel
2012, 88). More importantly, urban areas continue to export the majority of U.S. Goods. The
100 largest metro areas produced almost 65% of U.S. export sales and 63% of manufacturing
export sales (Istrate and Marchino 2012).

M. Berube
12
The Connecticut manufacturing sector is also showing signs of improvement. In
2011, total employment stabilized at approximately 165,000 jobs, and manufacturing
workforce trends illustrate surprising vitality; 8,000 more jobs were available by this time
than originally projected. Furthermore, between 1990 and 2007, technology output increased
by more than half. Through 2011, Connecticut ranked 10th in GDP growth amongst all other
states. Three years ago, manufacturing was responsible for contributing more than a quarter
of the State's 2% increase in real output, second to the financial services sector. In the late
1990s, manufacturing accounted for only one-fifth of the State's annual GDP change.
Connecticut manufacturing employee earnings are also on the rise. Since 2000,
earnings increased 41%, 7% greater than all other sectors economy-wide. In addition, the
average factory worker earns nearly $77,000 annually (Lanza 2013). High wage employment
opportunities, and a greater percentage of weekly pay, provides individuals and families with
more income and better standards of living. Furthermore, manufacturing jobs and industrial
firms generate goods sold beyond the city, bringing revenue and outside money into the
community, enhancing the economic environment.
American manufacturers rely on urban areas for appropriate amenities that offer
competitiveness and efficiency as the economy advances into the 21st century (Byron and
Mistry 2011). Urban industrial concentration provides close proximity to suppliers and
customers, a network of skilled labor, and modern infrastructure for high-tech research and
development activities, all of which are critical to the production process (Hoelzel and Leigh
2013). Therefore, protecting urban industrial activity facilitates efficient movement of goods
between industries and communities, reducing transaction costs, and enhances knowledge
spillover within regional industry clusters.
M. Berube
13
A growth in business and attraction to urban real estate also boosts demand for
industrial property. In 2013, the U.S. industrial real estate market experienced its strongest
performance since 2005 (Morris 2014). As transportation costs continue to rise, urban centers
provide easy access to transit networks (Morris 2014). Importing, exporting and purchasing
products largely influence industrial location. Again, cities provide critical amenities
(available labor, infrastructure, and a broad market) to businesses pursuing expansion and
growth within their sector.
Smart Growth and Real Estate Pressure Popularity smart growth strategies encourage sustainable land use; however, such
policies fail to identify the benefits of urban industrial land. An evaluation of smart growth
publications portray urban industry as an obstruction to future investment and sustainability
despite its ability to create jobs, attract business, and mitigate industrial sprawl (Bronstein
2009). Likewise, "by not encouraging industrial revitalization in mixed-use, transit oriented,
and infill redevelopment projects, smart growth policies overlook a significant economic
sector that contributes to diverse, innovative, and more resilient local economies" (Leigh and
Hoelzel 2012, 87-89).
Statewide Smart Growth regulations do not exist within Connecticut. However, many
communities and regions implement smart growth strategies. For example, the Capital
Region Council of Governments (CRCOG), the State's largest regional planning organization,
established smart growth guidelines for sustainable design and development for the 30 Metro-
Hartford municipalities. Additionally, the State's "Plan of Conservation and Development"
and the "Transit-Oriented Development Toolkit for CT" directly outline and advise
communities to comply with Smart Growth principles. However, these planning frameworks
M. Berube
14
omit the importance of industrial development (Connecticut Office of Policy and
Management 2013, 4) (Regional Plan Association, 2013).
Communities are eager to adopt new zoning bylaws, favoring mixed land uses rather
than industrial activity because commercial and residential development achieves a quicker
build-out rate than industrial uses, allowing towns to attain a higher rate of return on
investment (Kotval and Mullin 1994, 302). In many communities, abandoned industrial land
portrays a lack of investment. Dilapidated industrial property without marketability impedes
the redevelopment process. Instead, commercial and residential real estate developers likely
"flip" these properties and attract appealing new uses other than traditional industry. As a
result, industrial land is subject to further displacement beyond the city core. In addition,
homes, restaurants, and stores outbid industrial activity in a competing real estate market due
to generally higher property values, driving industry beyond the urban periphery (Fisher et al.
2003, 43). Primarily, if communities identify and prioritize industrial space, they can better
protect land for future industrial activity and mitigate the effects from smart growth
encroachment and real estate pressure.
City and Social Benefits Since the 1970s, manufacturing and industry have been moving beyond the urban edge
in search for expansion space, lower costs, and fewer regulations (Giloth and Betancur 1988,
285). Over time, spatial patterns of business growth and decentralization of employment
made manufacturing and industrial service jobs inaccessible and difficult to find in many
areas of metropolitan regions (Weitz and Crawford 2012, 67). As a result, falling property
values due to deindustrialization and underutilized space reduced government revenues,
affecting their fiscal budget and ability to support public needs. Therefore, attracting new
M. Berube
15
business to an urban core enhances a city's economy and relieves pressure from the costs of
community services (COCS), and ultimately provides a wealth of new opportunity for the
local population: revitalized industrial land generates job potential and establishes real
property tax revenue through sustained real estate values. Also, expanding the local economic
base and creating basic goods within a community transfers wealth into the local economy
from outside of the region (Hoelzel and Leigh 2013). Goods produced by local businesses
eventually sold to new consumers, generate new income for companies and employees, which
enhance quality of life and the neighborhood economy.
Strengthening and diversifying a city's economy and tax base with industrial land is
also beneficial in the form of business retention and tax payments. Urban industrial firms
provide jobs to city residents and pay taxes for infrastructure upgrades, public safety, or
community services. Instead of an employed city population, who often deals with social
costs of increased traffic congestion and pollution, or supporting public projects subsidized by
residential tax revenue, local industrial businesses can help alleviate these expenditures
through supplementary tax payments (McCarthy 2002, 293). Therefore, it is critical for cities
to maintain their economic base and limit business sprawl into suburban communities where
land is less expensive. Diversifying a community's tax base supports a city's fiscal budget
without increasing additional expenditures for education, public resources, and infrastructure
maintenance etc.
Investing in urban industry generates revenue without increasing COCS. In the
following example, the city of Warm Springs, California conducted a fiscal impact analysis to
assess the economic costs and revenues associated with the development of a motor
manufacturing company, while taking into account alternatives involving commercial and
M. Berube
16
residential development. After estimated increased costs due to residential and commercial
investment, the scenario focusing solely on manufacturing and industry calculated the highest
net revenue, suggesting that industrial development would be the highest and best use
(Strategic Economics 2013). The return on investment from industrialization ameliorates
many of the aforementioned social costs within communities without increasing residential
population and social services.
In a study conducted by the Farmland Information Group, a survey of 83 communities
in 2001 determined industry cost significantly less than residential. The median ratio of
revenues to expenditures for industrial land demonstrate that $0.29 per dollar of revenue was
spent on local community costs, almost three times as less as residential uses (American
Farmland Trust 2013, 6). Fewer homes indicate less pressure on school systems, libraries,
hospitals, and other public services. Furthermore, promoting the use of industrial property
creates a healthy balance of land uses within the urban framework (Squires 2002, 22).
Environmental Benefits Redeveloping industrial land is not only a driver of economic development, but is also
a strategic method for enhancing the surrounding environment. Many industrial parcels in
urban areas are suitable for development, yet they remain vacant, unattractive, and
underutilized. The presence of old decrepit buildings and brownfields are aesthetically
unappealing to future investors and potential residents. This makes adaptive reuse and
redevelopment an intimidating process. However, the environmental benefits may outweigh
upfront costs. Contaminated brownfields leach pollutants into the soil and nearby wetlands,
affecting the surrounding ecosystem and public water resources. Therefore redeveloping
M. Berube
17
brownfields in an environmentally sensitive way enhances the value of land and increases
marketability while mitigating environmental impacts.
Brownfields are "abandoned, idled, or under-utilized industrial and commercial
facilities where expansion or redevelopment is complicated by real or perceived
contamination" (U.S Environmental Protection Agency 2011). This contamination is
unhealthy to the surrounding natural environment if not properly treated. Identifying large
brownfields in quality locations "near a busy central district, freeway interchange, waterfront,
or major retail or industry facility" allocates resources to parcels with strong possibility for
reuse.
Lastly, industrial jobs located within a dense urban population play a major role in
enhancing environmental quality and public health. Built environments designed for
walkability promote public transit use, physical activity, and decreased reliance on private
vehicles. According to Lachapelle et al. (2011, S72), "higher residential density, greater
land use mix, and street connectivity provide nearby destinations that are easy to reach."
Destinations in close proximity allow people to ride their bike or walk instead of driving. In
addition, utilizing mass transit diminishes energy consumption and greenhouse gas emissions.
Commuters can further reduce greenhouse gas emissions and pollution by reducing their
journey to work time or utilizing public transit (Lachapelle et al. 2011).
Methodology
Literature Review Methodology An overview of scholarly articles and development guidelines are critical to the GIS
analysis. However, before conducting the GIS process, input variables (constraints and
factors), derived from planning guidebooks, best management practices, journal articles, and
M. Berube
18
industrial development reports, define specific features influencing industrial location. These
criteria and standards assess priority locations in detail. Since individual projects are unique,
and approaches to evaluate criteria differ, the literature review serves as a guide for the GIS
model. Different factors and constraints, specific to individual business needs, may require
alternative methods to highlight priority land.
Three sections divide the literature review. The first two sections discuss the
constraints and factors evaluated in the analysis, while the last segment reviews the GIS
methodology utilized to identify priority industrial land. First, constraints are defined as areas
of land that the affect whether or not a site is capable of being developed. These criteria are
environmentally sensitive and applied to the process in order to minimize the environmental
impact from development and industrial activity. The second section identifies factors, which
influence industrial location. These variables are essential to location because they provide
amenities for industrial activity. Finally, the last section explains how GIS adequately
processes the constraints and factors within a weighted overlay analysis.
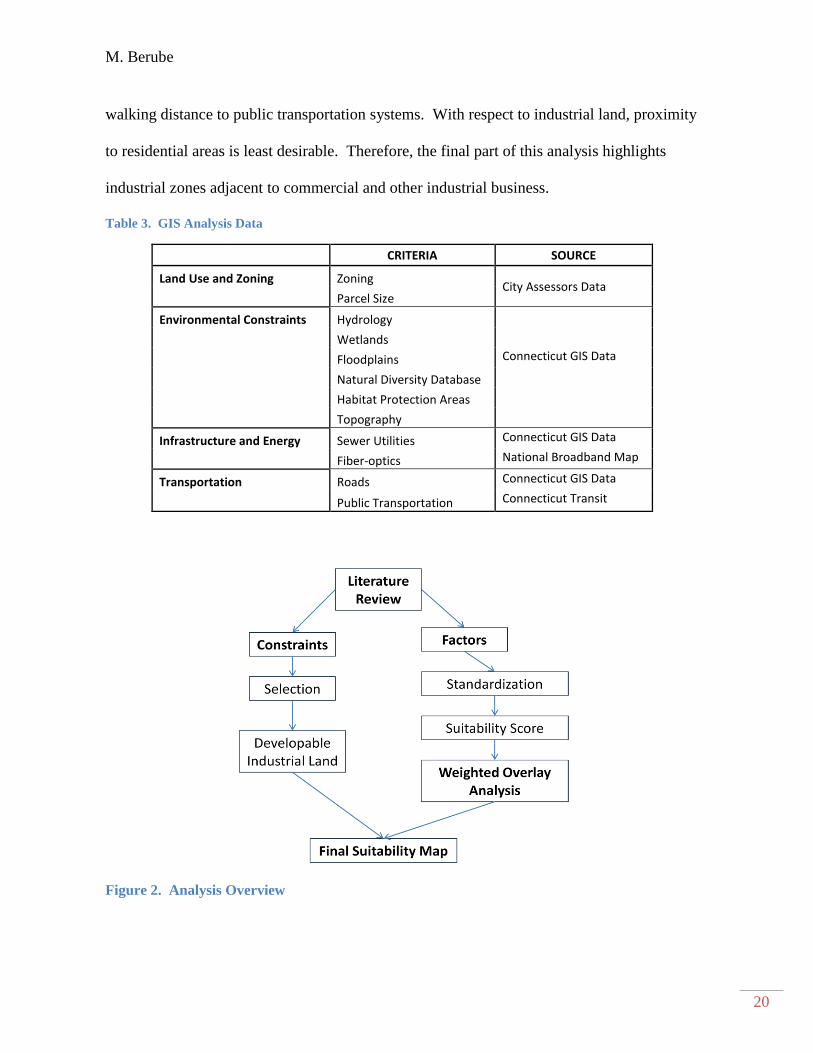
GIS Analysis and Inventory Methodology This project uses Environmental Systems Research Institute's (ESRI) ArcMap 10.1 to
conduct a weighted overlay analysis by applying spatial parameters and restrictions to locate
and measure priority industrial property. Most practical for this project, ESRI's ArcMap is a
familiar tool utilized by planners to manage and analyze data, and assess or monitor
geographic and spatial elements. Literature and development standards define spatial
standards, acquired from the Connecticut Department of Energy and Environmental
Protection (CT DEEP) GIS database and city offices. The constraints assessed in are
industrial districts, hydrology, wetlands, floodplains, habitat protection areas, natural diversity
M. Berube
19
areas, and topography. The following factors, assessed by proximity to industrial land, are
sewer service areas, fiber-optic networks, major arterials, and public transportation. The
model inventories and prioritizes industrial land in a two-part process. First, zoning policies
and GIS data identify city districts that allow industrial activity. After selecting these zones, a
constraint analysis removes all undevelopable land in each area. The purpose is to eliminate
any existing development hurdles, according to environmental regulations and development
standards, inhibiting the development process, in order to improve project feasibility.
The second part of the procedure, also conducted in GIS, applies a factor analysis,
which incorporates specific variables essential for industry. A factor analysis examines the
spatial relationship between developable industrial land and proximity to existing
infrastructure amenities (or factors). The closer the distance of industrial land to each factor,
the more suitable the location becomes. The weighted overlay analysis then measures
suitability for development and ranks locations as either having a high priority or a low
priority for protection and investment. This process applies weighted values to each factor,
which vary based on specific requirements or business needs.
Finally, after suitability is measured, a more detailed analysis identifies highest
priority industrial parcels larger than 10 acres and not adjacent to residential parcels. Large
contiguous acres are compatible for future investment; they allow a community to readily
absorb industrial growth with the least amount of restrictions. This inventory suggests that
the depicted areas on the final map are strategic for industrial revitalization. Communities can
efficiently use existing infrastructure to take advantage of investment opportunities for green
technology, niche manufacturing, or eco-industrial parks. These spaces are also critical
locations, positioned at the crossroads of major arterials, within utility service areas, and in
M. Berube
20
walking distance to public transportation systems. With respect to industrial land, proximity
to residential areas is least desirable. Therefore, the final part of this analysis highlights
industrial zones adjacent to commercial and other industrial business.
Table 3. GIS Analysis Data
CRITERIA SOURCE
Land Use and Zoning Zoning City Assessors Data
Parcel Size
Environmental Constraints Hydrology
Wetlands
Floodplains Connecticut GIS Data
Natural Diversity Database
Habitat Protection Areas
Topography
Infrastructure and Energy Sewer Utilities Connecticut GIS Data
Fiber-optics National Broadband Map
Transportation Roads Connecticut GIS Data
Public Transportation Connecticut Transit
a
Figure 2. Analysis Overview
M. Berube
21
Tax Base and Job Projection Analysis Methodology The State of Connecticut Department of Labor generates industry employment
forecasts, using historical trends and population analyses, to measure the change in
employment between 2010 and 2010. The calculations depict job growth and decline for
various industries within Workforce Investment Areas. More specifically, this section
evaluates the manufacturing job base and discusses the future for manufacturing in
Connecticut. According to the United States Census, the manufacturing sector is defined as
"establishments engaged in the mechanical, physical, or chemical transformation of materials,
substances, or components into new products. The assembling of component parts of
manufactured products is considered manufacturing, except in cases where the activity is
appropriately classified in Sector 23, Construction" (United States Census Bureau, 2012). Job
predictions demonstrate required industrial space for future economic and employment
growth.
City tax bases are analyzed using land assessment valuations from the State of
Connecticut Office of Policy and Management. The summary compares each city's real
property tax revenue from 1995 to 2010 for all land use categories. The purpose is to
highlight the existing revenue flows for industrial, commercial, and residential tax bases.
Moreover, highlighting these trends indicate each community's over reliance on non-industrial
uses to sustain their tax base.
M. Berube
22
Chapter 2. Literature Review
Industrial Land Industry is described as "Those fields of economic activity including forestry, fishing,
hunting, and trapping; mining; construction; manufacturing; transportation; communication;
electric, gas, and sanitary services; and whole sale trade" (Moskowitz and Lindbloom 1993).
A GIS-based approach is a method to model and analyze land with the least amount of
impediments to development. The physical location required for said uses must be suitable
for the storage of materials and capital, parking of vehicles and trucks, and internal vehicular
circulation (Smith 1981, 32). Appropriately evaluating physical factors and constraints allows
cities to tactically attract developers with minimum complication (Jun 2000, 7). The decision
process identifies optimal sites while taking into account economic benefits and
environmental sustainability. Essentially, the site selection process becomes increasingly
valuable where potential facilities may disrupt environmental conditions or public space
(Reisi et al. 2011).
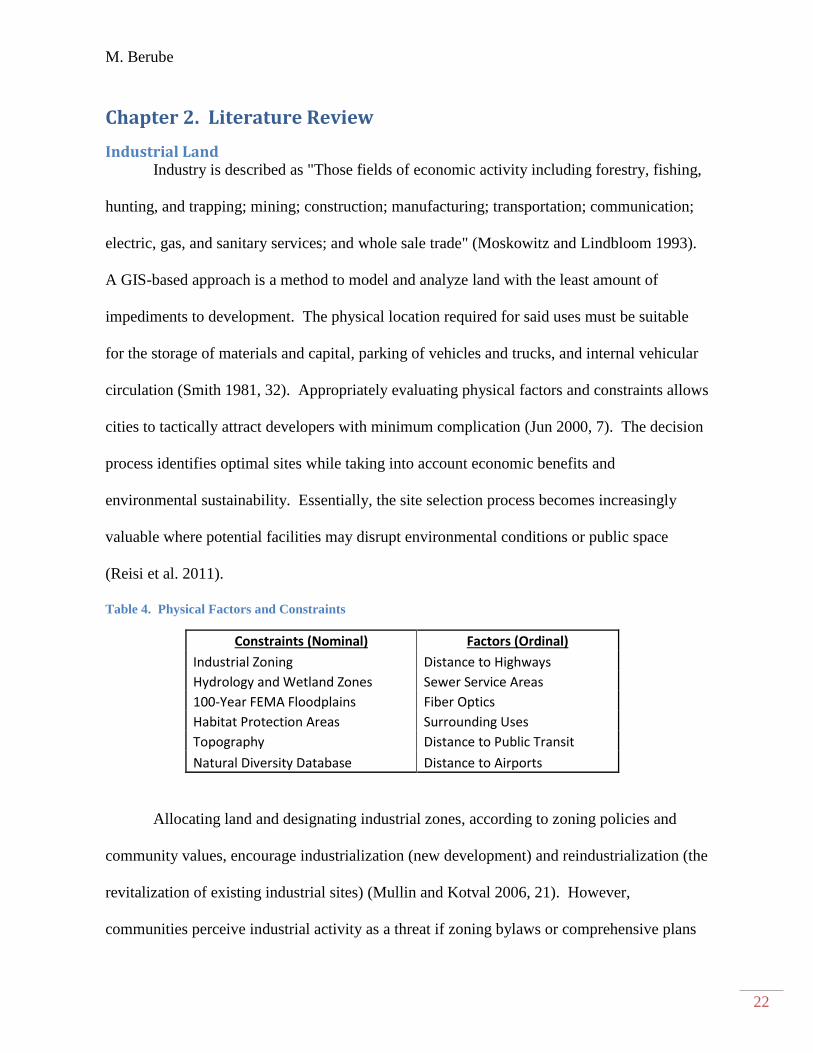
Table 4. Physical Factors and Constraints
Constraints (Nominal) Factors (Ordinal)
Industrial Zoning Distance to Highways
Hydrology and Wetland Zones Sewer Service Areas
100-Year FEMA Floodplains Fiber Optics
Habitat Protection Areas Surrounding Uses
Topography Distance to Public Transit
Natural Diversity Database Distance to Airports
Allocating land and designating industrial zones, according to zoning policies and
community values, encourage industrialization (new development) and reindustrialization (the
revitalization of existing industrial sites) (Mullin and Kotval 2006, 21). However,
communities perceive industrial activity as a threat if zoning bylaws or comprehensive plans
M. Berube
23
fail to address or promote industrial development. Therefore, industrial firms may find it
difficult to locate within a neighborhood whose policies resist future industrialization despite
industry’s economic and social benefits.
Historically, noxious uses and environmental degradation label industrial activity as a
locally unwanted land use (LULU). Therefore, favorable policy promoting industrial
revitalization embraces new development with little interference. City master plans that
address the benefit of industrial activity suggests to developers that these uses are accepted
and recognized as valuable counterparts within the urban framework (Mullin and Kotval
2000). Exclusively zoned industrial land is preferred, especially where large contiguous
parcels are adjacent to similar land uses. Abutting parcels buffer and mitigate encroachment,
nuisance complaints, traffic congestion, and rezoning requests (Urban Land Institute 1975,
15). Therefore, appropriate zoning standards streamline development and reduce barriers to
implementation.
Constraints
Environmental Land hosting industrial activity presents a variety of environmental issues. Large
parking lots, rooftops, and roads, generate impervious surfaces comprising more than 70% of
many parcels (Schueler and Holland 2000, 1). This development disrupts the physical
environment and hydrological process, resulting in impaired water resources, wetlands,
waterways, erosion, and flooding. Proper development and siting can mitigate these effects
through environmental impact assessments and planning. Property owners are required to
abide by various environmental policies and regulations that promote environmental
protection. In addition to ecological sensitivity, the general site must respect surrounding land
M. Berube
24
constraints. Delineated Federal Emergency Management Agency (FEMA) floodplains and
steep slopes confine space for development and prohibit activity or expansion. Preserving
and enhancing the natural habitat is vital to the industrial process. Therefore, areas containing
the least amount of environmental constraints are preferred (Mullin and Kotval 2006, 20).
Land subject to flooding presents a risk to development and public safety.
Traditionally, industrial land is located along rivers and canals because of its proximity to
inexpensive hydropower (Urban Land Institute 1975, 12). Adversely, this land remains
underutilized because it lies within or adjacent to floodplains indicated by 100-year flood
zones, which have a one percent chance of flooding in any given year (Federally Emergency
Management Agency). Sites overlapping or adjacent to these areas pose greater insurance
costs and risk potential flooding, requiring expensive flood mitigation strategies like barriers
and retaining walls. Therefore, development within flood zones is an unattractive
characteristic and considered an industrial location constraint.
The goal of the Connecticut Wetlands and Watercourses Act is to minimize the
environmental impact from unregulated development, construction, dredging, dumping, and
filling of Connecticut waterbodies (Connecticut Regulatory Statutes, Section 22 of Chapter
440). Strategic policy to protect wetlands and waterways for wildlife, groundwater
infiltration, and flood control is necessary for a healthy environment (Steiner and Butler 2007,
60). Therefore, a site review and permitting process is required to regulate any new
construction if wetlands are present.
Low impact development (LID), a technique utilized to protect wetlands, often
increases costs associated with developing wetland protection strategies. Thus, development
furthest from these areas is ideal. In a study completed by Reisi et al. (2011), rivers and

M. Berube
25
waterways buffered by a 1,000-meter (3,280 feet) distance detect undevelopable industrial
land due to concerns of environmental degradation. Districts, intersecting these boundaries,
restrict or make future development difficult (Ohri et al. 2010, 107). Consequently, the
amount of available developable land decreases when wetlands are present. Therefore,
wetlands and watercourses are constraints due to potential environmental impacts requiring
strict regulations and permitting processes.
Human activity and new construction intensifies wetland, forest, coastal habitat, river,
lake, and wildlife habitat degradation. These impacts hinder species richness and biodiversity
by separating landmasses and isolating ecosystems. Habitat fragmentation makes it difficult
for species to adapt, migrate, or survive in their natural environment (National Wildlife
Federation). Water, air, soil, and forest cover also suffer from new construction. As a result,
newly proposed projects and planning techniques must consider protecting and enhancing the
surrounding environment. The purpose of the Connecticut Comprehensive Wildlife
Conservation Strategy is to identify endangered natural communities requiring conservation
and protection. Some target areas in Connecticut include acidic white cedar swamps, sand
barren landscapes, and poor fen wetlands. Industrial parcels overlapping these habitat target
areas restrict development and are impediments to new investment. Therefore, the furthest
location from priority habitat areas is most suitable.
Topography and site characteristics affect development, new construction, and
environmental quality. Steep slopes in particular and varying topographic gradients are prone
to erosion, which ultimately affect storm water runoff and infiltration, sedimentation, and
water quality. In addition, precipitous inclines affect site access and development feasibility
(Ohri et al. 2010, 108). According to Reisi et. Al (2011), slopes greater than 10 percent are

M. Berube
26
considered unsuitable for allocating industries. New construction and site improvements may
require excavation or the movement of earth for new buildings, parking lots, and access
points. Sites identified with greater topographic constraints require approval processes or
special permits, increasing the cost and time for a new project to commence. In addition,
property owners may be required to implement precautionary measures to mitigate
environmental impacts. Thus, level land poses fewer costs and obstacles to development than
parcels with more varied terrain.
Factors
Infrastructure and Utilities Industrial activities rely on available utilities and infrastructure. Wastewater
management for manufacturing processes and day-to-day living standards, storm water
infrastructure for precipitation runoff, and clean water for daily usage and fire protection is
standard for success and the ability to locate within a larger community (Steiner and Butler
2007, 244). In addition, fiber-optic networks improve business connectivity, and natural gas
infrastructure improves energy efficiency. However, costs accumulate when properties
require initial infrastructure investment. Therefore, preexisting access improves business
operations and reduces initial upfront costs of development.
Industries require potable water and contribute to the daily waste generated within a
community. Moreover, they are likely to produce large quantities of effluent from industrial
processes, increasing the potential for waste to go untreated, resulting in non-compliance with
the rules and regulations defined by the 1972 Federal Clean Water Act, requiring the nation's
waters to be "swimmable and fishable."2 In addition, pertinent storm water infrastructure
2 United States Clean Water Act
M. Berube
27
drains onsite pollutants, precipitation, and discharge from land surfaces to catch basins and
other receiving infrastructure to manage flooding, erosion and runoff in nearby environments
(Randolph 2004)). The availability of sewer and water systems allow developers to locate
without high costs of capital investment.
Another factor influencing the location of an industry is the availability of
inexpensive and available energy. Projected economic growth, stimulated by the emergence
of natural gas as a future source of power, gives businesses an upper hand for completing jobs
more efficiently. Businesses that have access to this low-cost service are at an advantage
(Jacoby et al. 2011), however the exact location of these utilities in Connecticut is considered
sensitive information and are therefore not included in the GIS analysis.
Connection to fiber-optic internet is also critical for any industrial facility that may
house tenants in need of reliable high-speed internet access. Fiber-optic cables have the
capacity to transmit data at a significantly higher rate of speed than previously used copper
wiring. The United States National Broadband Plan defines fiber-optic technology as a
network capable of transferring data through transparent glass fibers. In urban areas, census
blocks delineate available service areas, which are comprised of individual city blocks
bounded by streets (National Broadband Map, 2014). Industrial firms investing within these
areas require little or no upfront costs to connect to high-speed internet sources.
Transportation Industrial land serves manufacturing, warehousing, and distribution centers, which
require priority locations necessary for receiving, storing, and distributing goods. The
location of these establishments is becoming increasingly important as firms compete to
deliver their products efficiently as possible. According to Morris (2014), transportation
M. Berube
28
alone contributes to nearly 60 percent of all supply chain costs. As a result, accessibility to air
and highway networks strongly influences location for warehousing establishments. In
addition, manufacturing firms also require close proximity to customers and distributors.
These businesses receive raw materials to produce finished products, later delivered to
surrounding markets. Ideally, close proximity to transportation networks allow delivery of
goods and resources in the least amount of time (Bowen Jr. 2008).
In the United States, the Federal Highway Association (FHWA) classifies roads on a
scale from one to five. It is most preferable for industrial businesses to locate as close as
possible to Class 1 roads, which are defined by the FHWA as "hard surface highways
including Interstate and U.S. numbered highways, primary State routes, and all controlled
access highways." Systems designed for high speeds provide travelers with uninterrupted
modes of travel, and allow industrial firms within proximity to utilize the system to deliver or
receive goods without interruption.
The location of industrial land within a city directly influences a company's ability to
connect people with their product. According to the literature, there is significant evidence of
expanding warehousing companies along major ground transportation arteries. For example,
Interstates 20 and 85 near Atlanta, Georgia have seen abundant growth in distribution centers
due to the location of interstate junctions (Quinn, 2005). Efficient transportation routes and
proximity to major highways are responsible for connecting warehousing companies to
various locations serving other communities. In addition, this connectivity within an urban
highway system also creates jobs for city residents. According to the literature from an
analysis conducted by Ohri et al. (2010), most suitable industrial space is located within 100
M. Berube
29
meters (328 feet) to a major highway, while as the location increases between business
location and highway access, their suitability decreases as a strategic location.
The flexibility of choice also gives firms the control to pick the least expensive
method for receiving or distributing goods (Smith 1981, 69-70). Besides highways, airports
are equally important and capable of distributing goods to distant locations in a shorter period
of time (Bowen Jr. 2008). According to the Connecticut Statewide Airport System Plan
(2006) and the Federal Aviation Administration, Bradley International Airport in Windsor,
Connecticut and Stewart International Airport in New Windsor, New York, provide cargo
services for businesses in the area. These locations offer industrial firms two options for
receiving and delivering goods. Evidently, manufacturing or warehousing in close proximity
to airports gives businesses an upper hand.
Public transportation access within one-quarter mile of industrial districts is an
attractive quality for both business owners and employees. This convenience allows the local
residents to utilize public transit, bike, or walk to work. Furthermore, public transit reduces
congestion on nearby roadways. However, this is contingent upon commuters who are
willing and able to utilize it. According to research studies, one-quarter mile is the distance
most people will walk to a bus stop, especially concerning a workplace (Transportation
Research Board 2007, 56). As the distance to a transit stops increases, the likelihood for
residents to utilize the system decreases. As a result, businesses, homes, and other locations
within this network benefit from increased connectivity.
Weighted Overlay Analysis and Multi-criteria Evaluation GIS enhances land use, environmental management, and economic development
decisions. a weighted overlay sensitivity analysis is an effective method utilized to identify
M. Berube
30
optimum spatial patterns for future land uses according to multiple criteria (Crosetto et al
2000, 72). Where there is a lack of literature defining specific information, a sensitivity
analysis quantifies the importance of individual factors necessary to achieve a given precision
in the model output (Malczewski 1999). Two methods evaluate input criteria: Boolean
overlay and weighted linear combination. The Boolean overlay method assesses criteria with
thresholds for suitability in which logical operators, intersection (AND) and union (OR), are
applied to specific amenities, factors, and constraints. The weighted linear combination
assesses standardized continuous criteria, which then aggregates other factors using a
weighted average. The intersection or output produces a land suitability map with respect to
map layers (Jiang and Eastman 2000). This project models both factors (criteria ranked
ordinally) and constraints (binary values) to spatially measure the degree of importance for
each input, in order to identify priority industrial land.
M. Berube
31
Chapter 3. Study Area Overview
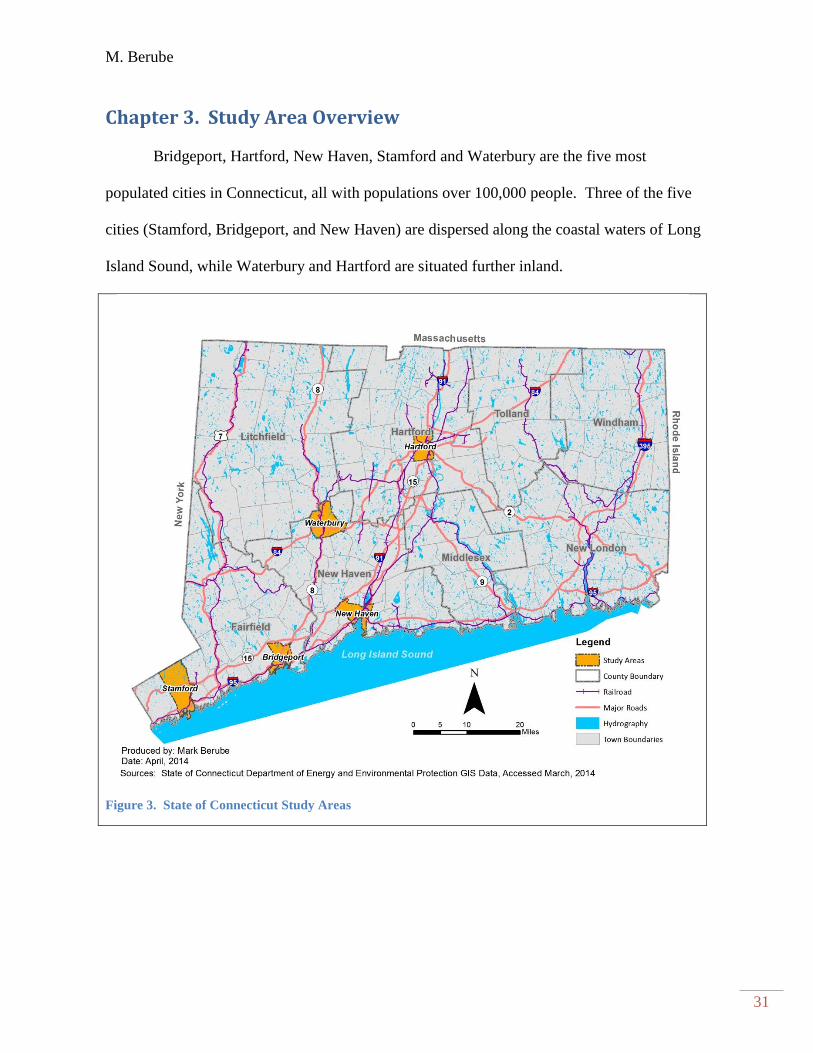
Bridgeport, Hartford, New Haven, Stamford and Waterbury are the five most
populated cities in Connecticut, all with populations over 100,000 people. Three of the five
cities (Stamford, Bridgeport, and New Haven) are dispersed along the coastal waters of Long
Island Sound, while Waterbury and Hartford are situated further inland.
Figure 3. State of Connecticut Study Areas
-

M. Berube
32
Table 5. Study Area and 2012 Population
City Population
Bridgeport 146,425
New Haven 130,741
Stamford 125,109
Hartford 124,893
Waterbury 109,915 Source: U.S. Census Bureau, Population Division, Release Date: May 2013, 2012 Annual Estimates of the
Resident Population for Incorporated Places Over 50,000
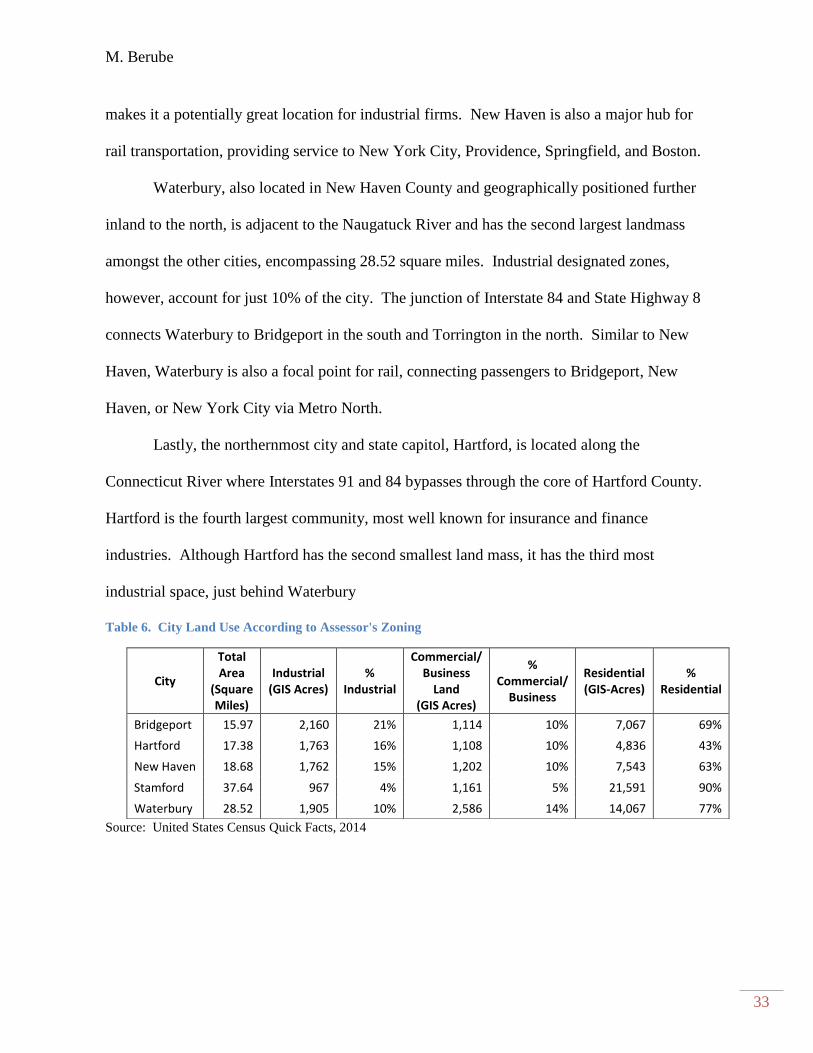
Bridgeport and Stamford are located in Fairfield County, along Long Island Sound, in
the southwest region of Connecticut. Bridgeport, the densest Connecticut city, is home to the
most residents and covers just 16 square miles of land. Although it is the smallest community
geographically, industrial zones account for nearly 21%, or 2,160 acres of land, more than any
other city. Stamford, on the other hand, has the largest landmass, 37.64 square miles, but only
delineates only 4% of its property for industry. Alternatively, residential zones account for
90% of city land, and Stamford's prominent central business district is home to four Fortune
500 Companies. Although industry lacks within the city, Stamford generates the largest labor
force in Connecticut, most likely due to its location where a large percentage of residents
commute daily to New York City.34
New Haven and Waterbury are located in New Haven County and are the second and
fifth most populated cities in Connecticut. Situated in the south central region of the State,
New Haven is at the crossroads of Interstate 95, which connects all of the communities along
the coast, and Interstate 91, traverses north and south linking New Haven to Hartford and
Springfield, Massachusetts. The location of this community within the highway system
3 http://stamford.dailyvoice.com/business/11-fairfield-county-companies-make-fortune-500-list, Four Stamford
Companies Make The Fortune 500 List 05/06/13 4 http://www.stamfordct.gov/economic-development/pages/market-profile, market profile
M. Berube
33
makes it a potentially great location for industrial firms. New Haven is also a major hub for
rail transportation, providing service to New York City, Providence, Springfield, and Boston.
Waterbury, also located in New Haven County and geographically positioned further
inland to the north, is adjacent to the Naugatuck River and has the second largest landmass
amongst the other cities, encompassing 28.52 square miles. Industrial designated zones,
however, account for just 10% of the city. The junction of Interstate 84 and State Highway 8
connects Waterbury to Bridgeport in the south and Torrington in the north. Similar to New
Haven, Waterbury is also a focal point for rail, connecting passengers to Bridgeport, New
Haven, or New York City via Metro North.
Lastly, the northernmost city and state capitol, Hartford, is located along the
Connecticut River where Interstates 91 and 84 bypasses through the core of Hartford County.
Hartford is the fourth largest community, most well known for insurance and finance
industries. Although Hartford has the second smallest land mass, it has the third most
industrial space, just behind Waterbury
Table 6. City Land Use According to Assessor's Zoning
City
Total Area
(Square Miles)
Industrial (GIS Acres)
% Industrial
Commercial/ Business
Land (GIS Acres)
% Commercial/
Business
Residential (GIS-Acres)
% Residential
Bridgeport 15.97 2,160 21% 1,114 10% 7,067 69%
Hartford 17.38 1,763 16% 1,108 10% 4,836 43%
New Haven 18.68 1,762 15% 1,202 10% 7,543 63%
Stamford 37.64 967 4% 1,161 5% 21,591 90%
Waterbury 28.52 1,905 10% 2,586 14% 14,067 77%
Source: United States Census Quick Facts, 2014

M. Berube
34
Industrial Economic Outlook Employment, business growth, and salary data indicate how well Connecticut
businesses and employees performed between 2002 and 2012 within the manufacturing sector
(North American Industry Classification System level 31-33). Although more recent data
better represents the current status of manufacturing beyond the recession, information after
2012 is unavailable. Utilizing data from the Connecticut Quarterly Census of Employment
and Wages (QCEW) program and Connecticut Department of Labor (DOL), likely changes in
occupation growth measure recent trends in manufacturing for cities and Workforce
Investment Areas (WIA).
First, an overview of the manufacturing business sector analyzes the change in volume
of employees and businesses. Next, DOL Occupational Projections examine employment
opportunities for each Connecticut WIA through the year 2020: Southwest WIA (Bridgeport
and Stamford), South Central WIA (New Haven), Northwest WIA (Waterbury), and North
Central WIA (Hartford). Each WIA is comprised of many towns, representing a regional
workforce, as opposed to a specific community. These data assess how technology and
growth will continue to affect the industrial make-up and labor pool in each geographic area
for the next five to six years.
M. Berube
35
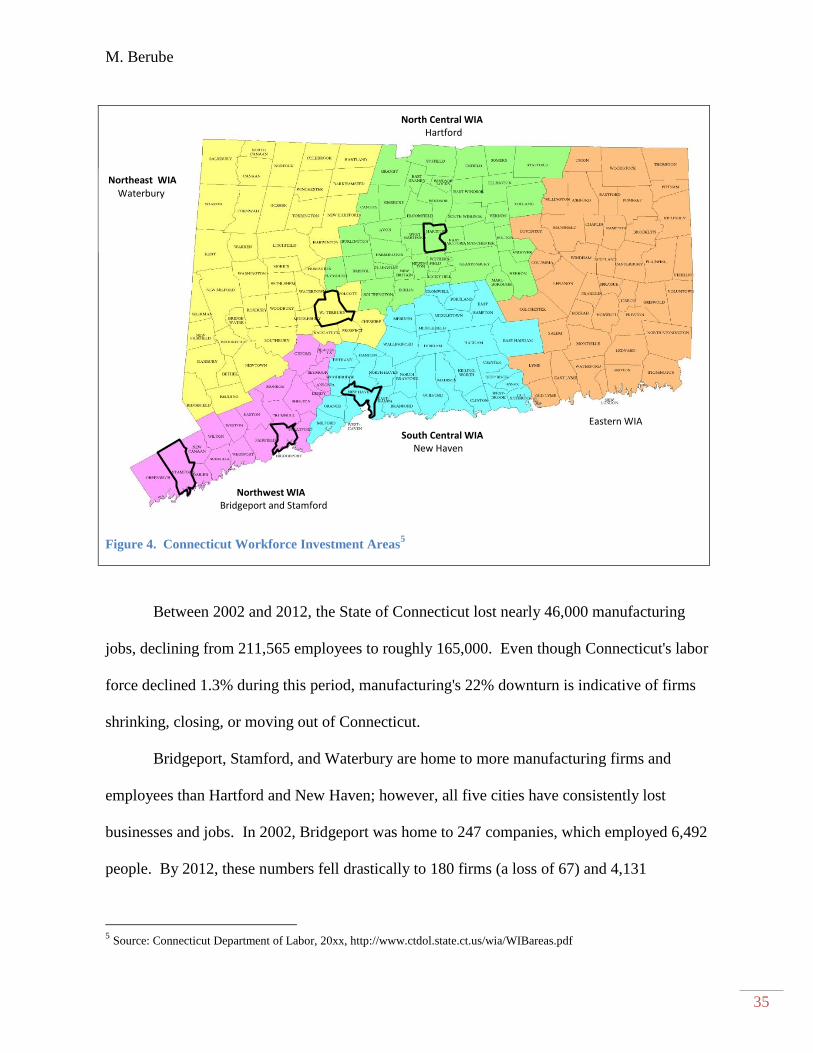
Figure 4. Connecticut Workforce Investment Areas5
Between 2002 and 2012, the State of Connecticut lost nearly 46,000 manufacturing
jobs, declining from 211,565 employees to roughly 165,000. Even though Connecticut's labor
force declined 1.3% during this period, manufacturing's 22% downturn is indicative of firms
shrinking, closing, or moving out of Connecticut.
Bridgeport, Stamford, and Waterbury are home to more manufacturing firms and
employees than Hartford and New Haven; however, all five cities have consistently lost
businesses and jobs. In 2002, Bridgeport was home to 247 companies, which employed 6,492
people. By 2012, these numbers fell drastically to 180 firms (a loss of 67) and 4,131
5 Source: Connecticut Department of Labor, 20xx, http://www.ctdol.state.ct.us/wia/WIBareas.pdf
North Central WIA Hartford
Eastern WIA
South Central WIA New Haven
Northwest WIA Bridgeport and Stamford
Northeast WIA Waterbury
M. Berube
36
employees. Bridgeport alone lost 36.4% of its manufacturing workforce over the ten-year
period, more than any other Connecticut city.
Stamford and Waterbury lost a significant portion of their manufacturing base as well,
losing approximately 60 factories and 1,800 employees in each city. Moreover, Stamford
observed the largest change in total firms. In 2012, nearly 35.7% of existing companies were
no longer located in the community. Although Stamford's manufacturing market is declining,
the Business and Professional Services, Finance and Insurance, and Information sectors have
seen substantial growth over the past ten years. This exchange between job markets illustrates
the conversion from goods producing industries to service sector economies, and the potential
demise of industrial land by commercial businesses.
Manufacturing business trends are also similar in Hartford and New Haven. Each
community, although they are home to the fewest number of manufacturing businesses and
employees, experienced the smallest change in rates. In 2002, 101 and 99 manufacturing
firms were located in New Haven and Hartford, respectively. By 2012, New Haven lost 10 of
these businesses while Hartford, on the other hand, lost nearly three times as many (28.3%).
Although Hartford has the third highest rate among all cities, 26% of employees were
displaced, the second fewest behind New Haven. New Haven's employment trends were most
optimistic: between 2002 and 2012, 18.8% of the manufacturing labor force no longer worked
in the city. This number ranges between 7% and 17% fewer than Bridgeport, Hartford,
Stamford, or Waterbury.
Most recently, between 2011 and 2012, manufacturing employment in Hartford, New
Haven, and Waterbury, and each WIA (except the Southwest) has shown positive signs of
growth. Although Connecticut lost only 0.65% of manufacturing laborers between 2011 and
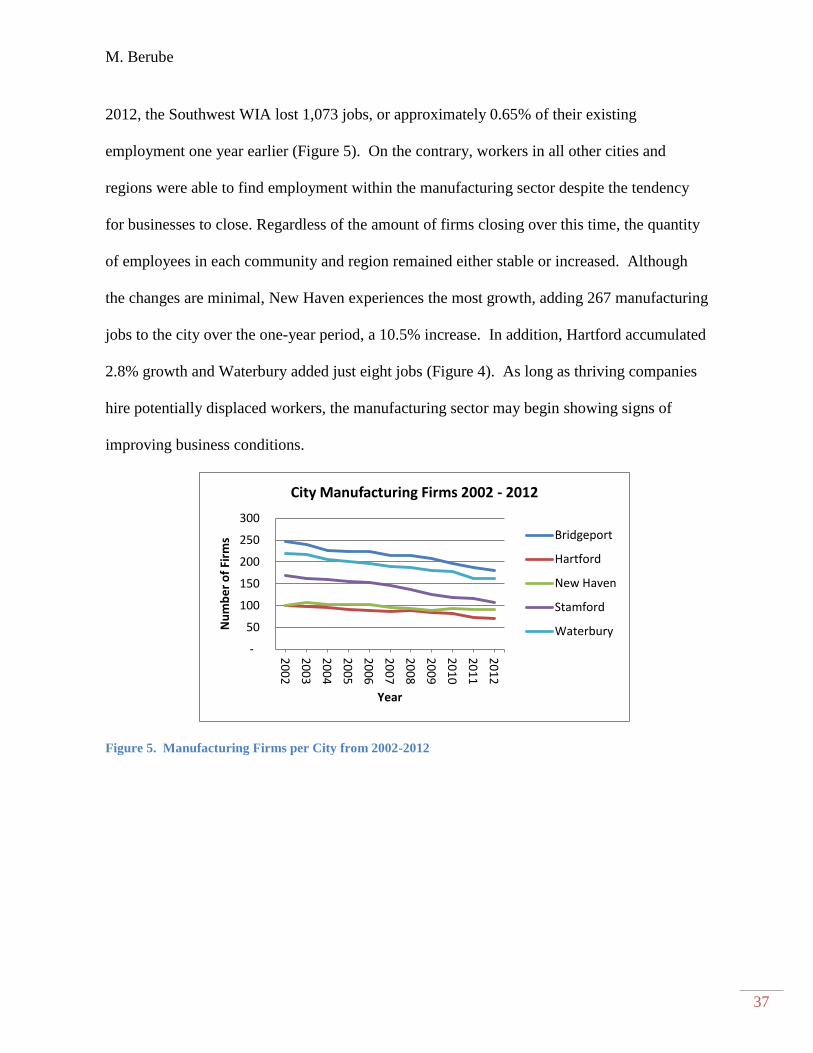
M. Berube
37
2012, the Southwest WIA lost 1,073 jobs, or approximately 0.65% of their existing
employment one year earlier (Figure 5). On the contrary, workers in all other cities and
regions were able to find employment within the manufacturing sector despite the tendency
for businesses to close. Regardless of the amount of firms closing over this time, the quantity
of employees in each community and region remained either stable or increased. Although
the changes are minimal, New Haven experiences the most growth, adding 267 manufacturing
jobs to the city over the one-year period, a 10.5% increase. In addition, Hartford accumulated
2.8% growth and Waterbury added just eight jobs (Figure 4). As long as thriving companies
hire potentially displaced workers, the manufacturing sector may begin showing signs of
improving business conditions.
Figure 5. Manufacturing Firms per City from 2002-2012
-
-
50
100
150
200
250
300 2
00
2
20
03
20
04
20
05
20
06
20
07
20
08
20
09
20
10
20
11
20
12
Nu
mb
er
of
Firm
s
Year
City Manufacturing Firms 2002 - 2012
Bridgeport
Hartford
New Haven
Stamford
Waterbury
M. Berube
38
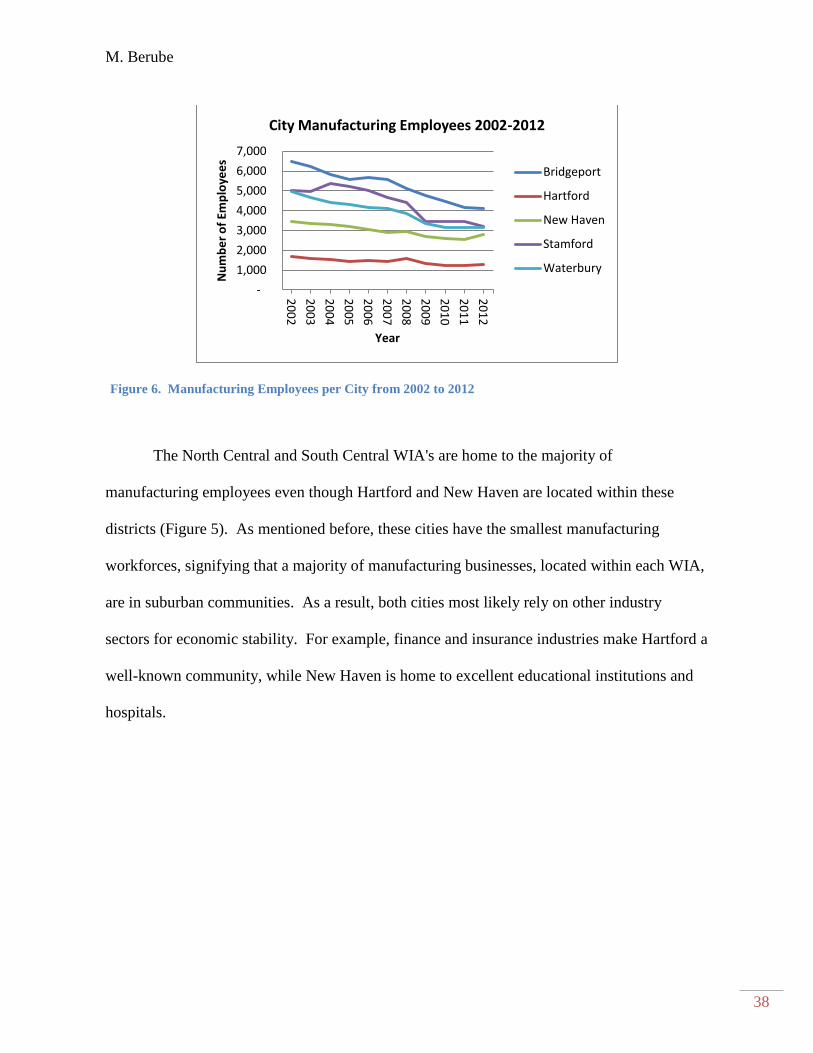
Figure 6. Manufacturing Employees per City from 2002 to 2012
The North Central and South Central WIA's are home to the majority of
manufacturing employees even though Hartford and New Haven are located within these
districts (Figure 5). As mentioned before, these cities have the smallest manufacturing
workforces, signifying that a majority of manufacturing businesses, located within each WIA,
are in suburban communities. As a result, both cities most likely rely on other industry
sectors for economic stability. For example, finance and insurance industries make Hartford a
well-known community, while New Haven is home to excellent educational institutions and
hospitals.
-
1,000
2,000
3,000
4,000
5,000
6,000
7,000
20
02
20
03
20
04
20
05
20
06
20
07
20
08
20
09
20
10
20
11
20
12
Nu
mb
er
of
Emp
loye
es
Year
City Manufacturing Employees 2002-2012
Bridgeport
Hartford
New Haven
Stamford
Waterbury
M. Berube
39
-
Table 7. Change in Employment and Firms, 2002 to 2012 in Connecticut Cities
Change 2002-2012
Bridgeport Hartford New Haven Stamford Waterbury
# % # % # % # % # %
Firms -67 -27.1% -28 -28.3% -11 -10.9% -60 -35.7% -59 -26.8%
Employees -2,361 -36.4% -443 -26.0% -648 -18.8% -1,788 -35.8% -1,818 -36.5%
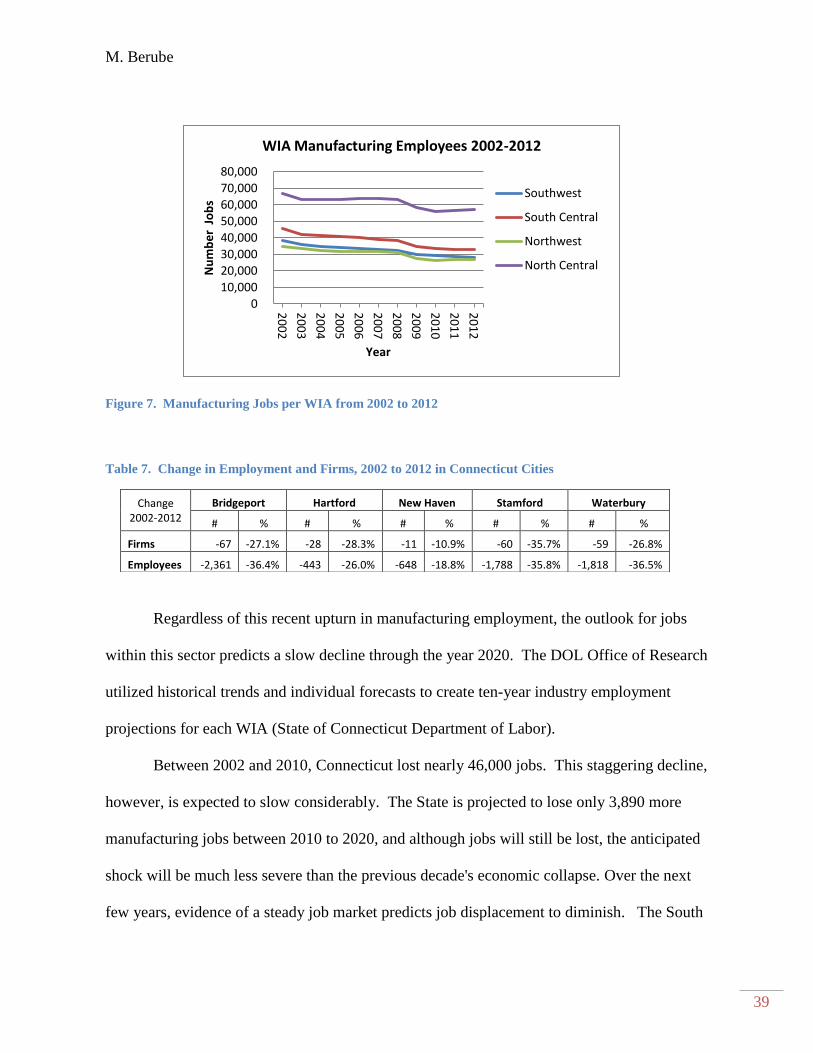
Regardless of this recent upturn in manufacturing employment, the outlook for jobs
within this sector predicts a slow decline through the year 2020. The DOL Office of Research
utilized historical trends and individual forecasts to create ten-year industry employment
projections for each WIA (State of Connecticut Department of Labor).
Between 2002 and 2010, Connecticut lost nearly 46,000 jobs. This staggering decline,
however, is expected to slow considerably. The State is projected to lose only 3,890 more
manufacturing jobs between 2010 to 2020, and although jobs will still be lost, the anticipated
shock will be much less severe than the previous decade's economic collapse. Over the next
few years, evidence of a steady job market predicts job displacement to diminish. The South
Figure 7. Manufacturing Jobs per WIA from 2002 to 2012
0 10,000 20,000 30,000 40,000 50,000 60,000 70,000 80,000
20
02
20
03
20
04
20
05
20
06
20
07
20
08
20
09
20
10
20
11
20
12
Nu
mb
er
Jo
bs
Year
WIA Manufacturing Employees 2002-2012
Southwest
South Central
Northwest
North Central

M. Berube
40
Central, North Central, and Southwest regions expect a loss of 3.1% to 3.3% of existing jobs.
The Northwest, however, anticipates losing just 0.6% of existing manufacturing jobs.
Table 8. Manufacturing Employment Projections - 2010 to 2020
Employment Estimate
2010
Employment Projection
2020
Employment Change
2002-2010
% Change 2002-2010
Employment Change
2010-2020
% Change 2010-2020
Connecticut 165,565 161,675 -46,000 -21.7% -3,890 -2.3%
Southwest 29,225 28,323 -8,946 -23.4% -902 -3.1%
South Central 33,356 32,272 -12,490 -27.2% -1,084 -3.3%
Northwest 26,525 26,354 -8,523 -24.3% -171 -0.6%
North Central 56,116 54,307 -11,034 -16.4% -1,809 -3.2%
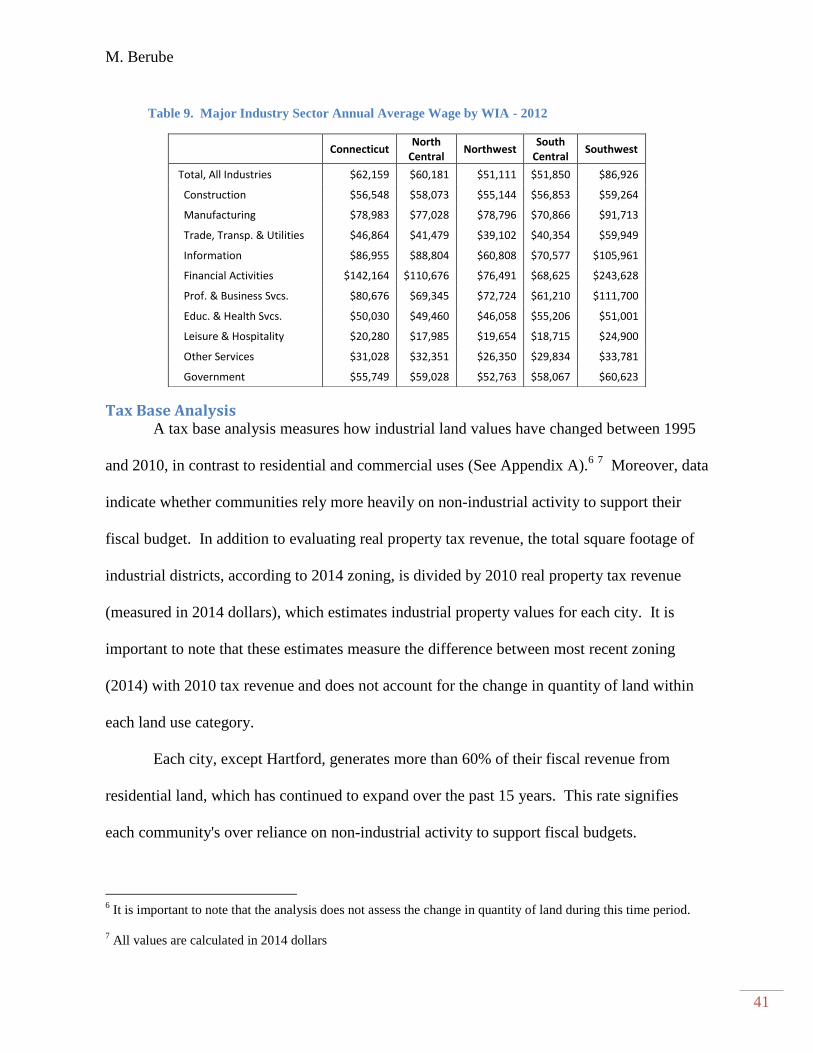
Despite these deficits, manufacturing in Connecticut remains one of the highest paying
industries, averaging $78,893 per capita annually, the fourth highest behind Professional and
Business Services, Information, and Financial sectors. Annual average wages for
manufacturing employees in each WIA are also consistently higher than most other industries.
In the Northwest and South Central regions, manufacturing employees are the highest wage
earners; and in the North Central and Southwest, manufacturing is third and fourth most
profitable, respectively (Table 7).
M. Berube
41
Table 9. Major Industry Sector Annual Average Wage by WIA - 2012
Connecticut North
Central Northwest
South Central
Southwest
Total, All Industries $62,159 $60,181 $51,111 $51,850 $86,926
Construction $56,548 $58,073 $55,144 $56,853 $59,264
Manufacturing $78,983 $77,028 $78,796 $70,866 $91,713
Trade, Transp. & Utilities $46,864 $41,479 $39,102 $40,354 $59,949
Information $86,955 $88,804 $60,808 $70,577 $105,961
Financial Activities $142,164 $110,676 $76,491 $68,625 $243,628
Prof. & Business Svcs. $80,676 $69,345 $72,724 $61,210 $111,700
Educ. & Health Svcs. $50,030 $49,460 $46,058 $55,206 $51,001
Leisure & Hospitality $20,280 $17,985 $19,654 $18,715 $24,900
Other Services $31,028 $32,351 $26,350 $29,834 $33,781
Government $55,749 $59,028 $52,763 $58,067 $60,623
Tax Base Analysis A tax base analysis measures how industrial land values have changed between 1995
and 2010, in contrast to residential and commercial uses (See Appendix A).6 7 Moreover, data
indicate whether communities rely more heavily on non-industrial activity to support their
fiscal budget. In addition to evaluating real property tax revenue, the total square footage of
industrial districts, according to 2014 zoning, is divided by 2010 real property tax revenue
(measured in 2014 dollars), which estimates industrial property values for each city. It is
important to note that these estimates measure the difference between most recent zoning
(2014) with 2010 tax revenue and does not account for the change in quantity of land within
each land use category.
Each city, except Hartford, generates more than 60% of their fiscal revenue from
residential land, which has continued to expand over the past 15 years. This rate signifies
each community's over reliance on non-industrial activity to support fiscal budgets.
6 It is important to note that the analysis does not assess the change in quantity of land during this time period.
7 All values are calculated in 2014 dollars
M. Berube
42
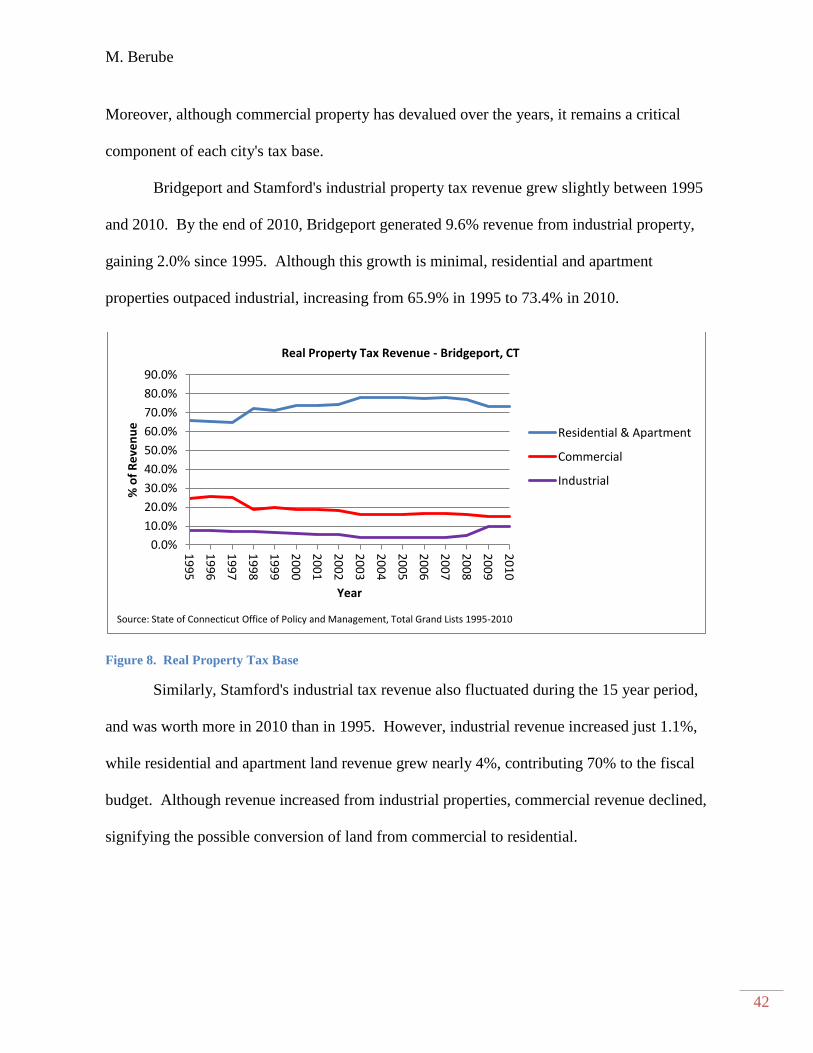
Moreover, although commercial property has devalued over the years, it remains a critical
component of each city's tax base.
Bridgeport and Stamford's industrial property tax revenue grew slightly between 1995
and 2010. By the end of 2010, Bridgeport generated 9.6% revenue from industrial property,
gaining 2.0% since 1995. Although this growth is minimal, residential and apartment
properties outpaced industrial, increasing from 65.9% in 1995 to 73.4% in 2010.
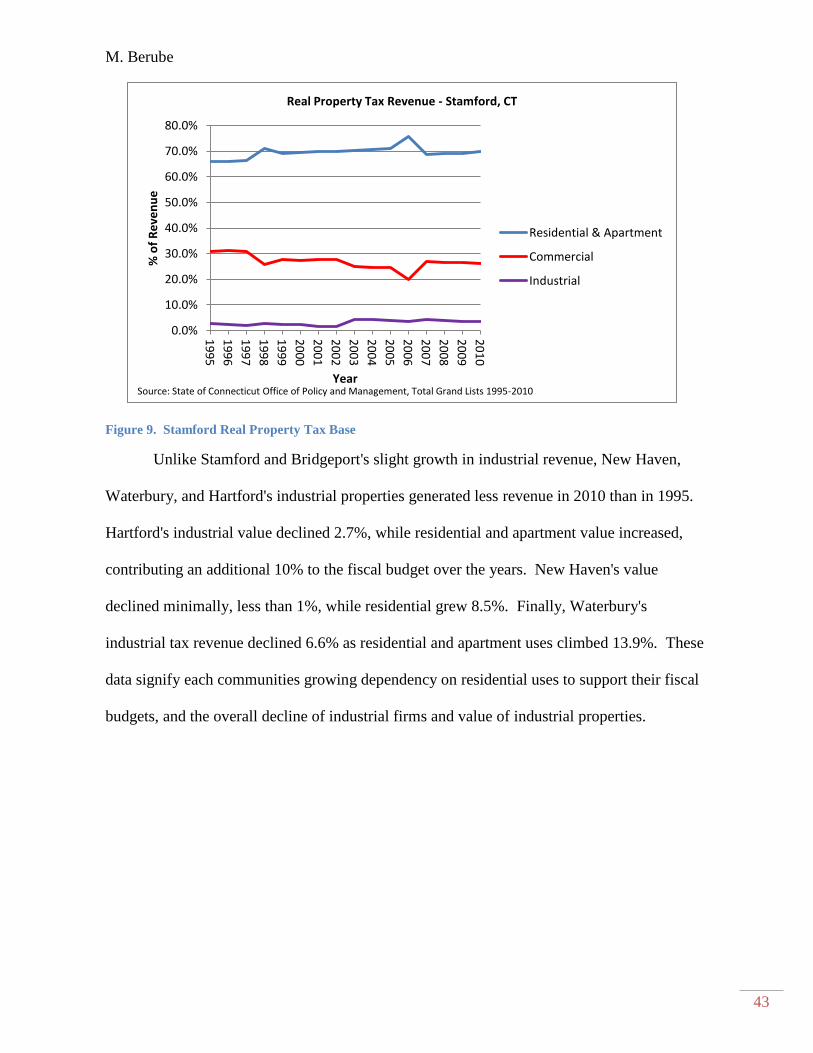
Similarly, Stamford's industrial tax revenue also fluctuated during the 15 year period,
and was worth more in 2010 than in 1995. However, industrial revenue increased just 1.1%,
while residential and apartment land revenue grew nearly 4%, contributing 70% to the fiscal
budget. Although revenue increased from industrial properties, commercial revenue declined,
signifying the possible conversion of land from commercial to residential.
Figure 8. Real Property Tax Base
0.0%
10.0%
20.0%
30.0%
40.0%
50.0%
60.0%
70.0%
80.0%
90.0%
19
95
19
96
19
97
19
98
19
99
20
00
20
01
20
02
20
03
20
04
20
05
20
06
20
07
20
08
20
09
20
10
% o
f R
eve
nu
e
Year
Real Property Tax Revenue - Bridgeport, CT
Residential & Apartment
Commercial
Industrial
Source: State of Connecticut Office of Policy and Management, Total Grand Lists 1995-2010
M. Berube
43
Unlike Stamford and Bridgeport's slight growth in industrial revenue, New Haven,
Waterbury, and Hartford's industrial properties generated less revenue in 2010 than in 1995.
Hartford's industrial value declined 2.7%, while residential and apartment value increased,
contributing an additional 10% to the fiscal budget over the years. New Haven's value
declined minimally, less than 1%, while residential grew 8.5%. Finally, Waterbury's
industrial tax revenue declined 6.6% as residential and apartment uses climbed 13.9%. These
data signify each communities growing dependency on residential uses to support their fiscal
budgets, and the overall decline of industrial firms and value of industrial properties.
Figure 9. Stamford Real Property Tax Base
0.0%
10.0%
20.0%
30.0%
40.0%
50.0%
60.0%
70.0%
80.0%
19
95
19
96
19
97
19
98
19
99
20
00
20
01
20
02
20
03
20
04
20
05
20
06
20
07
20
08
20
09
20
10
% o
f R
eve
nu
e
Year
Real Property Tax Revenue - Stamford, CT
Residential & Apartment
Commercial
Industrial
Source: State of Connecticut Office of Policy and Management, Total Grand Lists 1995-2010
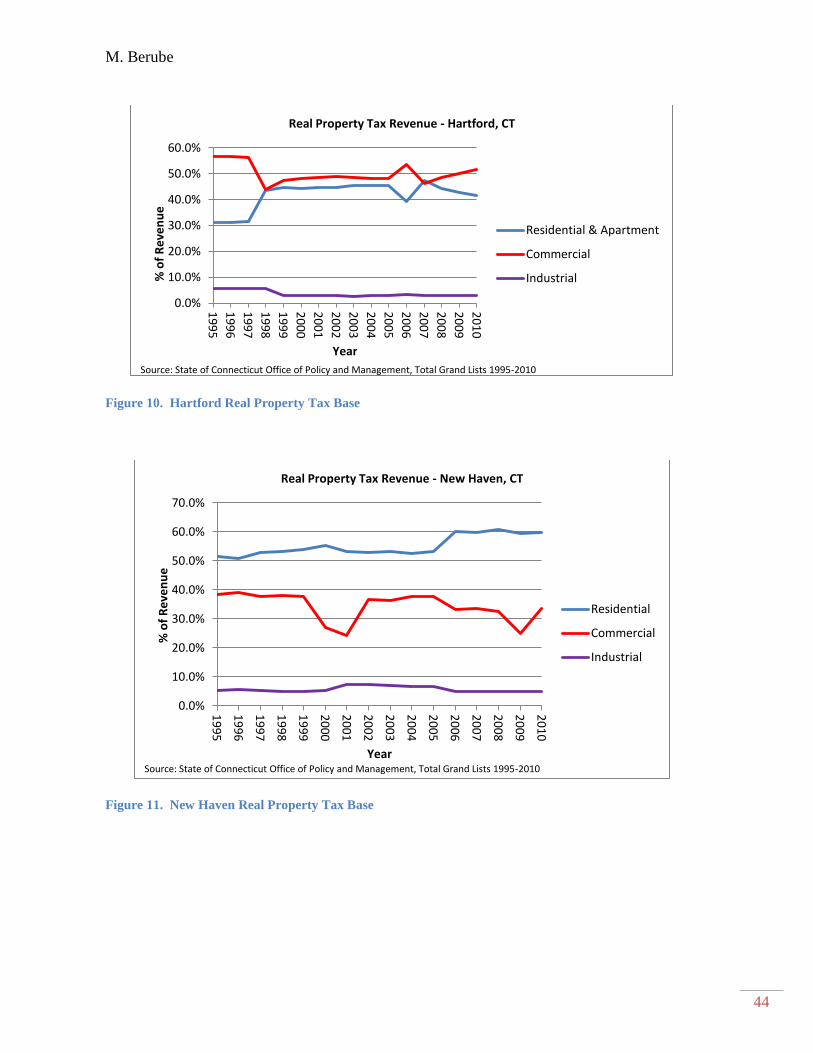
M. Berube
44
Figure 10. Hartford Real Property Tax Base
-
Figure 11. New Haven Real Property Tax Base
-
0.0%
10.0%
20.0%
30.0%
40.0%
50.0%
60.0%
19
95
19
96
19
97
19
98
19
99
20
00
20
01
20
02
20
03
20
04
20
05
20
06
20
07
20
08
20
09
20
10
% o
f R
eve
nu
e
Year
Real Property Tax Revenue - Hartford, CT
Residential & Apartment
Commercial
Industrial
Source: State of Connecticut Office of Policy and Management, Total Grand Lists 1995-2010
0.0%
10.0%
20.0%
30.0%
40.0%
50.0%
60.0%
70.0%
19
95
19
96
19
97
19
98
19
99
20
00
20
01
20
02
20
03
20
04
20
05
20
06
20
07
20
08
20
09
20
10
% o
f R
eve
nu
e
Year
Real Property Tax Revenue - New Haven, CT
Residential
Commercial
Industrial
Source: State of Connecticut Office of Policy and Management, Total Grand Lists 1995-2010
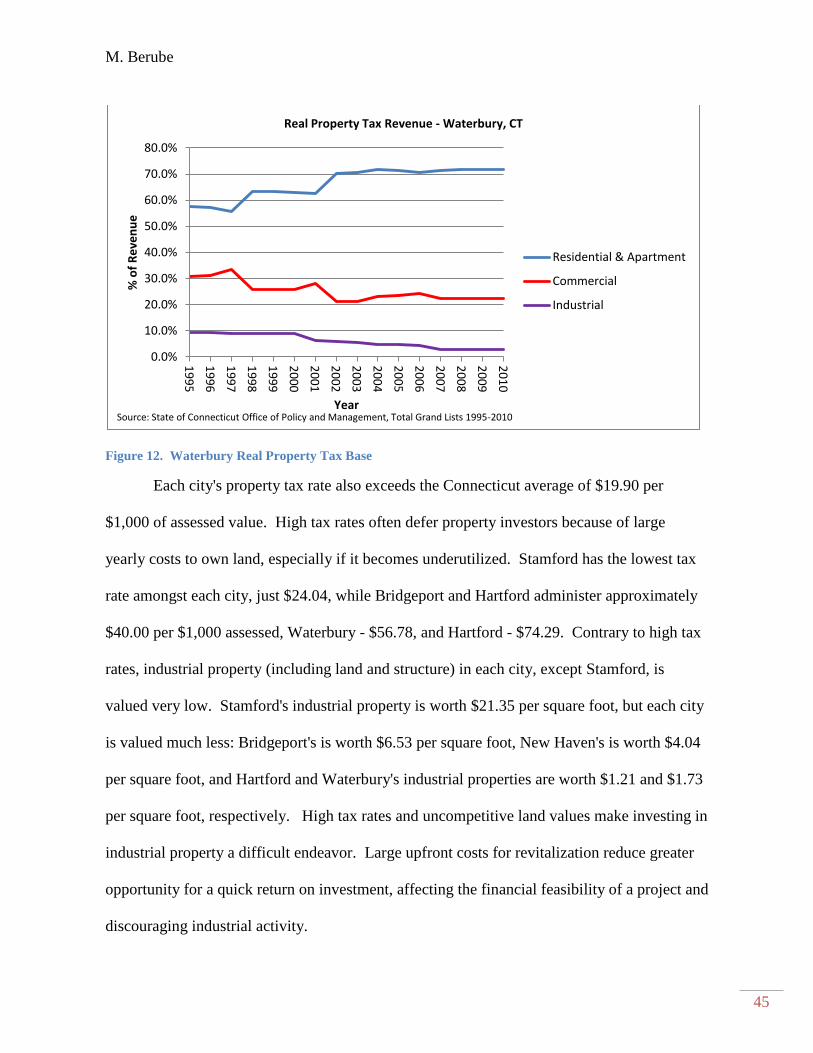
M. Berube
45
Figure 12. Waterbury Real Property Tax Base
Each city's property tax rate also exceeds the Connecticut average of $19.90 per
$1,000 of assessed value. High tax rates often defer property investors because of large
yearly costs to own land, especially if it becomes underutilized. Stamford has the lowest tax
rate amongst each city, just $24.04, while Bridgeport and Hartford administer approximately
$40.00 per $1,000 assessed, Waterbury - $56.78, and Hartford - $74.29. Contrary to high tax
rates, industrial property (including land and structure) in each city, except Stamford, is
valued very low. Stamford's industrial property is worth $21.35 per square foot, but each city
is valued much less: Bridgeport's is worth $6.53 per square foot, New Haven's is worth $4.04
per square foot, and Hartford and Waterbury's industrial properties are worth $1.21 and $1.73
per square foot, respectively. High tax rates and uncompetitive land values make investing in
industrial property a difficult endeavor. Large upfront costs for revitalization reduce greater
opportunity for a quick return on investment, affecting the financial feasibility of a project and
discouraging industrial activity.
0.0%
10.0%
20.0%
30.0%
40.0%
50.0%
60.0%
70.0%
80.0%
19
95
19
96
19
97
19
98
19
99
20
00
20
01
20
02
20
03
20
04
20
05
20
06
20
07
20
08
20
09
20
10
% o
f R
eve
nu
e
Year
Real Property Tax Revenue - Waterbury, CT
Residential & Apartment
Commercial
Industrial
Source: State of Connecticut Office of Policy and Management, Total Grand Lists 1995-2010
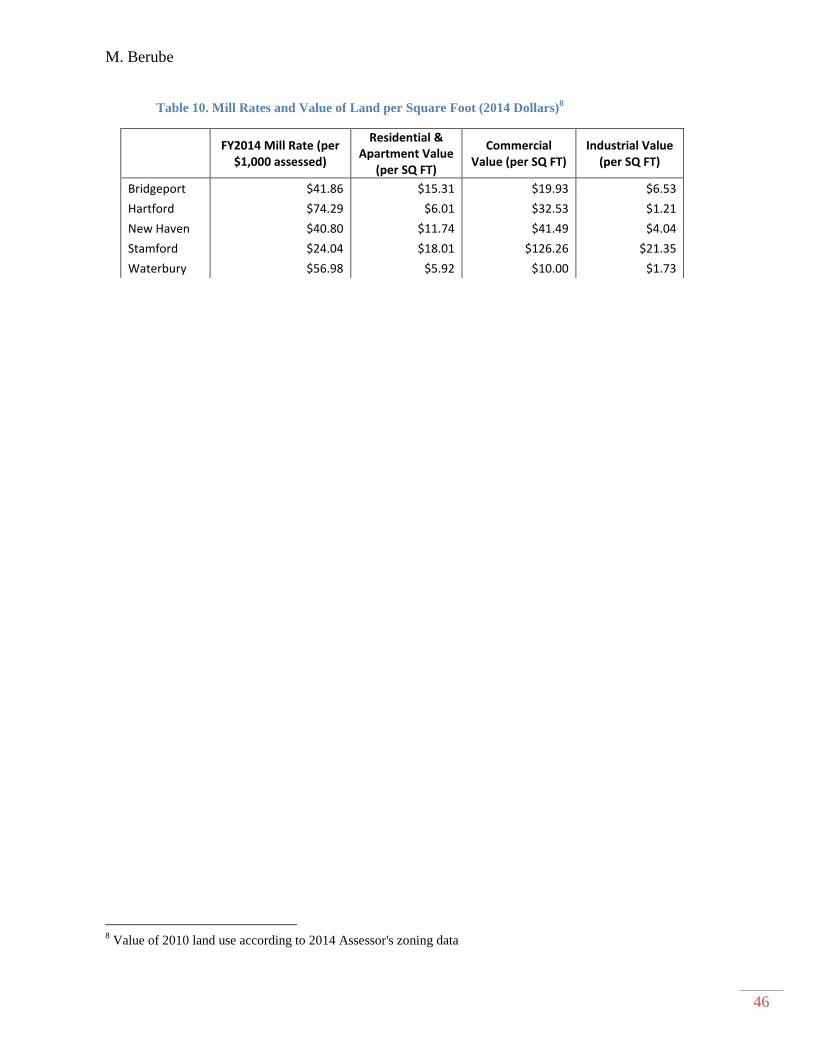
M. Berube
46
8 Value of 2010 land use according to 2014 Assessor's zoning data
Table 10. Mill Rates and Value of Land per Square Foot (2014 Dollars)8
FY2014 Mill Rate (per $1,000 assessed)
Residential & Apartment Value
(per SQ FT)
Commercial Value (per SQ FT)
Industrial Value (per SQ FT)
Bridgeport $41.86 $15.31 $19.93 $6.53
Hartford $74.29 $6.01 $32.53 $1.21
New Haven $40.80 $11.74 $41.49 $4.04
Stamford $24.04 $18.01 $126.26 $21.35
Waterbury $56.98 $5.92 $10.00 $1.73
M. Berube
47
Chapter 4. GIS Analysis
A GIS multi-criteria evaluation identifies industrial land suitable for protection and
investment in a three-part analysis. First, Part 1 conducts a constraint analysis to identify and
remove any environmental restrictions within industrial zones; all remaining land, defined as
developable and assessed through the end of the GIS process, is measured for suitability.
After removing all constraints and classifying developable land, Part 2 conducts a weighted
overlay factor analysis, measuring four different criteria effecting location and suitability for
industrial business investment. Lastly, Part 3 combines developable industrial land from Part
1 with the output from Part 2 to identify the most suitable developable industrial districts. In
addition, the analysis identifies industrial parcels not adjacent to residential land uses, and one
prime parcel, prime for investment, demonstrates principle industrial location characteristics
Part 1: Constraint Analysis
A constraint analysis identifies areas of land that restrict or make development and
investment impractical according to Best Management Practices and development guidelines.
Based on literature and reports, industrial zones have six constraints removed from existing
districts: hydrology, wetlands, 100-year flood zones, habitat protections areas, natural
diversity areas, and slopes greater than 15% (derived from a GIS slope analysis using 1/3 arc-
second USGS National Elevation Data). Connecticut's GIS database, organized by the
Department of Energy and Environmental protection CT DEEP, provide all other data layers.
The analysis merges each environmental constraint into one layer, and after these areas of
land are "erased" from the process, developable industrial land remains for each Connecticut
city. The final output creates one definitive layer called Developable Industrial Land.
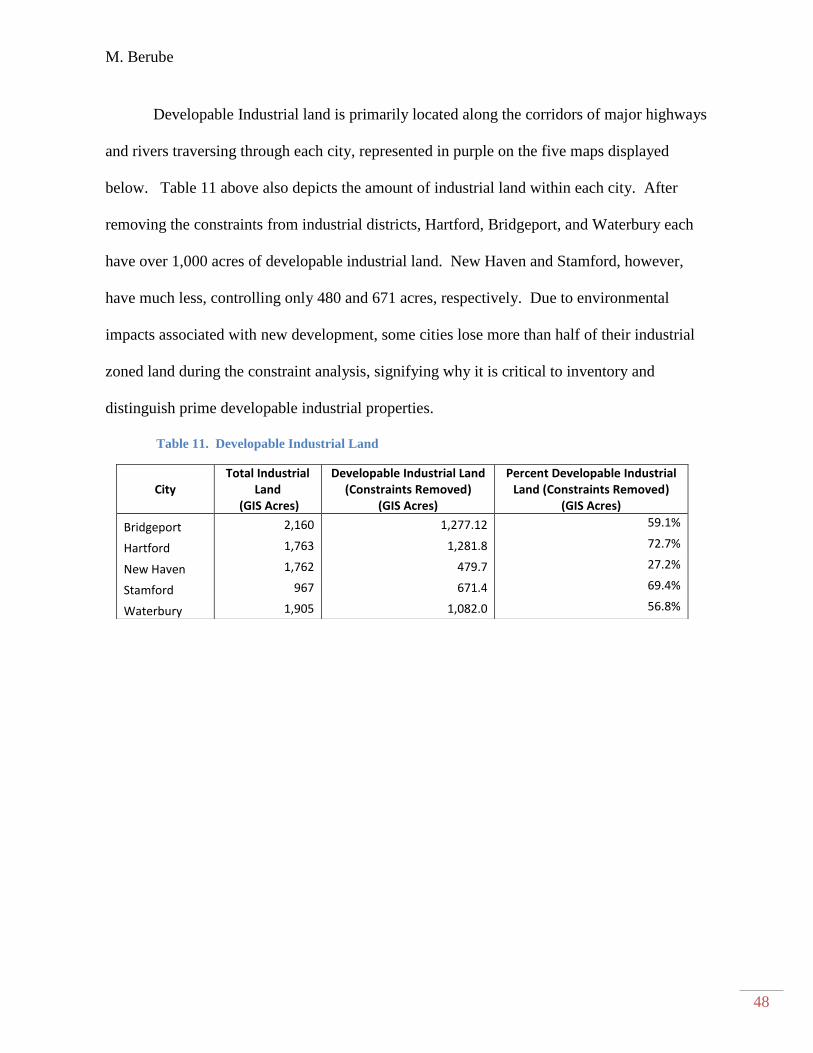
M. Berube
48
Developable Industrial land is primarily located along the corridors of major highways
and rivers traversing through each city, represented in purple on the five maps displayed
below. Table 11 above also depicts the amount of industrial land within each city. After
removing the constraints from industrial districts, Hartford, Bridgeport, and Waterbury each
have over 1,000 acres of developable industrial land. New Haven and Stamford, however,
have much less, controlling only 480 and 671 acres, respectively. Due to environmental
impacts associated with new development, some cities lose more than half of their industrial
zoned land during the constraint analysis, signifying why it is critical to inventory and
distinguish prime developable industrial properties.
Table 11. Developable Industrial Land
City Total Industrial
Land (GIS Acres)
Developable Industrial Land (Constraints Removed)
(GIS Acres)
Percent Developable Industrial Land (Constraints Removed)
(GIS Acres)
Bridgeport 2,160 1,277.12 59.1%
Hartford 1,763 1,281.8 72.7%
New Haven 1,762 479.7 27.2%
Stamford 967 671.4 69.4%
Waterbury 1,905 1,082.0 56.8%

M. Berube
49
Figure 13. Bridgeport Existing Land Use Depicting Developable Industrial Land
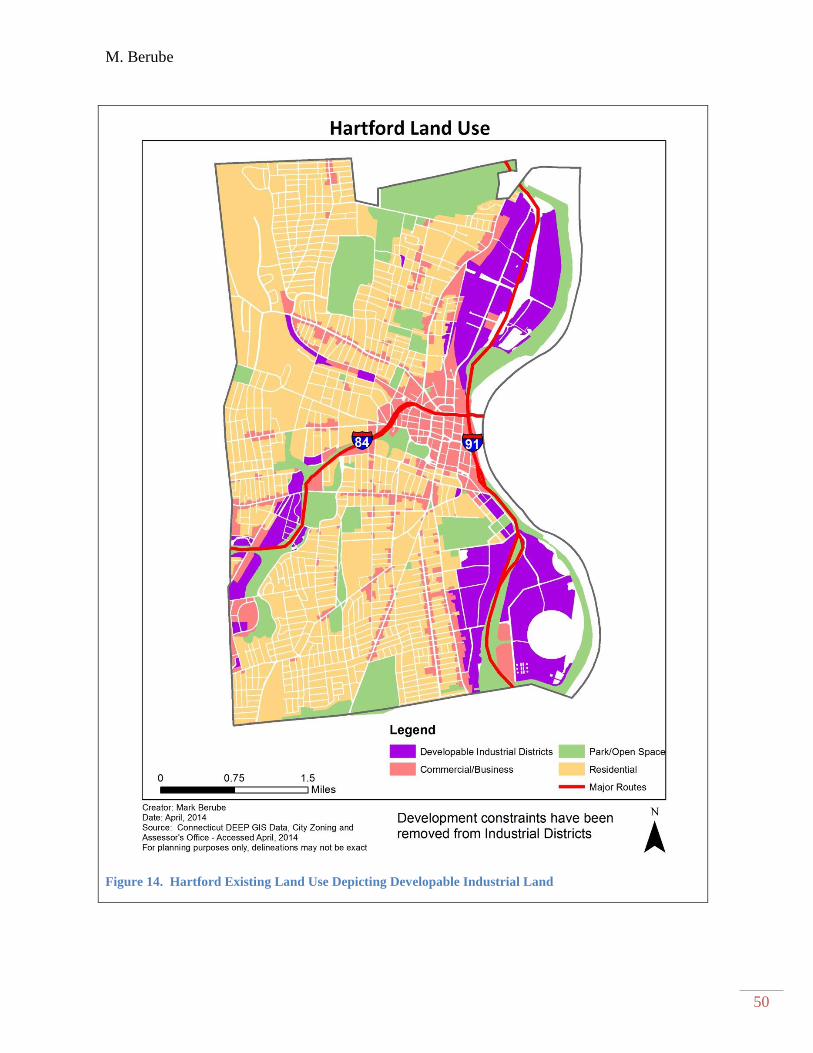
M. Berube
50
Figure 14. Hartford Existing Land Use Depicting Developable Industrial Land
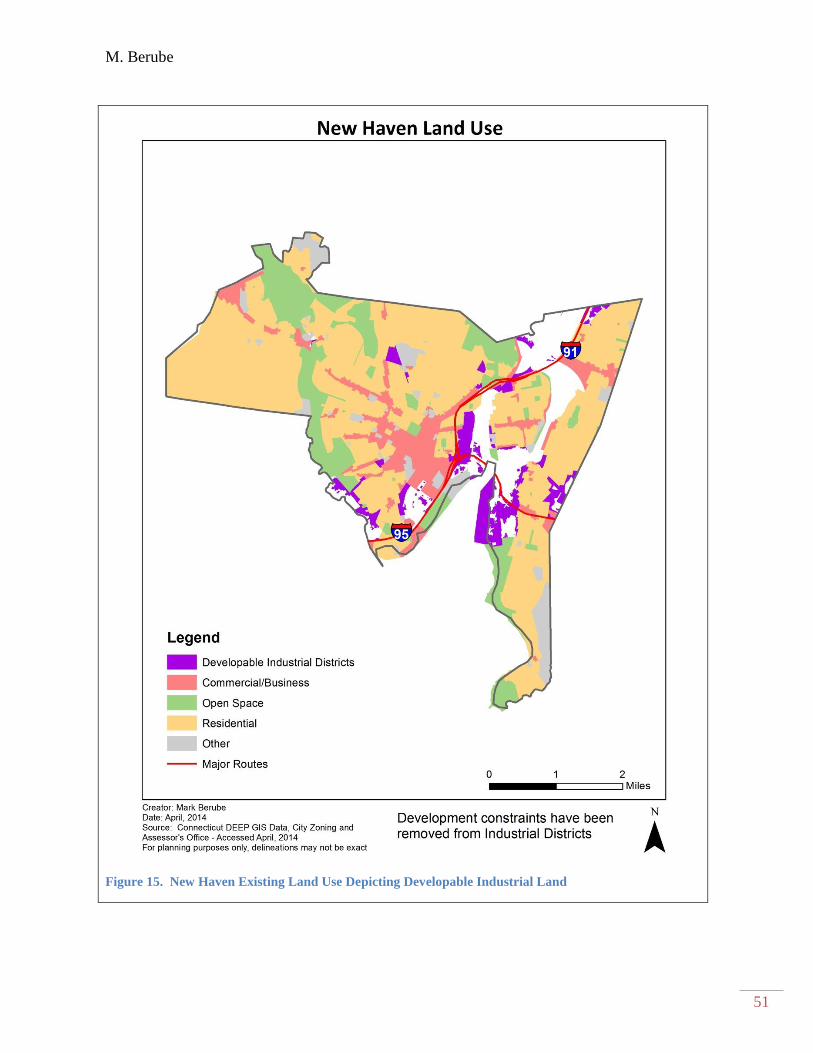
M. Berube
51
Figure 15. New Haven Existing Land Use Depicting Developable Industrial Land
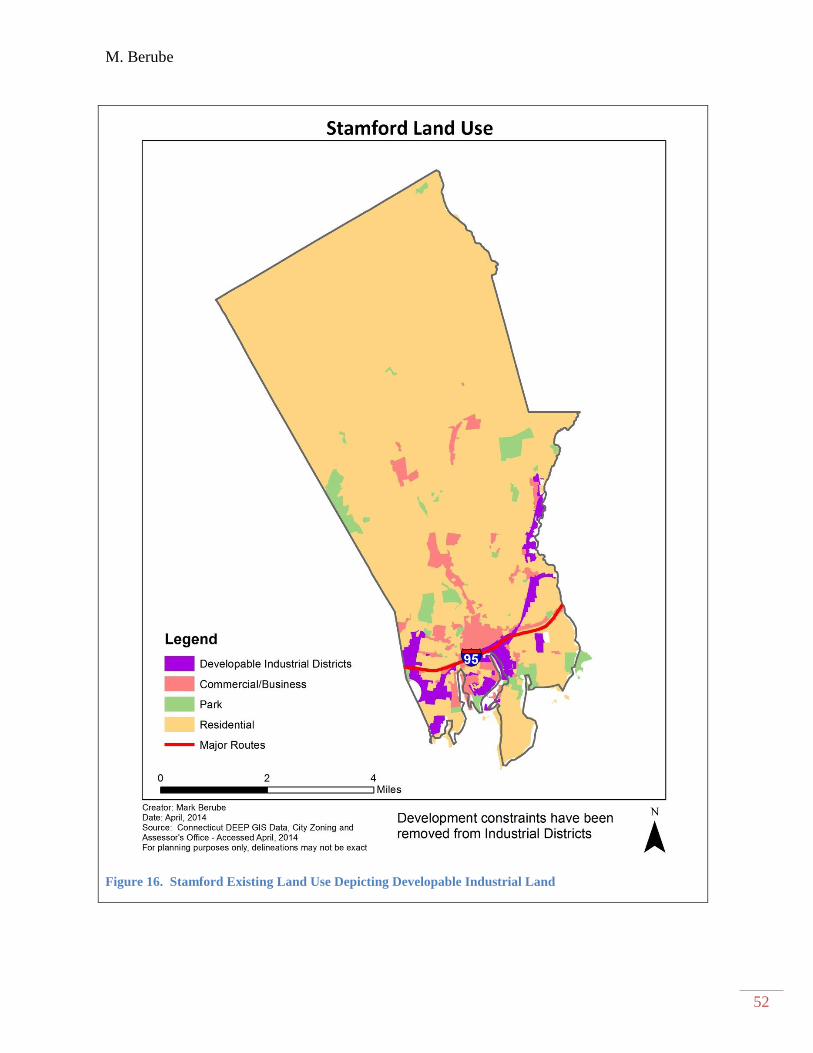
M. Berube
52
Figure 16. Stamford Existing Land Use Depicting Developable Industrial Land
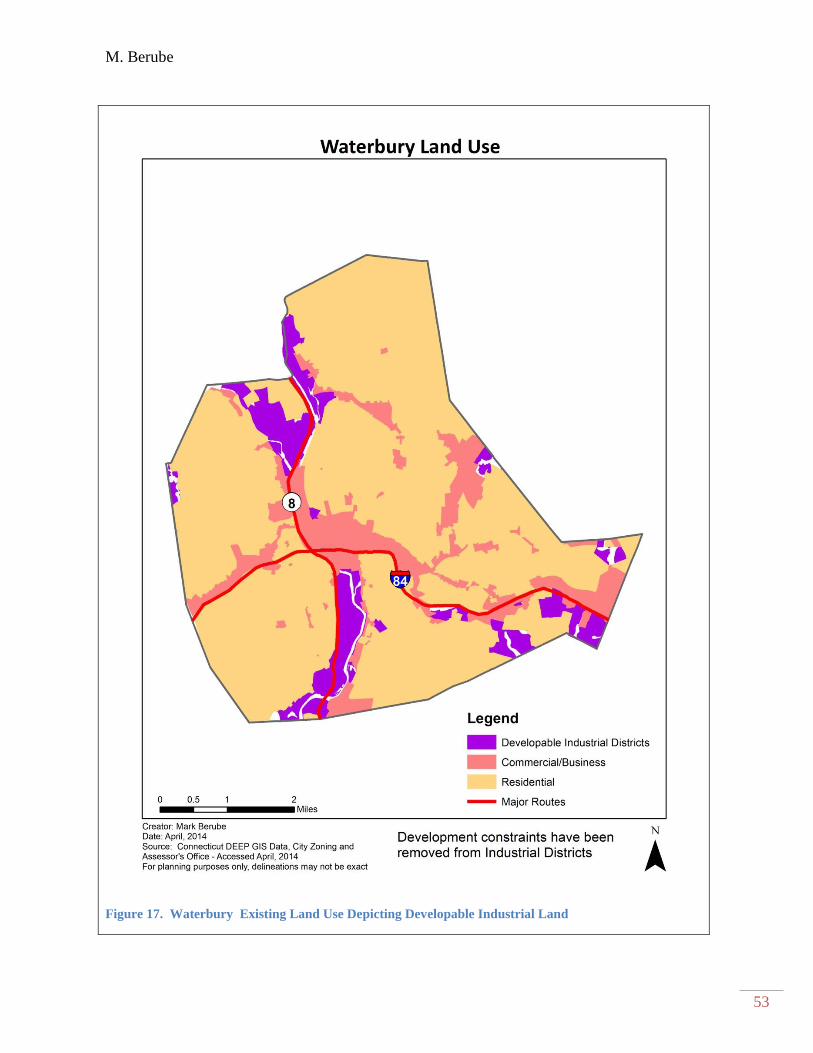
M. Berube
53
Figure 17. Waterbury Existing Land Use Depicting Developable Industrial Land
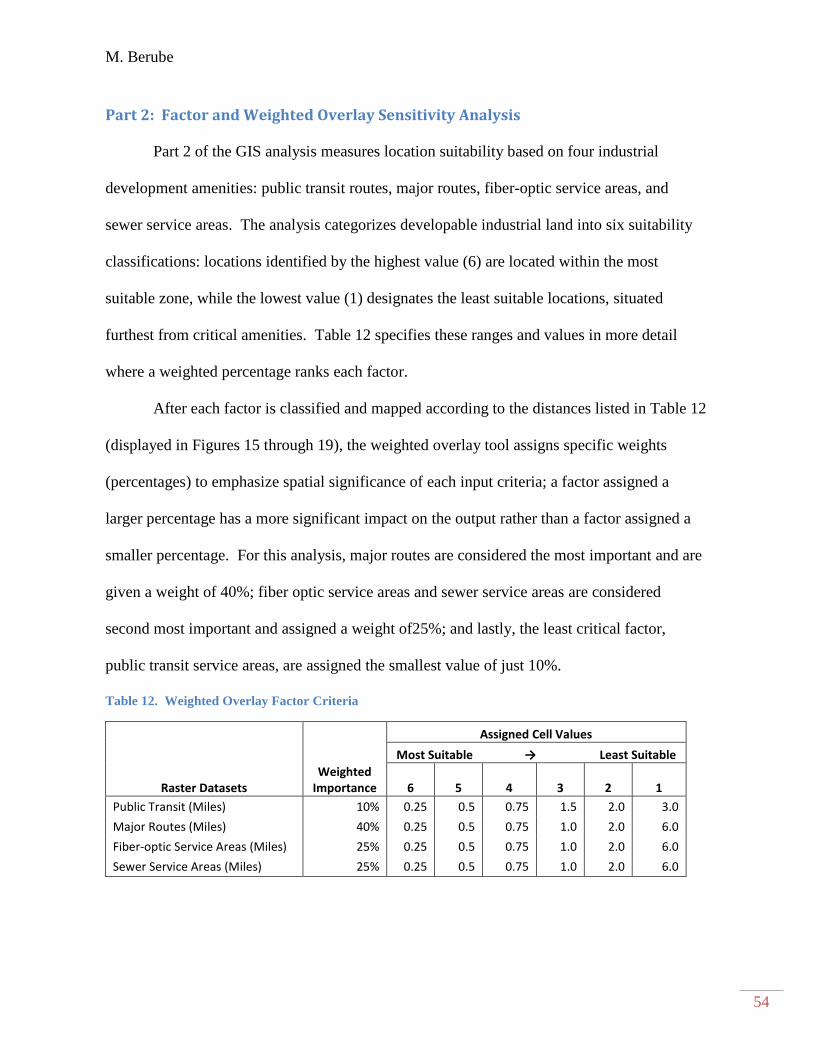
M. Berube
54
Part 2: Factor and Weighted Overlay Sensitivity Analysis
Part 2 of the GIS analysis measures location suitability based on four industrial
development amenities: public transit routes, major routes, fiber-optic service areas, and
sewer service areas. The analysis categorizes developable industrial land into six suitability
classifications: locations identified by the highest value (6) are located within the most
suitable zone, while the lowest value (1) designates the least suitable locations, situated
furthest from critical amenities. Table 12 specifies these ranges and values in more detail
where a weighted percentage ranks each factor.
After each factor is classified and mapped according to the distances listed in Table 12
(displayed in Figures 15 through 19), the weighted overlay tool assigns specific weights
(percentages) to emphasize spatial significance of each input criteria; a factor assigned a
larger percentage has a more significant impact on the output rather than a factor assigned a
smaller percentage. For this analysis, major routes are considered the most important and are
given a weight of 40%; fiber optic service areas and sewer service areas are considered
second most important and assigned a weight of25%; and lastly, the least critical factor,
public transit service areas, are assigned the smallest value of just 10%.
Table 12. Weighted Overlay Factor Criteria
Assigned Cell Values
Most Suitable → Least Suitable
Raster Datasets Weighted
Importance 6 5 4 3 2 1
Public Transit (Miles) 10% 0.25 0.5 0.75 1.5 2.0 3.0
Major Routes (Miles) 40% 0.25 0.5 0.75 1.0 2.0 6.0
Fiber-optic Service Areas (Miles) 25% 0.25 0.5 0.75 1.0 2.0 6.0
Sewer Service Areas (Miles) 25% 0.25 0.5 0.75 1.0 2.0 6.0
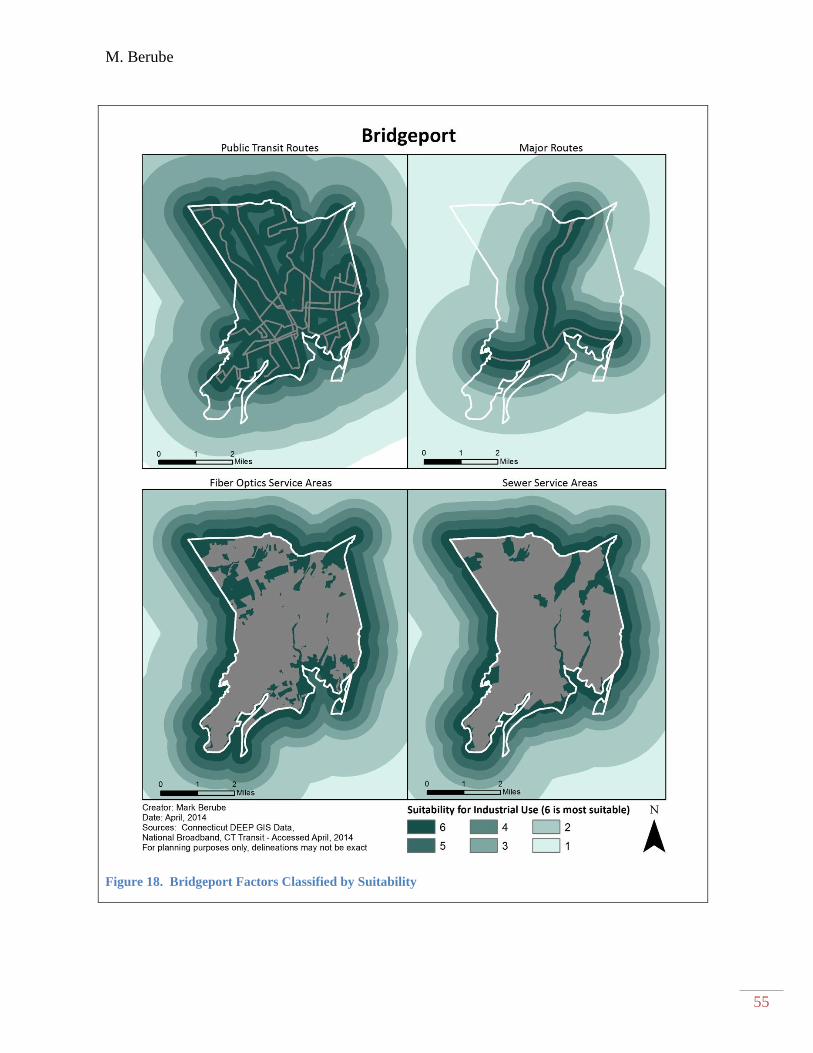
M. Berube
55
Figure 18. Bridgeport Factors Classified by Suitability

M. Berube
56
Figure 19. Hartford Factors Classified by Suitability
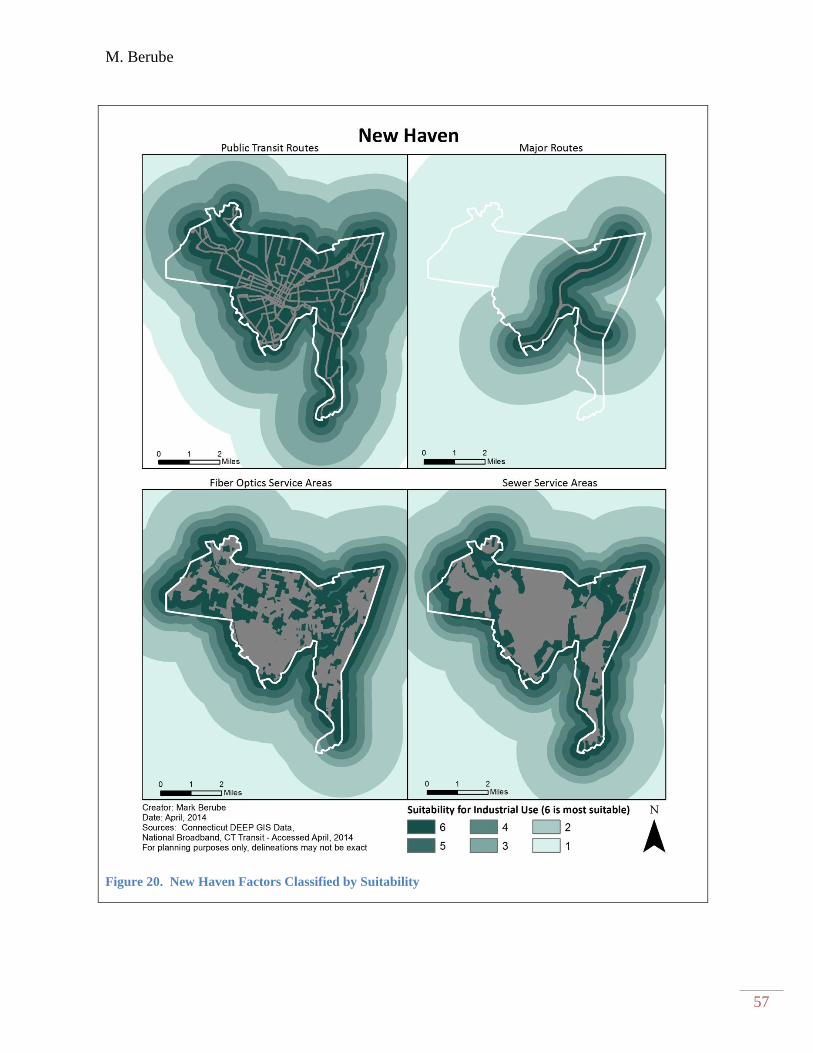
M. Berube
57
Figure 20. New Haven Factors Classified by Suitability

M. Berube
58
Figure 21. Stamford Factors Classified by Suitability
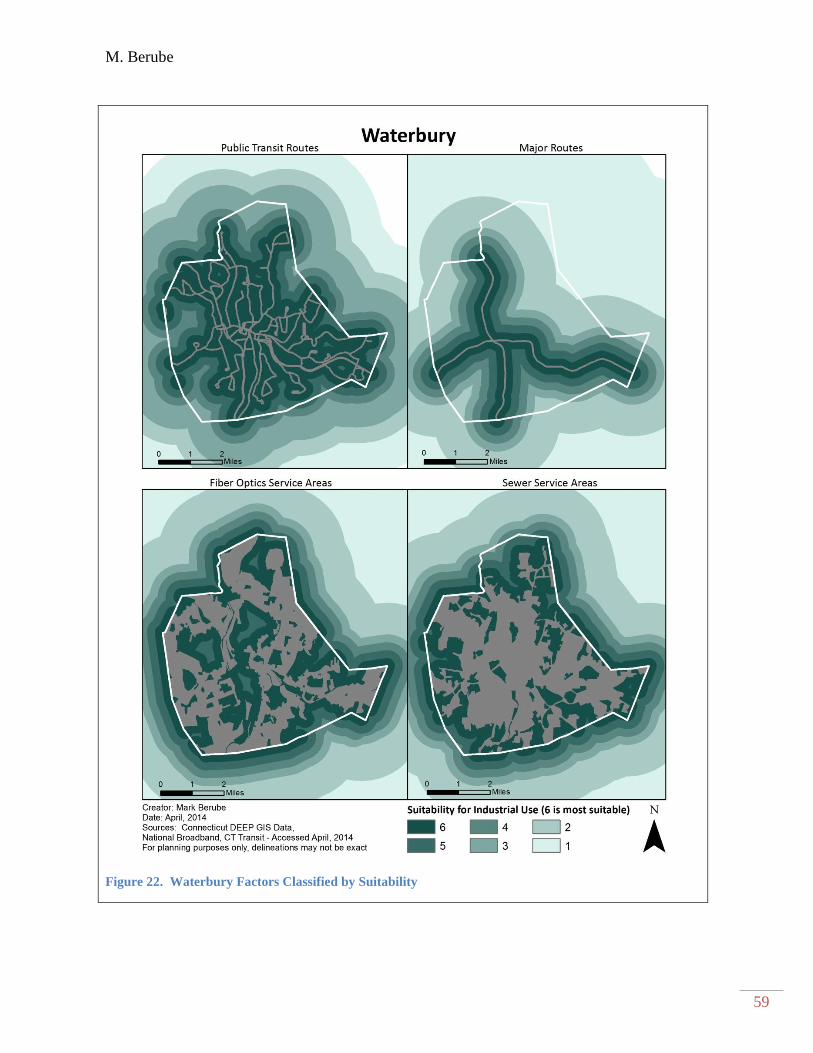
M. Berube
59
Figure 22. Waterbury Factors Classified by Suitability
M. Berube
60
Part 3: Final Suitability Analysis
The final suitability analysis applies the raster calculator tool to identify priority
industrial locations in each city. Developable industrial land produced in Part 1 is multiplied
by the weighted overlay analysis produced in Part 2, and illustrates developable industrial
districts by suitability ranking in varying shades of orange, mapped in Figures 20 through 24.
Depicted industrial districts vary in color grades of orange: the darker the shade, the
higher the priority for protection or investment. These areas overlap the factor analysis,
which also depict suitability, defined by different shades of green. In addition, a purple
diagonal pattern depicts industrial parcels not adjacent to residential areas within each city.

M. Berube
61
Figure 23. Bridgeport Final Results - Geographic Location of Priority Industrial Land
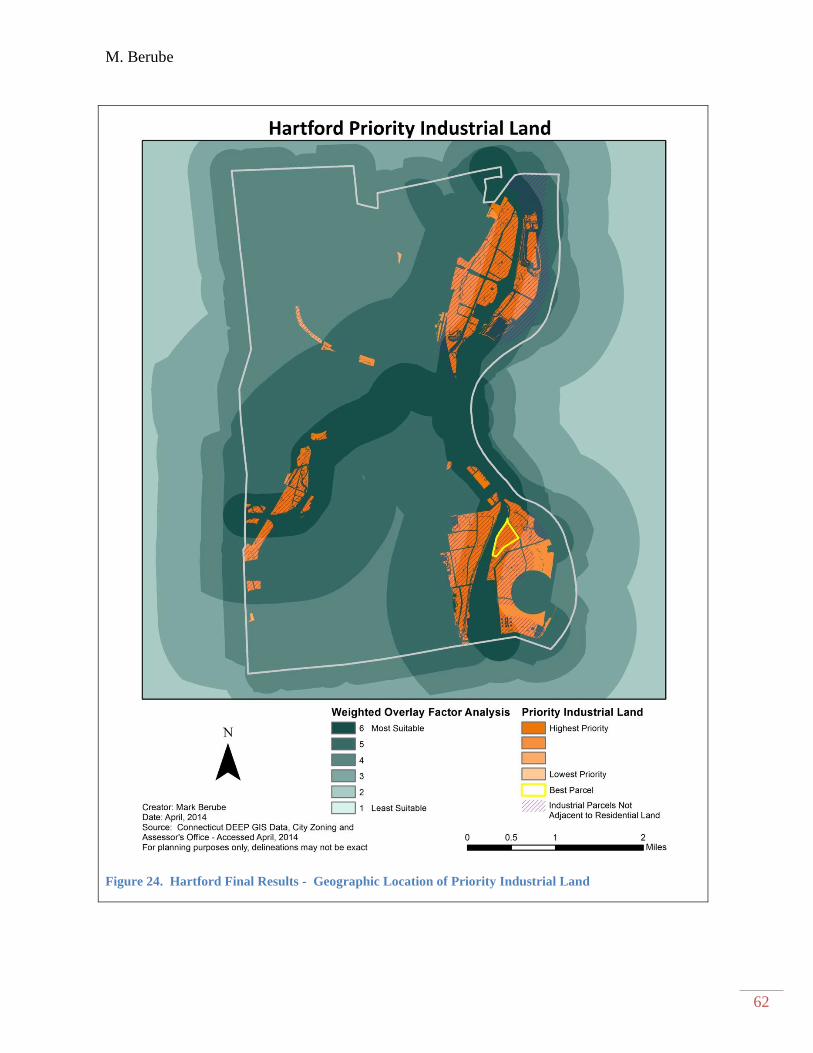
M. Berube
62
Figure 24. Hartford Final Results - Geographic Location of Priority Industrial Land
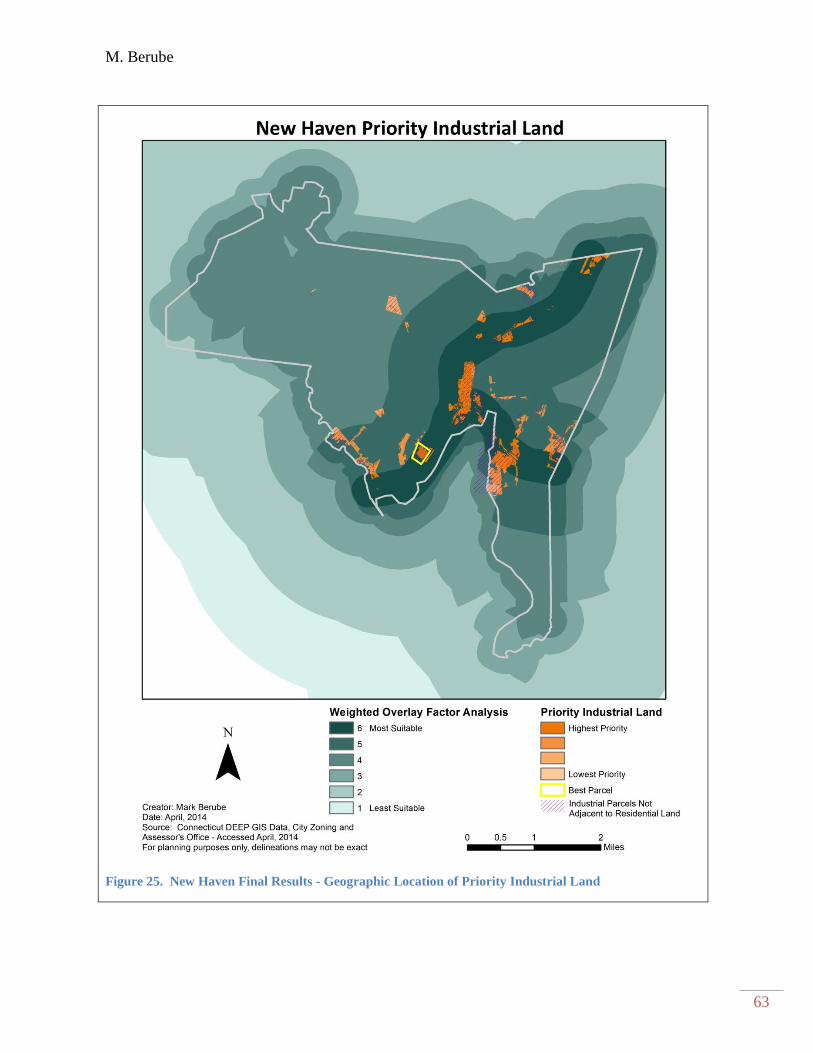
M. Berube
63
Figure 25. New Haven Final Results - Geographic Location of Priority Industrial Land
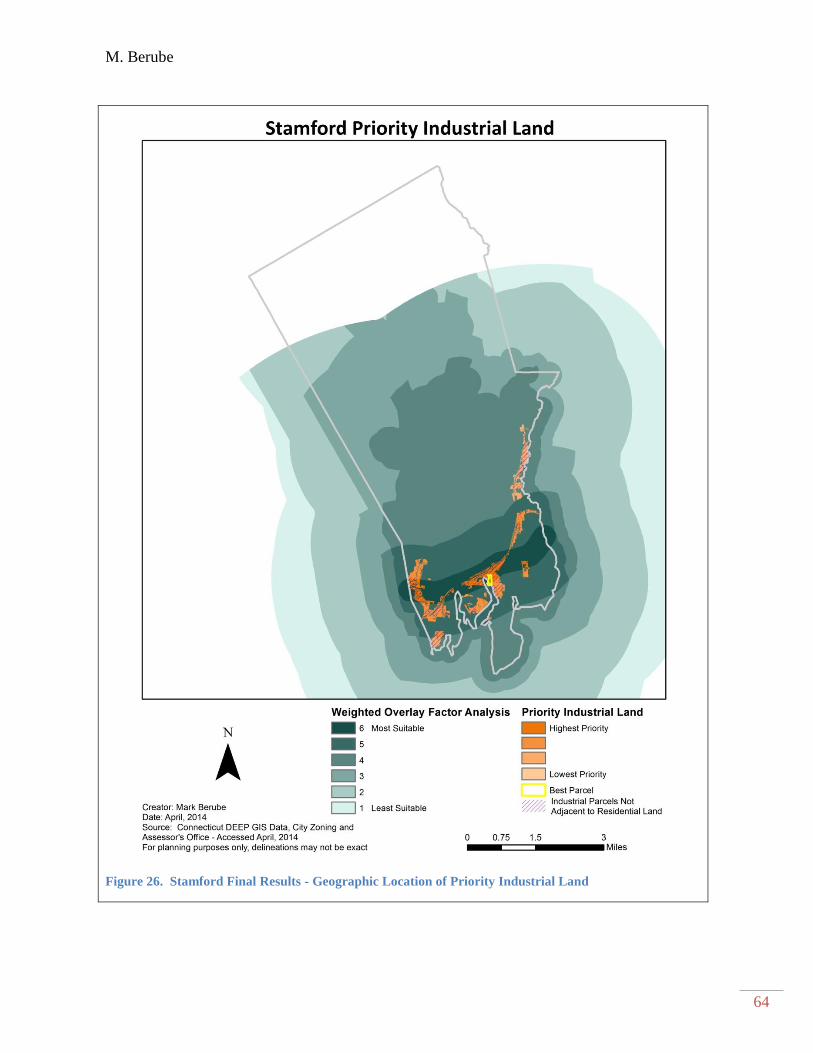
M. Berube
64
Figure 26. Stamford Final Results - Geographic Location of Priority Industrial Land
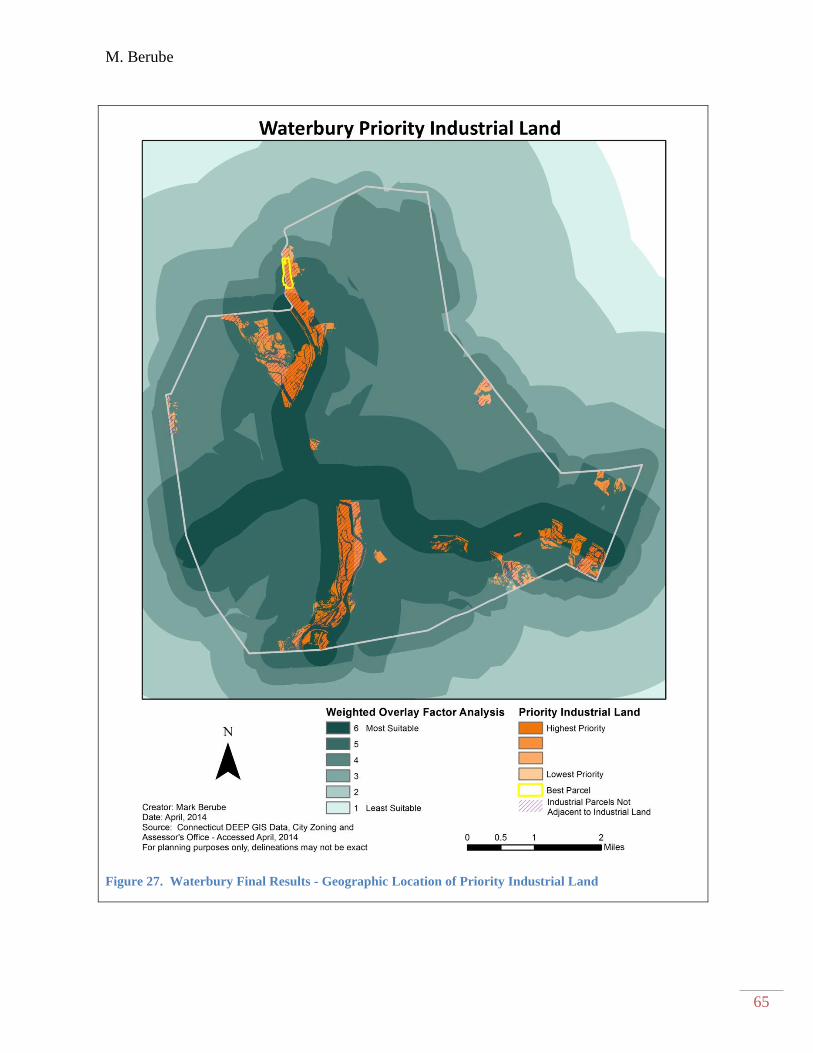
M. Berube
65
Figure 27. Waterbury Final Results - Geographic Location of Priority Industrial Land
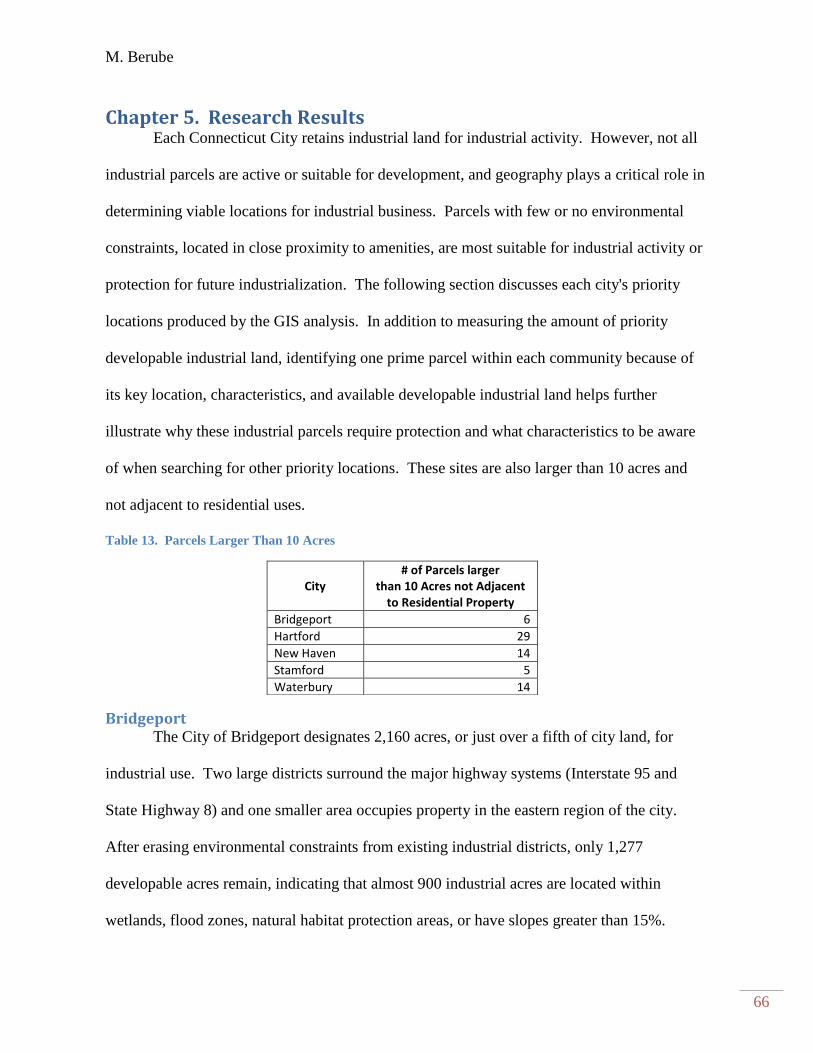
M. Berube
66
Chapter 5. Research Results Each Connecticut City retains industrial land for industrial activity. However, not all
industrial parcels are active or suitable for development, and geography plays a critical role in
determining viable locations for industrial business. Parcels with few or no environmental
constraints, located in close proximity to amenities, are most suitable for industrial activity or
protection for future industrialization. The following section discusses each city's priority
locations produced by the GIS analysis. In addition to measuring the amount of priority
developable industrial land, identifying one prime parcel within each community because of
its key location, characteristics, and available developable industrial land helps further
illustrate why these industrial parcels require protection and what characteristics to be aware
of when searching for other priority locations. These sites are also larger than 10 acres and
not adjacent to residential uses.
Table 13. Parcels Larger Than 10 Acres
City # of Parcels larger
than 10 Acres not Adjacent to Residential Property
Bridgeport 6
Hartford 29
New Haven 14
Stamford 5
Waterbury 14
Bridgeport The City of Bridgeport designates 2,160 acres, or just over a fifth of city land, for
industrial use. Two large districts surround the major highway systems (Interstate 95 and
State Highway 8) and one smaller area occupies property in the eastern region of the city.
After erasing environmental constraints from existing industrial districts, only 1,277
developable acres remain, indicating that almost 900 industrial acres are located within
wetlands, flood zones, natural habitat protection areas, or have slopes greater than 15%.
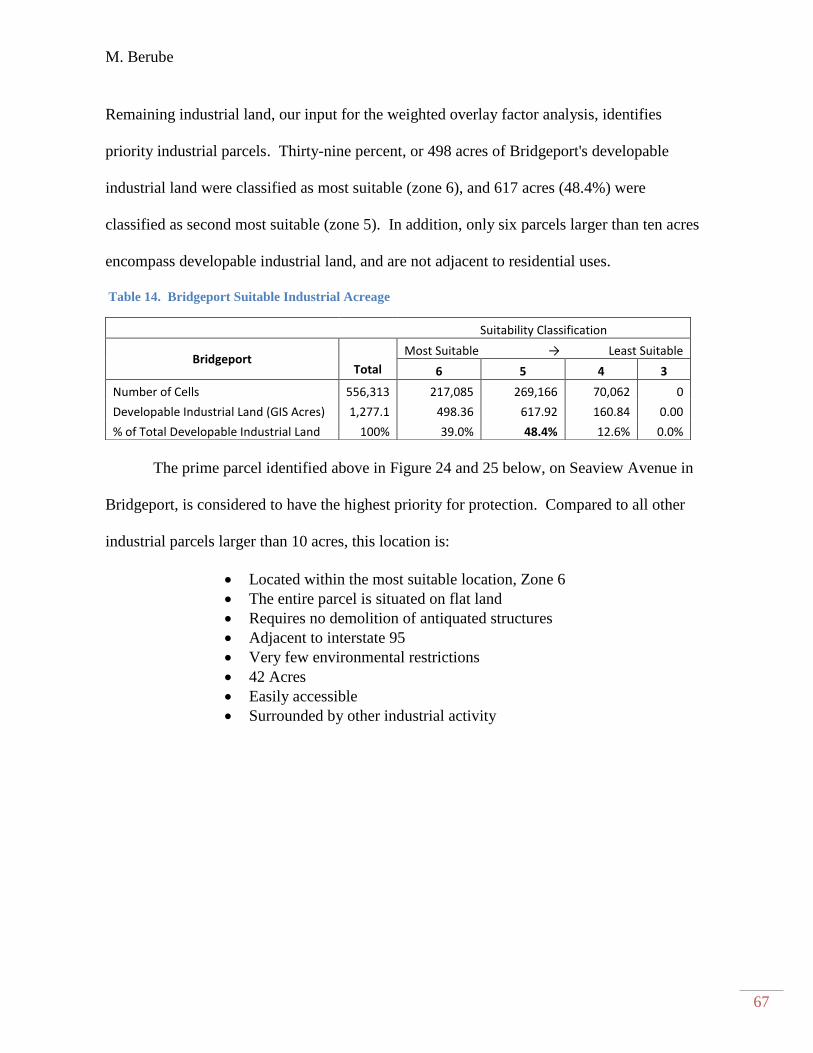
M. Berube
67
Remaining industrial land, our input for the weighted overlay factor analysis, identifies
priority industrial parcels. Thirty-nine percent, or 498 acres of Bridgeport's developable
industrial land were classified as most suitable (zone 6), and 617 acres (48.4%) were
classified as second most suitable (zone 5). In addition, only six parcels larger than ten acres
encompass developable industrial land, and are not adjacent to residential uses.
Table 14. Bridgeport Suitable Industrial Acreage
Suitability Classification
Bridgeport Most Suitable → Least Suitable
Total 6 5 4 3
Number of Cells 556,313 217,085 269,166 70,062 0
Developable Industrial Land (GIS Acres) 1,277.1 498.36 617.92 160.84 0.00
% of Total Developable Industrial Land 100% 39.0% 48.4% 12.6% 0.0%
The prime parcel identified above in Figure 24 and 25 below, on Seaview Avenue in
Bridgeport, is considered to have the highest priority for protection. Compared to all other
industrial parcels larger than 10 acres, this location is:
Located within the most suitable location, Zone 6
The entire parcel is situated on flat land
Requires no demolition of antiquated structures
Adjacent to interstate 95
Very few environmental restrictions
42 Acres
Easily accessible
Surrounded by other industrial activity
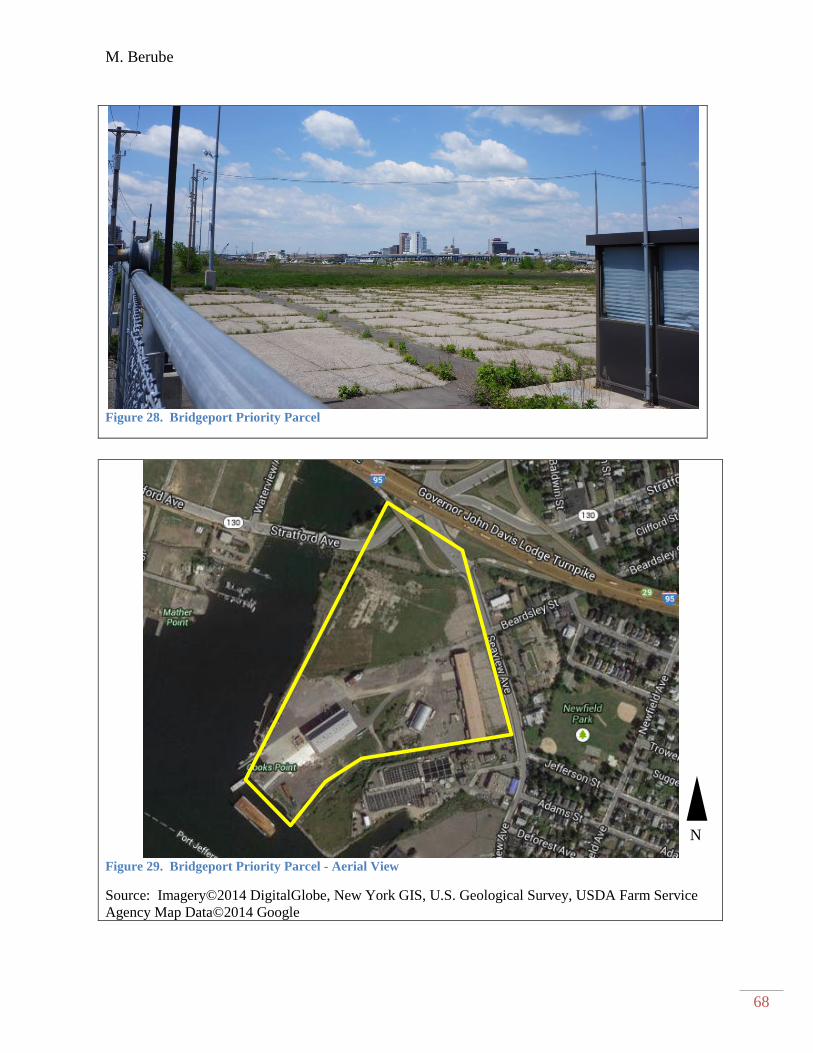
M. Berube
68
Figure 28. Bridgeport Priority Parcel
-
Figure 29. Bridgeport Priority Parcel - Aerial View
Source: Imagery©2014 DigitalGlobe, New York GIS, U.S. Geological Survey, USDA Farm Service
Agency Map Data©2014 Google
N
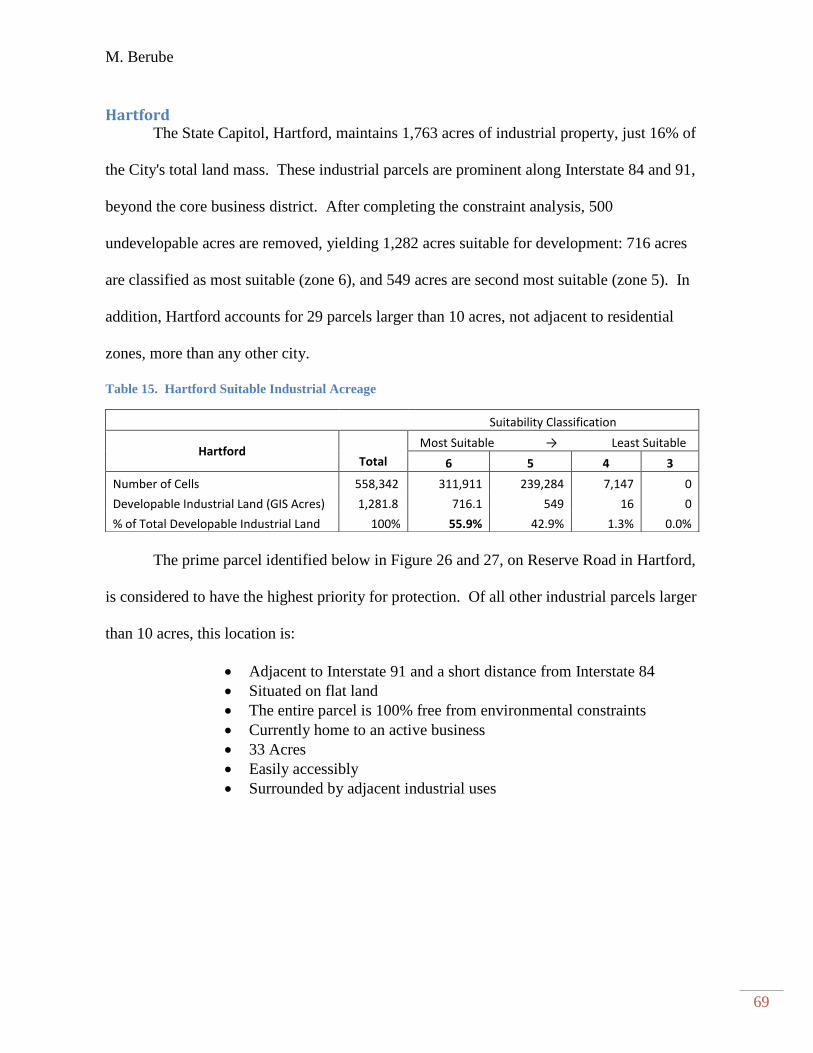
M. Berube
69
Hartford The State Capitol, Hartford, maintains 1,763 acres of industrial property, just 16% of
the City's total land mass. These industrial parcels are prominent along Interstate 84 and 91,
beyond the core business district. After completing the constraint analysis, 500
undevelopable acres are removed, yielding 1,282 acres suitable for development: 716 acres
are classified as most suitable (zone 6), and 549 acres are second most suitable (zone 5). In
addition, Hartford accounts for 29 parcels larger than 10 acres, not adjacent to residential
zones, more than any other city.
Table 15. Hartford Suitable Industrial Acreage
Suitability Classification
Hartford Most Suitable → Least Suitable
Total 6 5 4 3
Number of Cells 558,342 311,911 239,284 7,147 0
Developable Industrial Land (GIS Acres) 1,281.8 716.1 549 16 0
% of Total Developable Industrial Land 100% 55.9% 42.9% 1.3% 0.0%
The prime parcel identified below in Figure 26 and 27, on Reserve Road in Hartford,
is considered to have the highest priority for protection. Of all other industrial parcels larger
than 10 acres, this location is:
Adjacent to Interstate 91 and a short distance from Interstate 84
Situated on flat land
The entire parcel is 100% free from environmental constraints
Currently home to an active business
33 Acres
Easily accessibly
Surrounded by adjacent industrial uses
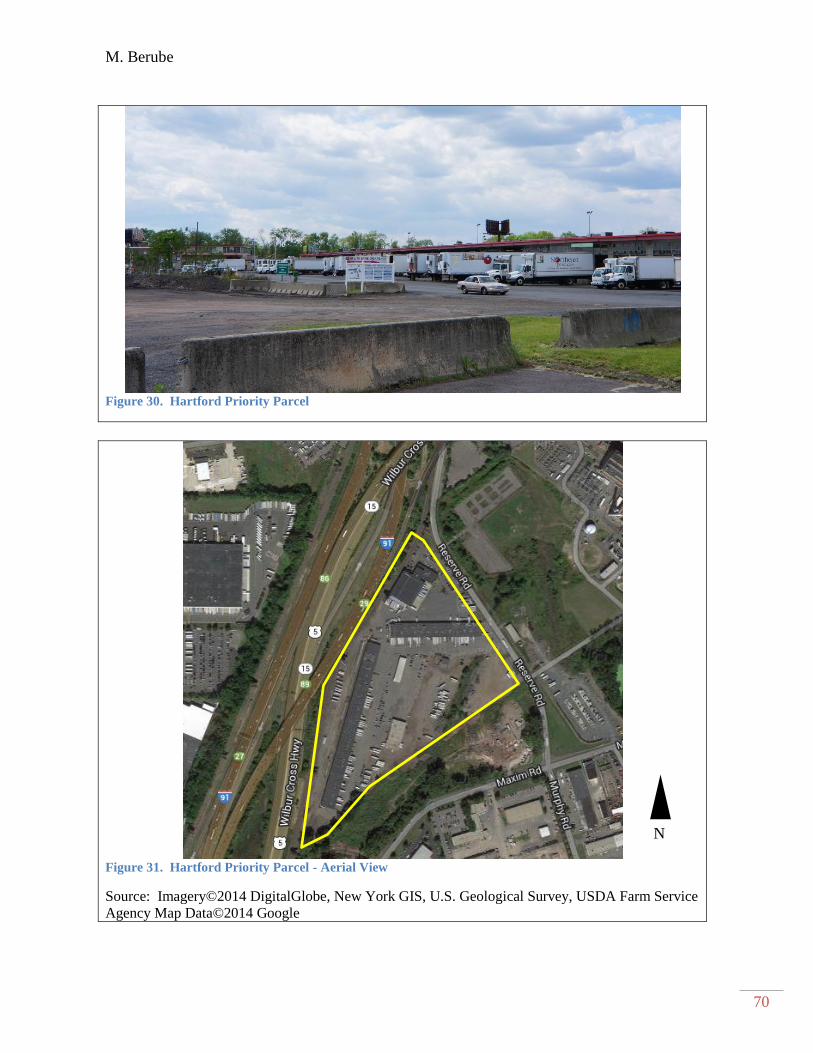
M. Berube
70
Figure 30. Hartford Priority Parcel
Figure 31. Hartford Priority Parcel - Aerial View
Source: Imagery©2014 DigitalGlobe, New York GIS, U.S. Geological Survey, USDA Farm Service
Agency Map Data©2014 Google
N
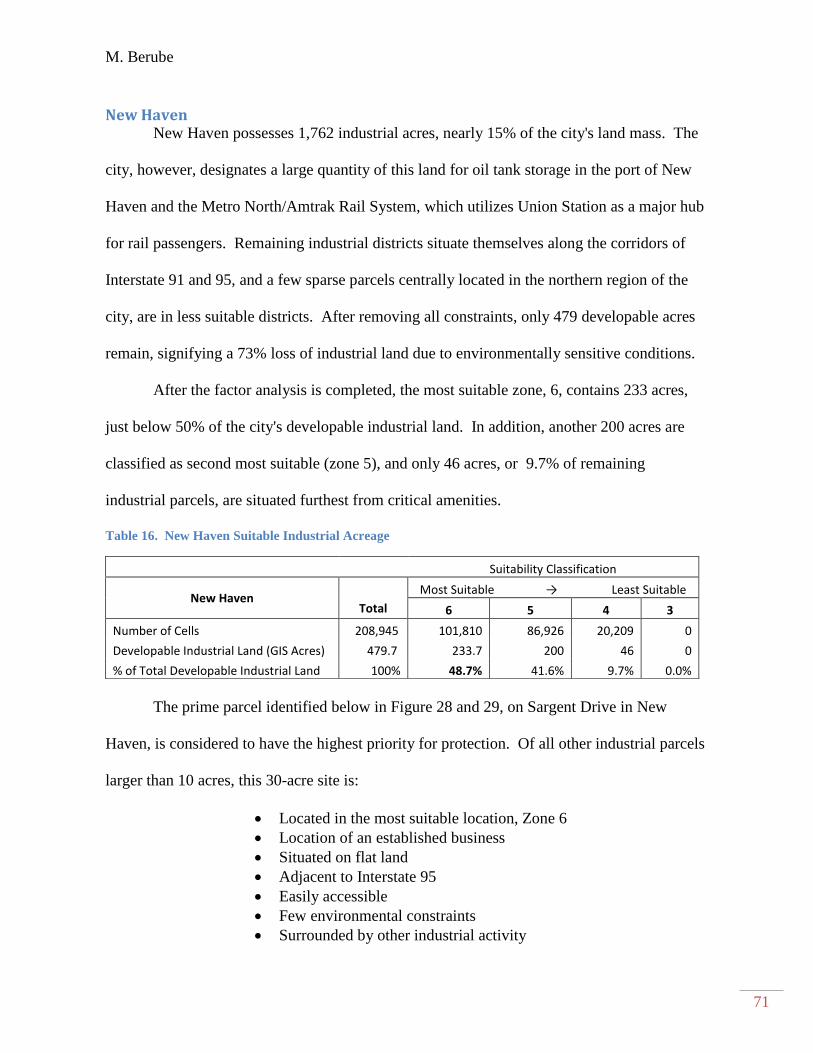
M. Berube
71
New Haven New Haven possesses 1,762 industrial acres, nearly 15% of the city's land mass. The
city, however, designates a large quantity of this land for oil tank storage in the port of New
Haven and the Metro North/Amtrak Rail System, which utilizes Union Station as a major hub
for rail passengers. Remaining industrial districts situate themselves along the corridors of
Interstate 91 and 95, and a few sparse parcels centrally located in the northern region of the
city, are in less suitable districts. After removing all constraints, only 479 developable acres
remain, signifying a 73% loss of industrial land due to environmentally sensitive conditions.
After the factor analysis is completed, the most suitable zone, 6, contains 233 acres,
just below 50% of the city's developable industrial land. In addition, another 200 acres are
classified as second most suitable (zone 5), and only 46 acres, or 9.7% of remaining
industrial parcels, are situated furthest from critical amenities.
Table 16. New Haven Suitable Industrial Acreage
Suitability Classification
New Haven Most Suitable → Least Suitable
Total 6 5 4 3
Number of Cells 208,945 101,810 86,926 20,209 0
Developable Industrial Land (GIS Acres) 479.7 233.7 200 46 0
% of Total Developable Industrial Land 100% 48.7% 41.6% 9.7% 0.0%
The prime parcel identified below in Figure 28 and 29, on Sargent Drive in New
Haven, is considered to have the highest priority for protection. Of all other industrial parcels
larger than 10 acres, this 30-acre site is:
Located in the most suitable location, Zone 6
Location of an established business
Situated on flat land
Adjacent to Interstate 95
Easily accessible
Few environmental constraints
Surrounded by other industrial activity
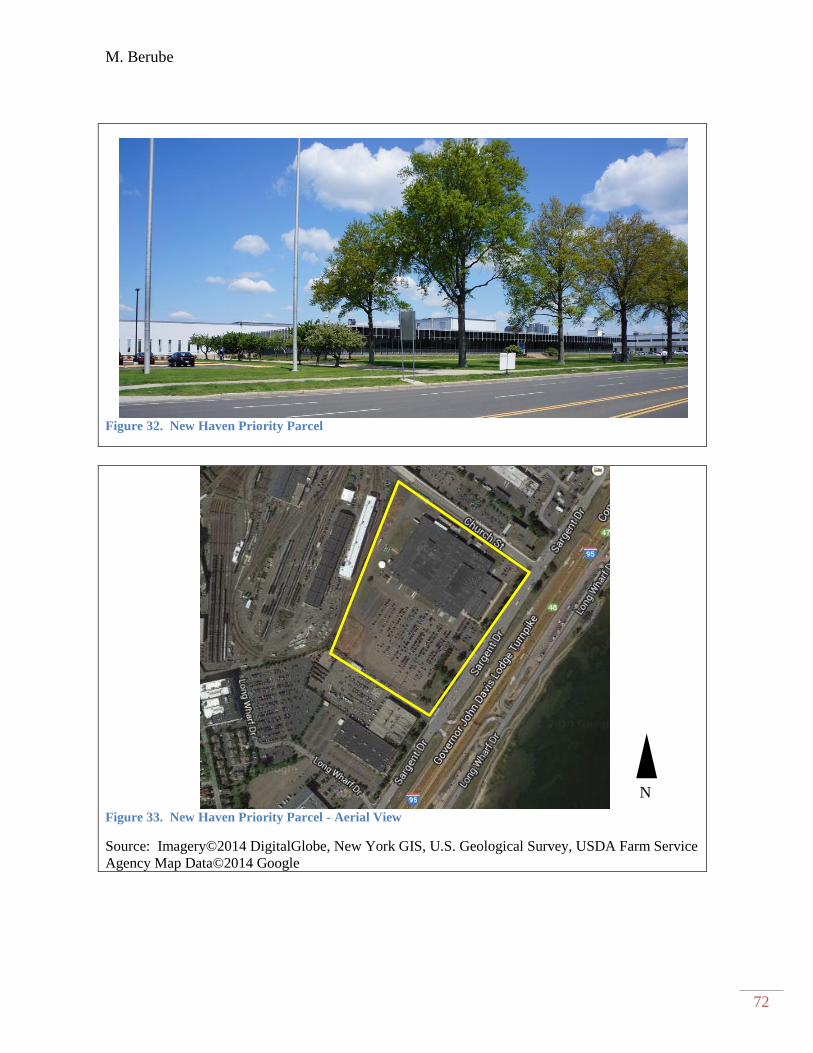
M. Berube
72
Figure 32. New Haven Priority Parcel
Figure 33. New Haven Priority Parcel - Aerial View
Source: Imagery©2014 DigitalGlobe, New York GIS, U.S. Geological Survey, USDA Farm Service
Agency Map Data©2014 Google
N
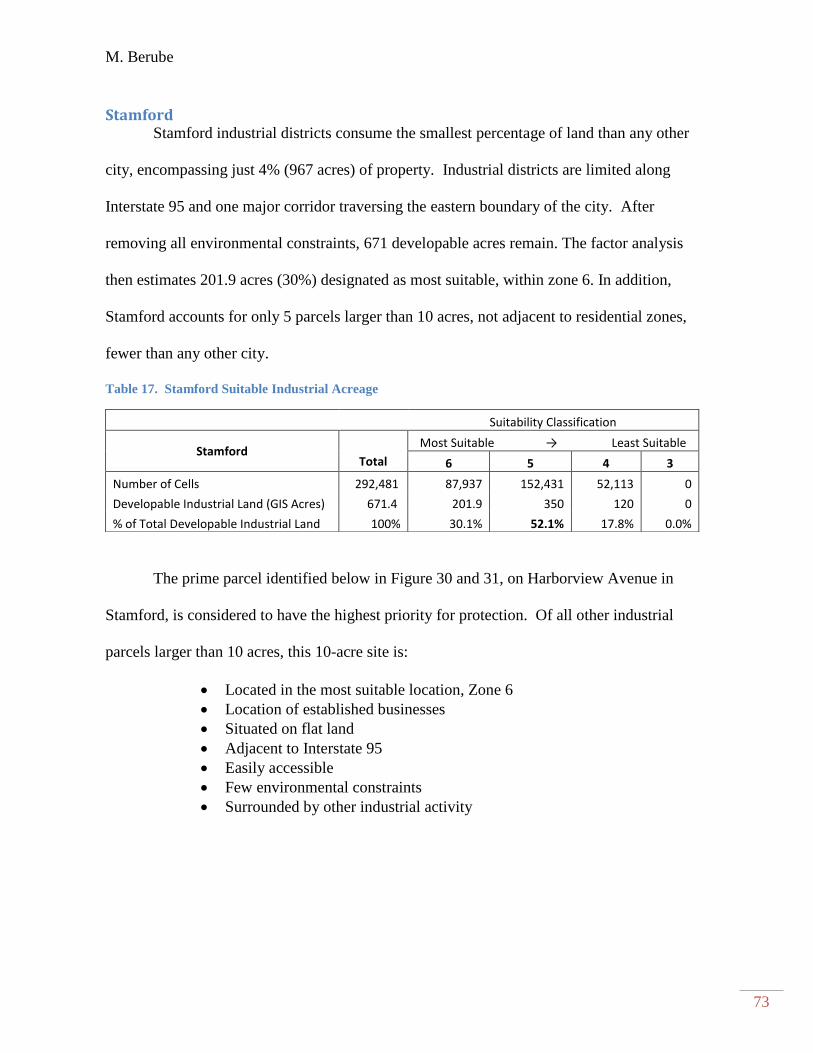
M. Berube
73
Stamford Stamford industrial districts consume the smallest percentage of land than any other
city, encompassing just 4% (967 acres) of property. Industrial districts are limited along
Interstate 95 and one major corridor traversing the eastern boundary of the city. After
removing all environmental constraints, 671 developable acres remain. The factor analysis
then estimates 201.9 acres (30%) designated as most suitable, within zone 6. In addition,
Stamford accounts for only 5 parcels larger than 10 acres, not adjacent to residential zones,
fewer than any other city.
Table 17. Stamford Suitable Industrial Acreage
Suitability Classification
Stamford Most Suitable → Least Suitable
Total 6 5 4 3
Number of Cells 292,481 87,937 152,431 52,113 0
Developable Industrial Land (GIS Acres) 671.4 201.9 350 120 0
% of Total Developable Industrial Land 100% 30.1% 52.1% 17.8% 0.0%
The prime parcel identified below in Figure 30 and 31, on Harborview Avenue in
Stamford, is considered to have the highest priority for protection. Of all other industrial
parcels larger than 10 acres, this 10-acre site is:
Located in the most suitable location, Zone 6
Location of established businesses
Situated on flat land
Adjacent to Interstate 95
Easily accessible
Few environmental constraints
Surrounded by other industrial activity

M. Berube
74
Figure 34. Stamford Priority Parcel
Figure 35. Stamford Priority Parcel - Aerial View
Source: Imagery©2014 DigitalGlobe, New York GIS, U.S. Geological Survey, USDA Farm Service
Agency Map Data©2014 Google
N

M. Berube
75
Waterbury Waterbury maintains 1,905 acres of industrial property, just 10% of the City's total
land mass. These industrial parcels are prominent along Interstate 84 and State Route 8/.
After the constraint analysis removes approximately 800 undevelopable acres, yielding 1,082
acres suitable for development, 577.5 acres are classified as most suitable (zone 6), and 396
acres are second most suitable (zone 5). In addition, Waterbury accounts for 14 parcels larger
than 10 acres, not adjacent to residential zones, more than any other city.
Table 18. Waterbury Suitable Industrial Acreage
Suitability Classification
Waterbury Most Suitable → Least Suitable
Total 6 5 4 3
Number of Cells 471,399 251,568 172,541 46,070 1,220
Developable Industrial Land (GIS Acres) 1,082.5 577.5 396 106 3
% of Total Developable Industrial Land 100% 53.4% 36.6% 8.6% 0.2%
The prime parcel identified below in Figure 30 and 31, on Thomaston Avenue in
Waterbury, is considered to have the highest priority for protection. Of all other industrial
parcels larger than 10 acres, this 16-acre site is:
Situated on flat land
Adjacent to Interstate State Highway 8
Easily accessible
Few environmental constraints
Surrounded by other industrial activity
Currently in the process of revitalization and new development
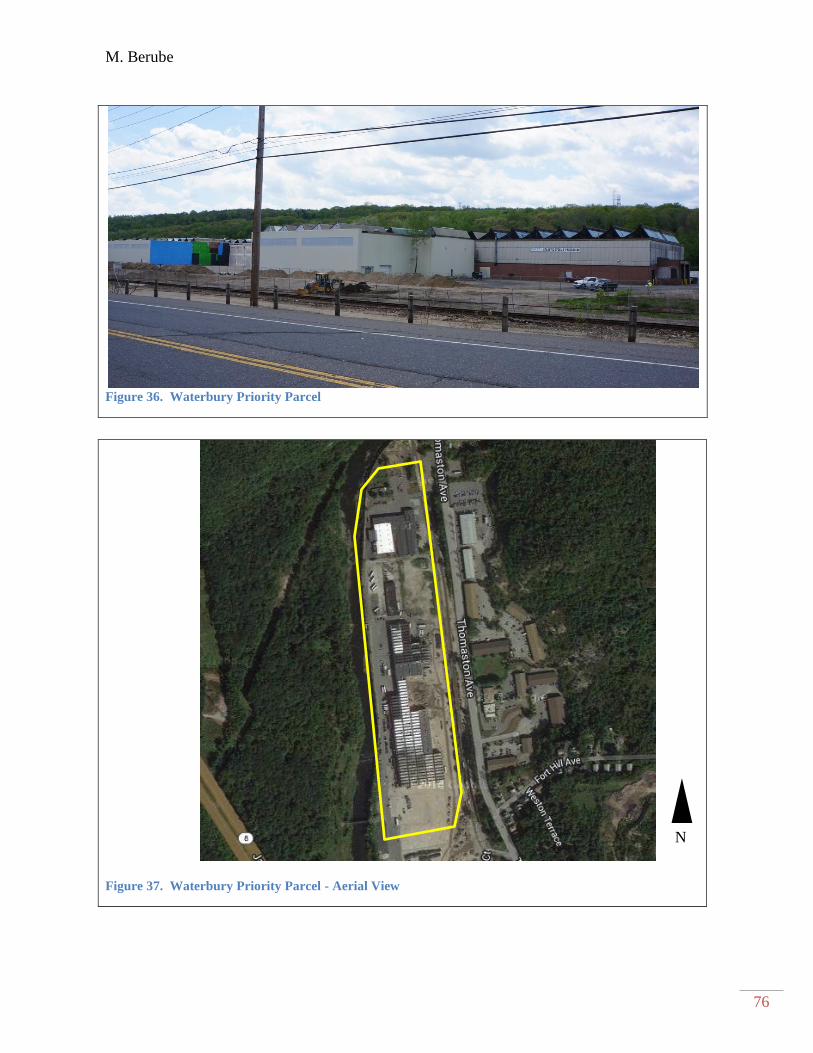
M. Berube
76
Figure 36. Waterbury Priority Parcel
-
Figure 37. Waterbury Priority Parcel - Aerial View
N

M. Berube
77
Chapter 6. Conclusion Cities can take advantage of future industrial activity, such as green technology, niche
manufacturing, transportation and warehousing, or food distribution centers by identifying
priority industrial property for future protection and investment. Redeveloping these vacant
and often blighted industrial properties, however, is a time-consuming procedure and costly
process. Therefore, developing an efficient strategy for inventorying and prioritizing existing
industrial properties, most feasible for investment, expedites the redevelopment process.
Summary of Findings A GIS Multi-criteria evaluation is a useful tool for inventorying industrial districts,
while also prioritizing parcels for strategic economic development. The analysis categorized
developable industrial land into six suitability classifications: locations identified by the
highest value (6) were located within the most suitable zone, while the lowest value (1)
designated the least suitable locations, situated furthest from critical amenities. In addition to
the GIS analysis, a tax base analysis measured the value of industrial land and fiscal revenue
generated from each city's land use categories. Finally, an employment forecast for the
Connecticut manufacturing sector assesses future industrial activity according to past business
and employment trends.
GIS ANALYSIS
This project identified priority industrial districts in each city with the intention of
protecting these areas for future industrialization. After removing environmental constraints,
each city lost a large percentage of their designated industrial zones due to the presence of
wetlands, floodplains, natural habitat protection areas, and steep slopes. Eliminating these
development restrictions allows a city to visualize where large contiguous and developable
M. Berube
78
industrial parcels are located. Maps displayed on previous pages depict the locations of these
suitable districts. Bridgeport, Hartford and Waterbury retain the most developable industrial
land, each covering over 1,000 acres: Hartford has 1,281 acres, Bridgeport has 1,277 acres,
and Waterbury has 1,082 acres. On the other hand, New Haven and Stamford preserve much
less, encompassing just 479 and 671 acres each, respectively. Although New Haven
possesses a large volume of designated industrial land (1,762 acres), only 27% is free from
environmental restrictions. Stamford, however, has the least amount of designated industrial
land, but maintains more than 70% as developable for future industrial uses. Nonetheless,
these small volumes of industrial land require city officials and planners to scrutinize the
future uses of these areas.
In order to determine which parcels are most important to protect and revitalize, the
weighted overlay factor analysis evaluated four different criteria: proximity to major
highways, sewer service areas, fiber-optic service areas, and public transportation. The
location of industrial land within proximity to each amenity determines suitability. Based on
the analysis, Hartford, New Haven, and Waterbury have approximately half or more of their
current developable industrial land located in the highest priority zone (6): Hartford has 716
priority acres (55.4%), New Haven has 233 acres (48.7%), and Waterbury has 577 acres
(53.4%) classified as most suitable for protection and investment. Bridgeport and Stamford
have slightly less than the other cities, yielding 498 acres (39%) and 201 acres (30.1%),
respectively. These locations are all within a quarter mile of each factor. Protecting these
areas of land for future industrial activity suggests that other, less suitable industrial parcels,
are insignificant due to their location to industrial amenities, and therefore, have potential as
M. Berube
79
alternative uses. Nonetheless, future industry should utilize these parcels if required in the
future.
TAX BASE ANALYSIS
The purpose of the tax base analysis was to measure the change in property values
between 1995 and 2010, in order to determine if industrial land revenue is declining while
residential and commercial values grow. Based on the data, two of the five cities, Bridgeport
and Stamford, experienced slight industrial growth over the past 15 years. However,
residential tax revenue continued to rise as well, and commercial was the only category to
experience an overall decline. On the contrary, Hartford, New Haven, and Waterbury
reported industrial revenue losses, while residential and commercial revenues increased
simultaneously. Nonetheless, each city increasingly depends on residential property to sustain
their fiscal budgets.
From a planning perspective, a tax base that benefits from thriving industrial property
effectively supports community services and public needs without increasing residential
density. A growing residential population, consequently, increases costs associated with
libraries, road maintenance, schools, or social services, etc. Planners must balance population
growth while protecting industrial land by identifying locations for housing and commercial
opportunities where such activities belong, without redeveloping priority industrial land.
A benefit of securing industrial land for industrial activity also prevents existing firms
from relocating to outside communities. The implementation of a land bank, in this matter,
maintains property values and mitigates residential and commercial real estate pressure. When
real estate values rise, it becomes difficult for industrial firms to thrive within a community,
displacing businesses to locations where land values or tax rates are less expensive.
M. Berube
80
ECONOMIC OUTLOOK
Between 2002 and 2012, Connecticut manufacturing experienced a large decline in
total employment and total number of firms within each city. During this ten-year period,
Connecticut manufacturers laid off nearly 46,000 employees, and each city lost anywhere
from 10.9% to 35.7% of their manufacturing firms. According to trends and future
employment projections (computed for the workforce investment areas home to each city),
calculations predict slight changes through the year 2020. Unfortunately, Connecticut will
continue to lose manufacturing jobs within each WIA; however, the decrease is marginal, as
the State on average will lose just 2.3% of their job base by the end of this decade. Despite
this outlook, by 2011, Connecticut manufacturing workforce trends illustrated surprising
vitality, in which 8,000 more jobs were available than originally projected (Lanza 2013).
Despite Connecticut's slow economy, the United States manufacturing industry is
improving. Manufacturing firms added 250,000 jobs since its low point in December 2009,
and the U.S. remains one of the largest manufacturing economies in the world; in 2010, 21%
of the world's goods manufactured in the States increased its GDP value from 11.7% to 21.3%
over the last decade, ranking 10th amongst all other states (Leigh and Hoelzel 2012, 88).
These recent data indicate potential industrial growth and motivation for protecting industrial
land.
Measuring future employment opportunities is critical for industrial land protection. If
economic activity within the industrial sector begins to grow, land is required for businesses
and industrialization in the future. Planners and developers utilizing industrial land for
something other than manufacturing, warehousing, or research and development greatly limits
the potential for a city to take advantage of new technologies and potential job creation and
M. Berube
81
economic wealth. As a result, a positive job outlook infers that residents will need
opportunities for employment, especially in cities where staggering unemployment and
poverty rates exist.
Limitations and Future Research The GIS model utilized for this project, although efficient for inventorying and
visualizing the location of priority industrial districts, has potential for improvement. During
the analysis, a consistent procedure and various data limitations prevented the tool from
enhancing the identification of priority industrial land. Added data inputs, including
constraints and factors, however, can refine the output, which ultimately improves the
decision making process for city officials and planners.
Selecting development constraints is a critical first step to identifying developable
land. In order to develop a consistent GIS methodology, the analysis evaluated each
community by a consistent statewide dataset acquired from the Connecticut DEEP. This data,
although relevant, did not take into account local regulations and specific site characteristics.
Therefore, refining the constraint analysis and creating a more detailed inventory of
developable industrial land requires the implementation of specific development constraints,
city zoning policies, and environmental regulations. For example, a supplemental analysis
should evaluate each city's industrial districts individually according to explicit zoning
policies that measure floor area ratio (FAR) for each parcel, building setbacks, and specific
industrial uses allowed within each zone. In addition, communities may implement stringent
environmental regulations that further prevent certain types of development and activity.
Identifying these development policies may refine the amount of available developable land,
altering the final output generated by the GIS.

M. Berube
82
Implementing new factors also improve the GIS analysis. Due to data limitations and
information sensitivity, the procedure was unable to account for all amenities critical for
industrial activity, specifically, clean water and natural gas location data. These utilities are
assets to firms because of their ability to augment the industrial process and decrease energy
usage, reducing the cost to do business. Specific location data, however, were unavailable
from their original sources. Nonetheless, we are able conclude that each city has available
natural gas service according to the Connecticut Natural Gas website and water utilities even
though the company itself does not furnish the specific location of infrastructure.
For future research, the GIS analysis can modify specific inputs for individual
business needs. Initially, the weighted overlay analysis utilized one set of weighted values to
measure the importance of each factor. The results produced one generalized output for all
industrial districts. However, some businesses may require different inputs for individual
factors, creating a more personalized analysis. For example, a firm requiring fiber-optic
service can modify the analysis to define specific locations most suitable according to the
proximity of that individual amenity. Therefore, this versatile model enhances location-based
decisions for future development and investment.
In addition to modifying the analysis for individual business needs, identifying
commercial and residential real estate pressure, and land use change depicting industrial
zoning conversions, helps planners determine which parcels require additional protection.
Surrounding land use change and rising values indicate a changing neighborhood and the
possibility of deindustrialization. Therefore, securing industrial land for future industrial
activity, based on this research method, prevents property values from rising and potentially
displacing industrial businesses. Implementing a land bank for protecting specific parcels
M. Berube
83
also establishes that these properties will not change for future uses, preventing planners and
developers from encouraging zoning changes, which encourage industrial disinvestment.
Recommendations for Industrial Land Protection Policy makers and local governments foster redevelopment of industrial districts by
establishing an industrial land bank for cities experiencing industrial blight. According to the
U.S. Department of Housing and Urban Development (HUD), "A land bank is a governmental
or nongovernmental nonprofit entity established, at least in part, to assemble, temporarily
manage, and dispose of vacant land for the purpose of stabilizing neighborhoods and
encouraging re-use or redevelopment of urban property." The city's goal is to identify vacant
or deteriorating properties unsuitable for development, due to zoning policies or lack of
amenities, and protect them for future redevelopment because of their ability to create jobs,
diversify the tax base, and revitalize neighborhoods. A land bank also maintains and
stabilizes the local real estate market; the strategy prevents property sharks from investing in
industrial land with the hope of city officials or planners rezoning it within the future.
Similar to the objective of this project, a land bank inventories and identifies priority
industrial property most suitable for redevelopment and capable of retaining and growing
manufacturing or industrial jobs. Specific attributes enhance a city's ability to prioritize
suitable industrial districts due to their feasibility for redevelopment and investment. A set of
characteristics can help determine which parcels best meet community's goals and objectives,
and forward revitalization in an efficient manner. Cities must take into account several
characteristics that highlight these critical industrial locations:
Properties are adjacent or contiguous with other existing industrial
and commercial land owners
Properties are within existing urban infrastructure

M. Berube
84
Properties are in proximity to highway access, water and sewer
service areas, fiber-optic service areas, and natural gas service areas
Parcels are suitable for development; few environmental constraints
exist
Lots are large in size; or contiguous parcels can be acquired and
assembled into larger districts
Parcels are identified in city master plans and economic development
strategies
Ease of access to the site
A land bank is capable of maintaining industrial land and protecting it for future
development with the intent to revitalize and enhance a community's vibrancy. A successful
land bank, however, first requires a city to prioritize and implement specific strategies suitable
for local stakeholders. Most importantly, a working private-public partnership is critical to
allocating necessary resources and capital, which contribute to the long-term success of a land
bank. In addition, a transparent process allows successful revitalization and coordination
throughout the development of a project, and reduces any complexity associated with
redevelopment, zoning policies, and site remediation. Lastly, inventorying each industrial
district is also vital, as it improves the decision-making process and streamlines investment.
Cities capable of researching and analyzing suitable properties for individual business needs
can increase project efficiency. Implementing a land bank and a GIS analysis to not only
map, but also identify priority locations, can help bring feasible projects into fruition.

M. Berube
85
Appendix A
Real Property Tax Revenue
State of Connecticut Office of Policy and Management
M. Berube
86
Bridgeport Real Property Tax Revenue, State of Connecticut OPM Grand Lists 1995-2010
A

M. Berube
87
Hartford Real Property Tax Revenue, State of Connecticut OPM Grand Lists 1995-2010
M. Berube
88
a
New Haven Real Property Tax Revenue, State of Connecticut OPM Grand Lists 1995-2010
A

M. Berube
89
Stamford Real Property Tax Revenue, State of Connecticut OPM Grand Lists 1995-2010
A
M. Berube
90
Waterbury Real Property Tax Revenue, State of Connecticut OPM Grand Lists 1995-2010
M. Berube
91
Bibliography
Alonso, William. 1964. "The Historic and the Structural Theories of Urban Form: Their Implications for Urban Renewal." Land Economics 40 (2): 227-231.
American Farmland Trust. August 2010. Costs of Community Services Studies. Northampton, Massachusetts: American Farmland Trust.
Bowen Jr, J. T. 2008. Moving places: the geography of warehousing in the US. Journal of Transport Geography, 16 (6), 379-387.
Bronstein, Zelda. 2009. "Industry and the Smart City." Dissent 56 (3): 27-34.
Byron, Joan and Nisha Mistry. April 2011. The Federal Role in Supporting Urban Manufacturing. Washington DC: Brookings Institute.
Connecticut Office of Policy and Management. 2013. Conservation and Development Policies: The Plan for Connecticut. Hartford, Connecticut: State of Connecticut.
Connecticut Regulatory Statutes. "Chapter 440 Wetlands and Watercourses Act Cited.211 C.
416; 227 C.71." Legislation, Regulation and Case Law. State of Connecticut, last
modified December 23 2013, accessed March 4, 2014, http://www.ct.gov/deep/cwp/view.asp?a=2720&q=419590&deepNav_GID=1907
Crosetto, Michele, Stefano Tarantola, and Andrea Saltelli. 2000. "Sensitivity and Uncertainty
Analysis in Spatial Modelling Based on GIS." Agriculture, Ecosystems & Environment 81 (1): 71-79.
Federal Emergency Management Agency. "Flood Zones." Federal Emergency Management
Agency, last modified September 4 2013, accessed March 8, 2014, http://www.fema.gov/floodplain-management/flood-zones.
Federal Highway Administration. 2014. "U.S. Department of Transportation." Planning
Glossary. accessed April 9, 2014, http://www.fhwa.dot.gov/
Fisher, Jeffrey, Dean Gatzlaff, David Geltner, and Donald Haurin. "Controlling for the impact
of variable liquidity in commercial real estate price indices." Real Estate Economics 31, no. 2 (2003): 269-303.
Giloth, Robert and John Betancur. 1988. "Where Downtown Meets Neighborhood: Industrial
Displacement in Chicago, 1978-1987." Journal of the American Planning Association 54 (3): 279-290.
Hoelzel, Nathanael Z. and Nancey Green Leigh. 2013. A New Normal After the Great Recession? Smart Growth Policies for Urban Industry: Smart Growth Online.
Istrate, Emillia and Nicholas Marchio. 2012. Export Nation 2012: How U.S. Metropolitan Areas
are Driving National Growth. Washington D.C.: Brookings Institute Metropolitan Policy
Program.
M. Berube
92
Jacoby, Henry D., Francis M. O'Sullivan, and Sergey Paltsev. 2011.The Influence of Shale Gas on US Energy and Environmental Policy.
Jaquet, D. B. 2013. A GIS Multicriteria Analysis for Siting a Sun/wind Powered Plastic
Reprocessing Facility in the Contra Costa County, California Recycling Market
Development Zone: a Thesis Presented to the Department of Humanities and Social
Sciences in Candidacy for the Degree of Master of Science (Doctoral dissertation, Northwest Missouri State University).
Jiang, Hong and J. Ronald Eastman. 2000. "Application of Fuzzy Measures in Multi-Criteria
Evaluation in GIS." International Journal of Geographical Information Science 14 (2): 173-184.
Jun, Chulmin. 2000. "Design of an Intelligent Geographic Information System for Multi-Criteria Site Analysis." Urisa-Washington Dc- 12 (3): 5-18.
Kotval, Zenia and John R. Mullin. 1994. "The Coming Crisis in Industrial Land: A Planning Perspective." Economic Development Quarterly 8 (3): 302-308.
Lachapelle, U., Frank, L., Saelens, B. E., Sallis, J. F., & Conway, T. L. 2011. Commuting by
public transit and physical activity: where you live, where you work, and how you get there. Journal of physical activity & health, 8.
Lanza, Steven P. Winter 2013. A Manufacturing Report Card: Does Connecticut make the Grade. Storrs, Connecticut: The Connecticut Economy.
Leigh, Nancey Green and Nathanael Z. Hoelzel. 2012. "Smart Growth's Blind Side:
Sustainable Cities Need Productive Urban Industrial Land." Journal of the American Planning Association 78 (1): 87-103.
Malczewski, Jacek. 1999. GIS and Multicriteria Decision Analysis. United States: John Wiley & Sons.
McCarthy, Linda. 2002. "The Brownfield Dual Land-use Policy Challenge: Reducing Barriers to
Private Redevelopment while Connecting Reuse to Broader Community Goals." Land use
Policy 19 (4): 287-296.
Morris, John. "U.S. Industrial Real Estate Outlook: Strong Performance Propels Industrial
Sector into 2014." Area Development Online. Area Development Online, last modified
2014, accessed February, 19,
2014,http://www.areadevelopment.com/EconomicsGovernmentPolicy/Q1-2014/US-industrial-real-estate-outlook-Cushman-Wakefield-23828267.shtml.
Moskowitz, Harvey S. and Carl G. Lindbloom. 1993. The New Illustrated Book of Development Definitions. New Brunswick, New jersey: Center for Urban Policy Research.
Mullin, John R. and Zenia Kotval. 2000. "The Industrial Zoning Crisis." Zoning News: American Planning Association, 15.
———and Zenia Kotval. 2006. "The Office/Industrial Land Dilemma: A Study of the Blackstone River Corridor in Massachusetts." Economic Development Journal 5 (3): 16-22.

M. Berube
93
National Broadband Map. 2014. "National Broadband Map." accessed April 9, 2014, http://www.broadbandmap.gov/
National Wildlife Federation. "What is Biodiversity" Last modified 2014, accessed April 24, 2014, http://www.nwf.org/Wildlife/Wildlife-Conservation/Biodiversity.aspx
Ohri, Anurag, Prabhat Kumar Singh, and Priyanka Kumari Singh. "Spatial Multi Criteria Analysis for Siting Industries." .
Quinn, C., 2005. Warehouses big growth trend in exurbs. Atlanta Journal –
Constitution (December 24), 3E.
Regional Plan Association. May 2013. Transit Oriented Development Toolkit for Connecticut.
Reisi, Marzieh, Lu Aye, and Alireza Soffianian. 2011. "Industrial Site Selection by GIS in Isfahan, Iran."IEEE, .
Randolph, J. 2004. Environmental land use planning and management. Island Press.
Russo, John and Sherry Lee Linkon “The Social Costs of Deindustrialization.” Manufacturing a
Better Future for America, ed. By Richard McCormack Youngstown State University 2008
Accessed, April 15, 2014, http://cwcs.ysu.edu/resources/CWCS-publications/social-costs-of-deindustrialization date accessed: 3/10/2012
Schueler, TR and HK Holland. 2000. "The Importance of Imperviousness in the Practice of Watershed Protection." Center for Watershed Protection. Elliot City, Maryland (1): 7.
Smith, David Marshall. 1981. Industrial Location: An Economic Geographical Analysis Wiley New York.
Squires, Gregory D. 2002. Urban Sprawl and the Uneven Development of Metropolitan America. Washington DC: Urban Institute Press.
State of Connecticut, Department of Labor. 2013 "Labor Market Information." Annual
Averages-Employment & Wages by Industry (QCEW) - State of Connecticut, Last
modified June 20, 2013, accessed April 5, 2014,
http://www1.ctdol.state.ct.us/lmi/202/202_annualaverage.asp
———. 2013 "Labor Market Information." Annual Averages-Employment & Wages by Industry
(QCEW) - State of Connecticut, Last modified March 26, 2013, accessed April 5, 2014, http://www1.ctdol.state.ct.us/lmi/projections.asp
Steiner, Frederick R and Kent Butler. 2007. Planning and Urban Design Standards. Hoboken, New Jersey: John Wiley and Sons.
Steiner, Frederick R., Kent Butler, and American Planning Association. 2012. Planning and Urban Design Standards John Wiley & Sons.
Strategic Economics. January 2012. South Fremont / Warm Springs Area Impact Analyses:
Fiscal and Economic Impacts of Proposed Land use Alternatives. Fremont California: City of Fremont.

M. Berube
94
Transportation Research Board. 2007. TCRP Report 95: Traveler Response to Transportation System Changes. Washington DC: Federal Transit Administration.
United States Census Bureau. "Annual Estimates of the Resident Population for Incorporated
Places Over 50,000, Ranked by July 1, 2012 Population: April 1, 2010 to July 1, 2012."
Population Estimates. United States Census Bureau, last modified March 27, 2014, accessed February 1, 2014, http://www.census.gov/popest/data/index.html.
———. 2012 "North American Industry Classification System." 2012 NAICS. United States
Census Bureau, accessed April 5, 2014, http://www.census.gov/cgi-bin/sssd/naics/naicsrch?chart=2012
United States Census Bureau, American Fact Finder. "American Community Survey."
American Fact Finder. United States Census, accessed February, 5, 2014,http://factfinder2.census.gov/faces/nav/jsf/pages/searchresults.xhtml?refresh=t.
United States Conference of Mayors. 2010. Recycling America's Land: A National Report on Brownfields Redevelopment. Washington DC: United States Conference of Mayors.
———. "Redeveloping Brownfields." United States Conference of
Mayors, http://www.usmayors.org/71stAnnualMeeting/brownfields_060903.asp.
United States Environmental Protection Agency. "Brownfields and Land Revitalization."
Environmental Protection Agency, last modified October 4, 2011, accessed March 2, 2014,http://www.epa.gov/brownfields/overview/glossary.htm.
Urban Land Institute. Industrial and Office Park Development Council. 1975. Business and Industrial Park Development Handbook. Washington DC: Urban Land Institute.
Weber, Alfred. 1929. Theory of the Location of Industries. Translated by Carl J. Freidrich. Toronto, Canada: The University of Chicago Press.
Weitz, Jerry and Tom Crawford. 2012. "Where the Jobs are Going: Job Sprawl in US
Metropolitan Regions, 2001–2006." Journal of the American Planning Association 78 (1): 53-69.