Embed Size (px)
Citation preview

Survey RespondentsThe survey targeted some 700 respondents in the senior management levels across the property industry. About half of the respondents (55%) were developers with the balance comprising a fair mix of commercial lenders (24%) and fund/REIT managers (21%), reflecting players in the commercial real estate market
DEVELOPERS
55%FUND/ REIT MANAGER
21%LENDER
24%
MALAYSIA COMMERCIAL REAL ESTATE INVESTMENT SENTIMENT SURVEY 2016
Some Words for the Fire Monkey.2015 has been a year of revelations! From generous contributions to the ringgit slide, cheap oil in barrels but not so cheap at stations and yellow shirts to red shirts, Malaysians went for a ride. All these issues have affected investor confidence. The Business Confidence Index in Malaysia declined to 86.40 in 3Q2015 from 95.40 in the preceding quarter. Yes, we were expecting a soft market, but these unexpected events made it worst.
The 2016 outlook for selected property sub-sectors, namely office and retail, is one of caution due to supply and demand mismatch. Meanwhile, the healthcare/ institutional, hotel/ leisure and logistics/ industrial sectors are expected to be more resilient due to sustained demand in the healthcare and education industries and tight supply in the logistics/ industrial segment. The e-commerce business trend has led to demand for logistics warehouses.
We note from our survey that despite the challenging environment, savvy investors such as developers, lenders and fund/ REIT managers see opportunities in the property market. The slew of high impact infrastructure and investment projects (on-going and proposed) is positive for medium term property growth.
As we welcome the Year of the Fire Monkey with its mischievous and crafty traits, and amid domestic and external headwinds, we should seize opportunities in a slowing market.
Thank you and happy reading.
Sarkunan Subramaniam, Managing Director, Knight Frank Malaysia

Favourable and Unfavourable Factors AffectingCommercial Real Estate Investment Sentiment in 2015Negative factors outweigh the positive in 2015.
There were only three favourable factors with the on-going MRT and infrastructure project ranked first, well ahead of the two others, namely availability of good stock/ investment opportunities and availability of equity capital/ fund.
In terms of negative factors, the country’s political scene was one of the great concern, followed by the unpopular GST, Malaysia’s slowing economy, cooling measures, KLSE performance, ringgit depreciation and others.
It is also noted that the negative global media coverage of the politics have impacted the commercial real estate sentiment, affecting foreign direct investment (FDI) flow.
Favourable
UnfavourableNote: Rankings calculated using the number of responses as scoring
RANKING OF FAVOURABLE AND UNFAVOURABLE FACTORSIN THE COMMERCIAL REAL ESTATE INVESTMENT SENTIMENT IN 2015
Ongoing MRT and infrastructure
Availability of good stock/ Investment opportunities
Availability of equity capital/ fund
Yield and return
Foreign direct investment in Malaysia
Corporate/ Public governance
Weakening of Malaysia Ringgit
Perfomance of KLSE
Goverment cooling measure
Malaysia economy
Implementation of GST
Malaysia political scenario
2015 –Past SnapshotFor the year 2015, more than halfof the respondents (54%) believedthat the commercial real estatemarket had performed as expected whilst 46% of them opined that the market performance was below expectation in terms of yield,return or margin. None felt thatmarket had out-performed.
The expectation early last year from most respondents was that 2015would be worse off than 2014 andthis sentiment fulfilled itself.
As Expected
54%
BelowExpectations
46%

Sub-sectors Invested/ Loaned/ DevelopedIn 2015Players were active with 86% of the respondents having invested, loaned or developed in the commercial real estate market in 2015; mainly in the retail andoffice sub-sectors with 65% each, followedby the hotel/ leisure and logistics/ industrial segments with 30% and 29% respectively. The healthcare/ institutional sub-sector garnered 22% of the respondents’ attention.
RETAIL
65%
HOTEL/LEISURE
30%
LOGISTICS/INDUSTRIAL
29%
HEALTHCARE/INSTITUTIONAL
22%
OFFICE
65%
2016 – The OutlookMore than half of the respondents (63%) are less optimistic on the overall economic scenario for 2016 compared to 2015 with only 19% of them being more optimistic.
In terms of investment outlook, 57% of the respondents are less optimistic, followed by 30% who remained neutral, whilst the remaining 13% of the respondents are confident that the market will improve in 2016.
2016 OVERALL ASSESSMENT OFECONOMIC CONDITION
No Change
18%
More Optimisticthan 2015
19%
Less Optimisticthan 2015
63%
2016 INVESTMENT OUTLOOK FORCOMMERCIAL PROPERTY
No Change
13%
More Optimisticthan 2015
30%
Less Optimisticthan 2015
57%
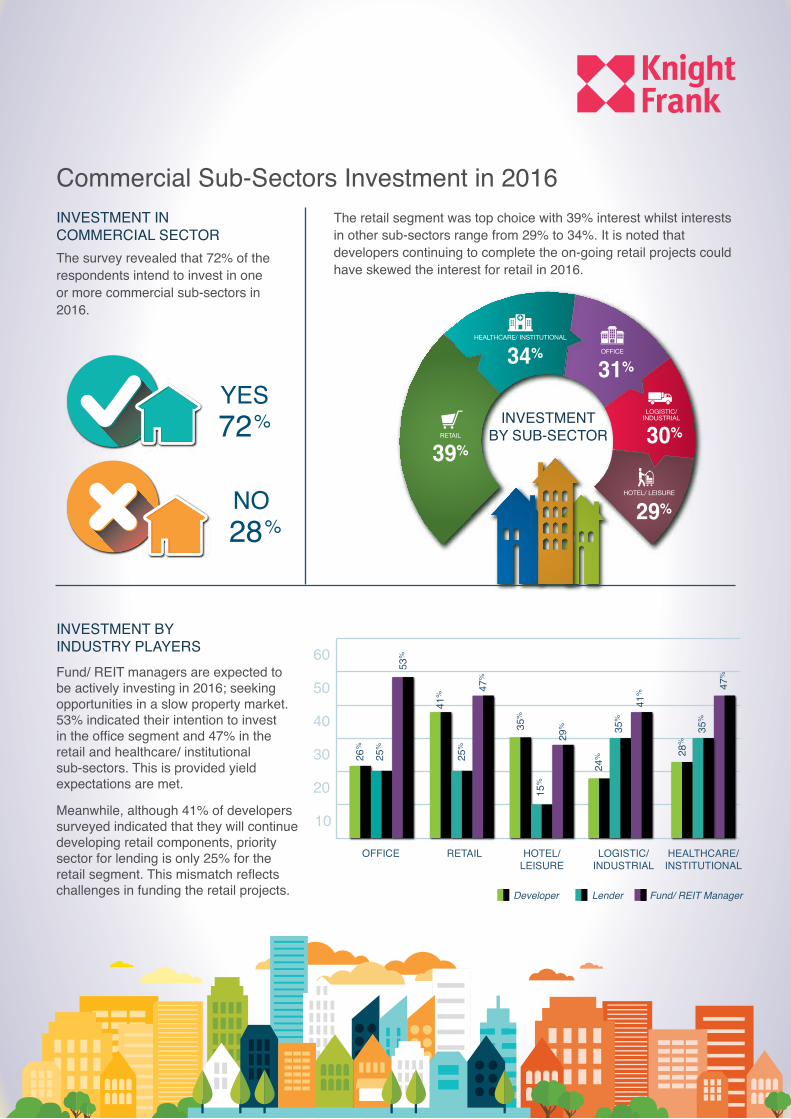
Commercial Sub-Sectors Investment in 2016INVESTMENT INCOMMERCIAL SECTOR
YES72%
NO28%
INVESTMENTBY SUB-SECTOR
LOGISTICS/INDUSTRIAL
The retail segment was top choice with 39% interest whilst interests in other sub-sectors range from 29% to 34%. It is noted that developers continuing to complete the on-going retail projects could have skewed the interest for retail in 2016.
The survey revealed that 72% of the respondents intend to invest in one or more commercial sub-sectors in 2016.
Fund/ REIT managers are expected to be actively investing in 2016; seeking opportunities in a slow property market. 53% indicated their intention to investin the office segment and 47% in the retail and healthcare/ institutional sub-sectors. This is provided yield expectations are met.
Meanwhile, although 41% of developers surveyed indicated that they will continue developing retail components, priority sector for lending is only 25% for the retail segment. This mismatch reflects challenges in funding the retail projects.
INVESTMENT BYINDUSTRY PLAYERS
10
20
30
40
50
60
OFFICE
26%
25%
53%
41%
25%
RETAIL
47%
35%
15%
HOTEL/LEISURE
29%
41%
35%
24%
LOGISTIC/INDUSTRIAL
35%
28%
HEALTHCARE/INSTITUTIONAL
47%
Developer Lender Fund/ REIT Manager
30%
29%HOTEL/ LEISURE
34%HEALTHCARE/ INSTITUTIONAL
31%OFFICE
39%RETAIL
LOGISTIC/INDUSTRIAL

Commercial Sub-SectorsExpected Performance in 2016 OVERALL PERFORMANCE BY SUB-SECTOR
PERFORMANCE OFCAPITAL VALUESBY SUB-SECTOR
36% of the respondents opined that the healthcare/ institutional segment will outperform the other sub-sectors whilst more than half of them remained neutral on the hotel/ leisure and logistics/ industrial sectors. Meanwhile, the outlook for the performances in the office and retail sub-sectors is less optimistic.
More than half of the respondents (51% to 63%) expect the capital valuesfor all sub-sectors to remain unchanged although 40% of them foresee an increase in the values of properties related to the healthcare/ institutional sector. 31% and 28% of the respondents expect the capital values to decline in the retail and office sub-sectors respectively.
The respondents were generally less optimistic towards the office sector with 52% of them expecting falling rental values. In the retail and logistics/ industrial sub-sectors, 46% and 60% of the respondents surveyed, expect the rental values to remain flat.
PERFORMANCE OF RENTAL VALUES FOR OFFICE, RETAIL ANDLOGISTICS/ INDUSTRIAL SUB-SECTORS
LOGISTICS/INDUSTRIAL
18%
64%
18%
HEALTHCARE/INSTITUTIONAL
10%
54%
36%
HOTEL/LEISURE
29%
52%
19%
OFFICE
47%
41%
12%
RETAIL
41%
47%
12%
More OptimisticNo ChangeLess Optimistic
11%
13%
16%
RETAIL
LOGISTICS/INDUSTRIAL
OFFICE
STAGNANT
INCREASE
DECREASE
52%
41%
24%
RETAIL
LOGISTICS/INDUSTRIAL
OFFICE
37%
46%
60%
RETAIL
LOGISTICS/INDUSTRIAL
OFFICE
RETAIL
HOTEL/LEISURE
LOGISTICS/INDUSTRIAL
HEALTHCARE/INSTITUTIONAL
OFFICE
31%
26%
13%
8%
28%RETAIL
HOTEL/LEISURE
LOGISTICS/INDUSTRIAL
HEALTHCARE/INSTITUTIONAL
OFFICE
51%
61%
63%
52%
62%RETAIL
HOTEL/LEISURE
LOGISTICS/INDUSTRIAL
HEALTHCARE/INSTITUTIONAL
OFFICE
18%
13%
24%
40%
10%
INCREASE STAGNANT DECREASE

PERFORMANCE OF AVERAGEROOM RATES (ARR) FOR HOTEL SECTORThe majority of the respondents (47%) expect flattish average room rates (ARR) for 2016. 22% of them are optimistic that the ARR will increase whilst the remaining 31% expect ARR to fall instead.
INCREASE
22%DECREASE
31%STAGNANT
47%HOTEL
HOTEL
PERFORMANCE OF OCCUPANCY RATESFOR OFFICE, RETAIL, HOTEL/ LEISURE
AND LOGISTICS/ INDUSTRIAL SECTORS
Most of the respondents surveyed (55% and 48%) expect a dip in occupancy levels for the
office and retail sub-sectors respectively.As for the hotel/ leisure and logistics/
industrial sub-sectors, 47% and 65% of therespondents expect 2016 occupancy
levels to remain stagnant.
RETAIL
OFFICE
LOGISTICS/INDUSTRIAL
HOTEL/LEISURE
INCREASE
11%
12%
23%
16%
DECREASE
55%
48%
30%
19%
STAGNANT
34%
40%
47%
65%
KEY CONTACTS:Sarkunan Subramaniam | Managing Director | +603 2289 9633 | [email protected]
Carrie Ling | Manager | +603 2289 9646 | [email protected] 10.01, Level 10 Centrepoint South, Mid Valley City, Lingkaran Syed Putra, 59200 Kuala Lumpur, Malaysia | KnightFrank.com.my
Yields for the various sub-sectors are expected to remain fairly stable in 2016 although 42% and 37% of therespondents expect the office and retail sub-sectors to experience yield compression due to higher vacancy rates and declining rental income. However, 34% of them expect the healthcare/ institutional, sub-sector to have better yields.
YIELD PERFORMANCE BY SUB-SECTOR
I N C R E A S E S T A G N A N T D E C R E A S E
31%
37%42%
16%
7%
RETAIL
HOTEL/LEISURE
LOGISTICS/INDUSTRIAL
HEALTHCARE/INSTITUTIONAL
OFFICE
54%
48%43%
70%
59%
RETAIL
HOTEL/LEISURE
LOGISTICS/INDUSTRIAL
HEALTHCARE/INSTITUTIONAL
OFFICE
15%
15%15%
14%
34%
RETAIL
HOTEL/LEISURE
LOGISTICS/INDUSTRIAL
HEALTHCARE/INSTITUTIONAL
OFFICE

REGION
KL CBD (Golden triangle) KL FRINGE / KLANG VALLEY JOHOR / ISKANDAR KOTA KINABALU PENANG
TOTAL AVERAGE
OFFICE
39%40%40%19%44%
36%
RETAIL
50%53%49%38%61%
50%
HOTEL/LEISURE
57%54%59%67%86%
65%
LOGISTICS/INDUSTRIAL
35%62%61%37%66%
52%
HEALTHCARE/INSTITUTIONAL
61%72%69%62%79%
69%
TOTALAVERAGE
49%56%55%45%67%
REGION FOR COMMERCIALPROPERTY INVESTMENT BY SUB-SECTOR IN 2016
ATTRACTIVENESS OF COMMERCIAL SUB-SECTORS IN DIFFERENT REGIONS
Kota Kinabalu
KL CBD (Golden Triangle)
Johor/Iskandar
KL Fringe/Klang Valley
Penang
Region for CommercialProperty Investment in 2016Penang has overtaken Kuala Lumpur / Klang Valley as the most attractive region for investment, garnering 67%of the overall responses. KL CBD (Golden Triangle) which was the top investment choice in 2015 has retreated in the ranking to fourth position with 49% of responses after KL Fringe/ Klang Valley (56%) and Johor/ Iskandar (55%).
The healthcare/ institutional segment is the most attractive sub-sector for investment, garnering 69% of responses, followed by the hotel/ leisure segment (65%), logistics/ industrial (52%) and retail (50%). The least attractive segment for investment is the office sub-sector with a poor 36% response.
Penang is currently the most attractive investment region for hotel/ leisure (86%) and healthcare/ institutional (79%) developments possibly due to George Town being inscribed as one of UNESCO’s World Heritage Sites and the popularity of the state for medical tourism.

Note: Rankings calculated using the number of responses as scoring
Favourable And Unfavourable Factors AffectingCommercial Real Estate Investment Sentiment In 2016The three favourable factors affecting commercial real estate investment sentiment in 2015 maintained their attractiveness in 2016. Apart from that, respondents are also positive on yield/ return and foreign direct investment flow this year.
Meanwhile, the country’s political environment continues to weigh heavily on business sentiment. Other negative factors include the unpopular GST; Malaysia’s slowing economy and weak KLSE performance, property cooling measures, ringgit depreciation as well as corporate/ public governance.
RANKING OF FAVOURABLE AND UNFAVOURABLE FACTORSON THE COMMERCIAL REAL ESTATE INVESTMENT SENTIMENT IN 2016
MalaysiaPoliticalScenario
Implementationof GST
MalaysiaEconomy
Performanceof KLSE
GovernmentCoolingMeasure
Weakening ofMalaysia Ringgit
Corporate / Public
Governance
Foreign DirectInvestmentin Malaysia
Yield andReturn
Availability of GoodStock / Investment
Opportunities
Availability ofEquity
Capital / Fund
Ongoing MRTand Infrastructure
FAV O U R A B L E
U N FAV O
U R A B L E